

Abstract
The frontostriatal circuit has been postulated to account for the core symptoms such as inattention in attention deficit/hyperactivity disorder (ADHD). This study investigated the white matter integrity of frontostriatal fiber tracts using diffusion spectrum imaging (DSI) tractography and its correlations with measures of multi‐dimensional aspects of inattention based on psychiatric interview and attention tasks in 25 children with ADHD and 25 matched typically developing (TD) children. All the subjects were assessed with comprehensive psychiatric interviews and the Conner's Continuous Performance Test (CCPT). DSI data were acquired on a 3‐Tesla MRI system. The frontostriatal fiber pathways were reconstructed by deterministic tractography, and generalized fractional anisotropy values were measured along individual targeted tracts to investigate alterations in microstructure integrity. Children with ADHD performed worse than TD children in the dimensions of focused attention, sustained attention, impulsivity, and vigilance of the CCPT, and showed impaired integrity in four bilateral frontostriatal tracts, namely the dorsolateral‐caudate, medial prefrontal‐caudate, orbitofrontal‐caudate, and ventrolateral‐caudate tracts, and in global white matter as well. The integrity of the left orbitofronto‐caudate tract was associated with the symptom of inattention in children with ADHD, compatible with the attention deficit and motivational dysfunction theories in ADHD. The integrity of the frontostriatal tracts was associated with the attention performance only in TD children, suggestive of possible recruitment of tracts other than the frontostriatal tracts implicated in attention deficits in children with ADHD. In conclusion, our results demonstrate the functional involvement of the frontostriatal circuit with respect to clinical symptoms and attention performance. Hum Brain Mapp 35:199–212, 2014. © 2012 Wiley Periodicals, Inc.
Keywords: frontostriatal circuit, attention task, ADHD, sustained attention, diffusion spectrum imaging tractography, cognitive impulsivity, vigilance
INTRODUCTION
Attention deficit/hyperactivity disorder (ADHD) is a frequently diagnosed neuropsychiatric disorder in childhood, with worldwide prevalence estimated as 5.3% [Polanczyk et al., 2007]. A USA national survey found a rate of 9.5% [CDC, 2010], and a prevalence study in Taiwan found one of 7.5% [Gau et al., 2005]. It is characterized by a developmentally inappropriate and pervasive expression of inattention, impulsivity, and hyperactivity that interferes with aspects of children's academic performance [Loe and Feldman, 2007], and their professional and social lives [Biederman et al., 2006; Brod et al., 2012]. It often persists into adulthood in a sizeable majority of afflicted children, affecting about 4% of the adult population [Kessler et al., 2006]. ADHD is not only a source of great morbidity across the lifespan but a burden to society as well [Leibson and Long, 2003]. Thus, determining the underlying neuropathology of ADHD is of great importance.
Deficits in neural circuits linking regions of the prefrontal cortex and the striatum have been associated with impairment of cognitive control, which has been postulated to account for the core symptoms such as inattention in ADHD [Casey et al., 2007b; Koechlin et al., 2003]. Previous structural and functional neuroimaging findings have also implicated frontostriatal network abnormalities as the likely cause of ADHD. Volumetric MRI studies have shown reduced prefrontal volumes in areas corresponding to the dorsolateral prefrontal cortex (DLPFC), ventrolateral prefrontal cortex (VLPFC), and orbitofrontal cortex (OFC) in children with ADHD [Castellanos et al., 2002; McAlonan et al., 2007; Overmeyer et al., 2001; Shaw et al., 2006; Wang et al., 2007]. Similarly, irregularity and asymmetry of caudate volume have been reported in ADHD [Castellanos et al., 1994, 2002; Filipek et al., 1997]. Functional imaging studies have consistently found reduced activation in the caudate nucleus [Booth et al., 2005; Durston et al., 2003; Lou et al., 1989; Rubia et al., 1999; Silk et al., 2005; Vaidya et al., 1998; Vance et al., 2007] and prefrontal regions [Cao et al., 2008; Konrad et al., 2006; Schweitzer et al., 2000; Sheridan et al., 2007; Stevens et al., 2007; Vaidya et al., 2005] in both children and adolescents with ADHD during performance of cognitive tasks such as inhibition, executive function, and some aspects of attention function.
Although structural and functional brain imaging studies have revealed specific regions of abnormalities and dysfunction in ADHD, the focus of recent studies has been shifted from regional brain abnormalities to dysfunctions in distributed network organization. Since ADHD may be a disorder caused by abnormal frontostriatal circuitry, it is especially crucial to know how the regions within this network are structurally connected. In recent years, diffusion tensor imaging (DTI) has emerged as a tool to examine the microstructural organization and integrity of the white matter. Fractional anisotropy (FA) is a normalized measure of diffusion anisotropy that provides information on the degree of myelination, fiber density, and axonal diameter [Johansen‐Berg and Behrens, 2009]. Therefore, DTI offers a better understanding of the white matter connections between brain regions than conventional structural MRI studies. However, the number of DTI studies investigating differences in anatomical connectivity between children with ADHD and healthy children is still relatively small. These studies have yielded inconsistent results regarding the frontostriatal circuit. Children with ADHD were reported to show decreased FA in the white matter underlying the right anterior limb of the internal capsule [Ashtari et al., 2005]. Casey et al. found a correlation of the FA in right prefrontal fiber tracts and the performance of a go/no‐go task in parent‐child dyads with ADHD [Casey et al., 2007b]. Reduced FA was also noted in the anterior corona radiata in children and adolescents with ADHD [Pavuluri et al., 2009]. Recently, a study on adults with ADHD showed reduced FA in bilateral orbitomedial prefrontal white matter, and that the FA in the right orbitofrontal fiber tracts was correlated with measures of impulsivity [Konrad et al., 2010]. On the contrary, no difference was found in the FA of striatum between children with ADHD and controls using a region of interest (ROI)‐based approach [van Ewijk et al., 2012; Silk et al., 2009a]. The same group reported children with ADHD showed greater FA in white matter regions underlying the inferior frontal cortex [Silk et al., 2009b].
These inconsistent data may result from several factors. First of all, these studies have generally included around 15–18 subjects per group and small sample sizes may contribute to the incongruity of the results. Second, although the locations of abnormality in these studies were all found to be in the prefrontal white matter, there was actually little overlap of these regions between studies. Third, exclusion criteria differ slightly between studies and different comorbidities may add confounding factors to the results. Most importantly, it may be partly explained by the fact that the frontostriatal fibers encounter several association fibers on their way from the striatum to the prefrontal cortex. The FA results are doomed to be highly variable, dependent on the location of the ROI in the white matter. An approach that potentially decreases the ROI‐dependent variability is to use tractography as a guide to define the frontostriatal fiber tracts, and FA values are sampled along the tract. However, this tract‐specific analysis requires accurate results of tractography, which are challenging to obtain especially for the frontostriatal circuit, because of substantial fiber crossing. Compared to DTI, high angular resolution diffusion imaging techniques such as diffusion spectrum imaging (DSI) yields a more accurate and detailed presentation of such complex neural pathways by acquisition of a large number of diffusion‐weighted images with different diffusion‐encoding gradients [Hess et al., 2006; Tournier et al., 2004; Tuch, 2004; Wedeen et al., 2005]. These advanced techniques provide flexibility that permits delineation of fiber pathways in areas where the fiber architecture is complex and multidirectional. Therefore, in this study we used tractography‐based analysis to investigate the microstructural integrity of frontostriatal tracts. The tractography reconstructed from the DSI data has been successfully demonstrated to resolve crossing fiber tracts, and the optimum strength and number of diffusion‐encoding gradients for DSI have been investigated on the 3‐Tesla clinical scanner [Kuo et al., 2008; Schmahmann et al., 2007; Wedeen et al., 2008].
Besides the technical limitations mentioned above, most previous studies were conducted without adequate matching between the ADHD and control groups, and none has used a whole‐spectrum and multi‐dimensional, rather than one‐dimensional, aspect of inattention in one single study to correlate with the frontostriatal tracts. In this study, we adopted the Continuous Performance Test (CPT) as the neuropsychological measure of attention. Originally, the CPT was developed by Rosvold in 1956 for measuring deficits in sustained attention in patients with cerebral damage. Since then, the CPT has become a popular research and diagnostic tool in studies of ADHD [Wasserstein, 2005]. In general, the CPT requires participants to respond to the presence or absence of a specific stimulus within a range of distracting stimuli continuously presented. The number of targets missed (omissions) is considered a measure of inattention. In contrast, responses to non‐target stimuli (commissions) reflect impulsivity [Corkum and Siegel, 1993]. Many studies have shown that children and adults with ADHD are impaired compared to normal controls on this type of test [Chiang and Gau, 2008a; Resnick, 2005].
Therefore, the aim of this study was to use tractography‐based analysis to compare a group of children with ADHD to a well‐matched control group on the microstructural integrity of the frontostriatal tracts. In addition, we investigated whether microstructural integrity is directly correlated with a wide range of aspects of inattention beyond sustained attention. We hypothesized that the microstructural integrity of the frontostriatal tracts may be involved in ADHD pathophysiology, and that impaired integrity may correlate with clinical and neuropsychological measures of inattention.
METHODS
Participants
We assessed 25 Taiwanese children with ADHD (mean age, 11.4 ± 2.1; 22 boys, 88%), as well as 25 typically developing (TD) children (mean age, 11.4 ± 2.7) who were matched to the ADHD children on age, sex, handedness, and full‐scale intelligence quotient (IQ) (see Table 1). The Wechsler Intelligence Scale for Children–3rd edition (WISC–III) was administrated to all 50 participants to ensure their Full‐scale IQ was greater than 80. All participants were right‐handed, as assessed with the Edinburgh Inventory [Oldfield, 1971]. Participants with ADHD were clinically diagnosed as ADHD according to the Diagnostic and Statistical Manual of Mental Disorders‐IV (DSM‐IV) diagnostic criteria, and were recruited consecutively from the child psychiatric clinic of National Taiwan University Hospital. Their current and lifetime ADHD and other psychiatric diagnoses were confirmed by using the Chinese Kiddie epidemiologic version of the Schedule for Affective Disorders and Schizophrenia (K‐SADS‐E) interview by the corresponding author [Gau and Soong, 1999; Gau et al., 2005]. All participants who had a clinical diagnosis of psychosis, mood disorders, learning disability, substance use, or autism spectrum disorders or a Full‐scale IQ score of less than 80 were excluded. The TD participants were enrolled in the present study only if there was no evidence of any medical or neurological illness, and if there was no history for any psychiatric DSM‐IV disorder. Moreover, the TD participants had no current or past history of psychotropic medication. All the participants received the same clinical, MRI, Chinese K‐SADS‐E, and neuropsychological assessments.
Table 1.
Demographics, IQ, and ADHD symptoms of children with ADHD and typically developing children
| Mean ± SD | TD (n = 25) | ADHD (n = 25) | t‐values | P values |
|---|---|---|---|---|
| Gender (male, %) | 22, 88% | 22, 88% | ||
| Age (range:8–17) | 11.40 ± 2.69 | 11.36 ± 2.14 | 0.20 | 0.840 |
| Full‐scale IQ | 111.12 ± 10.91 | 108.40 ± 12.69 | 1.29 | 0.209 |
| Performance IQ | 107.00 ± 12.37 | 105.88 ± 15.35 | 0.36 | 0.718 |
| Verbal IQ | 113.12 ± 10.88 | 109.84 ± 10.93 | 1.60 | 0.122 |
| DSM‐IV symptom counta | ||||
| Inattention(0‐9) (min, median, mode, max) | 0.40 ± 1.07 (0, 0, 0, 5) | 7.86 ± 1.41 (4, 8, 8, 9) | –21.06 | <0.001 |
| Hyperactivity(0–6) (min, median, mode, max) | 0.28 ± 0.60 (0, 0, 0, 3) | 3.60 ± 1.82 (0, 4, 6, 6) | –9.14 | <0.001 |
| Impulsivity(0–3) (min, median, mode, max) | 0.04 ± 0.20 (0, 0, 0, 1) | 2.04 ± 1.12 (0, 2, 3, 3) | –9.10 | <0.001 |
IQ, intelligence quotient; SD, standard deviation; TD, typically developing children; ADHD, attention‐deficit/hyperactivity disorder;
Based on psychiatric interview using the Kiddie‐SADS‐E interviews of current symptoms.
Of 25 children with ADHD, 16 children (64.0%) were diagnosed with DSM‐IV ADHD combined type, 8 (32.0%) with predominantly inattentive type, and 1 (4.0%) with predominantly hyperactive/impulsive type. Oppositional defiant disorder (52.0%) was the most prevalent comorbid psychiatric disorder, followed by a past history of specific phobia (20.0%) and conduct disorder (4.0%). Of them, 18 (72.0%) had been treated with methylphenidate for 21.66 weeks (SD = 31.76) and had not taken methylphenidate at least one week before MRI assessment.
Clinical and Neuropsychological Measures
Chinese version of the Kiddie epidemiologic version of the Schedule for Affective Disorders and Schizophrenia (K‐SADS‐E)
The K‐SADS‐E is a semi‐structured interview scale for the systematic assessment of both past and current episodes of mental disorders in children and adolescents. Development of the Chinese K‐SADS‐E was completed by the Child Psychiatry Research Group in Taiwan [Gau and Soong, 1999]. This included a two‐stage translation and modification of several items with psycholinguistic equivalents relevant to the Taiwanese culture, and further modification to meet the DSM‐IV diagnostic criteria [Gau et al., 2005]. Previous studies have shown that the Chinese K‐SADS‐E is a reliable and valid instrument to assess DSM‐IV child and adolescent psychiatric disorders [Gau et al., 2005] and sleep disorders [Gau et al., 2009], and it has been extensively used in a variety of studies on child and adolescent mental disorders [Chan et al., 2011; Chiang et al., 2010; Chiang and Gau, 2008b; Chien et al., 2011; Gau et al., 2009; Gau et al., 2007a; Gau et al., 2010; Gau and Shang, 2010; Hwang et al., 2010; Shang et al., 2011], and clinical trials [Chiang et al., 2010; Gau et al., 2007b; Gau et al., 2006] to make the psychiatric diagnoses of the participants in Taiwan. In this study, we used the symptom count of ADHD based on the ADHD supplement of the K‐SADS‐E interview for the correlations between ADHD symptoms and frontostriatal tracts.
The Conners' Continuous Performance Test (Conners' CPT II)
The Conners' CPT II (CCPT) is a 14‐minute, non‐X type test presented visually for individuals aged 6 and up. There are 360 total trials appearing on the computer screen, one at a time, each with a display time of 250 ms. The participant is requested to respond by pressing the space bar every time a letter (non‐target) appears on the computer screen, except when the letter X (target) appears. There were 6 blocks in the CCPT, with three sub‐blocks, each containing 20‐letter presentations. The sub‐blocks differed only in the Inter‐Stimulus Intervals (ISIs) as 1, 2, and 4 s. The sequence of different ISIs conditions is presented variably across blocks.
The CPT would provide summary measures included commission errors, omission errors, mean hit reaction time (RT) and RT standard error (SE), attentiveness(d'), response style(β), hit RT/ hit RT SE block change, hit RT/ hit RT SE ISI change. Commission errors (impulsivity) occurred when the participant responded an “X” stimulus. Omission errors (inattention) occurred when the participant failed to respond to a “non‐X” stimulus. Mean RT and RT SE were described as the mean response time and standard errors of the distribution of target response time of all the tasks. The d' and β were statistics in signal detection theory, d' is a measure of how well the individual discriminates between targets and non‐targets, response style (β) is a function of the ratio of hit target (hit rate) to hit nontarget (false alarm rate) stimuli and the participant's tendency to response based on receiver operating characteristic curve analysis. The hit RT/hit RT SE block change were the slopes generated by regression analyses use block as the independent variable and hit RT and SE of Hit RT as the dependent variables, the hit RT/hit RT SE ISI change were the slopes generated by regression analyses use ISI as the independent variable and hit RT and SE of Hit RT as the dependent variables.
For the interpretation of the CCPT results, CPT users were practically suggested according to the manual that measures related to inattention (sustained attention) included omissions, hit reaction time (RT) (slow) and its standard error (SE), variability, detectability (d'), hit RT changed by ISI, and hit SE changed by ISI; the measures of impulsivity were commissions, hit RT (fast), and perseverations; vigilance was captured by hit RT changed by block, and hit SE changed by block.
Furthermore, based on a recent comprehensive factor analysis by [Egeland and Kovalik‐Gran, 2010], the CCPT measures might be differentially grouped into four subprocesses: focused attention, sustained attention, hyperactivity‐impulsivity, and vigilance. Parameters related to (1) focused attention included RT variability, Hit RT SE, perseverations, and omissions; (2) impulsivity included commissions, Hit RT, and response style (β); (3) sustained attention included Hit RT changed by blocks and its SE changed by blocks, and changes in omission errors (i.e., more omission errors on the final third of the test); and (4) vigilance was captured by Hit RT changed by ISI, and Hit SE changed by ISI (Hit SE ISI Change) (i.e., slower and more variable reaction time to longer ISI changes) [Egeland and Kovalik‐Gran, 2010]. The definition of vigilance was mildly shifted from the attentional capacity to remain alert toward the impending stimulus information [Collings, 2003] to the capacity to maintain a constant speed in facing the challenge of longer ISI, and hence it was considered different from sustained attention [Egeland et al., 2009].
MRI Assessments
Image acquisition
Each of the 25 participants with ADHD and the 25 matched comparison participants were scanned on a 3‐Tesla MR imaging system using a 32‐channel head coil (Trio, Siemens, Erlangen, Germany). Both T2‐weighted structure images and DSI were acquired with the same slice orientation and the same scan range. The slice orientation was prescribed parallel to the line connecting the anterior commissure and posterior commissure, and the scan range went from the vertex to the inferior tip of the cerebellum. The T2‐weighted images were acquired using a turbo spin echo sequence, TR/TE = 5,920 ms/102 ms, matrix size = 256 × 256, spatial resolution = 0.98 mm × 0.98 mm, and slice thickness = 3.9 mm. DSI data were acquired using a twice‐refocused balanced echo diffusion echo planar imaging sequence to reduce the image distortion due to field gradient eddy currents [Reese et al., 2003]. The sequence parameters were TR/TE = 9,100 ms/142 ms, image matrix size = 128 × 128, spatial resolution = 2.5 mm × 2.5 mm, and slice thickness = 2.5 mm. A total of 102 diffusion‐encoding gradients with the maximum diffusion sensitivity bmax = 4,000 s mm−2 were sampled on the grid points in a half sphere in the 3D q‐space with |q|≤3.6 units. The scan time for T2‐weighted imaging was 2.5 min and that for DSI was ∼ 16 min.
DSI data analysis
Having acquired the DSI data of the half sphere in the q‐space, the data in the other half sphere were filled in based on the assumption that the diffusion signal S(q) is real and antipodal; i.e. S(q) = S(‐q). Zero‐filling was then performed in the eight corners outside the sphere. Fourier transform was performed on the filled S(q) to obtain the diffusion probability density function P(r) [Callaghan, 1991]. The orientation distribution function (ODF) was determined by computing the second moment of P(r) along each radial direction [Wedeen et al., 2005]. Here, the ODF was reconstructed onto 362 directions corresponding to the vertices of a six‐fold regularly tessellated dodecahedron projected onto the sphere. The orientations of individual crossing fibers were determined by decomposing the original ODF into several constituent ODF components, which were used for the reconstruction of the tracts (as described below) [Yeh, 2008]. An index called generalized fractional anisotropy (GFA) was computed for each voxel based on the shape of the original ODF. The formula of deriving the value of GFA is expressed as (the standard deviation of ODF) / (the root mean square of ODF) [Tuch, 2004]. Like fractional anisotropy (FA), GFA has been used to infer the microstructure integrity of the white matter fiber tracts [Takagi et al., 2009].
Tractography of frontostriatal tracts
Caudate nucleus receives projections from association areas of the cortex, and the projections are particularly dense from the prefrontal cortex projecting to the head of the caudate [Afifi and Bergman, 1998]. A topological correspondence of the projection from different prefrontal regions, i.e. DLPFC, VLPFC, OFC, and medial prefrontal cortex (MPFC) region, to different parts of the caudate nucleus was reported in rhesus monkey [Yeterian and Pandya, 1991]. Accordingly, we divided frontostriatal fiber tracts into four tract bundles corresponding to different cortical regions in each hemisphere. Five distinct regions were defined in each hemisphere and served as ROIs to select fiber tracts interconnecting specific cortical regions. We used MARINA software (Bender Institute of Neuroimaging, University of Giessen, Germany) to define five regions on the Montreal Neurobiology Institute (MNI) template, namely the caudate nucleus, DLPFC, VLPFC, OFC, MPFC regions. After the five regions were identified, we performed linear and non‐linear transformations from the image coordinates of individual participants' brains to the MNI coordinates. The coordinates of the cortical regions defined in the MNI template were then mapped onto individual participants' brains through the inverse transformation using the calculated deformation matrix. This entailed two steps. First, co‐registration between unattenuated DSI images (b0) to T2‐weighted images was estimated by a 3D affine transformational matrix. Second, spatial normalization between T2‐weighted images and the T2‐weighted template (ICBM‐152) in MNI space was performed by non‐linear transformation. All of the transformations from individual brains to the MNI template, including the 3D affine transform and the non‐linear normalization, were performed using the built‐in functions of SPM2 (Wellcome Department of Imaging Neuroscience, London, UK).
In this study, a streamline‐based fiber tracking algorithm was performed based on the resolved fiber vector fields provided by DSI. The voxels with GFA values higher than a given threshold of 0.1 were selected as the white matter regions and used as seed voxels for tractography over the whole brain. Consistent with previous reports, the GFA value derived from high angular resolution diffusion imaging (HARDI) data was mostly linear with, but lower than, the FA value derived from conventional DTI [Fritzsche et al., 2010; Gorczewski et al., 2009], and our threshold value of 0.1 for white matter masking was compatible with the value of 0.05 used by [Berman et al., 2008] based on HARDI data. For each seed voxel, the proceeding orientation for the next step was determined by the angular deviation between the primary orientation within the seed voxel and all the fiber orientations of its nearest voxels; the most coincident orientation with the minimum angular deviation was chosen. By moving the seed point with a proceeding length of 0.5 voxel for each step along the most coincident orientation, the new starting point was then obtained. Note that once all of the angle deviations were higher than a given angular threshold, in our case 60°, the tracking would stop. These procedures were repeated, and the fiber tracts over the whole brain were then obtained. In each hemisphere, four bundles of frontostriatal fiber tracts, namely the caudate nucleus ‐ DLPFC, caudate nucleus ‐ VLPFC, caudate nucleus ‐ MPFC, and caudate nucleus ‐ OFC, were determined by selecting the fibers that passed through the caudate nucleus and the four prefrontal regions, respectively (Fig. 1). In addition, exclusion ROIs were placed manually on the mid sagittal plane to exclude fibers from the corpus callosum and on the coronal slice at the tail of caudate nucleus to exclude fibers from the longitudinal fasciculi. Note that only fibers projecting from the four prefrontal regions to the caudate head were reconstructed; other parts of the frontostriatal tracts such as those connecting to putamen and to accumbens nucleus were not reconstructed in our study [Langen et al., 2012]. The degree of overlap of the reconstructed fiber tracts between participants was investigated and provided in the Supplement. GFA was used as the index of the integrity of white matter to be compared [Tuch, 2004]. GFA values corresponding to different fiber bundles were sampled according to the position coordinates of the tracts, and the mean GFA value for each fiber bundle was calculated. The tractography was reconstructed and visualized by using in‐house software (DSI Studio: http://dsi-studio.labsolver.org), which provided the reconstruction and real‐time interactive visualization of the tractography. The tract‐specific analysis of GFA was performed using an in‐house program developed in the Matlab (The Mathworks, Natick, MA, USA) based on a mean‐path analysis MPA algorithm [Chiang, 2007].
Figure 1.
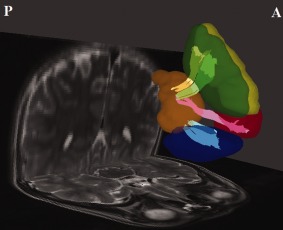
The regions of interest (ROIs) and reconstructed targeted tracts in the left hemisphere. The ROIs at dorsolateral prefrontal cortex (yellow), medial prefrontal cortex (green), orbitofrontal cortex (blue), ventrolateral prefrontal cortex (red) and caudate nucleus (orange) are shown. The dorsolateral prefrontal–caudate tract (yellow), the medial prefrontal–caudate tract (light green), the orbitofrontal–caudate tract (light blue), and the ventrolateral prefrontal–caudate tract (pink) are shown as well. A, anterior; P, posterior. [Color figure can be viewed in the online issue, which is available at http://wileyonlinelibrary.com.]
Procedure
This study is compliant with the Code of Ethics of the World Medical Association (Declaration of Helsinki) standards established by the Research Ethics Committee at the National Taiwan University Hospital, Taiwan, which approved this study prior to the study implementation. The purpose and detailed experimental procedures of this study were clearly explained to the participants and their parents, and written informed consent was obtained from both the participants and their parents. All the participants and their mothers were interviewed using the Chinese K‐SADS‐E for the child's DSM‐IV psychiatric diagnoses. The participants also underwent the CCPT test, followed by MRI assessment.
Statistical analyses
Data analysis was conducted by using SAS 9.1 version (SAS Institute, Cary, NC). The descriptive results were displayed as mean and standard deviation (SD) for the continuous variables. Because of the matched case‐control study design, we used paired t‐test to compare the mean scores of IQ, the number of inattention, hyperactivity and impulsivity symptoms assessed by the ADHD supplement of the Chinese K‐SADS‐E, the CCPT performance, and the GFA values of the bilateral four frontostriatal tracts between the ADHD and TD groups. The alpha value was preselected at the level of P < 0.05. The effect sizes (standardized difference in the mean scores between the ADHD and TD groups) were further computed using Cohen's d. We defined small, medium, and large effect sizes as Cohen's d 0.3–0.5, 0.5–0.8, and ≥ 0.8, respectively.
To control for inflation of Type I error in calculating multiple univariate correlations, multiple linear regression models with the backward elimination procedure were conducted to find the relationship between the measures of attention and 8 connectivity scores of the bilateral frontostriatal tracts (dorsolateral, medial prefrontal, orbitofrontal, and ventrolateral). The GFA values of the 8 frontostriatal tracts were entered as independent variables, and ADHD symptom counts based on the Chinese K‐SADS‐E interview and each of the performance scores on the CCPT tasks, as the dependent variables. We used backward elimination procedure to identify the fitted model containing the variables from 8 frontostriatal tracts which maintained significant effects on each of attention measures. The R 2 value provided a quantitative measure of how well the fitted model with frontostriatal tracts predicted the attention measure. That is, we calculated R 2 as the proportion of the variance of each attention measure that can be explained by some of frontostriatal tracts in the final fitted model.
RESULTS
Demographics
There were no significant differences in the distribution of gender, age, Full‐scale IQ, Performance IQ and Verbal IQ between the ADHD and TD groups (Table 1). As expected, we found significant group differences in DSM‐IV symptom counts based on the Chinese Kiddie‐SADS‐E interviews. The ADHD group exhibited significantly higher symptom counts in inattention, hyperactivity, and impulsivity (P < 0.001).
Group Differences in GFA
Compared with TD children, children with ADHD had significantly lower mean GFA values in the targeted frontostriatal fibers, namely the dorsolateral prefrontal‐caudate tract (left, P < 0.001; right, P = 0.004), medial prefrontal‐caudate tract (left, P < 0.001; right, P = 0.019), orbitofrontal‐caudate tract (left, P < 0.001; right, P < 0.001), and ventrolateral prefrontal‐caudate tract (left, P = 0.001; right, P < 0.001) in both hemispheres with large effect size (Table 2). We also analyzed the mean GFA of the total cerebral white matter and found significantly lower GFA values in children with ADHD (0.188 for ADHD and 0.196 for control, P = 0.004).
Table 2.
Comparisons of frontostriatal tracts between children with ADHD and typically developing children
| Mean ± SD | TD (n = 25) | ADHD (n = 25) | t‐values | P values | Cohen's d |
|---|---|---|---|---|---|
| Fronto‐striatal tracts | |||||
| Dorsolateral | |||||
| Left | 0.259 ± 0.031 | 0.222 ± 0.022 | 5.65 | .001 | 1.39 |
| Right | 0.242 ± 0.025 | 0.220 ± 0.022 | 3.16 | .004 | 0.89 |
| Medial prefrontal | |||||
| Left | 0.262 ± 0.034 | 0.224 ± 0.028 | 4.88 | .001 | 1.23 |
| Right | 0.244 ± 0.025 | 0.221 ± 0.017 | 3.78 | .019 | 1.07 |
| Orbitofrontal | |||||
| Left | 0.273 ± 0.036 | 0.225 ± 0.025 | 6.72 | .001 | 1.54 |
| Right | 0.269 ± 0.033 | 0.228 ± 0.025 | 4.89 | .001 | 1.38 |
| Ventrolateral | |||||
| Left | 0.228 ± 0.032 | 0.201 ± 0.031 | 3.67 | .001 | 0.88 |
| Right | 0.244 ± 0.030 | 0.212 ± 0.024 | 5.37 | .001 | 1.20 |
SD, standard deviation; ADHD, attention‐deficit/hyperactivity disorder; TD, typically developing.
Group Differences in Neuropsychological Data
Table 3 presents group comparisons of the four components of the CPT. In general, children with ADHD performed worse than TD children in the CPT across the four dimensions of attention performance. With regards to the measures related to focused attention, children with ADHD made more omission errors (P < 0.001), and had higher hit RT SE (P < 0.001), variability (P < 0.001), and a higher rate of perseverations (P < 0.001) compared with TD children, with a very large effect size (Cohen's d ranging from 1.0 to 1.50, Table 3).
Table 3.
Comparisons of performance of attention tasks between children with ADHD and typically developing children
| Continuous performance test (CPT) | TD (n = 25) | ADHD (n = 25) | t‐values | P values | Cohen's d |
|---|---|---|---|---|---|
| Mean ± SD [range] | Mean ± SD [range] | ||||
| Focused attention | |||||
| Omissions errors | 4.80 ± 6.43 [0.00–29.00] | 16.84 ± 9.99 [3.00–45.00] | −5.07 | <0.001 | −1.43 |
| Hit RT standard error | 7.12 ± 4.38 [2.98–23.37] | 14.59 ± 5.52 [6.20–29.61] | −5.31 | <0.001 | −1.50 |
| Hit RT Variability | 12.24 ± 12.89 [2.31–57.76] | 33.69 ± 16.66 [8.87–76.85] | −5.10 | <0.001 | −1.44 |
| Perseverations | 3.64 ± 5.95 [0.00–22.00] | 13.04 ± 11.95 [0.00–46.00] | −3.78 | <0.001 | −1.00 |
| Sustained attention | |||||
| Hit RT changed by block | 0.01 ± 0.02 [−0.03–0.04] | 0.03 ± 0.03 [−0.03–0.12] | −2.96 | 0.007 | −0.73 |
| Hit RT SE changed by block | 0.04 ± 0.06 [−0.08–0.14] | 0.12 ± 0.10 [−0.03–0.36] | −3.30 | 0.003 | −0.93 |
| Impulsivity | |||||
| Commissions errors | 19.68 ± 9.12 [6.00–36.00] | 24.40 ± 7.38 [9.00–33.00] | −2.11 | 0.045 | −0.57 |
| Hit RT | 367.92 ± 55.87 [257.05–489.76] | 441.17 ± 94.34 [314.92–610.94] | −3.34 | 0.003 | −0.94 |
| Response style | 1.15 ± 3.35 [0.00–17.14] | 0.80 ± 0.28 [0.27–1.58] | 0.51 | 0.615 | 0.14 |
| Vigilance | |||||
| Hit RT changed by ISI | 0.06 ± 0.03 [0.01–0.15] | 0.11 ± 0.05 [0.03–0.21] | −4.59 | <0.001 | −1.27 |
| Hit RT SE changed by ISI | 0.07 ± 0.14 [−0.10–0.47] | 0.22 ± 0.14 [−0.03–0.42] | −4.03 | <0.001 | −1.14 |
SD, standard deviation; ADHD, attention‐deficit/hyperactivity disorder; TD, typically developing; RT, reaction time; SE, standard errors; ISI, interstimulus intervals.
Regarding the measures related to sustained attention, children with ADHD had higher scores in hit RT changed by blocks (P = 0.007, Cohen's d = 0.73), and greater SE of hit RT changed by blocks (P = 0.003, Cohen's d = 0.93) than TD children. For impulsivity/hyperactivity dimension, children with ADHD made more commission errors (P = 0.045, Cohen's d = 0.57) and had longer hit RT (P = 0.003, Cohen's d = 0.94) than TD children. There was no difference in response style between the two groups. As to the measures related to vigilance, children with ADHD also had longer (P < 0.001) and more variable (P < 0.001) hit RT with increased ISIs than TD children.
Correlations of ADHD symptoms and GFA
The GFA of the left orbitofrontal tract was significantly negatively correlated with the symptom of inattention in the ADHD group (regression coefficient estimate, β = −30.29, P = 0.005, R 2 = 0.29) but not in TD children.
Correlations of CCPT measures and GFA
In general, a strong association between attention performance and the frontostriatal tracts was observed only in TD children but not in children with ADHD with one exception that in the ADHD group, the GFA value of the left ventrolateral tract explained 21% of variance of response style, a measure related to testing cognitive impulsivity (Table 4). However, there were no statistically significant correlations of the CCPT measures with global GFA in both ADHD (p values ranging 0.223–0.894) and TD (P values ranging 0.111–0.687) groups.
Table 4.
Final fitted model of prediction of bilateral four frontostriatal tracts to the performance of attention task for typically developing children (*children with ADHD)
| Focused attention | Sustained attention | ||||||||||||
|---|---|---|---|---|---|---|---|---|---|---|---|---|---|
| Omissions | Hit RT SE | Variability | Perseverations | Hit RT changed by block | Hit RT SE changed by block | ||||||||
| β | p | β | p | β | p | β | p | β | p | β | p | ||
| Dorsolateral | L | — | — | — | — | — | — | — | — | — | — | — | — |
| Dorsolateral | R | −118.98 | 0.033 | −97.74 | 0.010 | −294.10 | 0.009 | — | — | — | — | −1.73 | 0.001 |
| Medial prefrontal | L | — | — | — | — | — | — | — | — | — | — | — | — |
| Medial prefrontal | R | — | — | — | — | — | — | −124.13 | 0.022 | −0.63 | 0.007 | — | — |
| Orbitofrontal | L | 135.90 | 0.002 | 92.47 | 0.001 | 257.93 | 0.002 | 83.62 | 0.022 | 0.32 | 0.024 | 0.81 | 0.018 |
| R | — | — | — | — | — | — | — | — | −0.27 | 0.083 | — | — | |
| Ventrolateral | L | −75.87 | 0.052 | −49.73 | 0.054 | −163.82 | 0.032 | −73.63 | 0.050 | — | — | — | — |
| R | — | — | — | — | — | — | — | — | 0.45 | 0.015 | — | — | |
| F values | F (3,21) = 4.89 P = 0.010 | F (3,21) = 5.48 P = 0.006 | F (3,21) = 5.61 P = 0.006 | F (3,21) = 4.65 P = 0.012 | F (4,20) = 4.02 P = 0.015 | F (2,22) = 7.40 P = 0.004 | |||||||
| R‐square | R 2 = 0.41 | R 2 = 0.44 | R 2 = 0.45 | R 2 = 0.40 | R 2 = 0.45 | R 2 = 0.40 | |||||||
| Impulsivity | Vigilance | ||||||||||||
| Commissions | Response stylea | Hit RT ISI | |||||||||||
| β | P | β | p | β | p | ||||||||
| Dorsolateral | L | — | — | — | — | 0.62 | 0.005 | ||||||
| Dorsolateral | R | — | — | — | — | — | — | ||||||
| Medial prefrontal | L | — | — | — | — | — | — | ||||||
| Medial prefrontal | R | — | — | — | — | — | — | ||||||
| Orbitofrontal | L | — | — | — | — | — | — | ||||||
| R | — | — | — | — | — | — | |||||||
| Ventrolateral | L | −119.01 | 0.039 | −5.55 | 0.021 | — | — | ||||||
| R | — | — | — | — | −0.48 | 0.029 | |||||||
| F values | F (1,23)= 4.82 P = 0.039 | F (1,23) = 6.16 P = 0.021 | F (2.22) = 5.31 P = 0.013 | ||||||||||
| R‐square | R 2 = 0.17 | R2 = 0.21 | R 2 = 0.33 | ||||||||||
ADHD, attention‐deficit/hyperactivity disorder; L, left; R, right; β, estimate of regression coefficient; RT, reaction time; SE, standard errors; ISI, inter‐stimulus intervals.
Final fitted model for children with ADHD.
In summary, around 40–45% of the variability in focused attention, including omissions (F (3,21) = 4.89, P = 0.010, R 2 = 0.41), hit RT SE (F (3,21) = 5.48, P = 0.006, R 2 = 0.44), variability (F (3,21) = 5.61, P = 0.006, R 2 = 0.45) and perseverations (F (3,21) = 4.65, P = 0.012, R 2 = 0.40) that were explained by the integrity, i.e., GFA values of the right dorsolateral prefrontal tract (not preservation), right medial prefrontal (perseveration only), left orbitofrontal tract, and left ventrolateral tract in the TD group. In the dimension of sustained attention, 45% of variability in Hit RT changed by blocks was explained by the right medial prefrontal tract, left orbitofrontal tract, and right ventrolateral prefrontal tract (F (4,20) = 4.02, P = 0.015). Hit RT variability (SE) changed by block was correlated with the right dorsolateral prefrontal tract and left orbitofrontal tract (F (2,22) = 7.40, P = 0.004, R 2 = 0.40). The integrity of the left ventrolateral prefrontal tract accounted for 17% of variation of commission errors, a measure related to cognitive impulsivity in the TD group (F(1,23) = 4.82, P = 0.039). As for vigilance, 33% of variance of Hit RT changed by ISIs was explained by the integrity of the left dorsolateral prefrontal tract and right ventrolateral prefrontal tract in the TD group (F(2,22) = 5.31, P = 0.033).
We also included sex as a covariate in the models of four attention dimensions assessed by the CCPT and found similar results with the following exception. The significance of the associations of the integrity of the left ventrolateral prefrontal tract with commission errors (P = 0.039, Table 4) disappeared in the TD group (P = 0.086) and with the response style, another measure related to testing cognitive impulsivity (P = 0.021, Table 4) became marginally significant (P = 0.057) in the ADHD group.
DISCUSSION
To our knowledge, our findings, which are based on DSI tractography analysis in a strictly matched case‐control sample, provide the first data of the correlations between the white matter tract integrity of the four clearly delineated frontostriatral fiber tracts bilaterally and multiple dimensions of attention not only in children with ADHD but also in TD children. Our results demonstrate the involvement of tract integrity of the frontostriatal circuit in attention performance and inattention symptoms of ADHD. Reduced GFA values were found in bilateral frontostriatal fiber tracts in children with ADHD as compared with individually matched TD children, implying impaired microstructural integrity of the frontostriatal circuit in ADHD [Castellanos and Proal, 2012]. Our findings strongly support many previous studies reporting that children with ADHD had higher symptom counts and performed worse than children without ADHD in the CPT [Chiang and Gau, 2008b]. We also found that the GFA of the left orbitofrontal‐caudate tract was correlated with the symptom of inattention in children with ADHD. Furthermore, a strong association between attention performance and the frontostriatal tracts was observed in TD children but not in children with ADHD.
Decreased GFA of Frontostriatal Tracts in ADHD Children
Impairment of the microstructure integrity of frontostriatal tracts in children with ADHD is consistent with most of the previous DTI investigations that have reported abnormalities in prefrontal circuits in pediatric ADHD [Ashtari et al., 2005; Casey et al., 2007a; Konrad et al., 2010; Pavuluri et al., 2009; Qiu et al., 2011]. However, a small number of studies showed increased FA of the frontostriatal white matter in children with ADHD [Davenport et al., 2010; Silk et al., 2009b]. The so‐called “frontostriatal fibers” in previous studies have included a large area of white matter, such as the anterior limb of the internal capsule [Ashtari et al., 2005], anterior corona radiata [Pavuluri et al., 2009], orbitomedial prefrontal white matter [Konrad et al., 2010], inferior fronto‐occipital fasciculus [Konrad et al., 2010], and callosal and prefrontal‐cingulate white matter [Silk et al., 2009b]. Thus, these inconsistent findings may partly result from the relatively long distance the frontostriatal tract traverses and the large white matter volume it encompasses. Compared to voxel‐based analysis, which is adopted by many studies, tractography‐based analysis allows us to calculate the mean GFA of the whole fiber tract rather than the mean FA of an ROI or several voxels. The results, therefore, are more representative of the white matter integrity of the whole tract. In addition, it is worthy of note that we used a hypothesis‐driven approach instead of a whole‐brain comparison. At first, we formulated the hypothesis of impairment of frontostriatal circuitry based on previous studies [Castellanos et al., 2006]. Then ROIs were placed on four prefrontal regions and the caudate nucleus to track the frontostriatal tracts. The GFA sampled along these tracts was shown to be reduced in the ADHD children. These results, coming from a clear hypothesis, are robust and convincing in support of the frontostriatal theory.
Correlation Between Orbitofrontal‐Caudate Tract and Inattention Symptoms in Children With ADHD
Our novel finding of the association between GFA of the left orbitofrontal‐caudate tract and the symptom counts of inattention in children with ADHD lend evidence to support that the OFC plays a vital role in the pathophysiology of ADHD [Cubillo et al., 2011]. Significant reduction of the volume of the left OFC was noted in children with ADHD [Hesslinger et al., 2002]. A large study of 357 healthy children showed that higher “Attention Problems” scores were associated with thinner bilateral OFC [Ducharme et al., 2012]. In addition, increased functional connectivity between the ventral striatum, caudate, and OFC was demonstrated in ADHD children [Tomasi and Volkow, 2011]. This could be explained by the decreased dopaminergic neurons/activity in these brain regions [Volkow et al., 2011]. Dopamine works by reducing spontaneous background activity [Rolls et al., 1984], and therefore the decreased dopaminergic neurons/activity in ADHD might indicate lower structural connectivity, higher spontaneous activity, and increased functional connectivity. Furthermore, the orbitofrontal‐striatal connection comprises part of the reward processing circuit. Our finding of impaired orbitofrontal‐striatal white matter integrity in ADHD adds some evidence to support the motivational dysfunction model of ADHD, in which suboptimal reward processing is implicated [Sonuga‐Barke, 2005]. In addition, inattention symptoms are highly correlated with motivation problems in individuals with ADHD [Volkow et al., 2011]. However, without assessment of motivation in this study, we are not able to explore whether observed motivation dysfunction in ADHD can be explained by disturbed orbitofrontal‐striatal tract integrity. In contrast, among TD children, we did not find a correlation between GFA of the frontostriatal tracts and clinical symptom counts, probably due to the minimal variance of clinical scores in this group.
Correlation Between Frontostriatal Tracts and Attention in TD Children But Not in Children With ADHD
In this paper, we were able to demonstrate a strong association of the frontostriatal tracts with the performance of attention tasks of the CCPT in TD children but not in the ADHD group. Our result is compatible with a recent tractography‐based study by de Zeeuw et al. who found a negative relationship of frontostriatal FA with teacher‐rated attention problems in controls but not children with ADHD [de Zeeuw et al., 2011]. The strong association between attention performance, especially in sustained attention, focused attention, and vigilance, and the frontostriatal tracts in TD children implies the involvement of the frontostriatal circuit in the attention deficits related to ADHD. The absence of association in children with ADHD may arise from multiple factors. One may suspect that it might be due to the ceiling or floor effect in the CPT scores. Close inspection of our data, however, did not find such effect (Table 3). Another possibility is that additional neuronal networks might be recruited as compensation to accomplish such demanding tasks [Castellanos and Proal, 2012]. In a longitudinal MRI study measuring cortical thickness, normalization of the right parietal cortex in ADHD children with a better outcome was noted, supporting a compensatory mechanism in the posterior attentional network [Shaw et al., 2006]. Children with ADHD were shown to compensatorily use more posterior and diffusive brain regions during a Go/No‐go task [Tomasi and Volkow, 2011]. In fact, a retrospective analysis of our data reveals a global reduction of GFA in ADHD children, implying that the structural under‐connectivity is widespread [van Ewijk et al., 2012]. In view of the global underconnectivity in ADHD, other tracts besides the frontostriatal tracts might be recruited and more central to support the demanding cognitive function such as attention, which may be implicated in the deficient attention in ADHD. Since this study only focused on the frontostriatal tracts, future tractography studies looking into other circuits are needed to clarify the specific mechanism of dysfunction of the frontostriatal circuit and compensation in ADHD.
Correlation Between Frontostriatal Tracts and Cognitive Impulsivity
In contrast to a strong association of the integrity of several frontostriatal fibers with attention measures like vigilance, and focused and sustained attention in the TD children, its association with cognitive impulsivity was not strongly evident in this study. Only around 20% of cognitive impulsivity can be explained by the left ventrolateral fiber pathways in both TD and ADHD groups and the statistical significance diminished to a borderline significant level after considering the sex effect. Therefore, our finding only lend weak evidence to support that the frontostriatal systems may be essential for cognitive control based on convergent data from morphometry [Shaw et al., 2011], DTI [Casey et al., 2007a; Liston et al., 2006], and functional MRI studies [Konrad et al., 2006]. These studies showed the associations between hyperactivity/impulsivity symptom and a slower rate of cortical thinning in prefrontal cortical regions in healthy children [Shaw et al., 2011], between maturation of frontostriatal connectivity and an increase in efficiency of go/no‐go task performance in TD participants [Liston et al., 2006], between prefrontal fiber tracts and cognitive impulsivity assessed by go/no‐go test in parent–child dyads with ADHD [Casey et al., 2007a] and between frontostriatal hypoactivation and abnormal interference control [Konrad et al., 2006]. However, our findings of the specific fiber pathway, namely, the left ventrolateral‐caudate tract, are not consistent with previous functional MRI findings of association of inhibitory control and error detection with such brain regions as OFC [Elliott and Deakin, 2005; Rubia et al., 2010].
Methodological Consideration
This study has a few limitations. First, the sample size was generally small in both groups, and therefore the statistical power of the reported results is limited. Second, we did not restrict the different subtypes of ADHD and lacked sufficient power to analyze subgroup differences. Further analyses of subtype differences may be informative. Third, although we commonly attribute an increase in GFA to an increase in fiber density, axonal diameter, and greater myelination of fibers, it is still not clear at a cellular level what the changes in GFA represent. Four, a lack of significant correlation between attention symptoms and frontostriatal white matter integrity in TD children may be explained by low to zero variance in the TD group because of using the K‐SADS‐E diagnostic interview to measure the symptom counts rather than a scale capturing the variance in everyday attention in the normal population. Finally, some of the ADHD subjects included in this study had been treated with methylphenidate. Castellanos et al. [Castellanos et al., 2002] reported that the decrease of white matter volume in ADHD compared to controls was less in medicated children. To date, no study has directly looked into the effect of stimulant medication on the microstructure of white matter fibers. Therefore, this issue falls beyond the scope of this study and needs further elucidation.
However, this study has several methodological strengths superior to those of similar previous studies: the careful and strict matching procedure of each child with ADHD with the same age, sex, handedness, and IQ; standardized diagnosis procedures in addition to clinical assessments for children with ADHD and TD children as well; the employment tractography‐based analysis to investigate the white matter tract integrity of four bilateral frontostriatal tracts separately, and inclusion of multi‐dimensional assessment of attention performance.
CONCLUSIONS
With tractography‐based analysis, we are able to reconstruct the four bilateral major fiber pathways of the frontostriatal circuit and demonstrate their functional significance with respect to clinical symptoms and attention performance. Our results show that children with ADHD have impaired microstructural integrity of frontostriatal tracts, supporting the frontostriatal deficits hypothesis underlying the pathophysiology of ADHD. In addition, the integrity of orbitofronto‐caudate tracts is associated with symptom of inattention in ADHD children, implying the involvement of motivational dysfunction in ADHD. Finally, frontostriatal tracts are associated with multi‐dimensional aspects of attention performance only in TD children, suggesting possible recruitment of other tracts besides the frontostriatal circuit in attention performance in ADHD.
REFERENCES
- Afifi AK, Bergman RA (1998): Functional Neuroanatomy: Text and Atlas.New York:McGraw‐Hill, Health Professions Division. [Google Scholar]
- Ashtari M, Kumra S, Bhaskar SL, Clarke T, Thaden E, Cervellione KL, Rhinewine J, Kane JM, Adesman A, Milanaik R, Maytal J, Diamond A, Szeszko P, Ardekani BA (2005): Attention‐deficit/hyperactivity disorder: A preliminary diffusion tensor imaging study. Biol Psychiatry 57:448–455. [DOI] [PubMed] [Google Scholar]
- Berman JI, Chung S, Mukherjee P, Hess CP, Han ET, Henry RG (2008): Probabilistic streamline q‐ball tractography using the residual bootstrap. Neuroimage 39:215–222. [DOI] [PubMed] [Google Scholar]
- Biederman J, Faraone SV, Spencer TJ, Mick E, Monuteaux MC, Aleardi M (2006): Functional impairments in adults with self‐reports of diagnosed ADHD: A controlled study of 1001 adults in the community. J Clin Psychiatry 67:524–540. [DOI] [PubMed] [Google Scholar]
- Booth JR, Burman DD, Meyer JR, Lei Z, Trommer BL, Davenport ND, Li W, Parrish TB, Gitelman DR, Mesulam MM (2005): Larger deficits in brain networks for response inhibition than for visual selective attention in attention deficit hyperactivity disorder (ADHD). J Child Psychol Psychiatry 46:94–111. [DOI] [PubMed] [Google Scholar]
- Brod M, Schmitt E, Goodwin M, Hodgkins P, Niebler G (2012): ADHD burden of illness in older adults: A life course perspective. Qual Life Res 21:795–799. [DOI] [PubMed] [Google Scholar]
- Callaghan P (1991): Principles of Nuclear Magnetic Resonance Microscopy.Oxford:Clarendon Press. [Google Scholar]
- Cao Q, Zang Y, Zhu C, Cao X, Sun L, Zhou X, Wang Y (2008): Alerting deficits in children with attention deficit/hyperactivity disorder: Event‐related fMRI evidence. Brain Res 1219:159–168. [DOI] [PubMed] [Google Scholar]
- Casey BJ, Epstein JN, Buhle J, Liston C, Davidson MC, Tonev ST, Spicer J, Niogi S, Millner AJ, Reiss A, Garrett A, Hinshaw SP, Greenhill LL, Shafritz KM, Vitolo A, Kotler LA, Jarrett MA, Glover G (2007a): Frontostriatal connectivity and its role in cognitive control in parent‐child dyads with ADHD. Am J Psychiatry 164:1729–1736. [DOI] [PubMed] [Google Scholar]
- Casey BJ, Nigg JT, Durston S (2007b): New potential leads in the biology and treatment of attention deficit‐hyperactivity disorder. Curr Opin Neurol 20:119–124. [DOI] [PubMed] [Google Scholar]
- Castellanos FX, Giedd JN, Eckburg P, Marsh WL, Vaituzis AC, Kaysen D, Hamburger SD, Rapoport JL (1994): Quantitative morphology of the caudate nucleus in attention deficit hyperactivity disorder. Am J Psychiatry 151:1791–1796. [DOI] [PubMed] [Google Scholar]
- Castellanos FX, Lee PP, Sharp W, Jeffries NO, Greenstein DK, Clasen LS, Blumenthal JD, James RS, Ebens CL, Walter JM, Zijdenbos A, Evans AC, Giedd JN, Rapoport JL (2002): Developmental trajectories of brain volume abnormalities in children and adolescents with attention‐deficit/hyperactivity disorder. JAMA 288:1740–1748. [DOI] [PubMed] [Google Scholar]
- Castellanos FX, Proal E (2012): Large‐scale brain systems in ADHD: Beyond the prefrontal‐striatal model. Trends Cogn Sci 16:17–26. [DOI] [PMC free article] [PubMed] [Google Scholar]
- Castellanos FX, Sonuga‐Barke EJ, Milham MP, Tannock R (2006): Characterizing cognition in ADHD: Beyond executive dysfunction. Trends Cogn Sci 10:117–123. [DOI] [PubMed] [Google Scholar]
- CDC, C.f.D.C.a.P. (2010): Increasing prevalence of parent‐reported attention‐deficit/hyperactivity disorder among children—United States, 2003 and 2007. MMWR Morb Mortal Wkly Rep,59:1439–1443. [PubMed] [Google Scholar]
- Chan HY, Gau SS, Chang CJ (2011): Dr Chan and colleagues reply. J Clin Psychiatry 72:1016–1017.21824463 [Google Scholar]
- Chiang HL, Gau SS, Ni HC, Chiu YN, Shang CY, Wu YY, Lin LY, Tai YM, Soong WT (2010): Association between symptoms and subtypes of attention‐deficit hyperactivity disorder and sleep problems/disorders. J Sleep Res. [DOI] [PubMed] [Google Scholar]
- Chiang M, Gau SS (2008a): Validation of attention‐deficit‐hyperactivity disorder subtypes among Taiwanese children using neuropsychological functioning. Aust NZ J Psychiatry 42:526–535. [DOI] [PubMed] [Google Scholar]
- Chiang MC, Gau SS (2008b): Validation of attention‐deficit‐hyperactivity disorder subtypes among Taiwanese children using neuropsychological functioning. Aust NZ J Psychiatry 42:526–535. [DOI] [PubMed] [Google Scholar]
- Chiang W, Wang H, Huang S, Yeh F, Tseng WI (2007): Tract‐Specific Analysis of Human White Matter: Mean‐path Based Method. In: Kenting, Taiwan.
- Chien YL, Wu YY, Chen CH, Gau SS, Huang YS, Chien WH, Hu FC, Chao YL (2011): Association of HLA‐DRB1 alleles and neuropsychological function in autism. Psychiatr Genet. [DOI] [PubMed] [Google Scholar]
- Collings RD (2003): Differences between ADHD inattentive and combined types on the CPT. J Psychopathol Behav Assessment 25:177–189. [Google Scholar]
- Corkum PV, Siegel LS (1993): Is the Continuous Performance Task a valuable research tool for use with children with Attention‐Deficit‐Hyperactivity Disorder? J Child Psychol Psychiatry 34:1217–1239. [DOI] [PubMed] [Google Scholar]
- Cubillo A, Halari R, Smith A, Taylor E, Rubia K (2011): A review of fronto‐striatal and fronto‐cortical brain abnormalities in children and adults with Attention Deficit Hyperactivity Disorder (ADHD) and new evidence for dysfunction in adults with ADHD during motivation and attention. Cortex. [DOI] [PubMed] [Google Scholar]
- Davenport ND, Karatekin C, White T, Lim KO (2010)Differential fractional anisotropy abnormalities in adolescents with ADHD or schizophrenia. Psychiatry Res 181:193–198. [DOI] [PMC free article] [PubMed] [Google Scholar]
- de Zeeuw P, Mandl RC, Hulshoff Pol HE, van Engeland H, Durston S (2011): Decreased frontostriatal microstructural organization in attention deficit/hyperactivity disorder. Hum Brain Mapp. [DOI] [PMC free article] [PubMed] [Google Scholar]
- Ducharme S, Hudziak JJ, Botteron KN, Albaugh MD, Nguyen TV, Karama S, Evans AC (2012): Decreased regional cortical thickness and thinning rate are associated with inattention symptoms in healthy children. J Am Acad Child Adolesc Psychiatry 51:18‐27e2. [DOI] [PMC free article] [PubMed] [Google Scholar]
- Durston S, Tottenham NT, Thomas KM, Davidson MC, Eigsti IM, Yang Y, Ulug AM, Casey BJ (2003): Differential patterns of striatal activation in young children with and without ADHD. Biol Psychiatry 53:871–878. [DOI] [PubMed] [Google Scholar]
- Egeland J, Johansen SN, Ueland T (2009): Differentiating between ADHD sub‐types on CCPT measures of sustained attention and vigilance. Scandinavian J Psychol 50:347–354. [DOI] [PubMed] [Google Scholar]
- Egeland J, Kovalik‐Gran I (2010): Validity of the factor structure of Conners' CPT. J Attention Disorders 13:347–357. [DOI] [PubMed] [Google Scholar]
- Elliott R, Deakin B (2005)Role of the orbitofrontal cortex in reinforcement processing and inhibitory control: Evidence from functional magnetic resonance imaging studies in healthy human subjects. Int Rev Neurobiol 65:89–116. [DOI] [PubMed] [Google Scholar]
- Filipek PA, Semrud‐Clikeman M, Steingard RJ, Renshaw PF, Kennedy DN, Biederman J (1997): Volumetric MRI analysis comparing subjects having attention‐deficit hyperactivity disorder with normal controls. Neurology 48:589–601. [DOI] [PubMed] [Google Scholar]
- Fritzsche, K.H. , Laun, F.B. , Meinzer, H.P. , Stieltjes, B. (2010)Opportunities and pitfalls in the quantification of fiber integrity: What can we gain from Q‐ball imaging? Neuroimage 51:242–251. [DOI] [PubMed] [Google Scholar]
- Gau SF, Soong WT (1999): Psychiatric comorbidity of adolescents with sleep terrors or sleepwalking: A case‐control study. Aust NZ J Psychiatry 33:734–739. [DOI] [PubMed] [Google Scholar]
- Gau SS, Chiu CD, Shang CY, Cheng AT, Soong WT (2009): Executive function in adolescence among children with attention‐deficit/hyperactivity disorder in Taiwan. J Dev Behav Pediatr 30:525–534. [DOI] [PubMed] [Google Scholar]
- Gau SS, Chong MY, Chen TH, Cheng AT (2005): A 3‐year panel study of mental disorders among adolescents in Taiwan. Am J Psychiatry 162:1344–1350. [DOI] [PubMed] [Google Scholar]
- Gau SS, Chong MY, Yang P, Yen CF, Liang KY, Cheng AT (2007a): Psychiatric and psychosocial predictors of substance use disorders among adolescents: Longitudinal study. Br J Psychiatry 190:42–48. [DOI] [PubMed] [Google Scholar]
- Gau SS, Huang YS, Soong WT, Chou MC, Chou WJ, Shang CY, Tseng WL, Allen AJ, Lee P (2007b): A randomized, double‐blind, placebo‐controlled clinical trial on once‐daily atomoxetine hydrochloride in Taiwanese children and adolescents with attention‐deficit/hyperactivity disorder. J Child Adolesc Psychopharmacol 17:447–460. [DOI] [PubMed] [Google Scholar]
- Gau SS, Ni HC, Shang CY, Soong WT, Wu YY, Lin LY, Chiu YN (2010): Psychiatric comorbidity among children and adolescents with and without persistent attention‐deficit hyperactivity disorder. Aust NZ J Psychiatry 44:135–143. [DOI] [PubMed] [Google Scholar]
- Gau SS, Shang CY (2010): Executive functions as endophenotypes in ADHD: Evidence from the Cambridge Neuropsychological Test Battery (CANTAB). J Child Psychol Psychiatry 51:838–849. [DOI] [PubMed] [Google Scholar]
- Gau SS, Shen HY, Soong WT, Gau CS (2006): An open‐label, randomized, active‐controlled equivalent trial of osmotic release oral system methylphenidate in children with attention‐deficit/hyperactivity disorder in Taiwan. J Child Adolesc Psychopharmacol 16:441–455. [DOI] [PubMed] [Google Scholar]
- Gorczewski K, Mang S, Klose U (2009): Reproducibility and consistency of evaluation techniques for HARDI data. MAGMA 22:63–70. [DOI] [PubMed] [Google Scholar]
- Hess CP, Mukherjee P, Han ET, Xu D, Vigneron DB (2006): Q‐ball reconstruction of multimodal fiber orientations using the spherical harmonic basis. Magn Reson Med 56:104–117. [DOI] [PubMed] [Google Scholar]
- Hesslinger B, Tebartz van Elst L, Thiel T, Haegele K, Hennig J, Ebert D (2002): Frontoorbital volume reductions in adult patients with attention deficit hyperactivity disorder. Neurosci Lett 328:319–321. [DOI] [PubMed] [Google Scholar]
- Hwang SL, Gau SS, Hsu WY, Wu YY (2010): Deficits in interval timing measured by the dual‐task paradigm among children and adolescents with attention‐deficit/hyperactivity disorder. J Child Psychol Psychiatry 51:223–232. [DOI] [PubMed] [Google Scholar]
- Johansen‐Berg H, Behrens TEJ (2009): Diffusion MRI: From Quantitative Measurement to In vivo Neuroanatomy.Academic Press; London, UK and Burlington, MA, USA. [Google Scholar]
- Kessler RC, Adler L, Barkley R, Biederman J, Conners CK, Demler O, Faraone SV, Greenhill LL, Howes MJ, Secnik K, Spencer T, Ustun TB, Walters EE, Zaslavsky AM (2006): The prevalence and correlates of adult ADHD in the United States: Results from the National Comorbidity Survey Replication. Am J Psychiatry 163:716–723. [DOI] [PMC free article] [PubMed] [Google Scholar]
- Koechlin E, Ody C, Kouneiher F (2003): The architecture of cognitive control in the human prefrontal cortex. Science 302:1181–1185. [DOI] [PubMed] [Google Scholar]
- Konrad A, Dielentheis TF, El Masri D, Bayerl M, Fehr C, Gesierich T, Vucurevic G, Stoeter P, Winterer G (2010): Disturbed structural connectivity is related to inattention and impulsivity in adult attention deficit hyperactivity disorder. Eur J Neurosci 31:912–919. [DOI] [PubMed] [Google Scholar]
- Konrad K, Neufang S, Hanisch C, Fink GR, Herpertz‐Dahlmann B (2006): Dysfunctional attentional networks in children with attention deficit/hyperactivity disorder: Evidence from an event‐related functional magnetic resonance imaging study. Biol Psychiatry 59:643–651. [DOI] [PubMed] [Google Scholar]
- Kuo LW, Chen JH, Wedeen VJ, Tseng WY (2008): Optimization of diffusion spectrum imaging and q‐ball imaging on clinical MRI system. Neuroimage 41:7–18. [DOI] [PubMed] [Google Scholar]
- Langen M, Leemans A, Johnston P, Ecker C, Daly E, Murphy CM, Dell'acqua F, Durston S, Murphy DG (2012): Fronto‐striatal circuitry and inhibitory control in autism: Findings from diffusion tensor imaging tractography. Cortex 48:183–193. [DOI] [PubMed] [Google Scholar]
- Leibson CL, Long KH (2003): Economic implications of attention‐deficit hyperactivity disorder for healthcare systems. Pharmacoeconomics 21:1239–1262. [DOI] [PubMed] [Google Scholar]
- Liston C, Watts R, Tottenham N, Davidson MC, Niogi S, Ulug AM, Casey BJ (2006): Frontostriatal microstructure modulates efficient recruitment of cognitive control. Cereb Cortex 16:553–560. [DOI] [PubMed] [Google Scholar]
- Loe IM, Feldman HM (2007): Academic and educational outcomes of children with ADHD. J Pediatr Psychol 32:643–654. [DOI] [PubMed] [Google Scholar]
- Lou HC, Henriksen L, Bruhn P, Borner H, Nielsen JB (1989): Striatal dysfunction in attention deficit and hyperkinetic disorder. Arch Neurol 46:48–52. [DOI] [PubMed] [Google Scholar]
- McAlonan GM, Cheung V, Cheung C, Chua SE, Murphy DG, Suckling J, Tai KS, Yip LK, Leung P, Ho TP (2007): Mapping brain structure in attention deficit‐hyperactivity disorder: A voxel‐based MRI study of regional grey and white matter volume. Psychiatry Res 154:171–180. [DOI] [PubMed] [Google Scholar]
- Oldfield RC (1971): The assessment and analysis of handedness: The Edinburgh inventory. Neuropsychologia 9:97–113. [DOI] [PubMed] [Google Scholar]
- Overmeyer S, Bullmore ET, Suckling J, Simmons A, Williams SC, Santosh PJ, Taylor E (2001): Distributed grey and white matter deficits in hyperkinetic disorder: MRI evidence for anatomical abnormality in an attentional network. Psychol Med 31:1425–1435. [DOI] [PubMed] [Google Scholar]
- Pavuluri MN, Yang S, Kamineni K, Passarotti AM, Srinivasan G, Harral EM, Sweeney JA, Zhou XJ (2009): Diffusion tensor imaging study of white matter fiber tracts in pediatric bipolar disorder and attention‐deficit/hyperactivity disorder. Biol Psychiatry 65:586–593. [DOI] [PMC free article] [PubMed] [Google Scholar]
- Polanczyk G, de Lima MS, Horta BL, Biederman J, Rohde LA (2007): The worldwide prevalence of ADHD: A systematic review and metaregression analysis. Am J Psychiatry 164:942–948. [DOI] [PubMed] [Google Scholar]
- Qiu MG, Ye Z, Li QY, Liu GJ, Xie B, Wang J (2011): Changes of brain structure and function in ADHD children. Brain Topogr 24:243–252. [DOI] [PubMed] [Google Scholar]
- Reese TG, Heid O, Weisskoff RM, Wedeen VJ (2003): Reduction of eddy‐current‐induced distortion in diffusion MRI using a twice‐refocused spin echo. Magn Reson Med 49:177–182. [DOI] [PubMed] [Google Scholar]
- Resnick RJ (2005): Attention deficit hyperactivity disorder in teens and adults: They don't all outgrow it. J Clin Psychol 61:529–533. [DOI] [PubMed] [Google Scholar]
- Rolls ET, Thorpe SJ, Boytim M, Szabo I, Perrett DI (1984): Responses of striatal neurons in the behaving monkey. III. Effects of iontophoretically applied dopamine on normal responsiveness. Neuroscience 12:1201–1212. [DOI] [PubMed] [Google Scholar]
- Rubia K, Cubillo A, Smith AB, Woolley J, Heyman I, Brammer MJ (2010): Disorder‐specific dysfunction in right inferior prefrontal cortex during two inhibition tasks in boys with attention‐deficit hyperactivity disorder compared to boys with obsessive‐compulsive disorder. Hum Brain Mapp 31:287–299. [DOI] [PMC free article] [PubMed] [Google Scholar]
- Rubia K, Overmeyer S, Taylor E, Brammer M, Williams SC, Simmons A, Bullmore ET (1999): Hypofrontality in attention deficit hyperactivity disorder during higher‐order motor control: A study with functional MRI. Am J Psychiatry 156:891–896. [DOI] [PubMed] [Google Scholar]
- Schmahmann JD, Pandya DN, Wang R, Dai G, D'Arceuil HE, de Crespigny AJ, Wedeen VJ (2007): Association fibre pathways of the brain: Parallel observations from diffusion spectrum imaging and autoradiography. Brain 130:630–653. [DOI] [PubMed] [Google Scholar]
- Schweitzer JB, Faber TL, Grafton ST, Tune LE, Hoffman JM, Kilts CD (2000): Alterations in the functional anatomy of working memory in adult attention deficit hyperactivity disorder. Am J Psychiatry 157:278–280. [DOI] [PubMed] [Google Scholar]
- Shang CY, Gau SS, Liu CM, Hwu HG (2011): Association between the dopamine transporter gene and the inattentive subtype of attention deficit hyperactivity disorder in Taiwan. Prog Neuropsychopharmacol Biol Psychiatry 35:421–428. [DOI] [PubMed] [Google Scholar]
- Shaw P, Gilliam M, Liverpool M, Weddle C, Malek M, Sharp W, Greenstein D, Evans A, Rapoport J, Giedd J (2011): Cortical development in typically developing children with symptoms of hyperactivity and impulsivity: Support for a dimensional view of attention deficit hyperactivity disorder. Am J Psychiatry 168:143–151. [DOI] [PMC free article] [PubMed] [Google Scholar]
- Shaw P, Lerch J, Greenstein D, Sharp W, Clasen L, Evans A, Giedd J, Castellanos FX, Rapoport J (2006): Longitudinal mapping of cortical thickness and clinical outcome in children and adolescents with attention‐deficit/hyperactivity disorder. Arch Gen Psychiatry 63:540–549. [DOI] [PubMed] [Google Scholar]
- Sheridan MA, Hinshaw S, D'Esposito M (2007): Efficiency of the prefrontal cortex during working memory in attention‐deficit/hyperactivity disorder. J Am Acad Child Adolesc Psychiatry 46:1357–1366. [DOI] [PubMed] [Google Scholar]
- Silk T, Vance A, Rinehart N, Egan G, O'Boyle M, Bradshaw JL, Cunnington R (2005): Fronto‐parietal activation in attention‐deficit hyperactivity disorder, combined type: Functional magnetic resonance imaging study. Br J Psychiatry 187:282–283. [DOI] [PubMed] [Google Scholar]
- Silk TJ, Vance A, Rinehart N, Bradshaw JL, Cunnington R (2009a): Structural development of the basal ganglia in attention deficit hyperactivity disorder: A diffusion tensor imaging study. Psychiatry Res 172:220–225. [DOI] [PubMed] [Google Scholar]
- Silk TJ, Vance A, Rinehart N, Bradshaw JL, Cunnington R (2009b): White‐matter abnormalities in attention deficit hyperactivity disorder: A diffusion tensor imaging study. Hum Brain Mapp 30:2757–2765. [DOI] [PMC free article] [PubMed] [Google Scholar]
- Sonuga‐Barke EJ (2005): Causal models of attention‐deficit/hyperactivity disorder: From common simple deficits to multiple developmental pathways. Biol Psychiatry 57:1231–1238. [DOI] [PubMed] [Google Scholar]
- Stevens MC, Pearlson GD, Kiehl KA (2007): An FMRI auditory oddball study of combined‐subtype attention deficit hyperactivity disorder. Am J Psychiatry 164:1737–1749. [DOI] [PubMed] [Google Scholar]
- Takagi T, Nakamura M, Yamada M, Hikishima K, Momoshima S, Fujiyoshi K, Shibata S, Okano HJ, Toyama Y, Okano H (2009): Visualization of peripheral nerve degeneration and regeneration: Monitoring with diffusion tensor tractography. Neuroimage 44:884–892. [DOI] [PubMed] [Google Scholar]
- Tomasi D, Volkow ND (2011): Abnormal functional connectivity in children with attention‐deficit/hyperactivity disorder. Biol Psychiatry. [DOI] [PMC free article] [PubMed] [Google Scholar]
- Tournier JD, Calamante F, Gadian DG, Connelly A (2004): Direct estimation of the fiber orientation density function from diffusion‐weighted MRI data using spherical deconvolution. Neuroimage 23:1176–1185. [DOI] [PubMed] [Google Scholar]
- Tuch DS (2004): Q‐ball imaging. Magn Reson Med 52:1358–1372. [DOI] [PubMed] [Google Scholar]
- Vaidya CJ, Austin G, Kirkorian G, Ridlehuber HW, Desmond JE, Glover GH, Gabrieli JD (1998): Selective effects of methylphenidate in attention deficit hyperactivity disorder: A functional magnetic resonance study. Proc Natl Acad Sci USA 95:14494–14499. [DOI] [PMC free article] [PubMed] [Google Scholar]
- Vaidya CJ, Bunge SA, Dudukovic NM, Zalecki CA, Elliott GR, Gabrieli JD (2005): Altered neural substrates of cognitive control in childhood ADHD: Evidence from functional magnetic resonance imaging. Am J Psychiatry 162:1605–1613. [DOI] [PMC free article] [PubMed] [Google Scholar]
- van Ewijk H, Heslenfeld DJ, Zwiers MP, Buitelaar JK, Oosterlaan J (2012): Diffusion tensor imaging in attention deficit/hyperactivity disorder: A systematic review and meta‐analysis. Neurosci Biobehav Rev 36:1093–1106. [DOI] [PubMed] [Google Scholar]
- Vance A, Silk TJ, Casey M, Rinehart NJ, Bradshaw JL, Bellgrove MA, Cunnington R (2007): Right parietal dysfunction in children with attention deficit hyperactivity disorder, combined type: A functional MRI study. Mol Psychiatry 12:826–832, 793. [DOI] [PubMed] [Google Scholar]
- Volkow ND, Wang GJ, Newcorn JH, Kollins SH, Wigal TL, Telang F, Fowler JS, Goldstein RZ, Klein N, Logan J, Wong C, Swanson JM (2011): Motivation deficit in ADHD is associated with dysfunction of the dopamine reward pathway. Mol Psychiatry 16:1147–1154. [DOI] [PMC free article] [PubMed] [Google Scholar]
- Wang J, Jiang T, Cao Q, Wang Y (2007): Characterizing anatomic differences in boys with attention‐deficit/hyperactivity disorder with the use of deformation‐based morphometry. AJNR Am J Neuroradiol 28:543–547. [PMC free article] [PubMed] [Google Scholar]
- Wasserstein J (2005): Diagnostic issues for adolescents and adults with ADHD. J Clin Psychol 61:535–547. [DOI] [PubMed] [Google Scholar]
- Wedeen VJ, Hagmann P, Tseng WY, Reese TG, Weisskoff RM (2005): Mapping complex tissue architecture with diffusion spectrum magnetic resonance imaging. Magn Reson Med 54:1377–1386. [DOI] [PubMed] [Google Scholar]
- Wedeen VJ, Wang RP, Schmahmann JD, Benner T, Tseng WY, Dai G, Pandya DN, Hagmann P, D'Arceuil H, de Crespigny AJ (2008): Diffusion spectrum magnetic resonance imaging (DSI) tractography of crossing fibers. Neuroimage 41:1267–1277. [DOI] [PubMed] [Google Scholar]
- Yeh F, Wedeen V, Tseng WI. (A Recursive Algorithm to Decompose Orientation Distribution Function and Resolve Intra‐voxel Fiber Directions.). In;2008; Toronto, Ontario, Canada.
- Yeterian EH, Pandya DN (1991): Prefrontostriatal connections in relation to cortical architectonic organization in rhesus monkeys. J Comp Neurol 312:43–67. [DOI] [PubMed] [Google Scholar]