

Abstract
Calbindin‐containing γ‐aminobutyric acid (GABA)ergic interneurons in the prefrontal cortex (PFC) have been found to play an important role in working memory (WM) and their malfunctions have been linked to psychiatric disorders. A recent genome‐wide association and expression‐SNP study indicated that the RAB2A gene was associated with the density of prefrontal calbindin‐positive neurons, suggesting this gene may have a broader influence on prefrontal structure and function. Using multimodal MRI and behavioral tasks, the current study investigated the effect of RAB2A on prefrontal morphology, resting‐state functional connectivity, and WM performance in a large sample of healthy Han Chinese subjects. Results showed that the RAB2A AGCAAA haplotype was associated with improved WM accuracy, increased cortical thickness in the left inferior frontal gyrus, and decreased functional connectivity between the left inferior frontal gyrus and the left dorsolateral PFC. Our findings provide consistent evidence supporting the effect of RAB2A on the structure and function of the PFC and related cognitive functions. These results should provide new insights into the neural mechanisms underlying the GABAergic genes' role in WM as well as its dysfunction. Hum Brain Mapp 36:4372–4382, 2015. © 2015 Wiley Periodicals, Inc.
Keywords: Ras‐related protein Rab‐2A (RAB2A), cortical thickness, functional connectivity, working memory
INTRODUCTION
Gamma‐aminobutyric acid (GABA), the chief inhibitory neurotransmitter in the mammalian central nervous system, plays several crucial roles in brain function, including the regulation of pyramidal neurons in the prefrontal cortex (PFC) during working memory (WM) tasks [Constantinidis et al., 2002]. Specifically, calbindin‐immunoreactive (CB‐IR) interneurons, one type of GABAergic interneurons [DeFelipe, 1997], have been found to enhance the activity of neurons responding to relevant features and suppress distractors during WM tasks [Wang et al., 2004]. Moreover, reduced density of prefrontal CB‐IR interneurons has been linked to PFC‐related major psychiatric disorders, such as schizophrenia [Beasley et al., 2002; Sakai et al., 2008], bipolar disorder [Kim and Webster, 2010], and depression [Rajkowska et al., 2007]. A recent genome‐wide association and expression‐SNP study indicated that the RAB2A gene was associated with the density of CB‐IR neurons in the PFC of psychiatric disorders [Kim and Webster, 2011].
The human gene RAB2A, located on chromosome 8q12.1, codes for RAB2A, a small GTP‐binding protein of the Ras superfamily that plays an essential role in membrane fusion and trafficking. Although the exact biological function of human RAB2A is not well understood, evidence from Caenorhabditis elegans has indicated that RAB2 makes important contributions to the neuronal systems. These studies showed that RAB2 is involved in the biogenesis of dense core vesicles, a form of neuropeptide release [Ailion et al., 2014; Edwards et al., 2009; Sumakovic et al., 2009], and involved in apoptosis [Guo et al., 2010; Mangahas et al., 2008], which plays a potentially important role in the developing brain and in neurodegenerative diseases [Sastry and Rao, 2000]. In sum, there is accumulating evidence from C. elegans and human studies to support a significant role of RAB2 or RAB2A in neural function, especially in the prefrontal cytoarchitecture for humans. Less is known, however, about the relationship between the RAB2A gene polymorphisms and prefrontal structure and function.
Cortical thickness, which is highly heritable [Panizzon et al., 2009], is a widely used index of brain structure in imaging genetic studies [Winkler et al., 2010]. According to the radial unit hypothesis, cortical thickness is influenced by the number of neurons within a column [Rakic, 1988], and it reflects cytoarchitectural characteristics of the neuropil [Narr et al., 2007]. In addition, cortical thickness is associated with PFC‐mediated cognitive function [Ehrlich et al., 2012; Narr et al., 2007] and psychiatric disorders [Alexander‐Bloch et al., [Link]]. In sum, cortical thickness tends to reflect cortical columnar architecture and capture in vivo change of the PFC, and thus can be a promising endophenotype in a study of the in vivo neural mechanisms of the RAB2A gene.
In the current study, we combined genetic analysis, functional and structural magnetic resonance imaging (MRI), and cognitive tests to investigate the influence of RAB2A on prefrontal morphology and a related cognitive function (i.e., WM). In addition, because brain oscillatory activity reflects neuronal network function [Buzsaki and Draguhn, 2004] and is crucially dependent on GABAergic function, we also speculated the RAB2A gene would be associated with functional connectivity between the PFC and the rest of the brain.
MATERIALS AND METHODS
Subjects
We recruited 360 young healthy Han Chinese participants (174 females, mean age = 19.41 ± 1.09 years). The research protocol was approved by the Ethics Committee of School of Life Science and Technology at the University of Electronic Science and Technology of China. Written informed consent was obtained from each participant after a complete description of the study was provided. All participants were interviewed using the Structured Clinical Interview [First et al., 2002; Phillips and Liu, 2011] to ensure that they had no Axis I mental illnesses. They were also carefully screened for neurological diseases including traumatic brain injury or brain lesions (based on conventional MRI image) or any personal or family history (including their first‐, second‐, and third‐degree relatives) of psychiatric disorders.
DNA Extraction, SNP Genotyping, and Haplotype Analysis
After blood samples were collected, genomic DNA was extracted using the E.Z.N.A.™ Blood DNA Kit (Omega Bio‐Tek, GA). Given that six SNPs within the RAB2A gene (rs41420549, rs2981277, rs7013249, rs12681129, rs2930040, and rs595255) were identified to be significantly associated with the density of prefrontal cortical CB‐IR neurons in Kim's study [Kim and Webster, 2011], the same variants were selected in the current study (see Fig. 1A for their location on the gene). The six SNPs were genotyped via the iPLEX Gold Method (Sequenom, San Diego, CA), using primers designed with Sequenom Assay Design 3.1 software. The accuracy of genotyping was assessed by analyzing every sample in duplicate. Alleles were automatically called with Sequenom's MassARRAY Typer 4.0 software and verified by two independent reviewers. All six RAB2A SNPs passed the criteria of a call rate of > 90%, Minor Allele Frequency (MAF) of > 0.05, and Hardy–Weinberg equilibrium (HWE) of P > 0.05.
Figure 1.
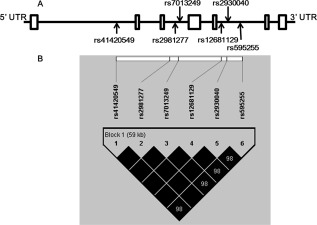
A: Schematic representation of the RAB2A gene and (B) LD map of selected SNPs (r 2).
Haplotype analysis was conducted using Haploview 4.2 [Barrett et al., 2005] and PHASE 2.1 [Stephens and Scheet, 2005]. As the results of linkage disequilibrium (LD) analysis showed that all six RAB2A SNPs were in strong linkage with one another and constructed a haplotype block (mean pairwise r 2 = 0.99, see Fig. 1B), the following association analyses were conducted with the haplotype. There were two common haplotypes AGCAAA and TATTTG. After excluding one subject with the other haplotype (TATTTA), the final 359 subjects were included in the following analyses, with the genotype coded as minor haplotype (AGCAAA) dosage (major haplotype homozygotes = 0, heterozygotes = 1, minor haplotype homozygotes = 2).
RAB2A Genotype and Expression Level Analysis
To investigate the potential impact of the six genotyped RAB2A SNPs on the expression levels of the gene, we used expression quantitative trait loci (eQTL) database from Genevar [Stranger et al., 2012] (http://www.sanger.ac.uk/resources/software/genevar/), which analyzed genome‐wide gene expression in lymphoblastoid cell lines from 726 individuals of the HapMap3 Project and correlated gene expression levels with HapMap3 SNPs located inside the gene.
WM Tasks and Analysis
WM was assessed with an N‐back paradigm (2‐ and 3‐back) as described by Liu et al. [2014]. Briefly, participants were presented with a series of letters sequentially, and asked to perform continuous judgments: whether the letter on the screen was the same as the one presented two letters earlier (in the 2‐back task) or the one presented three letters earlier (in the 3‐back task). Each task consisted of 3 blocks of 30 trials each, and a total of six blocks were tested in a random order. Before the experiment, participants were given instructions verbally and then had one practice block for each of the two tasks, on which they had to pass 70% of trials before they could take the real tests. The task was performed on a computer in a quiet room outside the MRI scanner. Five participants did not complete all WM tasks and were thus excluded from further analysis. For the remaining 354 subjects, the mean accuracy on the 2‐back and 3‐back tasks was 0.89 ± 0.07 and 0.82 ± 0.07, respectively. Four subjects were outliers in accuracy (more than three standard deviations lower than the mean) and were excluded. The final sample included 350 subjects (171 females) for the gene–behavior analyses.
To test group differences in WM performance across RAB2A genotypes, two‐way repeated measures analysis of co‐variance (ANCOVA) was performed, with RAB2A genotype as the between‐subject variable and WM load (2‐back vs. 3‐back) as the repeated within‐subject variable, and three potential confounding variables (age, sex, and years of education) as covariates. If the interaction term between genotype and memory load was significant, simple effect analyses were conducted to examine the effects of RAB2A polymorphism on WM performance by memory load. All gene–behavior statistical analyses were carried out in SAS 9.3 for Windows.
MRI Data Acquisition
MRI scans were performed on an MR750 3.0 Tesla magnetic resonance scanner (GE Healthcare). Resting‐state functional imaging data were acquired using a gradient‐echo echo‐planar‐imaging (GRE‐EPI) sequence with the following parameters: Repetition Time (TR) = 2,000 ms, Echo Time (TE) = 30 ms, field of view (FOV) = 240 × 240 mm2, matrix = 64 × 64, flip angle = 90°, voxel size = 3.75 × 3.75 × 4.0 mm3, 36 slices, and 240 volumes. T1‐weighted brain volume (BRAVO) MRI sequence was subsequently performed with the following parameters: TR = 8.16 ms, TE = 3.18 ms, flip angle = 7°, FOV = 256 mm × 256 mm, voxel size = 1 × 1 × 1 mm3, and 188 slices. Before the scanning, all subjects were instructed to move as little as possible, keep eyes closed, think of nothing in particular, and not fall asleep. Subjects were asked right after the scan whether they had fallen asleep during the scan. None of the subjects reported falling asleep.
Structural MRI Data Analysis
MRI data were analyzed automatically with FreeSurfer software package (http://surfer.nmr.mgh.harvard.edu/, version 5.3). Each subject's cortical surface was constructed through an automated procedure, involving segmentation of the white matter, classification of the gray–white matter boundary, inflation of the folded surface, and automatic correction of topological defects [Dale et al., 1999; Fischl et al., 1999]. Once generated, the cortical surface model was inspected and manually edited for technical accuracy; minimal manual editing was performed on any inaccuracies in Talairach‐transformation, skull stripping, and segmentation; and the cortical surface model was then re‐inspected. ANOVA was conducted and results showed no group difference (F(2,356) = 0.042, P = 0.959) in the mean number of control points among RAB2A major haplotype homozygotes (3.43 ± 7.03), heterozygotes (3.57 ± 6.91), and minor haplotype homozygotes (3.29 ± 8.82). From the reconstructed surface, measures of voxelwise cortical thickness were calculated as the shortest distance from the gray–white boundary to the pial surface at each vertex on the tessellated surface [Fischl and Dale, 2000]. Cortical thickness maps were then smoothed using a Gaussian kernel [10 mm Full width at half maximum (FWHM)].
The current study mainly focused on the contribution of RAB2A to prefrontal cortical thickness. Therefore, a vertex‐by‐vertex calculation of thickness in the PFC was performed (derived from FreeSurfer cortical parcellations) in association with RAB2A genotype. That is, after surface reconstruction, a general linear model was used to estimate the effects of RAB2A genotype on thickness at each vertex along the gray–white surface of the bilateral PFC. Gender, age, and years of education were included as covariates [Jiang et al., 2014; Smith et al., 2007]. Significance maps were then corrected for multiple comparisons with cluster‐based Monte Carlo simulations with 5,000 permutations [Hagler et al., 2006]. The statistical significance level was set as P < 0.025 (0.05/2[hemispheres], Bonferroni correction). Finally, corrected significance values (P < 0.025) of thickness in the PFC that were correlated with RAB2A genotype were mapped onto the average reconstructed surface for visual display.
Resting‐State Functional Connectivity Analysis
Imaging data were preprocessed using DPARSFA (Data Processing Assistant for Resting‐State fMRI Advanced Edition, http://www.restfmri.net/forum/DPARSF). The first 10 volumes were discarded to allow for magnetization equilibrium. Subsequent data preprocessing included slice timing correction, head motion correction, spatial normalization to the MNI template, resampling to 2 × 2 × 2 mm3, smoothing using a 4 mm Gaussian kernel, temporal bandpass filtering (0.01 Hz to 0.08 Hz), and regressing out nuisance signals of head motion parameters, white matter, CSF, and global signals. Six participants were excluded from subsequent analyses because they exhibited a maximum displacement of greater than 3 mm along one or more of the directions (x, y, z) or a maximum spin (x, y, z) greater than 3°. A final sample of 353 subjects remained in the functional connectivity analysis. Group differences of head motion among the three RAB2A haplotype groups were examined using three indices of head motion: mean motion, rotation, and Framewise displacement [Power et al., 2012; Van Dijk et al., 2012]. ANOVAs showed no difference for any of the three indices of head motion among the three haplotype groups (for mean motion, F(2,350) = 0.299, P = 0.741; for mean rotation, F(2,350) = 0.083, P = 0.921; for mean Framewise displacement, F(2,350) = 0.093, P = 0.911).
To investigate whether RAB2A polymorphism would regulate the functional connectivity between the brain regions whose cortical thickness was affected by the gene and the rest of the brain, we drew a sphere (6‐mm radius) centered at x = −46, y = 33, z = 8, the MNI coordinates of the vertex with max T value for the association between RAB2A genotype and cortical thickness. The gray matter within the sphere was then used as a seed ROI. The average time series of the seed ROI were calculated for each subject, and Pearson correlation coefficients were then computed between this time series and those of all the voxels throughout the whole brain. The resulting correlations were then converted to z values following Fisher's r‐to‐z transformation, creating a z‐based functional connectivity map for each subject. A general linear model (GLM) was used to compute the effects of the RAB2A genotype on the functional connectivity within the gray matter mask, with gender, age, and years of education as covariates. Statistical significance level was set at P < 0.05, FDR corrected at the voxel level. These statistical steps were carried out in SPM8 (http://www.fil.ion.ucl.ac.uk/spm).
RESULTS
RAB2A Genotypes
The frequencies of the two RAB2A haplotypes were 0.508 for TATTTG and 0.492 for AGCAAA. The haplotypes were coded as minor haplotype dosage (major haplotype homozygotes = 0, heterozygotes = 1, minor haplotype homozygotes = 2). The frequencies of the three groups were 0.240, 0.504, and 0.256, respectively. The genotype frequencies were within the Hardy–Weinberg equilibrium (χ 2 = 0.027, P = 0.870). No genotype differences were found for demographic variables (age, sex, and years of education, all P > 0.05 (see Table 1).
Table 1.
Demographic information for different haplotype groups
| Haplotypea | Major haplotype monozygotes (N = 92) | Heterozygote (N = 181) | Minor haplotype monozygotes (N = 86) | P‐value |
|---|---|---|---|---|
| Male/Female | 52/40 | 85/96 | 48/38 | 0.216b |
| Age | 19.39 ± 0.11 | 19.36 ± 0.08 | 19.49 ± 0.12 | 0.680c |
| Education year | 12.28 ± 0.08 | 12.34 ± 0.06 | 12.38 ± 0.09 | 0.702c |
| Working memoryd | 0.021e | |||
| 2‐back accuracy | 0.88 ± 0.07 | 0.90 ± 0.06 | 0.90 ± 0.06 | |
| 3‐back accuracy | 0.81 ± 0.07 | 0.82 ± 0.07 | 0.84 ± 0.06 |
The haplotype was constructed from six SNPs: rs41420549|rs2981277|rs7013249|rs12681129|rs2930040|rs595255, major haplotype monozygotes = TATTTG/TATTTG, heterozygotes = TATTTG/AGCAAA, and minor haplotype homozygotes AGCAAA/AGCAAA
P value (Pearson_Chi‐square test).
p value (ANOVA).
As described in the Methods section, only 350 subjects (89 major haplotype monozygotes, 177 heterozygotes, and 84 minor haplotype homozygotes) were included in the gene‐working memory analysis.
P value for main effects of RAB2A genotype (repeated measures ANCOVA).
RAB2A Gene Expression Level
The current study used data from two populations: CEU (109 Caucasians of northern and western European ancestry living in Utah, USA) and CHB (80 Han Chinese from Beijing, China). All the six genotyped RAB2A SNPs were significantly associated with RAB2A expression in both Caucasian and Han Chinese populations (see Fig. 2).
Figure 2.
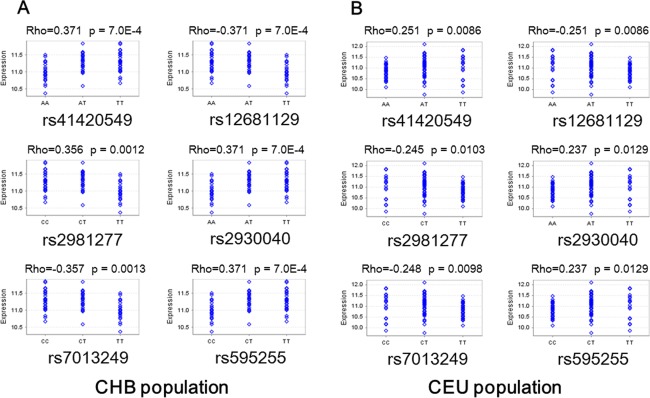
All the six RAB2A SNPs are significantly associated with the expression level of RAB2A in lymphoblastoid cell lines from individuals from Han Chinese (CHB) population (A) and Caucasian (CEU) population (B). [Color figure can be viewed in the online issue, which is available at http://wileyonlinelibrary.com.]
WM Performance
A 2 (WM load: 2‐back, 3‐back) × 3 (RAB2A genotypes: AGCAAA/AGCAAA, AGCAAA/TATTTG, TATTTG/TATTTG) repeated measures ANCOVA was conducted. There were main effects of both RAB2A genotype (F(2, 344) = 3.91, P = 0.02) and WM load (F(1, 344) = 495.53, P < 0.0001), and a significant interaction F(2, 344) = 3.53, P = 0.031. Simple effect analysis revealed that the effect of RAB2A genotype was not significant for the 2‐back task (F(2, 344) = 2.27, P =0.11), but was significant for the 3‐back task (F(2, 344) = 5.04, P = 0.0069). As shown in Figure 3, subjects with more dosage of the AGCAAA haplotype had higher WM accuracy. Furthermore, Bonferroni post hoc tests (controlling for 15 multiple comparisons) showed that individuals with the AGCAAA/AGCAAA genotype showed significantly higher WM accuracy on the 3‐back task than those with the TATTTG/TATTTG genotype (t(344)= 3.12, corrected P = 0.029), whereas the difference between TATTTG/TATTTG and TATTTG/AGCAAA individuals (t(344) = 1.29, corrected P = 1) and that between TATTTG/AGCAAA and AGCAAA/AGCAAA individuals (t(344) = 2.32, corrected P = 0.32) were both not significant.
Figure 3.
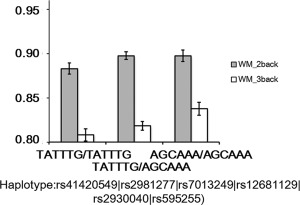
Association of RAB2A haplotype with WM performance. Error bar indicates standard error.
Cortical Thickness
We calculated the cortical thickness maps for each individual, and conducted regression analysis with the dosage of RAB2A AGCAAA haplotype. Results showed that the dosage of the AGCAAA haplotype was significantly associated with cortical thickness in the left inferior frontal gyrus (IFG, cluster‐wise P = 0.0014, Monte‐Carlo correction, Fig. 4A). AGCAAA/AGCAAA individuals (who performed the best on the WM tasks) also showed greatest cortical thickness in the left IFG, followed by TATTTG/AGCAAA subjects who showed better WM performance as well as greater cortical thickness in the left IFG than TATTTG/TATTTG individuals (see Fig. 4B).
Figure 4.
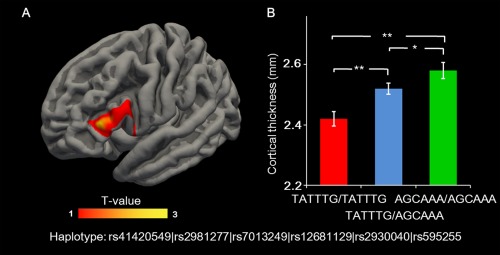
Association between RAB2A genotype and prefrontal cortical thickness. A: The map shows the region with a significant linear increase in cortical thickness with the dosage of the AGCAAA haplotype (Monte‐Carlo correction, P = 0.001). B: The average value of the cortical thickness in the left inferior frontal gyrus (within significant clusters) is displayed in the bar graph for the three different genotype groups (mean ± SE). *P <0.05 (ANOVA, post hoc analysis). **P <0.01 (ANOVA, post hoc analysis).
Functional Connectivity
The morphological analysis above showed a significant association between the dosage of RAB2A AGCAAA haplotype and cortical thickness of the left IFG (peak vertex MNI coordinates: x = −46, y = 33, z = 8). These coordinates were used as the central point to draw a sphere (6‐mm radius) and the gray matter within the sphere was used as a seed ROI. Functional connectivity between this ROI and the whole brain was investigated. Results indicated a significant negative correlation between the dosage of the AGCAAA haplotype and the functional connectivity between the seed region and the left dorsolateral prefrontal cortex (DLPFC, P <0.05, FDR corrected, see Fig. 5).
Figure 5.
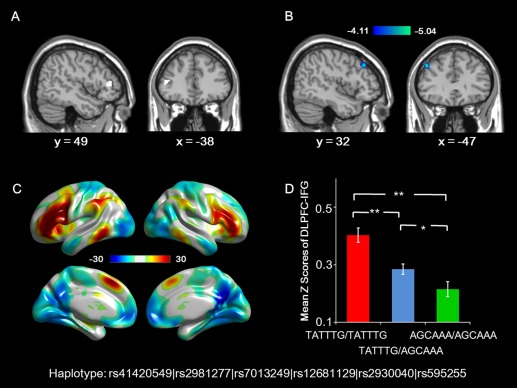
Association between RAB2A genotype and resting‐state functional connectivity. A: The seed ROI was extracted as the gray matter within the sphere with 6 mm radius, centered at the MNI coordinates of the vertex with max T value for the association between RAB2A genotype and cortical thickness. B: Resting‐state functional connectivity pattern between the ROI and the rest of the brain across all subjects (FWE‐corrected P < 0.01). Warm color represents positive connectivity; and cool color represents negative connectivity. C: The left DLPFC showed a significant linear decrease in its connectivity with the ROI as the dosage of AGCAAA haplotype increased. The color bar indicates T‐scores (FDR‐corrected, P < 0.05). D: Mean ± SE Z scores of the connectivity in the survived regions after correction in the RAB2A haplotypes. *P <0.05 (ANOVA, post hoc analysis). **P <0.01 (ANOVA, post hoc analysis).
To exclude the confounding effect of cortcal thickness or volume, two additional analyses were carried out. First, the influence of RAB2A haplotype on gray matter volume of the ROI was analyzed using voxel‐based morphometry (VBM), no significant result was found (the significance level was set at either P < 0.05, family‐wise error corrected for multiple comparisons, or P < 0.001, uncorrected). Second, the mean thickness of the IFG and the mean FC between the IFG and left DLPFC were extracted. To control for the confounding effects of cortical thickness, a regression analysis was conducted, with the FC as the dependent variable and the thickness of left IFG as independent variable. The residual for each subject was used as an index of FC in subsequent association analysis. The result of the following regression analyses showed a significant effect of RAB2A haplotype on the FC (F(1,351) = 19.31, P = 1.48 × 10⁻⁵), suggesting that the genetic effect on the FC is independent of the genetic effect on the cortical thickness.
DISCUSSION
Extending previous work at the cellular level implicating the influence of RAB2A on prefrontal cytoarchitecture, we found associations between RAB2A gene polymorphism and prefrontal cortical thickness, functional connectivities, and WM performance in a large sample of healthy young adults. Specifically, the minor haplotype AGCAAA was associated with better WM performance, greater cortical thickness in the left inferior frontal gyrus, and decreased resting‐state functional connectivity between the IFG and DLPFC.
RAB2A has been associated with the density of prefrontal CB‐IR interneurons [Kim and Webster, 2011], which is linked to WM and related disorders such as schizophrenia. During WM tasks, CB‐IR interneurons have higher firing rates during the delay period than at the spontaneous state and enhance the activity of neurons that are responsive to relevant features and to suppress the distractors [Wang et al., 2004]. In addition, the cortical layers enriched with CB‐IR neurons play an important role in masking distractors in auditory discrimination tasks [Barbas et al., 2005]. In accordance with these studies, we found that RAB2A was associated with WM performance, especially when the WM demands were high (i.e., the 3‐back task).
The other major finding of this study was the significant association between RAB2A haplotype and prefrontal cortical thickness. This result can be interpreted in the context of the literature on potential links between molecular and cellular alterations and the macroscopic neuromorphological phenotypes such as cortical thickness and between brain structure and cognitive performance. First, as an indirect measure of a complex cortical architecture, cortical thickness is subject to the influence of several cellular events during developmental processes such as myelination of the subjacent neuropil [Sowell et al., 2001] and fibers [Sowell et al., 2004], synaptic pruning [Huttenlocher and Dabholkar, 1997], and cell density [Kolasinski et al., 2012]. According to the radial unit hypothesis and radial amplification hypothesis, cortical thickness is also influenced by the number of cells within a column [Rakic, 1988] and intermediate progenitor cells [Pontious et al., 2008]. Accordingly, genes involved in cytoarchitecture [Kim and Webster, 2011] and the regulation of apoptosis [Guo et al., 2010], such as RAB2A, is expected to contribute to individual differences in cortical thickness. Second, prefrontal cortical thickness has been widely observed to be associated with WM performance [Ehrlich et al., 2012] and can serve as an intermediate phenotype that links genetic variants to WM. Indeed, cortical thickness is highly heritable [Panizzon et al., 2009] and has been suggested as a preferred endophenotype over gray matter volumes for imaging genetic studies [Winkler et al., 2010]. In the current study, RAB2A AGCAAA homozygotes, which showed higher WM performance, exhibited a thicker left IFG. In other words, cortical thickness in this region may provide a potential neural mechanism linking RAB2A with the WM performance.
The most significant correlation between the dosage of the RAB2A AGCAAA haplotype and cortical thickness was observed in the left inferior gyrus (IFG), a region involved in WM maintenance [D'Esposito et al., 1998] and rehearsal [Paulesu et al., 1993]. Recent studies have also demonstrated that the IFG is relevant to the function of GABAergic interneurons. For example, during a language processing task, participants with reduced GABAergic function showed decreased engagement of the IFG [Snyder et al., 2010]. Pharmacological studies also characterized the modulatory effect of a nonspecific GABAergic modulator, diazepam, on the oscillations in the left inferior frontal region [Hall et al., 2010]. Therefore, as a candidate gene for the cytoarchitectural trait of a type of GABAergic interneurons, RAB2A would be expected to be linked with the IFG's structural characteristics. We speculate that the increased cortical thickness observed in left IFG in this study may be a manifestation of not only the effect of RAB2A on prefrontal calbindin containing GABAergic interneuron cytoarchitecture, but also the relationship between IFG and GABAergic interneurons.
Finally, we found that the dosage of the RAB2A AGCAAA haplotype was associated with decreased functional connectivity between the left DLPFC and the left IFG. Both the DLPFC and the IFG play a key role in WM. Emerging neural network models have demonstrated that the DLPFC is engaged in higher‐order processes such as WM manipulation [Blumenfeld and Ranganath, 2007; D'Esposito et al., 1999] and monitoring [Champod and Petrides, 2007] of the information maintained in the IFG [D'Esposito et al., 1998]. A recent study also found that WM is involved a frontoparietal network with a bidirectional DLPFC‐IFG connection [Jackson et al., 2011]. In the current study, the RAB2A AGCAAA haplotype was associated with higher WM performance but reduced DLPFC–IFG connection, suggesting that this haplotype was associated with a more optimal neural network for WM. This conjecture is consistent with a recent pharmacological study that found an association between reduced DLPFC–IFG connectivity and ketamine‐related improvement in WM performance [Driesen et al., 2013]. Other supporting evidence came from patients with schizophrenia who showed both decreased WM performance [Lee and Park, 2005] and increased DLPFC‐IFG functional connectivity as compared to unaffected siblings [Liu et al., 2012] and healthy participants [Schlosser et al., 2003], although these results have not been entirely consistent [Anticevic et al., 2012]. Integrating our results with the literature on the contribution of RAB2A to the density of prefrontal CB‐IR neurons and related functions, we speculate that the RAB2A TATTTG haplotype has abnormal density of CB‐IR interneurons, which results in poor modulation of neural firings, hyperconnectivity between the DLPFC and IFG, and poor WM performance.
The effect of RAB2A haplotype on WM performance and related prefrontal structure and functional connectivity could provide new insights into the genetic and neural underpinnings of WM dysfunction such as in the case of schizophrenia. RAB2A has been associated with the density of prefrontal CB‐IR interneurons [Kim and Webster, 2011], which is linked to disorders such as schizophrenia. Moreover, abnormalities of CB‐IR interneurons in the PFC have been reported in patients with schizophrenia. For instance, previous in vivo and postmortem studies have reported reduced density of prefrontal CB‐IR neurons [Sakai et al., 2008] and reduced GABAergic function [Rowland et al., 2013] in schizophrenia patients. Moreover, to investigate whether RAB2A participates in the protein–protein interaction (PPI) network of top schizophrenia susceptibility genes, we constructed a PPI network using a well‐characterized data set with 42 top schizophrenia susceptibility genes [Ayalew et al., 2012]. The PPI network was extracted and reconstructed by DAPPLE (Disease Association Protein‐Protein Link Evaluator) [Rossin et al., 2011] and the degree of interconnectivity was tested by permutation (n = 10,000 permutations). We found that the direct PPI network of genes from this data set had significantly more edges than expected by chance (P = 9.9 × 10⁻⁵, corrected) and that RAB2A gene participates in this network, implying RAB2A is involved in the common molecular network that modulates risk for schizophrenia. The PPI data further support the potential role of RAB2A in the pathogenesis of schizophrenia.
Several limitations of the current study need to be noted. First, only healthy Han Chinese college students were recruited for this study, which limited the generalization of our results to other populations. Furthermore, the roles of genes in brain development and behavior seem to be modulated by ethnicity [Long et al., 2013], age [Filippini et al., 2009], and environmental factors [Frodl et al., 2014], which might have contributed to the lack of reproducibility of gene–behavior associations. Therefore, future studies with samples of different ethnicities, ages, and environments are needed to replicate our results. Second, because MRI measures do not have the resolution to examine brain structure at the cellular level and because the relationship between macroscopic and microscopic structural brain measures is complex, our results linking RAB2A to brain structure need to be interpreted with caution. Third, although our finding that RAB2A has effects on the PFC's morphology and function expanded previous reports about this gene's effect on PFC cytoarchitecture, our results were correlational and did not provide direct proof of causal connections between molecular genetic variations, neural mechanisms, and cognitive functions. More direct biological evidence is required to elucidate the relationship between the cytoarchitecture of prefrontal calbindin positive GABAergic interneurons and cortical thickness and intrinsic connectivity. Finally, we only used resting‐state functional connectivity data to index brain functions. Although resting‐state functional connectivity is useful for mapping brain networks [Fox et al., 2005; van den Heuvel and Hulshoff Pol, 2010] and has been linked to WM performance [Hampson et al., 2010], the current study did not collect task‐related fMRI data during WM performance. Future studies in this area should also collect task‐related fMRI data, which may provide more direct links between neural activities and WM performance.
In sum, we investigated the role of the RAB2A gene in WM by examining cortical morphology, intrinsic connectivity, and cognitive performance. Results showed convergent evidence that the RAB2A gene is involved in cortical thickness in the IFG, functional connectivity between the IFG and DLPFC, and WM. These associations are biologically meaningful and deserve further exploration.
REFERENCES
- Ailion M, Hannemann M, Dalton S, Pappas A, Watanabe S, Hegermann J, Liu Q, Han HF, Gu M, Goulding MQ, N Sasidharan, K Schuske, P Hullett, S Eimer, EM Jorgensen (2014): Two rab2 interactors regulate dense‐core vesicle maturation. Neuron 82:167–180. [DOI] [PMC free article] [PubMed] [Google Scholar]
- Alexander‐Bloch AF, Reiss PT, Rapoport J, McAdams H, Giedd JN, Bullmore ET, Gogtay N: Abnormal cortical growth in schizophrenia targets normative modules of synchronized development. Biol Psychiatry 76:438–446. [DOI] [PMC free article] [PubMed] [Google Scholar]
- Anticevic A, Repovs G, Krystal JH, Barch DM (2012): A broken filter: Prefrontal functional connectivity abnormalities in schizophrenia during working memory interference. Schizophr Res 141:8–14. [DOI] [PMC free article] [PubMed] [Google Scholar]
- Ayalew M, Le‐Niculescu H, Levey DF, Jain N, Changala B, Patel SD, Winiger E, Breier A, Shekhar A, Amdur R, et al. (2012): Convergent functional genomics of schizophrenia: From comprehensive understanding to genetic risk prediction. Mol Psychiatry 17:887–905. [DOI] [PMC free article] [PubMed] [Google Scholar]
- Barbas H, Medalla M, Alade O, Suski J, Zikopoulos B, Lera P (2005): Relationship of prefrontal connections to inhibitory systems in superior temporal areas in the rhesus monkey. Cereb Cortex 15:1356–1370. [DOI] [PubMed] [Google Scholar]
- Barrett JC, Fry B, Maller J, Daly MJ (2005): Haploview: Analysis and visualization of LD and haplotype maps. Bioinformatics 21:263–265. [DOI] [PubMed] [Google Scholar]
- Beasley CL, Zhang ZJ, Patten I, Reynolds GP (2002): Selective deficits in prefrontal cortical GABAergic neurons in schizophrenia defined by the presence of calcium‐binding proteins. Biol Psychiatry 52:708–715. [DOI] [PubMed] [Google Scholar]
- Blumenfeld RS, Ranganath C (2007): Prefrontal cortex and long‐term memory encoding: An integrative review of findings from neuropsychology and neuroimaging. Neuroscientist 13:280–291. [DOI] [PubMed] [Google Scholar]
- Buzsaki G, Draguhn A (2004): Neuronal oscillations in cortical networks. Science 304:1926–1929. [DOI] [PubMed] [Google Scholar]
- Champod AS, Petrides M (2007): Dissociable roles of the posterior parietal and the prefrontal cortex in manipulation and monitoring processes. Proc Natl Acad Sci USA 104:14837–14842. [DOI] [PMC free article] [PubMed] [Google Scholar]
- Constantinidis C, Williams GV, Goldman‐Rakic PS (2002): A role for inhibition in shaping the temporal flow of information in prefrontal cortex. Nat Neurosci 5:175–180. [DOI] [PubMed] [Google Scholar]
- D'Esposito M, Aguirre GK, Zarahn E, Ballard D, Shin RK, Lease J (1998): Functional MRI studies of spatial and nonspatial working memory. Brain Res Cogn Brain Res 7:1–13. [DOI] [PubMed] [Google Scholar]
- D'Esposito M, Postle BR, Ballard D, Lease J (1999): Maintenance versus manipulation of information held in working memory: An event‐related fMRI study. Brain Cogn 41:66–86. [DOI] [PubMed] [Google Scholar]
- Dale AM, Fischl B, Sereno MI (1999): Cortical surface‐based analysis. I. Segmentation and surface reconstruction. Neuroimage 9:179–194. [DOI] [PubMed] [Google Scholar]
- DeFelipe J (1997): Types of neurons, synaptic connections and chemical characteristics of cells immunoreactive for calbindin‐D28K, parvalbumin and calretinin in the neocortex. J Chem Neuroanat 14:1–19. [DOI] [PubMed] [Google Scholar]
- Driesen NR, McCarthy G, Bhagwagar Z, Bloch MH, Calhoun VD, D'Souza DC, Gueorguieva R, He G, Leung HC Ramani R, et al. (2013): The impact of NMDA receptor blockade on human working memory‐related prefrontal function and connectivity. Neuropsychopharmacology 38:2613–2622. [DOI] [PMC free article] [PubMed] [Google Scholar]
- Edwards SL, Charlie NK, Richmond JE, Hegermann J, Eimer S, Miller KG (2009): Impaired dense core vesicle maturation in Caenorhabditis elegans mutants lacking Rab2. J Cell Biol 186:881–895. [DOI] [PMC free article] [PubMed] [Google Scholar]
- Ehrlich S, Brauns S, Yendiki A, Ho BC, Calhoun V, Schulz SC, Gollub RL, Sponheim SR (2012): Associations of cortical thickness and cognition in patients with schizophrenia and healthy controls. Schizophr Bull 38:1050–1062. [DOI] [PMC free article] [PubMed] [Google Scholar]
- Filippini N, MacIntosh BJ, Hough MG, Goodwin GM, Frisoni GB, Smith SM, Matthews PM, Beckmann CF, Mackay CE (2009): Distinct patterns of brain activity in young carriers of the APOE‐epsilon4 allele. Proc Natl Acad Sci USA 106:7209–7214. [DOI] [PMC free article] [PubMed] [Google Scholar]
- First MB, Spitzer LR, Miriam G, Williams JBW. 2002. Structured Clinical Interview for DSM‐IV‐TR Axis I Disorders, Patient Edition. New York: Biometrics Research, New York State Psychiatric Institute. [Google Scholar]
- Fischl B, Dale AM (2000): Measuring the thickness of the human cerebral cortex from magnetic resonance images. Proc Natl Acad Sci USA 97:11050–11055. [DOI] [PMC free article] [PubMed] [Google Scholar]
- Fischl B, Sereno MI, Dale AM (1999): Cortical surface‐based analysis. II. Inflation, flattening, and a surface‐based coordinate system. Neuroimage 9:195–207. [DOI] [PubMed] [Google Scholar]
- Fox MD, Snyder AZ, Vincent JL, Corbetta M, Van Essen DC, Raichle ME (2005): The human brain is intrinsically organized into dynamic, anticorrelated functional networks. Proc Natl Acad Sci USA 102:9673–9678. [DOI] [PMC free article] [PubMed] [Google Scholar]
- Frodl T, Skokauskas N, Frey EM, Morris D, Gill M, Carballedo A (2014): BDNF Val66Met genotype interacts with childhood adversity and influences the formation of hippocampal subfields. Hum Brain Mapp 35:5776–5783. [DOI] [PMC free article] [PubMed] [Google Scholar]
- Guo P, Hu T, Zhang J, Jiang S, Wang X (2010): Sequential action of Caenorhabditis elegans Rab GTPases regulates phagolysosome formation during apoptotic cell degradation. Proc Natl Acad Sci USA 107:18016–18021. [DOI] [PMC free article] [PubMed] [Google Scholar]
- Hagler DJ Jr, Saygin AP, Sereno MI (2006): Smoothing and cluster thresholding for cortical surface‐based group analysis of fMRI data. Neuroimage 33:1093–1103. [DOI] [PMC free article] [PubMed] [Google Scholar]
- Hall SD, Barnes GR, Furlong PL, Seri S, Hillebrand A (2010): Neuronal network pharmacodynamics of GABAergic modulation in the human cortex determined using pharmaco‐magnetoencephalography. Hum Brain Mapp 31:581–594. [DOI] [PMC free article] [PubMed] [Google Scholar]
- Hampson M, Driesen N, Roth JK, Gore JC, Constable RT (2010): Functional connectivity between task‐positive and task‐negative brain areas and its relation to working memory performance. Magn Reson Imaging 28:1051–1057. [DOI] [PMC free article] [PubMed] [Google Scholar]
- Huttenlocher PR, Dabholkar AS (1997): Regional differences in synaptogenesis in human cerebral cortex. J Comp Neurol 387:167–178. [DOI] [PubMed] [Google Scholar]
- Jackson MC, Morgan HM, Shapiro KL, Mohr H, Linden DE (2011): Strategic resource allocation in the human brain supports cognitive coordination of object and spatial working memory. Hum Brain Mapp 32:1330–1348. [DOI] [PMC free article] [PubMed] [Google Scholar]
- Jiang J, Sachdev P, Lipnicki DM, Zhang H, Liu T, Zhu W, Suo C, Zhuang L, Crawford J Reppermund S, et al. (2014): A longitudinal study of brain atrophy over two years in community‐dwelling older individuals. Neuroimage 86:203–211. [DOI] [PubMed] [Google Scholar]
- Kim S, Webster MJ (2010): Correlation analysis between genome‐wide expression profiles and cytoarchitectural abnormalities in the prefrontal cortex of psychiatric disorders. Mol Psychiatry 15:326–336. [DOI] [PubMed] [Google Scholar]
- Kim S, Webster MJ (2011): Integrative genome‐wide association analysis of cytoarchitectural abnormalities in the prefrontal cortex of psychiatric disorders. Mol Psychiatry 16:452–461. [DOI] [PubMed] [Google Scholar]
- Kolasinski J, Stagg CJ, Chance SA, Deluca GC, Esiri MM, Chang EH, Palace JA, McNab JA, Jenkinson M Miller KL, et al. (2012): A combined post‐mortem magnetic resonance imaging and quantitative histological study of multiple sclerosis pathology. Brain 135 (Part 10):2938–2951. [DOI] [PMC free article] [PubMed] [Google Scholar]
- Lee J, Park S (2005): Working memory impairments in schizophrenia: A meta‐analysis. J Abnorm Psychol 114:599–611. [DOI] [PubMed] [Google Scholar]
- Liu B, Zhang X, Hou B, Li J, Qiu C, Qin W, Yu C, Jiang T (2014): The impact of MIR137 on dorsolateral prefrontal‐hippocampal functional connectivity in healthy subjects. Neuropsychopharmacology. [DOI] [PMC free article] [PubMed] [Google Scholar]
- Liu H, Kaneko Y, Ouyang X, Li L, Hao Y, Chen EY, Jiang T, Zhou Y, Liu Z (2012): Schizophrenic patients and their unaffected siblings share increased resting‐state connectivity in the task‐negative network but not its anticorrelated task‐positive network. Schizophr Bull 38:285–294. [DOI] [PMC free article] [PubMed] [Google Scholar]
- Long H, Liu B, Hou B, Wang C, Li J, Qin W, Wang D, Zhou Y, Kendrick KM, Yu C, et al. (2013): The long rather than the short allele of 5‐HTTLPR predisposes Han Chinese to anxiety and reduced connectivity between prefrontal cortex and amygdala. Neurosci Bull 29:4–15. [DOI] [PMC free article] [PubMed] [Google Scholar]
- Mangahas PM, Yu X, Miller KG, Zhou Z (2008): The small GTPase Rab2 functions in the removal of apoptotic cells in Caenorhabditis elegans. J Cell Biol 180:357–373. [DOI] [PMC free article] [PubMed] [Google Scholar]
- Narr KL, Woods RP, Thompson PM, Szeszko P, Robinson D, Dimtcheva T, Gurbani M, Toga AW, Bilder RM (2007): Relationships between IQ and regional cortical gray matter thickness in healthy adults. Cereb Cortex 17:2163–2171. [DOI] [PubMed] [Google Scholar]
- Panizzon MS, Fennema‐Notestine C, Eyler LT, Jernigan TL, Prom‐Wormley E, Neale M, Jacobson K, Lyons MJ, Grant MD, Franz CE, et al. (2009): Distinct genetic influences on cortical surface area and cortical thickness. Cereb Cortex 19:2728–2735. [DOI] [PMC free article] [PubMed] [Google Scholar]
- Paulesu E, Frith CD, Frackowiak RS (1993): The neural correlates of the verbal component of working memory. Nature 362:342–345. [DOI] [PubMed] [Google Scholar]
- Phillips MR, Liu X. 2011. Adapted Chinese version of Structured Clinical Interview for DSM‐IV‐TR Axis I Disorders,Research Version, Patient Edition (SCID‐I/P) by Michael B. First, Robert L. Spitzer, Miriam Gibbon, and Janet B.W. Williams. Shanghai: Suicide Research and Prevention Center, Shanghai Mental Health Center. [Google Scholar]
- Pontious A, Kowalczyk T, Englund C, Hevner RF (2008): Role of intermediate progenitor cells in cerebral cortex development. Dev Neurosci 30:24–32. [DOI] [PubMed] [Google Scholar]
- Power JD, Barnes KA, Snyder AZ, Schlaggar BL, Petersen SE (2012): Spurious but systematic correlations in functional connectivity MRI networks arise from subject motion. Neuroimage 59:2142–2154. [DOI] [PMC free article] [PubMed] [Google Scholar]
- Rajkowska G, O'Dwyer G, Teleki Z, Stockmeier CA, Miguel‐Hidalgo JJ (2007): GABAergic neurons immunoreactive for calcium binding proteins are reduced in the prefrontal cortex in major depression. Neuropsychopharmacology 32:471–482. [DOI] [PMC free article] [PubMed] [Google Scholar]
- Rakic P (1988): Specification of cerebral cortical areas. Science 241:170–176. [DOI] [PubMed] [Google Scholar]
- Rossin EJ, Lage K, Raychaudhuri S, Xavier RJ, Tatar D, Benita Y, Cotsapas C, Daly MJ (2011): Proteins encoded in genomic regions associated with immune‐mediated disease physically interact and suggest underlying biology. PLoS Genet 7:e1001273 [DOI] [PMC free article] [PubMed] [Google Scholar]
- Rowland LM, Kontson K, West J, Edden RA, Zhu H, Wijtenburg SA, Holcomb HH, Barker PB (2013): In vivo measurements of glutamate, GABA, and NAAG in schizophrenia. Schizophr Bull 39:1096–1104. [DOI] [PMC free article] [PubMed] [Google Scholar]
- Sakai T, Oshima A, Nozaki Y, Ida I, Haga C, Akiyama H, Nakazato Y, Mikuni M (2008): Changes in density of calcium‐binding‐protein‐immunoreactive GABAergic neurons in prefrontal cortex in schizophrenia and bipolar disorder. Neuropathology 28:143–150. [DOI] [PubMed] [Google Scholar]
- Sastry PS, Rao KS (2000): Apoptosis and the nervous system. J Neurochem 74:1–20. [DOI] [PubMed] [Google Scholar]
- Schlosser R, Gesierich T, Kaufmann B, Vucurevic G, Stoeter P (2003): Altered effective connectivity in drug free schizophrenic patients. Neuroreport 14:2233–2237. [DOI] [PubMed] [Google Scholar]
- Smith CD, Chebrolu H, Wekstein DR, Schmitt FA, Markesbery WR (2007): Age and gender effects on human brain anatomy: A voxel‐based morphometric study in healthy elderly. Neurobiol Aging 28:1075–1087. [DOI] [PubMed] [Google Scholar]
- Snyder HR, Hutchison N, Nyhus E, Curran T, Banich MT, O'Reilly RC, Munakata Y (2010): Neural inhibition enables selection during language processing. Proc Natl Acad Sci USA 107:16483–16488. [DOI] [PMC free article] [PubMed] [Google Scholar]
- Sowell ER, Thompson PM, Tessner KD, Toga AW (2001): Mapping continued brain growth and gray matter density reduction in dorsal frontal cortex: Inverse relationships during postadolescent brain maturation. J Neurosci 21:8819–8829. [DOI] [PMC free article] [PubMed] [Google Scholar]
- Sowell ER, Thompson PM, Leonard CM, Welcome SE, Kan E, Toga AW (2004): Longitudinal mapping of cortical thickness and brain growth in normal children. J Neurosci 24:8223–8231. [DOI] [PMC free article] [PubMed] [Google Scholar]
- Stephens M, Scheet P (2005): Accounting for decay of linkage disequilibrium in haplotype inference and missing‐data imputation. Am J Hum Genet 76:449–462. [DOI] [PMC free article] [PubMed] [Google Scholar]
- Stranger BE, Montgomery SB, Dimas AS, Parts L, Stegle O, Ingle CE, Sekowska M, Smith GD, Evans D, Gutierrez‐Arcelus M, et al. (2012): Patterns of cis regulatory variation in diverse human populations. PLoS Genet 8:e1002639. [DOI] [PMC free article] [PubMed] [Google Scholar]
- Sumakovic M, Hegermann J, Luo L, Husson SJ, Schwarze K, Olendrowitz C, Schoofs L, Richmond J, Eimer S (2009): UNC‐108/RAB‐2 and its effector RIC‐19 are involved in dense core vesicle maturation in Caenorhabditis elegans. J Cell Biol 186:897–914. [DOI] [PMC free article] [PubMed] [Google Scholar]
- van den Heuvel MP, Hulshoff Pol HE (2010): Exploring the brain network: A review on resting‐state fMRI functional connectivity. Eur Neuropsychopharmacol 20:519–534. [DOI] [PubMed] [Google Scholar]
- Van Dijk KR, Sabuncu MR, Buckner RL (2012): The influence of head motion on intrinsic functional connectivity MRI. Neuroimage 59:431–438. [DOI] [PMC free article] [PubMed] [Google Scholar]
- Wang XJ, Tegner J, Constantinidis C, Goldman‐Rakic PS (2004): Division of labor among distinct subtypes of inhibitory neurons in a cortical microcircuit of working memory. Proc Natl Acad Sci U S A 101:1368–1373. [DOI] [PMC free article] [PubMed] [Google Scholar]
- Winkler AM, Kochunov P, Blangero J, Almasy L, Zilles K, Fox PT, Duggirala R, Glahn DC (2010): Cortical thickness or grey matter volume? The importance of selecting the phenotype for imaging genetics studies. Neuroimage 53:1135–1146. [DOI] [PMC free article] [PubMed] [Google Scholar]