

Abstract
Electrical brain stimulation can provide important information about the functional organization of the human visual cortex. Here, we report the visual phenomena evoked by a large number (562) of intracerebral electrical stimulations performed at low‐intensity with depth electrodes implanted in the occipito‐parieto‐temporal cortex of 22 epileptic patients. Focal electrical stimulation evoked primarily visual hallucinations with various complexities: simple (spot or blob), intermediary (geometric forms), or complex meaningful shapes (faces); visual illusions and impairments of visual recognition were more rarely observed. With the exception of the most posterior cortical sites, the probability of evoking a visual phenomenon was significantly higher in the right than the left hemisphere. Intermediary and complex hallucinations, illusions, and visual recognition impairments were almost exclusively evoked by stimulation in the right hemisphere. The probability of evoking a visual phenomenon decreased substantially from the occipital pole to the most anterior sites of the temporal lobe, and this decrease was more pronounced in the left hemisphere. The greater sensitivity of the right occipito‐parieto‐temporal regions to intracerebral electrical stimulation to evoke visual phenomena supports a predominant role of right hemispheric visual areas from perception to recognition of visual forms, regardless of visuospatial and attentional factors. Hum Brain Mapp 35:3360–3371, 2014. © 2013 Wiley Periodicals, Inc.
Keywords: stereo‐electroencephalography, electrical stimulation, hallucination, prosopagnosia, recognition, hemispheric asymmetry
Abbreviations
- CT
computed tomography
- ERP
event‐related potential
- FFA
fusiform face area
- fMRI
functional magnetic resonance imaging
- LO
lateral occipital
- MRI
magnetic resonance imaging
- MT
middle temporal
- OFA
occipital face area
- PPA
parahippocampal place area
- SEEG
stereo‐electroencephalography
INTRODUCTION
The portion of the human visual cortex dedicated to visual form perception and recognition extends from the posterior medial occipital cortex to the anterior temporal cortex [Grill‐Spector and Malach, 2004]. Electrical cortical stimulation studies in epileptic patients have provided important information about the spatial and functional organization of the human visual cortex [e.g., Lee et al., 2000, Murphey et al., 2009, Penfield and Rasmussen, 1957]. Stimulation of the occipital cortex mainly induces elementary hallucinations such as phosphenes (spot of light) or more complex forms (e.g., stars, balls), which are sometimes colored or in motion [Bak et al., 1990, Brindley and Lewin, 1968, Lee et al., 2000, Murphey et al., 2009, Penfield and Jasper, 1954, Penfield and Rasmussen, 1957]. However, stimulations of more anterior sites in the visual cortex are rare, and the few studies published to date have reported discrepant observations. Stimulations of the temporal lobe evoked either complex hallucinations [Ishibashi et al., 1964, Lee et al., 2000, Puce et al., 1999], visual illusions [Lee et al., 2000], or no detectable percept or elementary hallucinations [Murphey et al., 2009]. Likewise, stimulation studies have yielded contradictory results regarding a postero‐anterior hierarchical organization of the visual cortex [DeYoe and Van Essen, 1988; Hubel and Wiesel, 1962, Lee et al., 2000, Murphey et al., 2009]. For instance, Lee et al. (2000) showed an increasing complexity of electrically induced visual phenomena along a postero‐anterior axis. In contrast, Murphey et al. (2009) reported only elementary hallucinations evoked by stimulating equally low‐level and high‐level visual areas defined by fMRI.
Another important issue regarding functional organization of the visual system is its functional hemispheric asymmetry. Studies of split‐brain patients have supported a right hemispheric dominance for visuospatial processing [Corballis, 2003]. Scalp ERP studies have suggested that this asymmetry could be related to the processing of specific material such as abstract pictures or faces [see Maillard et al., 2011; Rossion et al., 2003 respectively]. However, cortical stimulation studies have not addressed this issue of hemispheric lateralization so far [Lee et al., 2000; Murphey et al., 2009].
Here, we report the visual phenomena evoked by a large set of electrical stimulations (562) of the visual cortex, carried out over the past five years in 22 epileptic patients implanted for presurgical delineation of epileptogenic zones and functional mapping of the occipito‐temporal and parietal regions. Importantly, while previous electrical stimulation studies of the visual cortex relied on subdural electrodes on the cortical surface [Lee et al., 2000; Murphey et al., 2009], our approach relies on intracerebral recordings with depth electrodes [Talairach and Bancaud, 1973]. The subdural electrode approach has the advantage of offering an extensive superficial spatial coverage, but has several limitations compared to intracerebral recordings with depth electrodes as used here: (i) electrical fields evoked by subdural electrical stimulations are less focal because of higher intensities of stimulations (usually more than 5 mA), larger electrodes and inter‐electrodes distances, and the spreading of current through cerebrospinal fluid [Nathan et al., 1993]; (ii) subdural electrodes do not allow direct stimulation of deep sulcal cortex; (iii) the sampling of medial structures is difficult and less systematic with subdural electrodes.
In contrast, our investigations were conducted using intracerebral electrodes that provided coverage of all the structures encountered in their trajectories, from their site of penetration to their final impact point [e.g., Jonas et al., 2012; Kahane et al., 2003]. Therefore, electrical stimulations were performed not only within the cortical surface, but also in sulci and medial cortical structures that are essential to visual perception (i.e., calcarine sulcus, precuneus, lingual gyrus). In addition, our procedure was based on intracortical stimulations delivered in bipolar mode through close adjacent contacts (1.5 mm) with low intensities (0.5–2 mA), and so is very effective in producing localized current flows. The effectiveness of this focal low intensity stimulation results partly from the fact that the stimulated contacts are not located on the pia‐arachnoid, but inside the cortex, avoiding shunting of the current through cerebrospinal fluid [Nathan et al., 1993]. In addition, intracerebral stimulations has been shown to produce visual percepts at much lower intensities than subdural grid stimulation [Bak et al., 1990], thus preventing afterdischarges, epileptic discharges, and remote effects.
The main purpose of this study was to explore the functional organization of the visual system by using intracerebral electrical stimulations, with a specific emphasis on hemispheric lateralization and postero‐anterior functional gradient. We analyzed the visual phenomena provoked by intracortical electrical stimulations of the human temporo‐parieto‐occipital cortex. The originality of this study relies on both the use of intracerebral depth electrodes implanted for stereo‐electroencephalography (SEEG) and the similar distribution of electrical stimulations between the left and right hemispheres, allowing comparison of their sensitivity and properties.
MATERIALS AND METHODS
Patients
The study included 22 patients (11 men and 11 women) undergoing intracerebral evaluation (SEEG) for refractory partial epilepsy between 2007 and 2011, in the Epilepsy Unit of the Department of Neurology (University Hospital of Nancy). Inclusion criterion was the presence of intracerebral electrodes implanted in occipital, temporal, or parietal lobes. All 22 patients gave written consent to participate to the study. All patients were right‐handed attested by the Edinburgh Handedness Inventory [Oldfield, 1971]. Mean age at the time of SEEG was 36 years (+/−9). Three out of 22 patients reported visual phenomena during epileptic seizures: two patients presented visual illusions characterized by blurring, with additional change of color in one; one patient reported complex visual hallucinations (e.g., landscape, animals). Eleven out of the 22 patients presented a brain lesion identified by structural MRI. Brain lesions were right hippocampal sclerosis (1 patient), left hippocampal sclerosis (5 patients), left anterior temporal focal dysplasia (1 patient), right temporal lobe schizencephaly (1 patient), left temporal lobe schizencephaly (1 patient), left temporo‐occipital schizencephaly (1 patient), and right occipital focal dysplasia (1 patient). None of the patients, including the two with occipital lesions (i.e., right occipital dysplasia and left temporo‐occipital schizencephaly), had visual field defects.
Stereotactic Placement of Intracerebral Electrodes and SEEG Recording
Intracerebral electrodes (0.8 mm diameter, Dixi Medical, Besançon, France) were stereotactically implanted in the occipito‐temporo‐parietal regions to delineate the epileptogenic zone and to determine the postsurgical neuropsychological outcome [Talairach and Bancaud, 1973]. The electrode implantation sites were chosen according to noninvasive data collected during an earlier phase of the investigation. Stereotactic placement of the intracerebral electrodes, consisting of 5–18 contiguous contacts of 2 mm in length, separated by 1.5 mm, was performed as follows: after induction of general anesthesia, the Leksell G‐frame was positioned on the patient's head and stereotactic MRI was carried out [Maillard et al., 2009]. MRI data was imported into a computer‐assisted stereotactic module and electrode trajectories were calculated according to pre‐operative planning with careful avoidance of vascular structures. The signal was recorded at a 512 kHz sampling rate on a 128 channel amplifier (2 SD LTM 64 Headbox; Micromed, Italy). The reference electrode was a prefrontal medial surface electrode (FPz). Overall 222 intracerebral electrodes (total number of contacts: 2,553) were implanted in the 22 patients, corresponding to 80–140 contacts per patient. Figure 1 illustrates the typical trajectories of electrodes implanted in occipital, temporal and parietal lobes.
Figure 1.
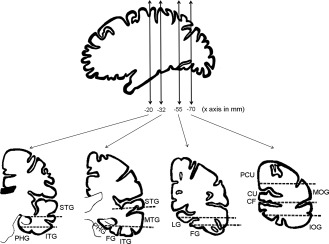
Schematic representation of usual trajectories of depth electrodes implanted in occipital, temporal, and parietal lobes. (IOG: inferior occipital gyrus; MOG: middle occipital gyrus; CU: cuneus; PCU: precuneus; FG: fusiform gyrus; LG: lingual gyrus; ITG: inferior temporal gyrus; MTG: middle temporal gyrus; STG: superior temporal gyrus; PHG: parahippocampal gyrus; CF: calcarine sulcus).
Intracerebral Stimulations
The clinical goal of intracerebral stimulations was to reproduce usual epileptic seizures to map functionally eloquent areas that should be spared during surgery. Bipolar electrical intracerebral stimulations were applied between two contiguous contacts and performed at 50 Hz during 5 s, at intensities ranging from 0.5 to 2 mA. The intensities were set to elicit visual phenomena and other clinical symptoms without afterdischarges (usually between 1 and 1.5 mA). Impulsion was diphasic with 500 µs width on each phase. Patients were sitting in their bed, facing the video camera, with eyes opened.
Depending on the expected clinical response, they were asked either to look at a white wall in front of them, or to perform language and visual recognition tests. These tests comprised naming famous faces, famous scenes, usual objects, and reading words. Patients were not aware of the stimulation onset and termination, the stimulation site, or the potential perceptual changes elicited by stimulation. They were asked to report any symptoms as soon as they experienced them and were immediately questioned on these symptoms. When visual hallucinations were evoked, they were asked to report their color, their form, their motion, and their location in the visual field. When complex visual phenomena were evoked, patients were asked if the visual phenomena comprised a familiar scene or corresponded to a personal memory. Stimulations that produced remote afterdischarges or epileptic discharges were not considered in the analysis. Stimulations that were accompanied by an afterdischarge limited to the immediate vicinity of the stimulated site (i.e., in the same anatomical structure) were included in the analysis.
Overall, the lingual gyrus, cuneus, inferior, middle and superior occipital gyri, fusiform gyrus, parahippocampal gyrus, inferior, middle, and superior temporal gyri, rhinal cortex, and hippocampus were stimulated bilaterally (Table 1). The calcarine sulcus and the precuneus were explored and stimulated only in the right hemisphere because none of the enrolled patients had a presumed seizure onset or early propagation zone in these regions within the left hemisphere.
Table 1.
Number of stimulated sites, number of positive sites (site where a visual phenomenon was evoked), and probability to evoke a visual phenomenon (%) in each anatomical structure
| Anatomical structure | Left Hemisphere | Right Hemisphere | ||||
|---|---|---|---|---|---|---|
| Number of stimulated sites | Number of positive sites | % | Number of stimulated sites | Number of positive sites | % | |
| Calcarine sulcus | 0 | 0 | / | 6 | 4 | 67 |
| Lateral occipital cortex | 2 | 0 | 0 | 14 | 10 | 71 |
| Precuneus | 0 | 0 | / | 4 | 3 | 75 |
| Cuneus/Parieto‐occipital sulcus | 13 | 7 | 54 | 14 | 10 | 71 |
| Lingual gyrus | 12 | 7 | 58 | 12 | 12 | 100 |
| Fusiform gyrus | 45 | 8 | 18 | 40 | 20 | 50 |
| ITG | 37 | 0 | 0 | 13 | 0 | 0 |
| CoS | 8 | 0 | 0 | 10 | 3 | 30 |
| OTS | 14 | 0 | 0 | 10 | 0 | 0 |
| MTG | 27 | 0 | 0 | 17 | 1 | 6 |
| STG | 38 | 0 | 0 | 56 | 1 | 2 |
| PHG | 12 | 0 | 0 | 16 | 4 | 25 |
| Rhinal cortex | 36 | 0 | 0 | 22 | 2 | 9 |
| Hippocampus | 55 | 3 | 6 | 29 | 0 | 0 |
| Total | 299 | 25 | 8 | 263 | 70 | 27 |
CoS: collateral sulcus; ITG: inferior temporal gyrus; MTG: middle temporal gyrus; OTS: occipito‐temporal sulcus; PHG: parahippocampal gyrus; STG: superior temporal gyrus.
Probability of Evoking a Visual Phenomenon
To compare data among patients and to calculate the probability of evoking a visual phenomenon, the coordinates of all stimulated contacts in all patients were normalized and represented within the standard Talairach space [Talairach and Tournoux, 1988]. We calculated the percentage of contacts producing visual phenomena in right and left hemispheres, every 10 mm along the x (medial‐lateral) and y (antero‐posterior) axis, and for each anatomical structure (calcarine sulcus, lingual gyrus, cuneus, lateral occipital cortex precuneus, fusiform gyrus, parahippocampal gyrus, inferior, middle, and superior temporal gyri, rhinal cortex, and hippocampus). For each region, we computed the percentage of “positive sites,” that is, the number of contacts producing visual phenomena divided by the total number of stimulated contacts, multiplied by 100.
Visual Phenomena Quality
Visual phenomena were defined as visual hallucinations, visual illusions or visual perceptive impairments (e.g., prosopagnosia). Hallucinations were classified as follows [Lee et al., 2000]: (i) elementary hallucinations were defined as a spot or a blob; (ii) intermediary hallucinations were defined as geometric forms (e.g., kaleidoscope, square, triangle, star, diamond); (iii) complex hallucinations were defined as meaningful visual hallucinations (e.g., face, landscape, animal, body parts). For all hallucinations, the color, the form, the character of movement and the location in the visual field of the hallucinations were reported. Visual perceptive impairments were defined by a transient inability to name a picture (face, object, or scene) that was not due to a language problem (e.g., prosopagnosia for faces). Dreamy states (i.e., “déjà vécu” and reminiscence) were excluded from our analysis because they may have resulted from disturbance of the autobiographic memory system involving medial temporal structures outside of the visual stream [Vignal et al., 2007]. The precise anatomical locations of the stimulated contacts were provided by coregistration of the postoperative stereotactic CT‐scan and the preoperative MRI for each patient.
Statistical Analyses
To compare stimulation results between the right and left hemispheres, we performed chi‐square analyses or Fisher's exact test for small samples. A P value of <0.05 was considered statistically significant.
RESULTS
Global Results
From a total of 562 stimulated sites in the occipito‐parieto‐temporal cortex (678 stimulations in total), 95 sites evoked a visual phenomenon (125 visual phenomena in total; Fig. 2). Some sites were stimulated several times to ensure that the evoked phenomena were reproduced, but a site was counted only once for analysis in this case. Visual phenomena, which were all reproduced when stimulating several times, were comprised of 104 visual hallucinations (82 sites), 8 visual illusions (8 sites), and 13 visual perceptive impairments (5 sites; Table 2, Fig. 5). Visual hallucinations were classified by quality, resulting in the count of 61 elementary hallucinations (54 sites), 29 intermediary hallucinations (21 sites), and 14 complex hallucinations (7 sites).
Figure 2.
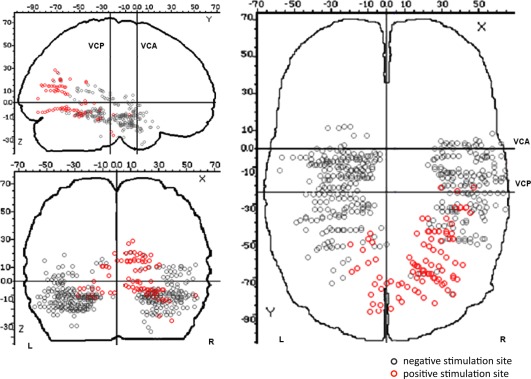
Spatial distribution of positive stimulation sites (i.e., sites where stimulation evoked a visual phenomenon) and negative stimulation sites (i.e., sites where stimulation did not elicit a visual phenomenon) on a schematic brain representation (Talairach and Tournoux coordinates). [Color figure can be viewed in the online issue, which is available at http://wileyonlinelibrary.com.]
Table 2.
Distribution of evoked visual phenomena in function of the stimulated structures and the type of hallucinations
| Anatomical structure | Positive sites for elementary hallucinations | Positive sites for intermediary hallucinations | Positive sites for complex hallucinations | Illusions | Visual perceptive impairments | |||||
|---|---|---|---|---|---|---|---|---|---|---|
| Right | Left | Right | Left | Right | Left | Right | Left | Right | Left | |
| Calcarine sulcus | 2 | / | 2 | / | 0 | / | 0 | / | 0 | / |
| Lateral occipital cortex | 4 | 0 | 4 | 0 | 0 | 0 | 0 | 0 | 2 | 0 |
| Precuneus | 0 | / | 2 | / | 1 | / | 0 | / | 0 | / |
| Cuneus/Parieto‐occipital sulcus | 1 | 7 | 4 | 0 | 5 | 0 | 0 | 0 | 0 | 0 |
| Lingual gyrus | 10 | 5 | 2 | 2 | 0 | 0 | 0 | 0 | 0 | 0 |
| Fusiform gyrus | 10 | 7 | 4 | 1 | 1 | 0 | 2 | 0 | 3 | 0 |
| ITG | 0 | 0 | 0 | 0 | 0 | 0 | 0 | 0 | 0 | 0 |
| CoS | 1 | 0 | 0 | 0 | 0 | 0 | 2 | 0 | 0 | 0 |
| OTS | 0 | 0 | 0 | 0 | 0 | 0 | 0 | 0 | 0 | 0 |
| MTG | 1 | 0 | 0 | 0 | 0 | 0 | 0 | 0 | 0 | 0 |
| STG | 1 | 0 | 0 | 0 | 0 | 0 | 0 | 0 | 0 | 0 |
| PHG | 1 | 0 | 0 | 0 | 0 | 0 | 3 | 0 | 0 | 0 |
| Rhinal cortex | 1 | 0 | 0 | 0 | 0 | 0 | 1 | 0 | 0 | 0 |
| Hippocampus | 0 | 3 | 0 | 0 | 0 | 0 | 0 | 0 | 0 | 0 |
CoS: collateral sulcus; ITG: inferior temporal gyrus; MTG: middle temporal gyrus; OTS: occipito‐temporal sulcus; PHG: parahippocampal gyrus; STG: superior temporal gyrus.
Figure 5.
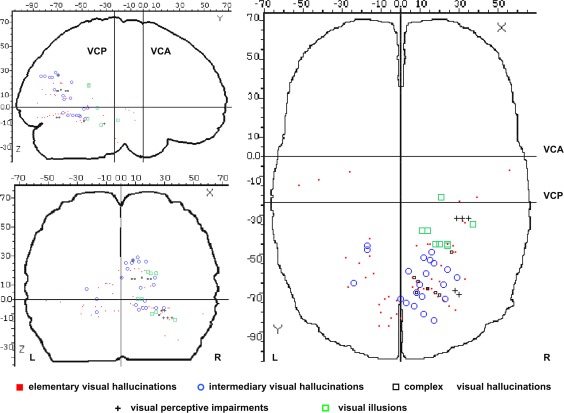
Spatial distribution of types of visual phenomena evoked by stimulation, represented on a schematic brain representation (Talairach and Tournoux coordinates). [Color figure can be viewed in the online issue, which is available at http://wileyonlinelibrary.com.]
Mean intensity of stimulation did not differ between stimulations that produced visual phenomena and those that did not (1.30 mA +/−0.34 vs. 1.26 mA +/−0.35, Student t test, ns.). Additionally, mean intensity of stimulation producing a visual phenomenon did not differ between types of visual phenomena (hallucinations: 1.25 mA +/−0.34; illusions: 1.51 mA +/−0.23; visual perceptive impairments: 1.3 mA +/−0.4; Student t test, ns.). All 22 patients presented either transient anomia/alexia from stimulating the left temporo‐basal cortex or no anomia/alexia from stimulating the right temporo‐basal cortex, thus reflecting their left hemispheric dominance for language.
Probability of Evoking a Visual Phenomenon
Overall, the probability of evoking a visual phenomenon was significantly higher in the right (70/263, 26.6%) than in the left hemisphere (25/299, 8.4%), irrespective of the distance to the occipital pole, along a postero‐anterior axis (χ2 test, P < 0.0001) and in each stimulated anatomical structure (Table 1, Figs. 2, 3, 4, 5). Mean intensity of stimulation producing a visual phenomenon did not differ between the right and left hemispheres (1.29 mA +/−0.27 vs. 1.27 mA +/−0.36, respectively; Student t test, ns.). There was a striking relationship between the position of the contacts along the postero‐anterior axis (y‐axis) and medio‐lateral axis (x‐axis) and the probability to evoke a visual phenomenon: the probability to evoke visual phenomena dramatically decreased with increasing distance from the occipital pole along the postero‐anterior axis (y‐axis; Fig. 3). This decrease was more pronounced in the left hemisphere than in the right hemisphere. Along the medio‐lateral axis (x‐axis), the probability to evoke visual phenomena was maximal in the medial part of both hemispheres and decreased laterally (Fig. 4). Again, this decrease was more pronounced in the left than in the right hemisphere.
Figure 3.
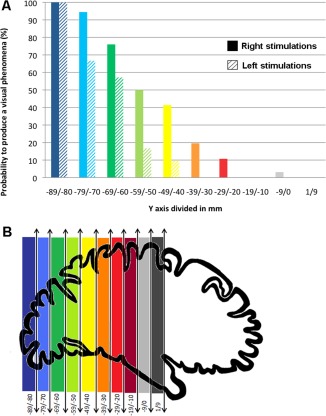
Probability to produce a visual phenomenon along the posterior‐anterior (y) axis. [Color figure can be viewed in the online issue, which is available at http://wileyonlinelibrary.com.]
Figure 4.
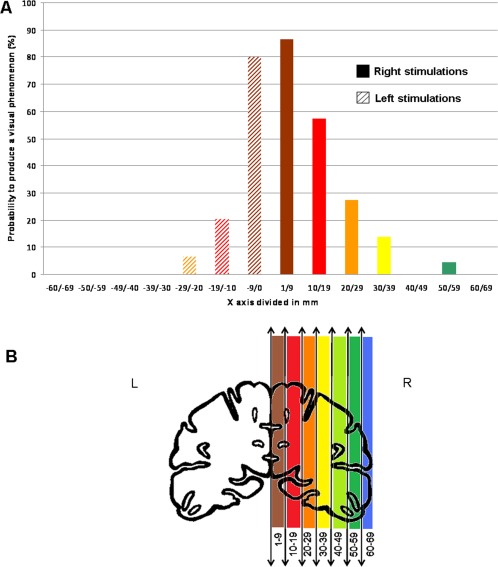
Probability to produce a visual phenomenon along the medial‐lateral (x) axis. [Color figure can be viewed in the online issue, which is available at http://wileyonlinelibrary.com.]
To ensure that this right predominance was not related to a lack of sampling in critical visual regions in the left hemisphere, we defined three volumes of interest in the right hemisphere that were highly sensitive to stimulations and we considered the corresponding volumes in the left hemisphere. Based on the visual analysis of Figure 2, we defined the Talairach coordinates of three volumes in the right hemisphere: one in the medial occipital cortex, one in the ventral occipito‐temporal cortex and one in the anterior temporal cortex. We then defined the corresponding volumes in the left hemisphere that were symmetric according to the y‐axis. Results are shown in Table 3. There was an undersampling of the left medial occipital cortex compared to the right (13 vs. 38), so no conclusion about lateralization effects could be drawn for this region (Fisher's exact test: P = 0.3). However, there was an equivalent sampling of more anterior critical regions (ventral occipito‐temporal cortex: 35 vs. 36; anterior temporal cortex: 77 vs. 78), and for both regions the proportion of evoked visual phenomena was significantly larger in the right than in the left hemisphere (ventral occipito‐temporal cortex, χ2 = 7.3, P = 0.007; anterior temporal cortex, Fisher's exact test: P = 0.003). Therefore, with the exception of the medial occipital cortex, the right hemisphere predominance cannot be accounted for by a lack of sampling of left hemisphere critical regions.
Table 3.
Number of stimulated sites, number of positive sites (site where a visual phenomenon was evoked), and probability to evoke a visual phenomenon (%) in each defined volume: in the medial occipital cortex (x: 0/±30; y: −90/−60; z: −10/30), in the ventral occipito‐temporal cortex (x: ±10/±40; y: −60/−35; z: −20/0), and in the anterior temporal cortex (x: ±20/±50; y: −35/−10; z: −30/0)
| Left Hemisphere | Right Hemisphere | |||||
|---|---|---|---|---|---|---|
| Number of stimulated sites | Number of positive sites | % | Number of stimulated sites | Number of positive sites | % | |
| Anterior temporal cortex | 77 | 0 | 0% | 78 | 9 | 11% |
| Ventral occipito‐temporal cortex | 35 | 6 | 17% | 36 | 17 | 47% |
| Medial occipital cortex | 13 | 13 | 100% | 45 | 38 | 84% |
Visual Phenomena Quality
Visual hallucinations
The spatial distribution of the types of hallucinations evoked by stimulation is shown in Figure 5 and Table 2. Eighty‐five percent of elementary hallucinations were induced by stimulating the calcarine sulcus, the lingual gyrus, the lateral occipital cortex, the fusiform gyrus and the cuneus/parieto‐occipital sulcus (46/54 sites). All intermediary hallucinations were induced by stimulating the same structures as those eliciting elementary hallucinations (21/21 sites). However, compared to elementary hallucinations, intermediary hallucinations were evoked at more anterior sites in infra‐calcarine occipital structures and in the ventral temporal region (Fig. 5). Complex hallucinations were hallucinations of faces induced by stimulating the cuneus/parieto‐occipital sulcus (5/7 sites), the precuneus (1/7 sites) and the fusiform gyrus (1/7 sites).
Most elementary and intermediary hallucinations were colored and moving. There were only few sites on which motionless (4/75, 5%) or colorless (15/75, 20%) elementary and intermediary hallucinations were evoked. Elementary and intermediary hallucinations were all located in the contralateral visual hemifield of the stimulation side, except those elicited by stimulations of the calcarine sulcus, which were located in the center of the visual field.
Visual illusions
Eight visual illusions were produced at eight different sites, all characterized by a change of color or by a spatial modification of the visual background. Illusions were all elicited by stimulating the right hemisphere, in the rhinal cortex, parahippocampal gyrus, collateral sulcus, and fusiform gyrus (see Fig. 5).
Visual perceptive impairments
We evoked transient impairment in two patients exclusively by stimulating the right hemisphere. In both patients, the impairments consisted of transient prosopagnosia [i.e., specific impairment of face recognition; Bodamer, 1947; Busigny et al., 2010] during stimulation. This was found by asking these two patients to name photographs of famous faces, famous scenes, and usual objects, before, during, and after stimulations [the full procedure is described in Jonas et al., 2012]. Prosopagnosia was evoked by the stimulation of the right inferior occipital gyrus in the first patient (reproduced six times at two sites of stimulation) and by the stimulation of the right middle fusiform gyrus in the second patient (reproduced seven times at three sites of stimulation). The patients were unable to name famous faces, whereas they were able to recognize objects and famous scenes during stimulation of these sites. Prosopagnosia completely recovered immediately upon termination of the stimulation. The first patient (K.V.) is fully described in Jonas et al. (2012). The stimulated site was located in a high‐level visual area involved in face perception in the right inferior occipital gyrus (right “occipital face area,” right OFA) as defined by fMRI and intracerebral ERPs. For the second patient, face sensitive ERPs were recorded on the stimulated sites (manuscript in preparation, data not shown here).
Spatial Organization of Visual Phenomena Types
Visual analysis of the spatial organization of visual phenomena evoked from the infra‐calcarine occipital structures to the ventral temporal region (z < 0 mm) showed a trend toward a postero‐anterior gradient (Fig. 5) with a predominance of elementary hallucinations at the most posterior sites, a mix of elementary and intermediary hallucinations more anteriorly and illusions at the most anterior sites in the temporo‐basal cortex. However, the location of the stimulated sites along the antero‐posterior axis (x‐axis) did not differ between the three different qualities of evoked visual phenomena (one‐way ANOVA, F 2,48 = 1.29; P = 0.28). No spatial organization was found for visual phenomena evoked from the supra‐calcarine occipital structures to the parietal region (z > 0 mm). However, there were few depth electrodes implanted in these structures.
The right hemispheric predominance was more pronounced for complex visual phenomena (Fig. 6). Elementary hallucinations were evoked with a slight right predominance but with no statistical significance (32 positive sites in the right hemisphere vs. 22 in the left hemisphere, χ2 = 3.7, P = 0.053). Intermediary hallucinations showed a significant right predominance (18 positive sites in the right hemisphere vs. 3 in the left hemisphere, Fisher's exact test: P < 0.001). Complex hallucinations, illusions, and visual perceptive impairments were exclusively evoked by stimulating the right hemisphere (20 positive sites in the right hemisphere vs. 0 in the left hemisphere, Fisher's exact test: P < 0.0001).
Figure 6.
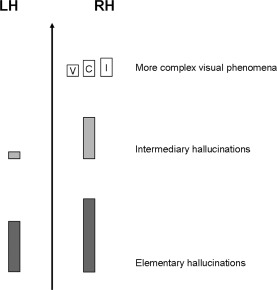
Schematic representation of the number of visual phenomena evoked in the left and right hemispheres along a gradient of complexity (LH: left hemisphere, RH: right hemisphere, V: visual perceptive impairments, C: complex hallucinations, I: illusions). The number of visual phenomena is represented by the height of the bars.
DISCUSSION
Taken altogether, our data showed a general organization of evoked visual phenomena consisting of: (i) a decreasing probability to evoke visual phenomena along the posterior‐anterior axis; (ii) a trend towards posterior‐anterior gradient in terms of complexity of visual phenomena; and (iii) a clear functional hemispheric asymmetry with right hemisphere predominance. The right visual cortex showed a greater sensitivity to electrical stimulation for each stimulated structure and each type of evoked visual phenomenon, except for occipital medial structures and elementary visual phenomena. Moreover, this hemispheric asymmetry increased along the postero‐anterior axis: the decreasing probability to evoke a visual phenomenon along the postero‐anterior axis was less pronounced in the right hemisphere, and the right hemispheric predominance was significant for complex and intermediary but not for elementary visual phenomena.
Hierarchical Organization of the Visual System
Our observations suggest that there is a posterior‐anterior gradient regarding visual phenomena quality in the ventral visual pathway (i.e., infracalcarine occipital structures to the ventral temporal region). Intermediary hallucinations were roughly localized anteriorly to elementary hallucinations, and illusions were all localized anteriorly to intermediary hallucinations. Although it was not statistically significant because of low statistical power, these observations are consistent with a previous stimulation study that showed a postero‐anterior distribution of simple, intermediate, and complex forms, respectively [Lee et al., 2000]. Overall, these observations are consistent with a hierarchical organization of visual areas along the occipito‐temporal pathway in which visual information is first represented in a localized and simple form, and is then transformed into more complex representations through a sequence of processes [DeYoe and Van Essen, 1988; Grill‐Spector and Malach, 2004; Hubel and Wiesel, 1962].
Our results showed a decreasing probability of eliciting visual phenomena from posterior to anterior sites. This decrease may arise from a postero‐anterior gradient in the functional connectivity of visual areas. The greater sensitivity to electrical stimulation of posterior and low‐level visual areas might be related to their greater extrinsic connectivity compared to anterior, higher level visual areas [Murphey et al., 2009; Tolias et al., 2005]. However, compared to a previous stimulation study [Murphey et al., 2009], our study showed qualitative differences between visual percepts evoked by the stimulation of posterior, as opposed to anterior, sites: the increasing complexity of evoked visual phenomena along the posterior‐anterior axis paralleled the decreasing probability to evoke visual phenomena. Altogether, these results support the view of a hierarchical posterior‐anterior organization of visual system.
Right Hemispheric Predominance
The most original and important observation of the present study is the greater sensitivity to electrical stimulation found in the right hemisphere, compared to the left hemisphere, from the ventral occipito‐temporal cortex to more anterior temporal regions (Figs. 2 and 5). The probability of evoking a visual phenomenon was significantly higher in the right than the left hemisphere, except for the medial occipital cortex. Intermediary hallucinations were predominantly elicited by right hemisphere stimulation, whereas complex hallucinations, illusions, and visual perceptive impairments were elicited exclusively by right hemisphere stimulation (Figs. 5 and 6).
This right hemispheric predominance of electrically evoked visual phenomena has scarcely been reported in previous studies, and then only for visual illusions [Mullan and Penfield, 1959]. Interestingly, epileptic complex visual hallucinations (e.g., faces, objects, bodies) or illusions were also reported to be associated with a right epileptic focus in a retrospective study of medically intractable occipital epilepsy [Salanova et al., 1992]. In most previous visual cortex stimulation studies, this functional hemispheric asymmetry has not been specifically addressed [Lee et al., 2000; Lesser et al., 1998; Murphey et al., 2009]. Our original observations can be tentatively related to the use of depth electrodes, as opposed to subdural electrodes used in previous studies. Depth electrodes indeed allow eliciting phenomena with low stimulation intensities (mean intensity of 1.29 mA, as compared to 4.75 mA in Lee et al., (2000), for instance). Thus, the depth electrode approach is very effective in producing localized low intensity current flows, preventing afterdischarges and spread to homologous contralateral sites through corpus callosum connections.
The increased sensitivity of the right hemisphere to produce electrically induced visual phenomena is consistent with the long‐standing view of right hemisphere specialization in processing visual or nonverbal stimuli [Jackson, 1874]. This view has been supported by studies of patients with temporal lobe damage or surgical resection [Kimura, 1963, 1966; Milner, 1958], occipito‐temporo‐parietal damage [Humphreys and Riddoch, 1984; Warrington and Taylor, 1978; Warrington, 1982] and studies of split‐brain patients [Bogen and Gazzaniga, 1965, Gazzaniga et al., 1965]. More specifically, the right hemisphere would be superior to the left in visual tasks requiring spatial judgment [Corballis et al., 2002; Funnel et al., 1999] or spatial attention [for a review see Karim and Kojima, 2010]. However, this right hemispheric general superiority in visuospatial processing or in spatial attention cannot easily account for its greater sensitivity to evoke visual phenomena, because: (i) during electrical stimulation, patients were not engaged in spatial or attentional tasks; (ii) evoked visual phenomena were described by the patients as vivid and clear after stimulation of both hemispheres, making it very unlikely that the right predominance resulted from an attentional bias; and (iii) the greater sensitivity of the right hemisphere to evoke visual phenomena was reported for several anatomical structures and for very different types of visual phenomena, suggesting that this greater sensitivity of the right hemisphere reflects the general function of the visual system, rather than a specific involvement of visuospatial processes.
Hemispheric asymmetry also increased along the posterior‐anterior axis. The decreasing probability of evoking a visual phenomenon along the posterior‐anterior axis was indeed less pronounced in the right hemisphere and paralleled the right hemispheric predominance for more complex visual phenomena. These results suggest a progressive and increasing postero‐anterior specialization of the right hemisphere in visual processing from the occipito‐temporal ventral cortex to the more anterior temporal areas.
These results are consistent with the view that asymmetries in visual processing are likely to arise relatively late in the visual system, and in areas with bilateral receptive fields. ‘‘Low‐level’’ or ‘‘early’’ visual areas are constituted of neurons with small receptive fields, responding to spatially limited visual stimuli localized in the contralateral visual hemifield. These receptive fields get progressively larger and more bilateral in “higher‐level” and more anterior visual areas. At early levels of processing, in each hemisphere, the representation of the contralateral visual field is unique; therefore, asymmetries in early visual processing are unlikely to arise. At higher level of processing, the representation of the visual field is redundant in both hemispheres. At these higher stages, visual representations might therefore be favored in one hemisphere (for instance in the right) over the other. This right hemispheric dominance at higher levels of processing is also reflected by the larger amplitude of visual evoked potential over the right ventral occipito‐temporal region between 150 and 200 ms during face or abstract pictures processing [Maillard et al., 2011; Rossion et al., 2003].
Face‐Selective Regions
We evoked specific visual perceptive impairments (i.e., prosopagnosia, impairment in face recognition) during stimulation of face‐sensitive areas in two patients. The first patient (K.V.) is fully described in Jonas et al. (2012). In that article, we showed that transient prosopagnosia was induced by stimulating a high‐order visual area involved in face perception in the right inferior occipital gyrus (right OFA). This observation indicated that a specific process (here, face recognition) could be selectively disrupted by stimulating a high‐order and functionally specific visual area. In a second patient, we also induced transient prosopagnosia by stimulating a face sensitive site localized in the right middle fusiform gyrus. Previous electrical stimulation studies that did not use specific visual stimuli during stimulations have not found visual perceptive impairments during stimulations of anterior sites in the temporal lobe or functionally defined high‐level areas [Lee et al., 2000; Lesser et al., 1998; Murphey et al., 2009]. In particular, Murphey et al. (2009) reported only elementary visual hallucinations, even after stimulation of fMRI‐defined high‐level areas (V8, MT, PPA, FFA, LO). Our study shows that presenting real face stimuli during electrical cortical stimulations allows the establishment of a causal relationship between face‐selective regions and face perception.
CONCLUSIONS
Overall, our depth electrode stimulation study contributes to the understanding of the functional organization of the human visual cortex, as reflected by its heterogeneous but organized sensitivity to electrical stimulation. Specifically, we found a clear right hemispheric functional predominance that cannot easily be accounted for by a task‐related or a material‐specific bias. Rather, this right hemispheric dominance seems to reflect the general function of the visual system.
Jacques Jonas and Solène Frismand equally contributed to the study.
REFERENCES
- Bak M, Girvin JP, Hambrecht FT, Kufta CV, Loeb GE, Schmidt EM (1990): Visual sensations produced by intracortical microstimulation of the human occipital cortex. Med Biol Eng Comput 28:257–259. [DOI] [PubMed] [Google Scholar]
- Bodamer J (1947): Die Prosop‐Agnosie. Arch Psychiatr Nervenkr Z Gesamte Neurol Psychiatr 118:6–53. [DOI] [PubMed] [Google Scholar]
- Bogen JE, Gazzaniga MS (1965): Cerebral commissurotomy in man: Minor hemisphere dominance for certain visuospatial functions. J Neurosurg 23:394–399. [Google Scholar]
- Brindley GS, Lewin WS (1968): The sensations produced by electrical stimulation of the visual cortex. J Physiol (Lond) 196:479–493. [DOI] [PMC free article] [PubMed] [Google Scholar]
- Busigny T, Joubert S, Felician O, Ceccaldi M, Rossion B (2010): Holistic perception of the individual face is specific and necessary: Evidence from an extensive case study of acquired prosopagnosia. Neuropsychologia 48:4057–4092. [DOI] [PubMed] [Google Scholar]
- Corballis PM (2003): Visuospatial processing and the right‐hemisphere interpreter. Brain Cogn 53:171–176. [DOI] [PubMed] [Google Scholar]
- Corballis PM, Funnell MG, Gazzaniga MS (2002): Hemispheric asymmetries for simple visual judgments in the split brain. Neuropsychologia 40:401–410. [DOI] [PubMed] [Google Scholar]
- DeYoe EA, Van Essen DC (1988): Concurrent processing streams in monkey visual cortex. Trends Neurosci 11:219–226. [DOI] [PubMed] [Google Scholar]
- Funnell MG, Corballis PM, Gazzaniga MS (1999): A deficit in perceptual matching in the left hemisphere of a callosotomy patient. Neuropsychologia 37:1143–1154. [DOI] [PubMed] [Google Scholar]
- Gazzaniga MS, Bogen JE, Sperry RW (1965): Observations on visual perception after disconnection of the cerebral hemispheres in man. Brain 88:221–236. [DOI] [PubMed] [Google Scholar]
- Grill‐Spector K, Malach R (2004): The human visual cortex. Annu Rev Neurosci 27:649–677. [DOI] [PubMed] [Google Scholar]
- Hubel DH, Wiesel TN (1962): Receptive fields, binocular interaction and functional architecture in the cat's visual cortex. J Physiol 160:106–154. [DOI] [PMC free article] [PubMed] [Google Scholar]
- Humphreys GW, Riddoch MJ (1984): Routes to object constancy: Implications from neurological impairments of object constancy. Q J Exp Psychol A 36:385–415. [DOI] [PubMed] [Google Scholar]
- Ishibashi T, Hori H, Endo K, Sato T (1964): Hallucinations produced by electrical stimulation of the temporal lobes in schizophrenic patients. Tohoku J Exp Med 82:124–139. [DOI] [PubMed] [Google Scholar]
- Jackson JH (1874): On the nature of the duality of the brain. Medical Press Cricular 1:19–63. [Google Scholar]
- Jonas J, Descoins M, Koessler L, Colnat‐Coulbois S, Sauvée M, Guye M, Vignal JP, Vespignani H, Rossion B, Maillard L (2012): Focal electrical intracerebral stimulation of a face‐sensitive area causes transient prosopagnosia. Neuroscience 222:281–228. [DOI] [PubMed] [Google Scholar]
- Kahane P, Hoffmann D, Minotti L, Berthoz A (2003): Reappraisal of the human vestibular cortex by cortical electrical stimulation study. Ann Neurol 54:615–624. [DOI] [PubMed] [Google Scholar]
- Karim AK, Kojima H (2010): The what and why of perceptual asymmetries in the visual domain. Adv Cogn Psychol 6:103–115. [DOI] [PMC free article] [PubMed] [Google Scholar]
- Kimura D (1963): Right temporal‐lobe damage: Perception of unfamiliar stimuli after damage. Arch Neurol 8:264–271. [DOI] [PubMed] [Google Scholar]
- Kimura D (1966): Dual functional asymmetry of the brain in visual perception. Neuropsychologia 4:275–285. [Google Scholar]
- Lee HW, Hong SB, Seo DW, Tae WS, Hong SC (2000): Mapping of functional organization in human visual cortex: electrical cortical stimulation. Neurology 54:849–854. [DOI] [PubMed] [Google Scholar]
- Lesser RP, Arroyo S, Crone N, Gordon B (1998): Motor and sensory mapping of the frontal and occipital lobes. Epilepsia 39 Suppl 4:S69–80. [DOI] [PubMed] [Google Scholar]
- Maillard L, Koessler L, Colnat‐Coulbois S, Vignal JP, Louis‐Dorr V, Marie PY, Vespignani H (2009): Combined SEEG and source localisation study of temporal lobe schizencephaly and polymicrogyria. Clin Neurophysiol 120:1628–1636. [DOI] [PubMed] [Google Scholar]
- Maillard L, Barbeau E, Baumann C, Koessler L, Bénar C, Chauvel P, Liegeois‐Chauvel C (2011): From perception to recognition memory: Time course and lateralization of neural substrates of word and abstract picture processing. J Cogn Neurosci 23:782–800. [DOI] [PubMed] [Google Scholar]
- Milner B (1958): Psychological defects produced by temporal lobe excision. Proc Ass Res Nerv Ment Dis 36:244–257. [PubMed] [Google Scholar]
- Mullan S, Penfield W (1959): Illusions of comparative interpretation and emotion; production by epileptic discharge and by electrical stimulation in the temporal cortex. AMA Arch Neurol Psychiatry 81:269–284. [PubMed] [Google Scholar]
- Murphey DK, Maunsell JH, Beauchamp MS, Yoshor D (2009): Perceiving electrical stimulation of identified human visual areas. Proc Natl Acad Sci U S A 106:5389–5393. [DOI] [PMC free article] [PubMed] [Google Scholar]
- Nathan SS, Sinha SR, Gordon B, Lesser RP, Thakor NV (1993): Determination of current density distributions generated by electrical stimulation of the human cerebral cortex. Electroencephalogr Clin Neurophysiol 86:183–192. [DOI] [PubMed] [Google Scholar]
- Oldfield RC (1971): The assessment and analysis of handedness: The Edinburgh inventory. Neuropsychologia 9:97–113. [DOI] [PubMed] [Google Scholar]
- Penfield W, Jasper H. 1954. Epilepsy and the functional anatomy of the human brain. Boston: Little, Brown. [Google Scholar]
- Penfield WR, Rasmussen T. 1957. The Cerebral Cortex of Man: A Clinical Study of Localization of Function. New York: Macmillan. [Google Scholar]
- Puce A, Allison T, McCarthy G (1999): Electrophysiological studies of human face perception. III: Effects of top‐down processing on face‐specific potentials. Cereb Cortex 9:445–458. [DOI] [PubMed] [Google Scholar]
- Rossion B, Joyce CA, Cottrell GW, Tarr MJ (2003): Early lateralization and orientation tuning for face, word, and object processing in the visual cortex. Neuroimage 20:1609–1624. [DOI] [PubMed] [Google Scholar]
- Salanova V, Andermann F, Olivier A, Rasmussen T, Quesney LF (1992): Occipital lobe epilepsy: Electroclinical manifestations, electrocorticography, cortical stimulation and outcome in 42 patients treated between 1930 and 1991. Surgery of occipital lobe epilepsy. Brain 115:1655–1680. [DOI] [PubMed] [Google Scholar]
- Talairach J, Bancaud J (1973): Stereotaxic approach to epilepsy: Methodology of anatomo‐functional stereotactic investigations. Prog Neurol Surg 5:297–354. [Google Scholar]
- Talairach J, Tournoux P. 1988. Coplanar stereotaxic atlas of the human brain: 3‐dimensional proportional system: An approach to cerebral imaging. Stuttgart: Thieme. [Google Scholar]
- Tolias AS, Sultan F, Augath M, Oeltermann A, Tehovnik EJ, Schiller PH, Logothetis NK (2005): Mapping cortical activity elicited with electrical microstimulation using FMRI in the macaque. Neuron 48:901–911. [DOI] [PubMed] [Google Scholar]
- Vignal JP, Maillard L, McGonigal A, Chauvel P (2007): The dreamy state: Hallucinations of autobiographic memory evoked by temporal lobe stimulations and seizures. Brain 130:88–99. [DOI] [PubMed] [Google Scholar]
- Warrington EK (1982): Neuropsychological studies of object recognition. Philos Trans R Soc Lond B Biol Sci 298:15–33. [DOI] [PubMed] [Google Scholar]
- Warrington EK, Taylor AM (1978): Two categorical stages of object recognition. Perception 7:695–705. [DOI] [PubMed] [Google Scholar]