Abstract
Surface deformation‐based analysis was used to assess local shape variations in the hippocampi and caudate nuclei of children with fetal alcohol spectrum disorders. High‐resolution structural magnetic resonance imaging images were acquired for 31 children (19 controls and 12 children diagnosed with fetal alcohol syndrome/partial FAS). Hippocampi and caudate nuclei were manually segmented, and surface meshes were reconstructed. An iterative closest point algorithm was used to register the template of one control subject to all other shapes in order to capture the true geometry of the shape with a fixed number of landmark points. A point distribution model was used to quantify the shape variations in terms of a change in co‐ordinate positions. Using the localized Hotelling T2 method, regions of significant shape variations between the control and exposed subjects were identified and mapped onto the mean shapes. Binary masks of hippocampi and caudate nuclei were generated from the segmented volumes of each brain. These were used to compute the volumes and for further statistical analysis. The Mann–Whitney test was performed to predict volume differences between the groups. Although the exposed and control subjects did not differ significantly in their volumes, the shape analysis showed the hippocampus to be more deformed at the head and tail regions in the alcohol‐exposed children. Between‐group differences in caudate nucleus morphology were dispersed across the tail and head regions. Correlation analysis showed associations between the degree of compression and the level of alcohol exposure. These findings demonstrate that shape analysis using three‐dimensional surface measures is sensitive to fetal alcohol exposure and provides additional information than volumetric measures alone. Hum Brain Mapp 35:659–672, 2014. © 2012 Wiley Periodicals, Inc.
Keywords: surface deformation, shape analysis, fetal alcohol syndrome, hippocampus, caudate nucleus
INTRODUCTION
Fetal alcohol syndrome (FAS) is the most severe of the fetal alcohol spectrum disorders (FASD) and is caused by chronic high‐level maternal alcohol consumption during pregnancy. It is estimated to be the most common noninherited cause of learning disability worldwide. Diagnosis is based on the presence of a characteristic facial dysmorphology, small head circumference, and prenatal and/or postnatal growth retardation [Manning and Hoyme, 2007]. The term FASD was introduced to depict the full spectrum of outcomes observed among individuals with prenatal alcohol exposure [Astley, 2004]. FASD is a significant worldwide health problem and a particularly critical public health issue in South Africa. In affected communities, there is an unusually high incidence of alcohol abuse among women of child‐bearing age [Jacobson et al., 2008] and one of the highest incidences of FAS in the world [May et al., 1996, 2000]. Magnetic resonance imaging (MRI) offers noninvasive methods for in vivo assessment of morphometric abnormalities that may be associated with FAS [Bookstein et al., 2002; Mattson et al., 1996; Sowell et al., 2001b].
MRI studies of children and adults with FASD have demonstrated disproportionately smaller cerebellum, parietal lobe, caudate nucleus, and corpus callosum. Abnormalities of white‐matter volumes have also been observed in subjects with FASD [Archibald et al., 2001]. Shape abnormalities have been noted in white‐matter structures, such as the corpus callosum [Bookstein et al., 2001; Sowell et al., 2001a]. In subjects with severe alcohol exposure, computed tomography and MRI studies have shown reduced gray and white‐matter volumes, with marked losses in the frontal lobes, medial temporal regions, parietal cortices, subcortical structures (thalamus, caudate, and lenticular nuclei), and in the cerebellar cortex [Sullivan et al., 2003]. Thinning of the corpus callosum [Pfefferbaum et al., 1996], reduced volume of the pons [Sullivan et al., 2003], and the cerebellar vermis [Sullivan et al., 2000] have also been reported. A better understanding of the neural manifestations of prenatal alcohol exposure may inform future interventions targeted toward particular neural systems, allowing for a better understanding of the behavioral patterns observed in affected children, and potentially aid in diagnosis.
In the recent years, a number of unbiased, objective techniques have been developed to characterize neuroanatomical differences in vivo using structural magnetic resonance images. In addition to volumetric studies, these techniques can be broadly classified into those that deal with macroscopic differences in brain shape and those that examine the local composition of brain tissue after macroscopic differences such as brain size have been discounted. The former, which includes deformation‐based morphometry, characterizes the neuroanatomy of any individual brain in terms of deformation fields that map each brain to a standard reference. The latter, which includes voxel‐based morphometry, compares different brains on a voxel‐by‐voxel basis after the deformation fields have been used to spatially normalize the images [Wright et al., 1995].
Several prior studies have used computational approaches to identify subtle changes in the shape of cerebral (sub)structures linked with disease progression. For example, a surface deformation‐based approach using normal distances from a center line to the hippocampal (HC) surface was used as a compact representation to compare three‐dimensional (3D) shapes in subjects with schizophrenia by Narr et al. 2007 and a similar approach to quantify structural alterations of the corpus callosum. For a group of HC surfaces, medial models may not have the same topology because of their sensitivity to small variations on the surface. Because of the variability of HC surfaces, no consensus has been reached on the topology of the medial model that perfectly represents the HC surface [Yonggang et al., 2007]. Statistical deformation modeling [Rueckert et al., 2003] is a closely related method, in which voxel‐wise comparisons are made using deformation fields. A number of additional shape descriptors have been proposed for use in medical image analysis. They can be classified into several broad families, such as landmarks [Bookstein, 1997], dense surface meshes [Kelemen et al., 1997], skeleton‐based representations [Golland et al., 1999], deformation fields that define a warping of a standard template to a particular input shape [Machado and Gee, 1998], and distance transforms that embed the outline of the object in a higher dimensional distance function over the image [Golland et al., 2000].
Shape analysis has gained importance in the neuroimaging community due to its potential to precisely locate regions where morphological differences exist between healthy and pathological structures [Styner et al., 2004]. There is increasing evidence that shape analysis of brain structure provides new information that is not available through conventional volumetric measurements [Gerig et al., 2001]. A point distribution model (PDM) describes shape variability across a set of training structures by quantifying variations in the positions of sets of corresponding landmark points [Cootes et al., 1995]. The modes of variation are obtained through principal component analysis of the covariance matrix of landmark coordinates. Since their introduction, PDMs have been applied to various anatomical structures like the vertebrae [Kaus et al., 2003], femur [Fleute et al., 1999], and brain structures [Duta and Sonka, 1997].
Shen et al. 2003 used a surface‐based approach for the classification of 3D neuroanatomical structures, which has the following advantages: first, compared to the image‐based approaches, surface‐based approaches can be applied in more general situations where a surface is not embedded in an image but defined in another way such as segmented boundaries or triangulations; second, for a 3D volumetric object, its boundary or surface actually defines the shape, and so surface‐based representation may be more appropriate to study the shape unless the appearance or tissue inside the object is also the focus of interest; third, some noisy steps like resampling in the voxel‐based analysis can be avoided [Shen et al., 2004]. To accurately model structural shapes and their possible variations, statistical shape analysis using a surface‐based approach has become a major research topic in computer vision in the recent years. Because these methods have rarely been applied to the study of FAS and may reveal unique aspects of neuropathology, surface‐based deformation techniques were used in the present study to analyze the shape variations of manually segmented MRI brain structures, specifically the hippocampus and caudate nucleus, which have been previously implicated in studies of FASD.
METHODS
Subjects
A total of 31 right‐handed children (21 girls and 10 boys, mean age 11.6 ± 1.2 years, 19 controls and 12 with FAS or partial FAS) were recruited from the Cape Coloured (mixed ancestry) community in Cape Town, South Africa, and were of similar socioeconomic status [Meintjes et al., 2010]. The mother of each child was interviewed regarding her alcohol consumption using a timeline follow‐back approach to determine incidence and amount of drinking on a day‐by‐day basis during a typical 2‐week period in pregnancy [Jacobson et al., 2011]. All children were assessed on an extensive neurobehavioral battery, so that the performance measures on these tasks, IQ, and alcohol exposure were available. All parents/guardians provided written informed consent and their children provided oral assent. Protocols were approved by the Human Investigation Committee of Wayne State University and the Faculty of Health Sciences Human Research Ethics Committee at the University of Cape Town, South Africa.
MR Imaging Acquisition Protocol
All children were scanned with a 3T Allegra MRI scanner (Siemens, Erlangen, Germany) at the Cape Universities Brain Imaging Centre with a single‐channel head coil for signal intensity amplification. Stability of a high‐signal‐to‐noise ratio was ensured through a daily automated quality‐control procedure. High‐resolution anatomical T1‐weighted 3D structural images were acquired in the sagittal plane using a magnetization‐prepared rapid gradient echo sequence with the following parameters: TR = 2,300 ms, TE = 3.93 ms, TI = 1,100 ms, 160 slices, flip angle = 12°, voxel size = 1.3 × 1.0 × 1.0 mm3, and scan time = 6:03 min.
MR Image Preprocessing and Segmentation
After acquisition, the isovoxeled MRI data were rotated into the AC–PC plane using Brain Voyager. The hippocampi and caudate nuclei were manually delineated using MultiTracer [Woods, 2003] software by an expert neuroanatomist (CW). Contours were drawn initially in the sagittal plane, where the hippocampus is most clearly visible. Using this as a reference, boundaries of the hippocampus were subsequently traced on coronal MR images according to a standard neuroanatomic atlas of the hippocampus [Juergen et al., 2007]. The delineation of the hippocampus included the cornu ammonis and the portion posterior to the crus of the fornix. The subiculum was excluded. For caudate nuclei, the boundaries were delineated on the coronal slices. The inferior boundary of the head of the caudate nuclei was defined by a line drawn from the inferior tip of the lateral ventricle to the inferior border of the internal capsule. Thus, the ventral striatum was not included in the measurement. At the posterior end, the tail becomes ill‐defined as it curves inferiorly next to the crus of the fornix. Anatomic landmarks were labeled and linked in all three orthogonal viewing planes using MultiTracer software. Tracings were drawn on magnification level four. This process took ∼1 h per scan (for left and right hippocampi and caudate nuclei). Intrarater reliability analyses were performed by retracing a random selection of 10 samples at a later date. To determine reliability, we calculated intraclass correlation coefficients (ICC) for the absolute agreement of the two volume measurements. The ICC values were found to be greater than 0.97 for both the hippocampi and caudate nuclei. The correlations between the volumes determined manually and automated segmentation using Free Surfer were found to be 0.84 for right and left hippocampus and 0.89 for both the hemispherical volumes of caudate nucleus [Jacobson et al., 2010]. The dice coefficients were estimated between repeated tracings of the same structures. The average dice coefficient was found to be 0.87 for hippocampus and 0.90 for caudate nucleus.
Volume Estimation and Statistical Analysis
Binary masks of hippocampi and caudate nuclei were generated from the segmented volumes of each brain. These were used to compute the volumes and for further statistical analysis. The Mann–Whitney (MW) test was used to examine volume differences between diagnostic groups (FAS/pFAS, control) for each hemisphere. The MW test was preferred to the traditional Student's t‐test, because the spacing between the adjacent values was not constant, and the MW test is less affected by the presence of outliers than the t‐test. Furthermore, the robustness of the MW test makes it more appropriate than the t‐test.
Surface‐Based Mesh Modeling
The binary masks representing the 3D shapes of the hippocampi and caudate nuclei were subsequently used to reconstruct surface meshes using the Iso2mesh model. Iso2mesh is a free mesh generation toolbox capable of producing high‐quality surface and volumetric meshes directly from 3D binary or gray scale images [Fang and Boas, 2009]. The resultant mesh model is made up of triangular elements that contain the faces and vertices of the binary mask. The vertices provide landmark points. The number of vertices and faces varies with the size and shape of the hippocampus or caudate nucleus.
3D mesh models generated from 2D coronal traces of the right and left hippocampi and right and left caudate nuclei, and their corresponding landmark points are displayed for a single subject in Figures 1 and 2, respectively. The 3D mesh model represents the true geometry of the hippocampus using vertices and faces. The mesh models chosen for the right and left hippocampus contain 2,368 and 2,214 landmark points, respectively, and for the caudate nucleus, they contain 3,054 and 3,086 landmark points for right and left, respectively.
Figure 1.
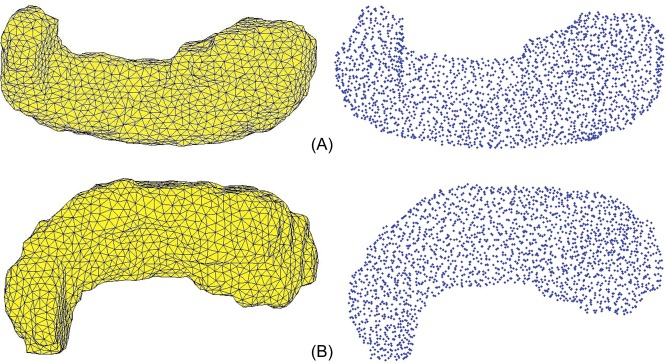
A: Superior view of a three‐dimensional mesh model of the right hippocampus and its corresponding landmark points for a single subject. B: Superior view of a three‐dimensional mesh model of the left hippocampus and its corresponding landmark points for a single subject. [Color figure can be viewed in the online issue, which is available at http://wileyonlinelibrary.com.]
Figure 2.
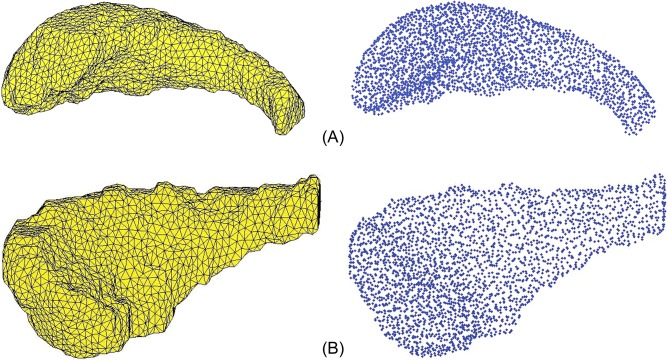
A: Lateral view of three‐dimensional mesh model of the right caudate nucleus and its corresponding landmark points for a single subject. B: Lateral view of three‐dimensional mesh model of the left caudate nucleus and its corresponding landmark points for a single subject. [Color figure can be viewed in the online issue, which is available at http://wileyonlinelibrary.com.]
Surface‐Based Measures Using a Statistical Shape Model
A statistical shape model describes the shape variability across a set of shapes through variations in the positions of a set of corresponding landmark points. A shape can be described by its shape vector, which contains all the landmark co‐ordinates in three dimensions:
To build a statistical shape model and to match surface anatomy across subjects, a uniform set of corresponding landmark points is required. To achieve this across different samples, the reconstructed mesh model of a single control child was used as a template and was coregistered to all the remaining mesh models. This template to target registration of 3D point clouds was performed using an iterative closest point algorithm (ICP). The ICP is an independent method for the accurate and computationally efficient registration of 3D shapes including free‐form curves and surfaces. This method handles the full six degrees of freedom and requires only a procedure to find the closest point on a geometric entity to a given point. The ICP algorithm always converges monotonically to the nearest local minimum of a mean square distance metric, and experience shows that the rate of convergence is rapid during the first few iterations. Therefore, given an adequate set of initial rotations and translations for a particular class of objects with a certain level of shape complexity, one can globally minimize the mean square distance metric over all six degrees of freedom by testing each initial registration.
For example, if a data shape P is best aligned with model shape X, the distance metric d between this individual data point P and the model shape X is given by
The mean squared error e K of the correspondence is given by
in which N p is the number of points for the data shape, Y is the new point set, and P is the old point set of the 3D point cloud. The ICP algorithm aims to find the transformation between a cloud of points and the reference surface (or another cloud of points) by minimizing the square errors between corresponding points. The registration error is directly minimized using general purpose nonlinear optimization (the Levenberg–Marquardt algorithm) [Besl and McKay, 1992].
To compare the corresponding landmarks of different shapes, they must be aligned in the same way with respect to the set of axes. This scaling normalization provides a measure of shape variations due only to shape and not size. This is achieved first by rigid‐body Procrustes alignment. Once the set of shapes are aligned, the mean shape is computed for both the healthy and pathological models, and their group mean difference was computed using the multivariate Hotelling T2 two‐sample metric. The multivariate test looks for differences in the displacement vectors in the three principal xyz directions, which characterize the shift between the two groups. These comparisons were performed locally for the set of landmark points [Styner et al., 2006] in order to generate a deformation map. For visualization purposes, three distinct threshold values were chosen to map the degree of deformation.
RESULTS
The volumes of the hippocampi and caudate nuclei were estimated within the manually traced regions of interest. The sample characteristics and the group mean volumes and their standard deviations for the controls and the children with FAS/pFAS are shown in Table 1. Groups were well‐matched on maternal age at delivery, SES, child sex, age at scan, and parity. As expected, there were significant differences regarding quantity and frequency of alcohol consumed by mothers of children in the FAS/pFAS group and smoking during pregnancy. Mothers of children with FAS/pFAS reported drinking on average 13.4 standard drinks/occasion on 2–3 days/week, generally weekends. The lower child IQ scores for children with FAS/pFAS were also expected. Group differences in volume were assessed using the MW test. Right hippocampus is greater than the left (P < 0.001 for controls, P ≤ 0.1 for FAS/pFAS). Left HC and bilateral caudate volumes of the FAS/pFAS children tend to be smaller than that of the control children (all P's ≤ 0.1). The group differences were not significant after normalizing for differences in total intracranial volumes. We did not control for demographics such as age, sex, and ethnicity, because the groups were well‐matched in these domains.
Table 1.
Sample characteristics, hippocampus and caudate nucleus volumes for controls and children with FASD
| Control (n = 19) | FAS/pFAS (n = 12) | F or χ2 or U | |
|---|---|---|---|
| Maternal characteristics | M (SD) | M (SD) | |
| Age at delivery | 27.6 (4.7) | 25.9 (5.2) | 0.87 |
| Socioeconomic statusa | 20.7 (9.9) | 17.2 (7.2) | 1.11 |
| Child characteristics | |||
| Gender (% male) | 36.8 | 25.0 | 0.47 |
| Age at scan | 11.5 (1.1) | 11.8 (1.2) | 0.57 |
| Parity | 2.6 (1.4) | 2.3 (1.1) | 0.61 |
| WISC IQb | 75.6 (10.9) | 63.5 (9.4) | 10.13d |
| Prenatal exposures | |||
| Oz absolute alcohol (AA) during pregnancyc | |||
| Oz AA/day | 0.002 (0.01) | 2.8 (2.4) | 27.12e |
| Oz AA/occasion | 0.1 (0.3) | 6.7 (3.4) | 72.10e |
| Frequency (days/week) | 0.02 (0.01) | 2.8 (1.4) | 77.77e |
| Cigarettes/day | 2.2 (3.9) | 8.8 (8.3) | 9.34d |
| Right hippocampal volume (mm3) | 2926 (474) | 2875 (494) | 99 |
| Left hippocampal volume (mm3) | 2862 (394) | 2602 (463) | 72f |
| Right caudate nucleus volume (mm3) | 4265 (624) | 3840 (704) | 72f |
| Left caudate nucleus volume (mm3) | 4066 (605) | 3771 (737) | 73f |
Based on Hollingshead Scale (1975).
Estimated from 8 of 10 Wechsler Intelligence Scale for Children subtests (Jacobson et al., 2011).
1 oz AA ≈ 2 standard drinks.
P < 0.01;
P < 0.001;
P ≤ 0.10.
The average shapes for the hippocampus in both hemispheres computed from the set of registered images for the control children (left) and children with FASD (right) are shown in Figure 3. These average shapes were normalized to compensate for the volume variations within the groups. Using localized Hotelling T2 methods, the shape variations between the control and exposed groups were determined, and the deformation maps were plotted on the average control shape. In the localized Hotelling method, a set of three landmarks corresponding to a specific face was chosen in each group, their deformations were estimated, and the comparison extended to other faces. Different thresholds were applied based on the estimated false‐discovery rate (FDR) corrected P values to illustrate the different degrees of deformation and are plotted in Figures 4 and 5 for hippocampus and Figures 6 and 7 for caudate nucleus.
Figure 3.
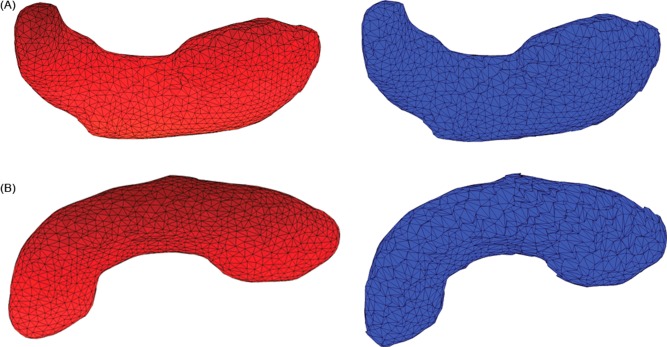
A: Average shape for control children (left) and children with FASD (right) of right hippocampus. B: Average shape for control children (left) and children with FASD (right) of left hippocampus. [Color figure can be viewed in the online issue, which is available at http://wileyonlinelibrary.com.]
Figure 4.
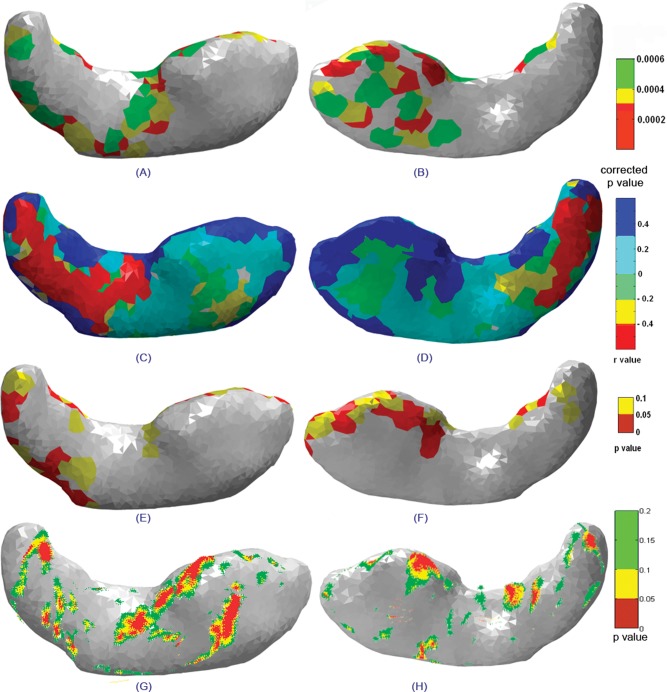
Statistical maps showing superior (left column) and inferior (right column) views of the right hippocampus indicating (A, B) significant deformations between groups, (C, D) correlations between surface deformations and degree of prenatal alcohol exposure, the (E, F) corresponding significance maps, and (G, H) statistical maps of group differences for the right hippocampus obtained using the radial distance method.
Figure 5.
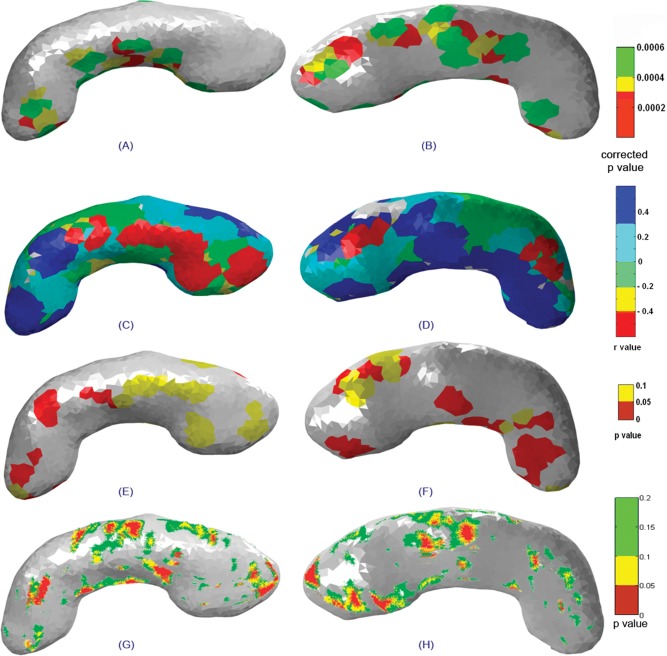
Statistical maps showing superior (left column) and inferior (right column) views of the left hippocampus indicating (A, B) significant deformations between groups, (C, D) correlations between surface deformations and degree of prenatal alcohol exposure, the (E, F) corresponding significance maps, and (G, H) statistical maps of group differences for the left hippocampus obtained using the radial distance method.
Figure 6.
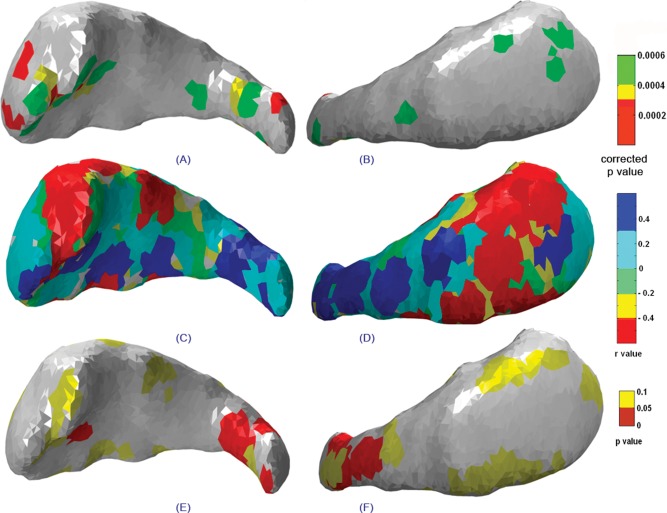
Statistical maps showing the lateral (left column) and medial (right column) views of the right caudate indicating (A, B) significant group deformations, (C, D) correlations between structure deformation and degree of prenatal alcohol exposure, and (E, F) the significance map corresponding to the correlation map mentioned earlier.
Figure 7.
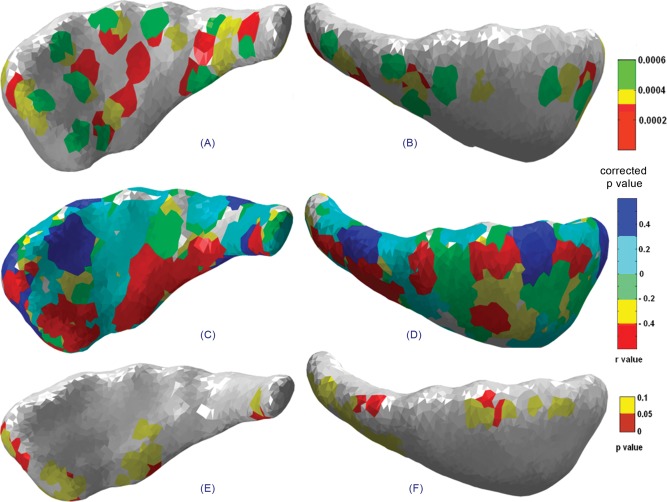
Statistical maps showing the lateral (left column) and medial (right column) views of the left caudate indicating (A, B) significant group deformations, (C, D) correlations between structure deformation and degree of prenatal alcohol, and (E, F) the significance map corresponding to the correlation map mentioned earlier.
Figure 4 shows statistical maps of deformation overlaid on the mean shape of the right hippocampus. The superior view shows maximum deformation in superior and lateral regions of the body (in the vicinity of CA3) of the right hippocampus and weak deformation in the tail regions. The inferior view shows significant deformations on most parts of the head (in the vicinity of CA1; Fig. 4B). The correlation map shows local relationships between the degree of deformation and prenatal alcohol exposure. This map has been estimated by generating the deformation index (Hotellings T2 value) at every vertex for individual subjects in the FAS/pFAS group relative to the mean of the control shape. In this way, we computed the correlation between the deformation index and amount of prenatal alcohol exposure at every vertex. In Figure 4C,D, the deformation index is strongly related to the degree of prenatal alcohol exposure in regions colored in blue and red. Positive correlations (blue) correspond to regions of compression in the alcohol‐exposed subjects, while negative correlations (red) are regions of expansion. Figure 4E,F (p‐maps) shows regions where the associations are significant. Regions that are significantly affected are shown in red (P ≤ 0.05) and trends in yellow (0.05 < P ≤ 0.1). For the right hippocampus, greater alcohol exposure was associated with significant contraction in the anterior region of the head (Fig. 4C–F). Small isolated regions in the body and tail also show significant contraction with alcohol exposure.
For the left hippocampus, significant deformations were observed spreading from the body to tail region in the superior view (Fig. 5A) and from the head to the tail region in the inferior view (Fig. 5B). Greater alcohol exposure was significantly associated with contraction only in small isolated regions in the head, body, and tail of the left hippocampus (Fig. 5C–F).
Figure 6A,B represents statistical maps of deformation for lateral and medial views of the right caudate nucleus. Only in the tail region of the right caudate was greater alcohol exposure significantly associated with contraction (Fig. 6E,F). The left caudate nucleus shows deformation in the body and tail regions in the lateral view (Fig. 7A). In contrast to the right caudate, only a few isolated regions distributed over the entire left caudate show significant association between contraction and degree of alcohol exposure (Fig. 7E,F).
Validation of the Present Method
We compared the results obtained using our 3D Surface Deformation Based Shape Analysis tool to the LONI (Laboratory of Neuro Imaging, UCLA) shape analysis tools. The methods implemented for the LONI shape tools have been described in detail previously [Narr et al., 2004]. The radial distance maps obtained for the same set of data for both the right and left hippocampus are shown in Figures 4G,H and 5G,H, respectively.
The radial distance map measures the radial distances from the medial core to the surface boundary at thousands of points along the surface. The resulting radial distance maps detect nonuniform surface changes of a structure on a very local scale. Distance fields thus index local expansions or contractions/depressions in HC surface morphology and may be compared statistically between groups at equivalent HC surface points in 3D. The statistical map shows regions of significant variations in radial distance for the right (Fig. 4G,H) and left (Fig. 5G,H) hippocampus, respectively. These results are in very good agreement, although less pronounced, than the results of the surface‐based method presented here.
DISCUSSION
This study sought to assess whether the size and shape of the hippocampus and caudate nucleus differ between children exposed to prenatal alcohol exposure and demographically similar community comparison subjects. In addition, we examined the degree to which differences in structure shape/deformation are dependent on the quantity of alcohol consumed by the mother during pregnancy. Although volumes of these brain structures were not found to differ significantly between groups, regionally specific changes in the morphology of both structures were observed in FASD and were related to the degree of prenatal alcohol exposure.
Although a larger right HC volume than left has been reported [Basso et al., 2006; Sullivan et al., 2005], not all investigators have found this [Raz et al., 2004], and many of the effects on the hippocampus appear subtle. The volume estimates for controls using manual tracing for the right and left hippocampus in the present study are consistent with the finding in the literature of increased right hemisphere volume [Gonzalo et al., 2010]. In one study, a disproportionate volume reduction was observed for caudate nucleus and with disproportionate sparing of hippocampus in FAS participants [Archibald et al., 2001]. Although the average volumes of the control group were greater than those of the alcohol‐exposed children for both the hippocampi and the caudate nuclei in the current study, these volumetric differences were not statistically significant. The standard deviation was found to be greater in children with FASD compared to controls in both hemispheres for both hippocampus and caudate nucleus.
Using volumetric measures alone, it is difficult to fully investigate the variation in tissue structures, nor is it possible to discern whether some regions of the structure are preferentially impacted. In this study, a surface‐based approach was adopted to predict precisely the location of shape variations in 3D space. The surface meshes of the right and left hippocampi and caudate nuclei were reconstructed for the control and FASD groups using the Iso2mesh toolbox. Reconstructed mesh models give greater insight into the true geometry of the shapes under investigation. Landmark points were extracted from these surface meshes and used for shape analysis using PDMs. Point cloud registration between a template and the target was used to normalize the number of landmark points. Registration errors between the different shapes were reduced using an ICP algorithm. The average shape was then estimated for the control and FAS/pFAS groups using a PDM after compensating for group differences in volume. The Hotelling T2 method was used to localize shape variations between the groups. Unlike methods used previously [Styner et al., 2006] that compare vertices between groups, we used the mesh polygon faces and their corresponding vertices to estimate the deformations. Shape analysis using face‐based methods provides better prediction of the regions with significant shape variations. Initially, we generated our results based on vertex‐based methods and found the results using vertex‐based methods to be very scattered, with islands of high deformation. Using face‐based methods, we are analyzing the variations across the three vertices of corresponding faces. Face‐based methods yielded smoother transitions and more realistic‐looking results.
Shape abnormalities of the two‐dimensional outline of the corpus callosum on a mid‐sagittal slice have been reported previously in subjects with prenatal alcohol exposure [Bookstein et al., 2001; Sowell et al., 2001a]. Callosal dysmorphology was found to be a powerful discriminator of exposed from unexposed [Bookstein et al., 2001] and predicted impairment in verbal learning ability [Sowell et al., 2001a], providing justification for further work in this area.
Results of shape analysis using the PDM demonstrate significant shape variations in both hippocampi and caudate nuclei between the controls and the FAS/pFAS group. In addition to the presence of shape variations, details regarding the locations where significant deformations exist are provided by the deformation maps. The pattern of shape abnormality shows a change in the body and tail region on the superior surface and in the head on the inferior surface of the right hippocampus. For left hippocampus, deformations are observed in the body and tail regions on the superior surface and in the head and body on the inferior surface. Deformations occur in the head and tail of the right caudate and across the entire left caudate nucleus.
In addition to deformation, correlation maps were estimated to identify regions where deformation is significantly related to degree of prenatal alcohol exposure. Greater alcohol exposure was associated with significant contraction in the anterior region of the head of the right hippocampus and in small isolated regions distributed over the entire left hippocampus. Greater alcohol exposure was significantly associated with contraction in the tail of the right caudate nucleus.
With LONI shape tools, 3D parametric surface models of each individual's hippocampi were skeletonized. That is, for each HC surface model, a 3D medial curve along the anterior–posterior axis of the hippocampus was derived in stereotaxic coordinate space and the distance measured from each spatially uniform HC surface point to this central curve. Each HC surface point was thus assigned a distance measure (radial length) from the central core of the hippocampus to the HC surface boundary. Because the derived medial curve represents the center of mass, if one side of the hippocampus is deformed inward, the medial axis shifts slightly to accommodate this surface depression. Therefore, radial distance measures reflect changes on all sides of the hippocampus with the depressed region showing the greatest changes.
In our surface‐based method, we generated average mesh models that contain triangulated faces of the structure under investigation for both controls and the patient group. These average mesh models were normalized to compensate for volume variations and the distances computed between corresponding faces between the two averages. Because they contain same number of faces, variations in position represent shape differences between the groups. Unlike the LONI method where distances from the central core to the surface points are analyzed, we compute differences between group surface meshes. Furthermore, instead of analyzing surface points, we analyze differences between the faces of the triangulated mesh models, which provide a very uniform measure of surface variations.
We generated FDR‐corrected P values to estimate the regions of significant shape variations in hippocampi and caudate nuclei. We compared our results to those generated by the LONI shape tools and found good agreement on the head, body, and tail for left and right hippocampi.
Our results clearly demonstrate the existence of shape alterations in the hippocampi and caudate nuclei in children with heavy prenatal alcohol exposure. Combined with manual segmentation, the current method makes it possible to determine the locations of compression/expansion of a structure of interest and can be easily extended to other subcortical structures, such as the putamen and corpus callosum.
Although the methods presented here were validated using the LONI shape analysis pipeline, it would be valuable to reproduce the findings in an independent cohort.
It should be emphasized that the validity of these methods will depend heavily on the normalization procedure, number of landmark points, and statistical method used to assess the shape variations. The effects of age and gender were not considered in this study as the groups were well‐matched in these domains.
In conclusion, our results suggest that prenatal alcohol exposure affects the shape of the hippocampus and caudate nucleus in both hemispheres. Surface‐based methods provide higher sensitivity in the assessment of the effects of prenatal alcohol exposure than volume measures alone. With the surface‐based methods presented here, it is possible to assess the shape variations of all the subcortical structures that may not exhibit volume differences. Furthermore, the computational complexity is greatly reduced by using the present surface‐based approach presented here, while preserving the true geometry of the structure under investigation.
Acknowledgments
We thank the UCT and WSU research staffs, Bruce Spottiswoode and the radiographers at CUBIC, the three dysmorphologists who examined the children (H.E. Hoyme, L.K. Robinson, N. Khaole), and the Cape Town mothers and children who participated in the study.
REFERENCES
- Archibald SL, Fennema‐Notestine C, Gamst A, Riley EP, Mattson SN, Jernigan TL (2001): Brain dysmorphology in individuals with severe prenatal alcohol exposure. Dev Med Child Neurol 43:148–154. [PubMed] [Google Scholar]
- Astley SJ (2004):Diagnostic Guide for Fetal Alcohol Spectrum Disorders: The 4‐Digit Diagnostic Code, 3rd ed. Seattle WA:University of Washington Publication Services; pp1–114. [Google Scholar]
- Basso M, Yang J, Warren L, MacAvoy MG, Varma P, Bronen RA, Van Dyck CH (2006): Volumetry of amygdala and hippocampus and memory performance in Alzheimer's disease. Psychiatry Res 146:251–261. [DOI] [PubMed] [Google Scholar]
- Besl PJ, McKay ND (1992): A method for registration of 3‐d shapes. IEEE Trans Pattern Anal Mach Intell 14:239–256. [Google Scholar]
- Bookstein FL (1997): Landmark methods for forms without landmarks: Morphometrics of group differences in outline shape. Med Image Anal 1:225–243. [DOI] [PubMed] [Google Scholar]
- Bookstein FL, Sampson PD, Streissguth AP, Connor PD (2001): Geometric morphometrics of corpus callosum and subcortical structures in the fetal alcohol affected brain. Teratology 64:4–32. [DOI] [PubMed] [Google Scholar]
- Bookstein FL, Sampson PD, Connor PD, Streissguth AP (2002): Midline corpus callosum is a neuroanatomical focus of fetal alcohol damage. Anat Rec 269:162–174. [DOI] [PubMed] [Google Scholar]
- Cootes TF, Taylor CJ, Cooper DH, Graham J (1995): Active shape models—Their training and application. Computer Vis Image Understand 61:38–59. [Google Scholar]
- Duta N, Sonka M (1997): Segmentation and interpretation of MR brain images: An improved active shape model. IEEE Trans Med Imag 17:1049–1062. [DOI] [PubMed] [Google Scholar]
- Fang Q, Boas D (2009): Automatic surface and volumetric mesh generation from 3D binary or gray‐scale images. In Proceedings of IEEE International Symposium on Biomedical Imaging: From Nano to Macro, Boston, MA.
- Fleute M, Lavallee S, Julliard R (1999): Incorporating a statistically based shape model into a system for computer‐assisted anterior cruciate ligament surgery. Med Image Anal 3:209–222. [DOI] [PubMed] [Google Scholar]
- Gerig G, Styner M, Shenton ME, Lieberman JA (2001): Shape versus size: Improved understanding of the morphology of brain structures. Med Image Comput Computer‐Assist Interv 2208:24–32. [Google Scholar]
- Golland P, Grimson WEL, Kikinis R (1999): Statistical shape analysis using fixed topology skeletons: Corpus callosum Study. Inform Process Med Imag 1613:382–387. [Google Scholar]
- Golland P, Grimson WEL, Shenton M, Kikinis R (2000): Small sample size learning for shape analysis of anatomical structures In: Delp Scott, DiGoia Anthony, Jaramaz Branislav, editors.Proceedings of Medical Image Computing and Computer‐Assisted Intervention. Volume1935/2000, CH378,Springer:Berlin, Heidelberg: pp72–82. [Google Scholar]
- Gonzalo SB, Beatriz GA, Aitor S, Yolanda V, Manuel D, Jordi PC (2010): Manual validation of FreeSurfer's automated hippocampal segmentation in normal aging, mild cognitive impairment, and Alzheimer Disease subjects. Psychiatry Research: Neuroimaging 181:219–225. [DOI] [PubMed] [Google Scholar]
- Jacobson SW, Stanton ME, Molteno CD, Burden MJ, Fuller DS, Hoyme HE, Robinson LK, Khaole N, Jacobson JL (2008): Impaired eyeblink conditioning in children with fetal alcohol syndrome. Alcohol Clin Exp Res 32:365–372. [DOI] [PubMed] [Google Scholar]
- Jacobson SW, Warton C, Dodge NC, De Guio F, Molteno CD, Jacobson JL, Meintjes EM (2010): Differential vulnerability of three brain structures to fetal alcohol exposure: An MRI study of school‐age children in Cape Town. Alcohol Clin Exp Res A 34:93. [Google Scholar]
- Jacobson SW, Stanton ME, Dodge NC, Pienaar M, Fuller DS, Molteno CD, Meintjes EM, Hoyme HE, Robinson LK, Khaole N, Jacobson JL (2011): Impaired delay and trace eyeblink conditioning in school‐age children with fetal alcohol syndrome. Alcohol Clin Exp Res 35:250–264. [DOI] [PMC free article] [PubMed] [Google Scholar]
- Juergen M, George P, Thomas V (2007):Atlas of the Human Brain, Third EditionAcademic Press,280 p. [Google Scholar]
- Kaus MR, Pekar V, Lorenz C, Truyen R, Lobregt S, Weese J (2003): Automated 3‐D PDM construction from segmented images using deformable models. IEEE Trans Med Imag 22:1005–1013. [DOI] [PubMed] [Google Scholar]
- Kelemen A, Szekely G, Gerig G (1997): Three‐dimensional model‐based segmentation of brain MRI. Proc IEEE Int Workshop Model Based 3D Image Anal 178:828–839. [Google Scholar]
- Machado AMC, Gee JC (1998): Atlas warping for brain morphometry. Proc SPIE Med Imag Image Process 3338:642–651. [Google Scholar]
- Mai J, Paxinos G, Voss T.2007Atlas of the Human Brain, 3rd ed. New York:Academic Press. [Google Scholar]
- Manning MA, Hoyme HE (2007): Fetal alcohol spectrum disorders: A practical clinical approach to diagnosis. Neurosci Biobehav Rev 31:230–238. [DOI] [PubMed] [Google Scholar]
- Mattson SN, Riley EP, Sowell ER, Jernigan TL, Sobel DF, Jones KL (1996): A decrease in the size of the basal ganglia in children with fetal alcohol syndrome. Alcohol Clin Exp Res 20:1088–1093. [DOI] [PubMed] [Google Scholar]
- May PA, Brooke L, Gossage JP, Croxford J, Adnams C, Jones KL, Robinson L, Viljoen D (2000): Epidemiology of fetal alcohol syndrome in a South African community in the Western Cape Province. Am J Publ Health 90:1905–1912. [DOI] [PMC free article] [PubMed] [Google Scholar]
- May PA, Gossage JP, Marais AS, Adnams CM, Hoyme HE, Jones KL, Robinson LK, Khaole NC, Snell C, Kalberg WO, Hendricks L, Brooke L, Stellavato C, Viljoen DL (2007): The epidemiology of fetal alcohol syndrome and partial FAS in a South African community. Drug Alcohol Depend 88:259–271. [DOI] [PMC free article] [PubMed] [Google Scholar]
- Meintjes EM, Jacobson JL, Molteno CD, Gatenby JC, Warton C, Cannistraci CJ, Hoyme HE, Robinson LK, Khaole N, Gore JC, Jacobson SW (2010): An FMRI study of number processing in children with fetal alcohol syndrome. Alcohol Clin Exp Res 34:1450–1464. [DOI] [PubMed] [Google Scholar]
- Narr KL, Thompson PM, Sharma T, Moussai J, Cannestra AF, Toga AW (2000): Mapping morphology of the corpus callosum in schizophrenia. Cereb Cortex 10:40–49. [DOI] [PubMed] [Google Scholar]
- Narr KL, Thompson PM, Szeszko P, Robinson D, Jang S, Woods RP, Kim S, Hayashi KM, Asunction D, Toga AW, Bilder RM (2004): Regional specificity of hippocampal volume reductions in first‐episode schizophrenia. Neuroimage 21:1563–1575. [DOI] [PubMed] [Google Scholar]
- Pfefferbaum A, Lim KO, Desmond JE, Sullivan EV (1996): Thinning of the corpus callosum in older alcoholic men: A magnetic resonance imaging study. Alcohol Clin Exp Res 20:752–757. [DOI] [PubMed] [Google Scholar]
- Raz N, Gunning‐Dixon F, Head D, Rodrigue KM, Williamson A, Acker JD (2004): Aging, sexual dimorphism, and hemispheric asymmetry of the cerebral cortex: Replicability of regional differences in volume. Neurobiol Aging 25:377–396. [DOI] [PubMed] [Google Scholar]
- Rueckert D, Frangi A, Schnabel JA (2003): Automatic construction of 3‐D statistical deformation models of the brain using nonrigid registration. IEEE Trans Med Imag 22:1014–1025. [DOI] [PubMed] [Google Scholar]
- Shen L, Ford J, Makedon F, Saykin A (2004): A surface‐based approach for classification of 3D neuroanatomical structures. Intell Data Anal 8:519–542. [Google Scholar]
- Sowell ER, Mattson SN, Thompson PM, Jernigan TL, Riley EP, Toga AW (2001a): Mapping callosal morphology and cognitive correlates: Effects of heavy prenatal alcohol exposure. Neurology 57:235–244. [DOI] [PubMed] [Google Scholar]
- Sowell ER, Thompson PM, Mattson SN, Tessner KD, Jernigan TL, Riley EP, Toga AW (2001b): Voxel‐based morphometric analyses of the brain in children and adolescents prenatally exposed to alcohol. Neuroreport 12:515–523. [DOI] [PubMed] [Google Scholar]
- Styner M, Lieberman JA, Pantazis D, Gerig G (2004): Boundary and medial shape analysis of the hippocampus in schizophrenia. Med Image Anal 8:197–203. [DOI] [PubMed] [Google Scholar]
- Styner M, Oguz I, Xu S, Brechbuhler C, Pantazis D, Levitt JJ, Shenton ME, Gerig G (2006): Framework for the statistical shape analysis of brain structures using spharm‐pdm. Insight J 1701:242–250. [PMC free article] [PubMed] [Google Scholar]
- Sullivan EV, Deshmukh A, Desmond JE, Lim KO, Pfefferbaum A (2000): Cerebellar volume decline in normal aging, alcoholism, and Korsakoff's syndrome: Relation to ataxia. Neuropsychology 14:341–352. [DOI] [PubMed] [Google Scholar]
- Sullivan EV, Rosenbloom MJ, Serventi KL, Deshmukh A, Pfefferbaum A (2003): Effects of alcohol dependence comorbidity and antipsychotic medication on volumes of the thalamus and pons in schizophrenia. Am J Psychiatry 160,1110–1116. [DOI] [PubMed] [Google Scholar]
- Sullivan EV, Marsh L, Pfefferbaum A (2005): Preservation of hippocampal volume throughout adulthood in healthy men and women. Neurobiol Aging 26:1093–1098. [DOI] [PubMed] [Google Scholar]
- Yonggang S, Paul MT, Greig IZ, Stephen ER, Zhuowen T, Ivo D, Arthur WT (2007): Direct mapping of hippocampal surfaces with intrinsic shape context. Neuroimage 37:792–807. [DOI] [PMC free article] [PubMed] [Google Scholar]
- Woods RP (2003): Multitracer: A java‐based tool for anatomic delineation of grayscale volumetric images. Neuroimage 19:1829–1834. [DOI] [PubMed] [Google Scholar]
- Wright IC, McGuire PK, Poline JB, Travere JM, Murray RM, Frith CD, Frackowiak RS, Friston KJ (1995): A voxel‐based method for the statistical analysis of gray and white matter density applied to schizophrenia. Neuroimage 2:244–252. [DOI] [PubMed] [Google Scholar]


