

Abstract
Benign epilepsy with centrotemporal spikes (BECTS) is often associated with neural circuit dysfunction, particularly during the transient active state characterized by interictal epileptiform discharges (IEDs). Little is known, however, about the functional neural circuit abnormalities in BECTS without IEDs, or if such abnormalities could be used to differentiate BECTS patients without IEDs from healthy controls (HCs) for early diagnosis. To this end, we conducted resting‐state functional magnetic resonance imaging (RS‐fMRI) and simultaneous Electroencephalogram (EEG) in children with BECTS (n = 43) and age‐matched HC (n = 28). The simultaneous EEG recordings distinguished BECTS with IEDs (n = 20) from without IEDs (n = 23). Intrinsic brain activity was measured in all three groups using the amplitude of low frequency fluctuation at rest. Compared to HC, BECTS patients with IEDs exhibited an intrinsic activity abnormality in the thalamus, suggesting that thalamic dysfunction could contribute to IED emergence while patients without IEDs exhibited intrinsic activity abnormalities in middle frontal gyrus and superior parietal gyrus. Using multivariate pattern classification analysis, we were able to differentiate BECTS without IEDs from HCs with 88.23% accuracy. BECTS without epileptic transients can be distinguished from HC and BECTS with IEDs by unique regional abnormalities in resting brain activity. Both transient abnormalities as reflected by IEDs and chronic abnormalities as reflected by RS‐fMRI may contribute to BECTS development and expression. Intrinsic brain activity and multivariate pattern classification techniques are promising tools to diagnose and differentiate BECTS syndromes. Hum Brain Mapp 36:3878–3889, 2015. © 2015 Wiley Periodicals, Inc.
Keywords: benign epilepsy with centrotemporal spikes, EEG‐fMRI, multivariate pattern analysis, intrinsic brain activity, epileptic transients
INTRODUCTION
Benign epilepsy with centrotemporal spikes (BECTS) is traditionally regarded as a benign childhood epilepsy syndrome with spontaneous remission in adolescence [Guerrini and Pellacani, 2012; Panayiotopoulos et al., 2008]. However, patients with BECTS usually present with some degree of brain dysfunction, particularly during the active epileptic transient state associated with interictal epileptiform discharges (IEDs) [Camfield and Camfield, 2014; Centeno and Carmichael, 2014]. Indeed, the presence of IEDs is an important risk factor for epileptogenesis and deficits in cognitive processing [Bedoin et al., 2012; Ibrahim et al., 2014].
The pathogenesis of epilepsy may involve both transient and chronic dysfunction [Elger, 2014; Laufs et al., 2014]. The epileptic transient state is accompanied by IED‐related blood‐oxygen‐level‐dependent (BOLD) activation in syndrome‐specific regions [Archer et al., 2003; Boor et al., 2003, 2007; Lengler et al., 2007; Masterton et al., 2010, 2012] while chronic epileptogenic processes may include stable alterations in functional neural circuit organization [Laufs et al., 2014]. Even in the absence of IEDs, the epileptic brain exhibits altered regional activity patterns [Li et al., 2009] and aberrant functional synchrony [Luo et al., 2012; Mankinen et al., 2011], which may contribute to impairments independent of the transient active state [Centeno and Carmichael, 2014].
Interictal EEG recordings and functional magnetic resonance imaging (fMRI) are valuable tools for presurgical localization of epileptic foci [Amarreh et al., 2014; Ciumas et al., 2014; Zhang et al., 2012]. According to the presence of IEDs, the EEG‐fMRI approach can localize generators of transient epileptic events [Boor et al., 2003, 2007; Lengler et al., 2007]. However, it is challenging to distinguish patients without interictal activity on the scalp EEG from healthy controls (HCs). Although BECTS is often associated with continuous spikes and waves (centrotemporal spikes) on the EEG during slow‐wave sleep [Kellaway, 2000], abnormal IEDs cannot be identified from clinical EEG recordings alone. Thus, it is challenging (and critical) to distinguish BECTS patients without interictal activity during EEG‐fMRI recording from HCs. To our knowledge, no study has evaluated the utility of intrinsic brain activity measurements in the resting state to identify diagnostic biomarkers of BECTS without IEDs.
The aim of this work was to identify patterns of intrinsic brain activity common to BECTS patients without IEDs and to use these putative biomarkers to distinguish BECTS without IEDs from both BECTS with IEDs and the HCs. Transient epileptic events and other epilptiform processes increase BOLD signals [Laufs et al., 2014], leading to increased amplitude of low frequency fluctuations (ALFF) [Zang et al., 2007]. Thus, ALFF measurement‐based resting‐state fMRI (RS‐fMRI) may be a feasible method for detecting aberrant intrinsic brain activity in context of the localization and status of epileptiform activity [Ji et al., 2013; Wang et al., 2014; Zhang et al., 2010, 2015]. In fact, ALFF was recently used to identify potential biomarkers for diseased brain due to their high temporal stability [Kublbock et al., 2014; Zuo and Xing, 2014]. We hypothesized that BECTS patients with IEDs can be distinguished from controls by differences in intrinsic brain activity within regions associated with seizure or behavioral semiology, such as the middle frontal gyrus (MFG), thalamus (THA) and (or) the lower portions of the precentral and postcentral gyri [Archer et al., 2003; Boor et al., 2003, 2007; Lengler et al., 2007; Masterton et al., 2010, 2012].
Multivariate pattern analysis (MVPA) of neuroimaging data allows for inferences at the level of the individual rather than the group and as such has great clinical applicability [Orru et al., 2012; Sundermann et al., 2014]. Here, we used MVPA of intrinsic brain activity to differentiate BECTS individuals without IEDs from HCs. We expected that accurate quantitative prediction of BECTS patients without IEDs would be informed by unique functional alterations.
METHODS
Participants
Forty‐five children diagnosed with BECTS at the Second Affiliated Hospital of Zhejiang University School of Medicine, China were included in this study. Written informed consent was obtained from all parents. The study protocol was reviewed and approved by the Local Medical Ethics Committee of the Center for Cognition and Brain Disorders, Hangzhou Normal University, China. A subset of these patients had participated in our earlier study [Tang et al., 2014]. The inclusion criteria were as follows: (i) clinical and EEG findings indicative of BECTS, (ii) age 6–13 years, (iii) attending regular schools, (iv) without developmental disabilities, (v) full‐scale intelligence quotient (IQ) more than 70, and (vi) without history of addictions or neurologic diseases other than epilepsy. Patients were diagnosed on the basis of all available clinical and EEG data by the following criteria: (i) International League Against Epilepsy classification [Berg et al., 2010] and recent literature [Panayiotopoulos et al., 2008], (ii) the presence of simple partial, often facial, and motor or tonic‐clonic seizures during sleep, and (iii) spike‐waves in centrotemporal regions. Exclusion criteria were (i) focal brain lesions on T1‐weighted MRI, (ii) falling asleep during scanning, or (iii) head motion exceeding 3 mm in translation or 3° in rotation. Finally, 43 patients with BECTS were included. Among these patients, 27 patients were treated with antiepileptic drugs (see Table 1).
Table 1.
Demographic and clinical characteristics of participants
| IED (n = 20) | non‐IED (n = 23) | HC (n = 28) | P value | |
|---|---|---|---|---|
| Age (years) | 9.00 ± 1.95 | 10.22 ± 2.13 | 10.00 ± 2.31 | 0.6344a |
| Sex (female: male) | 13:7 | 11:12 | 13:15 | 0.3992b |
| Onset age (years) | 6.95 ± 1.85 | 7.48 ± 2.43 | – | 0.4324c |
| Duration (months) | 23.28 ± 31.90 | 34.27 ± 35.92 | – | 0.3187d |
| Side of EEG (L:R:Bil.) | 6:13:1 | 10:11:2 | – | 0.5228e |
| Number of seizures (/year) | 2.27 ± 2.13 | 6.12 ± 11.75 | – | 0.4244d |
| Treatment: Naive | 10:10 | 6:17 | – | 0.1056e |
| Medication (LEV:VAL:LTG:OXC) | 2:2:2:5 | 6:4:4:3 | – | 0.4453e |
| IQ | ||||
| Full‐scale IQs | 111.80 ± 11.52 | 107.40 ± 14.85 | 113.80 ± 14.59 | 0.3072a |
| Verbal IQ | 107.50 ± 14.05 | 105.00 ± 16.54 | 114.50 ± 15.84 | 0.1273a |
| Performance IQ | 113.90 ± 13.38 | 108.70 ± 16.51 | 109.50 ± 14.36 | 0.5201a |
| Mean FD (mm) | 0.08 ± 0.06 | 0.06 ± 0.03 | 0.09 ± 0.06 | 0.1499a |
Values are mean ± SD. L = left; R = right; Bil. = bilateral; LEV = levetiracetam; VAL = sodium valproate; LTG = lamotrigine; OXC = oxcarbazepine; FD = frame‐wise displacement.
One‐way ANOVA.
Kruskal‐Wallis ANOVA.
two‐sample T test.
Mann Whitney U‐test.
Chi‐square test.
Twenty‐eight sex‐ and age‐matched HCs (HC group; 13 girls and 15 boys; all right handed; age [mean ± SD]: 10.00 ± 2.31 years) were also recruited. These subjects had no history of neurologic disorders or psychiatric illnesses and no gross abnormalities on brain MR images.
Simultaneous EEG‐fMRI Acquisition
All patients underwent one or two simultaneous EEG‐fMRI scans to record as many IEDs as possible. Simultaneous EEG was not recorded in the HC group. During fMRI acquisition, EEG data was continuously recorded with an MR‐compatible EEG recording system (Brain Products, Germany). The 32 Ag/AgCl electrodes arranged in the 10/20 system were attached to the scalp with conductive cream and connected to a BrainAmp amplifier located outside the scanner room, with sampling at 5000 Hz.
The EEG data were processed offline to filter out MR artifacts and to remove ballistocardiogram artifacts (Brain Vision Analyzer 2.0, Germany). The IEDs were marked independently by two experienced electroencephalographers according to both spatial distribution and morphology. Disagreements were resolved and consensuses arrived after discussion. Based on whether IEDs were detected during scanning, BECTS patients were sorted into IED and non‐IED subgroups. The IED subgroup consisted of 20 patients (13 girls and seven boys, age: 9.00 ± 1.95 years) and the non‐IED subgroup of 23 patients (11 girls and 12 boys, age: 10.22 ± 2.13 years).
fMRI Data Acquisition
Functional and structural imaging data were acquired on a 3.0 Tesla MRI scanner (GE Discovery 750 MRI) at the Center for Cognition and Brain Disorders, Hangzhou Normal University, China. Foam padding was used to minimize head motion. Functional images were acquired using an echo‐planar imaging sequence (repetition time/echo time = 2000 ms/30 ms, and flip angle = 90°). Forty‐three transverse slices (field of view = 220 × 220 mm2, matrix = 64 × 64, slice thickness = 3.2 mm, no interslice gap) aligned along the anterior commissure–posterior commissure line were acquired. In each scan, 240 volumes were collected, requiring a total scan time of 480 s. Subjects were instructed to rest with their eyes closed, not to think of anything in particular, and not to fall asleep during scanning. Subsequently, 3D T1‐weighted anatomical images were acquired in the sagittal orientation using a magnetization prepared rapid acquisition gradient‐echo sequence (repetition time/echo time = 8.06 ms/3.136 ms, flip angle = 8°, field of view = 256 × 256 mm2, matrix = 256 × 256, slice thickness = 1 mm, no interslice gap, and 176 slices). After each scanning session, the responsiveness of the subjects was tested by vocal communication to determine whether they were sleep or awake. In addition, subjects were asked whether they had fallen asleep during the scan.
Neuropsychological Assessment
General intelligence, including verbal IQ, performance IQ, and full‐scale IQ, was assessed using the Chinese version of the Wechsler Intelligence Scale for Children (WISC‐III) [Gong and Cai, 1993]. All scores were standardized for age and sex.
fMRI Data Preprocessing
Images were preprocessed using Data Processing Assistant for Resting‐State fMRI (DPARSF) software (http://www.restfmri.net) [Chao‐Gan and Yu‐Feng, 2010]. The first 10 functional images per subject were excluded from analysis. Subsequent images were corrected by slice timing and alignment. Individual 3D T1‐weighted anatomical image was coregistered to functional images. The 3D T1‐weighted images were segmented into gray matter, white matter, and cerebrospinal fluid (CSF), and normalized to Montreal Neurologic Institute (MNI) space. These transformation parameters were then applied to functional images. The normalized data were resliced at a resolution of 3 × 3 × 3 mm3 and spatially smoothed with a 6‐mm full width at half maximum Gaussian kernel. Several sources of spurious variance (head motion parameters derived by Volterra expansion, global signal, and averaged signal from white matter and CSF) were regressed out using multiple linear regression analysis. Finally, functional images with linear trend were removed by temporal bandpass filtering (0.01–0.08 Hz).
ALFF Analysis
To construct intrinsic brain activity maps of each subject, we computed the ALFF value for each voxel as the average square root of the power spectrum [Zang et al., 2007]. The ALFF value of each voxel was then normalized to the global mean ALFF value using DPARSF.
Statistical Analysis
Within‐ and between‐group comparisons
One‐sample t‐tests were performed for within‐group comparisons. To investigate differences in intrinsic brain activity among the three groups, one‐way analysis of variance (ANOVA) was performed on the individual normalized ALFF maps. The significance threshold was set at a corrected P < 0.05 (combined height threshold P < 0.01 and a minimum cluster size of 39 voxels). Several regions showed abnormal ALFF, which were selected as regions of interest (ROIs) for posthoc analyses using the Bonferroni correction. The Bonferroni‐corrected significance level was P < 0.05 divided by the number of ROIs and the total number of comparisons.
Group difference reproducibility
To validate the reproducibility of group differences, we conducted a second scan in a subgroup of BECTS patients (17 IED patients: 12 girls and five boys, age: 9.29 ± 1.96 years and 15 non‐IED patients: seven girls and eight boys, age: 10.00 ± 2.10 years). The HC group had only one scan, so the demographic characteristics for comparison are as listed above. No significant differences were found in age (P = 0.53), sex ratio (P = 0.25), or mean frame‐wise displacement (FD) (P = 0.07) among the three groups. All subjects exhibiting IEDs during the first scan also exhibited IEDs during the second scan, and all non‐IED patients according to the first scan showed no IEDs during the second scan. Image processing and statistical analyses were the same as those used for the first scan.
Correlations between the ALFF and clinical characteristics
To explore the relationship between intrinsic brain activity and the clinical characteristics of RE, Pearson correlation coefficients of average ROI ALFF values versus clinical factors (disease duration and age at onset) and neuropsychological variables (full‐IQ, verbal IQ, and performance IQ) were computed separately for the IED and non‐IED subgroups. The ROI was extracted from the first ANOVA, which showed a significant difference in ALFF among the three groups. In addition, we calculated the Pearson correlation between intrinsic brain activity and the number of IEDs during scanning. As these analyses were exploratory, we used an uncorrected statistical significance level of P < 0.05.
Multivariate Pattern Classification
A MVPA approach was used to investigate the potential use of intrinsic brain activity as a diagnostic biomarker for BECTS without IEDs. This approach uses a set of machine learning‐based algorithms allowing multivariate individual‐level prediction of group membership on high dimensional fMRI data [Orru et al., 2012; Sundermann et al., 2014]. We used a specific MVPA approach known as support vector machine (SVM), among the most frequently used classifiers in neuroimaging, from the LIBSVM machine learning library (http://www.csie.ntu.edu.tw/∼cjlin/libsvm). The average ALFF values of each ROI showing abnormal intrinsic brain activity were used as inputs for the classifiers. A linear decision boundary in this high dimensional space was defined by a hyperplane that separated the individual ALFF values according to a class label (i.e., non‐IED vs. HC). The optimal hyperplane was computed based on the whole multivariate pattern of ALFF values across all subjects in the training set.
Classification was evaluated using split‐half cross‐validation. Data from each of the two groups, non‐IED and HC, was randomly assigned to either training or test sets. Specifically, we divided the non‐IED group into two subgroups (n non‐IED, split 1 = 12, and n non‐IED, split 2 = 11). Similarly, we divided the HC group into two subgroups (n HC, split 1 = 14, and, n HC, split 2 = 14). We developed the classification using split 1 data (n non‐IED, split 1 = 12, n HC, split 1 = 14), and used split 2 data (n non‐IED, split 2 = 11, n HC, split 2 = 14) for testing. We then used split 2 data for training and spilt 1 data for testing. Statistical significance of the overall accuracy, sensitivity, and specificity was determined by permutation testing. In brief, the class labels of the original testing data were randomly permuted (1000 times) to obtain a set of randomized versions of the data. The number of permutations achieving greater value than the true labels was used to derive a P value.
In an auxiliary analysis, we have examined how well the classification generalizes to a second scan, that we had available for 15 out of 23 non‐IED patients. We have trained the classifier on data from eight non‐IED patients that did not have a second scan and HC from spilt 1 (or split 2) part, and used it to classify the first‐scan data from 15 non‐IED patients and HC from split 2 (or split 1) part. The average of the two classification accuracies was reported. Furthermore, we have applied the same classifier to the second scan that was available for 15 non‐IED patients. Although the training sample size is small, this partition ensures that the classifier is not trained and evaluated using data from the same individuals. Statistical significance of the overall accuracy was evaluated with the binomial test.
RESULTS
Demographic Characteristics and Neuropsychological Results
Demographic characteristics and neuropsychological scores are shown in Table 1. After subject selection, neither translation nor rotation parameters in any given data set exceeded ±3 mm or ±3°. Moreover, the mean FD, computed for each subject by averaging the FD from every time point [Jenkinson et al., 2002], did not differ among the three groups (F = 1.95, P = 0.15; see Table 1). No significant differences were found in age, sex ratio, verbal IQ, performance IQ, or full‐scale IQ among groups (HCs, BECTS with IEDs, BECTS without IEDs). All IED group patients had centrotemporal spikes on their EEGs at the time of EEG‐fMRI recording (number of spikes [mean ± SD]: 91.05 ± 88.16).
Group Comparisons
Intrinsic brain activity patterns expressed as normalized group ALFF maps are shown in Figure 1A (one‐sample t‐test; P < 0.05, uncorrected for visual inspection). We found significant differences among the three groups by one‐way ANOVA in the right rectus gyrus (REC), right rolandic operculum (ROL), right THA, left MFG, right postcentral gyrus (PoCG), and left superior parietal gyrus (SPG) (Fig. 1B and Table 2). Pair‐wise posthoc analyses were performed for ROIs encompassing each of these regions (Fig. 1B and Table 2). The IED group showed higher ALFF in the right THA (P = 0.0007) and lower ALFF in the left MFG (P = 0.0004) compared with the non‐IED group. The IED group also showed higher ALFF in the right THA (P = 0.0015), right PoCG (P < 0.0001), and right ROL (P < 0.0001) and lower ALFF in the left SPG (P = 0.0022) and right REC (P = 0.0003) relative to the HC group. The non‐IED group exhibited higher ALFF in the left MFG (P < 0.0001), right PoCG (P = 0.0014), and ROL (P < 0.0001) and lower ALFF in the right REC (P = 0.0010) compared with the HC group.
Figure 1.

Comparison of intrinsic brain activity patterns among groups. (A) For visual inspection, ALFF maps of each group were obtained by uncorrected one‐sample t‐tests. (B) A second‐level random effects analysis (one‐way ANOVA) revealed significant differences in cortical and subcortical regions, which are presented on inflated surface maps by BrainNet Viewer (http://www.nitrc.org/projects/bnv) [Xia et al., 2013] and axial maps, respectively. ROI‐wise posthoc analysis results are illustrated in the insert plots. [Color figure can be viewed in the online issue, which is available at http://wileyonlinelibrary.com.]
Table 2.
Brain regions showing ALFF differences among three groups
| Brian region | BA | MNI coordinates (x, y, z) (mm) | Voxels | ANOVA (F value) | IED vs. non‐IED (P value) | IED vs. HC (P value) | non‐IED vs. HC (P value) |
|---|---|---|---|---|---|---|---|
| Right REC | 11 | (6, 60, −18) | 90 | 10.84 | – | ↓(0.0003) | ↓(0.0010) |
| Right THA | N/A | (6, −12, 3) | 72 | 10.36 | ↑(0.0007) | ↑(0.0015) | – |
| Right ROL | 48 | (48, 0, 18) | 121 | 10.55 | – | ↑(<0.0001) | ↑(0.0002) |
| Left MFG | 10 | (−42, 48, 21) | 79 | 11.82 | ↓(0.0004) | – | ↑(<0.0001) |
| Right PoCG | 4/3 | (54, −12, 27) | 67 | 10.57 | – | ↑(<0.0001) | ↑(0.0014) |
| Left SPG | 7 | (−30, −69, 51) | 42 | 7.51 | – | ↓(0.0022) |
x, y, z, coordinates of primary peak locations in the MNI space; F value, statistical value of peak voxel showing ALFF differences among the three groups. Upward arrow = region showing increased ALFF; Downward arrow = region showing decreased ALFF; MNI = Montreal Neurological Institute; BA = Brodmann area; REC = Rectus gyrus; ROL = Rolandic operculum; THA = Thalamus; MFG = Middle frontal gyrus; PoCG = Postcentral gyrus; SPG = Superior parietal gyrus.
To examine how the spatial pattern of IED‐related BOLD activation correlates with the spatial pattern of ALFF, we first constructed group‐level correlation maps (Supporting Information Fig. S1). Results of this group‐level analysis of IED‐related BOLD activation by conventional hemodynamic response function modeling are consistent with previous EEG‐fMRI studies of BECTS [Archer et al., 2003; Boor et al., 2003, 2007; Lengler et al., 2007]. The IED‐related BOLD activation for each individual is summarized in Supporting Information Figure S2. Only 16 of the 20 BECTS patients with IEDs showed IED‐related BOLD activation. This finding strongly suggests that the canonical hemodynamic response function modeling may not provide the best model for BOLD (de)activation in some epilepsy syndromes or spike‐types [Masterton et al., 2010, 2012].
Reliability of Group Comparisons
The same statistical comparisons of ALFF values (one‐way ANOVA with pair‐wise posthoc analyses of ROIs) were conducted independently for the second scan (Fig. 2). Significant group differences in ALFF were detected in the bilateral MFG, left inferior parietal gyrus, left cuneus, right precentral gyrus, and superior temporal gyrus between IED and non‐IED patients, and pair‐wise group differences in ROIs were identical to that in the first scan, expect for the THA.
Figure 2.
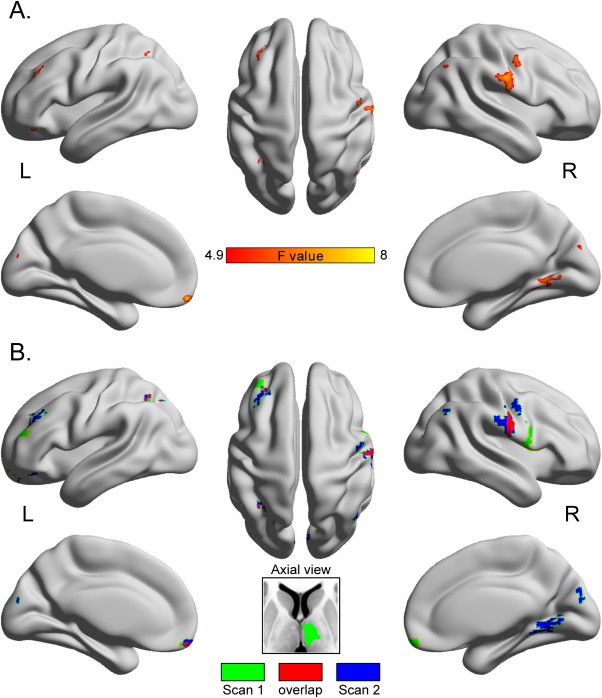
The intertest reliability of ALFF map comparisons. (A) ALFF differences among the three group are presented on inflated surface maps by BrainNet Viewer (http://www.nitrc.org/projects/bnv) [Xia et al., 2013]. (B) The overlapping regions are marked in red and the nonoverlapping regions in green or blue. [Color figure can be viewed in the online issue, which is available at http://wileyonlinelibrary.com.]
Correlations Between the ALFF and Clinical Characteristics
In the IED group, the ALFF of the right THA positively correlated with the number of IEDs observed during EEG‐fMRI recordings (r = 0.61, P = 0.01; Fig. 3A). The ALFF value of the left SPG negatively correlated with performance IQ in the IED group (r = −0.48, P = 0.05) and in all patients (r = −0.33, P = 0.04) but not in the non‐IED group (r = −0.21, P = 0.33; Fig. 3B). There were no significant correlations between the ALFF values of other ROIs and clinical characteristics.
Figure 3.
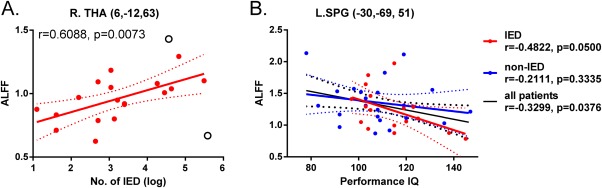
Correlations between ROI ALFF values and clinical characteristics. (A) Scatter plot shows the association between mean ALFF value of right THA and the number of IEDs observed during EEG‐fMRI recordings. Filled circles denote data points included in the correlation, open circles denote outliers. (B) Scatter plot showing the association between mean ALFF value of the left SPG and performance IQ. Solid line and dashed lines represent the best‐fit line and 95% confidence interval of Pearson correlation. [Color figure can be viewed in the online issue, which is available at http://wileyonlinelibrary.com.]
Multivariate Pattern Classification
Figure 4A presents the result of the linear SVM classification of training on split 1 samples and testing on split 2 samples. The overall classification accuracy was 88.00%, with 92.86% sensitivity and 90.91% specificity (all P < 0.001). In addition, the discriminative score for each test subject was acquired by the SVM classifier. Taking each subject's discriminative score as a threshold, the receiver operating characteristic (ROC) curve of the classifier was obtained (Fig. 4B). The area under the ROC curve (AUC) of the proposed method was 0.98, indicating good classification power.
Figure 4.
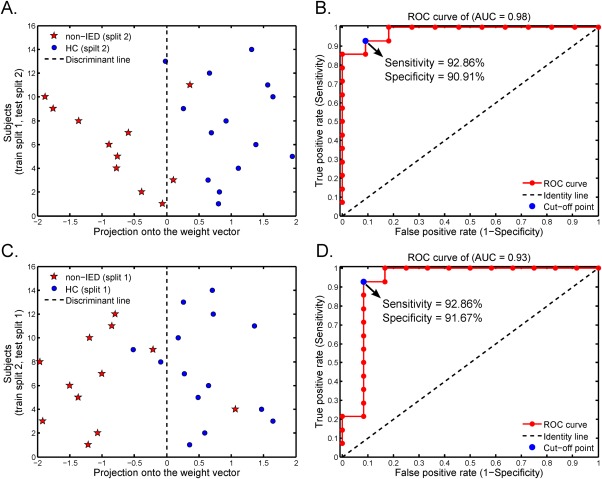
Multivariate pattern classification. (A) Classification plot for training on non‐IED (split 1) and HC (split 1) data and testing on non‐IED (split 2) and HC (split 2) data. (B) The AUC was 0.98. (C) Classification plot for training on non‐IED (split 2) and HC (split 2) data and testing on non‐IED (split 1) and HC (split 1) data. (D) The AUC was 0.93. [Color figure can be viewed in the online issue, which is available at http://wileyonlinelibrary.com.]
Figure 4C presents the results of the linear SVM classification of training on split 2 samples and testing on split 1 samples. This analysis yielded an 88.46% prediction accuracy (92.86% sensitivity and 91.67% specificity; all P < 0.001 by permutation test). The AUC was 0.93 (Fig. 4D).
In an auxiliary analysis, we have trained the classifier on data from eight non‐IED and HC from spilt 1 (or split 2). Despite a small non‐IED training sample, the classification accuracy was 87.94% when tested on the first scan of 15 non‐IED patients and HC from split 2 (86.21%, P < 0.001; or split 1 [89.66%, P < 0.001]). Statistical significance gained was similar to the main classification results. When the same classifier was applied to the second scan of 15 non‐IED patients, the prediction accuracy was 0.7333 (P = 0.0592).
DISCUSSION
This study is the first to map regional differences in intrinsic (resting) neural activity between BECTS patients with and without IEDs, and between the non‐IED patient group and healthy age‐matched controls. Differences were observed between the IED group and both the non‐IED and HC groups in the thalamus, middle frontal gyrus, and SPG while differences in left medial frontal gyrus, right PoCG, right ROL, and right REC distinguished non‐IED BECTS patients from controls. Furthermore, we were able to reliably differentiate BECTS patients without IEDs from controls using multivariate pattern classification.
Intrinsic Brain Activity in BECTS Patient with Epileptic Transients
Transient epileptic events such as IEDs are associated with altered brain activation in syndrome‐specific circuits, which may in turn impact neurocognitive function and development [Ibrahim et al., 2014]. Previous studies have reported spike‐related BOLD (de)activation in syndrome‐specific regions (e.g., facial sensorimotor area) [Boor et al., 2003, 2007; Masterton et al., 2010, 2012; Siniatchkin et al., 2007] or in the default mode network (DMN) [Archer et al., 2003; Lengler et al., 2007]. Consistent with these findings, this study found increased intrinsic brain activity in regions related to the typical seizure semiology of BECTS (paresthesia and jerking of the mouth, face, and hands), particularly in the lower part of the sensorimotor area (PoCG) and cortices around the rolandic fissure (ROL) [Moeller et al., 2013]. In addition, we observed decreased intrinsic brain activity in regions of the DMN (REC and SPG) that may contribute to reduced responsiveness during epileptic transients. More importantly, the intrinsic brain activity in the SPG was negatively associated with performance IQ in the IED group but not in the non‐IED group, suggesting that reduced intrinsic SPG activity may contribute to neuropsychological deficits associated with the active seizure period. Taken together, these mapping studies suggest that focal epileptiform activity could induce intrinsic brain dysfunction well beyond the rolandic focus, thereby impacting multiple dimensions of cognition.
Unexpectedly, we also observed increased intrinsic activity in the thalamus of the IED group but not in the non‐IED group, a finding not reported in previous EEG‐fMRI studies of BECTS [Boor et al., 2003, 2007; Masterton et al., 2010, 2012; Siniatchkin et al., 2007]. This difference could be attributed to temporal changes in the pattern of cortical hyperexcitability (i.e., disease evolution) [Masterton et al., 2010], as we scanned subjects only once or twice during the course of a disease lasting several years. Nonetheless, transient epileptic events should result in temporal changes in BOLD signal [Garrett et al., 2013], providing a sensitive approach for detecting regional brain abnormalities. Rolandic spikes during sleep are strongly correlated with spindle activity [Nobili et al., 1999], suggesting that thalamic dysfunction drives aberrant activity in the somatosensory system [Avanzini et al., 2012] or executive attention systems [Kavros et al., 2008] via thalamocortical projections. Indeed, increased intrinsic activity in the THA was also positively associated with the number of IEDs.
Intrinsic Brain Activity in BECTS Patient without Epileptic Transients
The BECTS patient group without IEDs also showed abnormal intrinsic regional brain activity corresponding to a typical seizure semiology [Li et al., 2009; Mankinen et al., 2011], and these changes in activity cause long‐term impairments [Centeno and Carmichael, 2014]. However, we found no association between altered ALFF in this group and neurocognitive impairment, possibly reflecting the small sample size or the short duration of epilepsy [Ciumas et al., 2014]. Therefore, these preliminary results need to be confirmed in a larger longitudinal follow‐up study.
Another unexpected finding was increased ALFF in the left MFG in the non‐IED group compared with both HC and IED groups. Recent BECTS studies revealed both altered white matter microstructure [Ciumas et al., 2014] and language‐related BOLD activation in MFG [Vannest et al., 2013]. Thus, these chronic changes in resting activity may be associated with lasting dysfunction of circuits mediating language development and function [Elger, 2014].
In summary, neural circuits that appear altered in both BECTS syndromes include the lower portions of the precentral and postcentral gyri. In addition, increased intrinsic brain activity in thalamus may be associated with IEDs in BECTS. Even in the absence of IEDs, however, there were significant differences in intrinsic brain activity in regions associated with seizure semiology and cognitive dysfunction. Moreover, these results suggest that both transient and chronic abnormalities may be involved in BECTS pathogenesis and (or) clinical expression
Pattern Classification for Patients without Epileptic Transients
Measurement of intrinsic brain activity and functional/anatomical connectivity hold great promise for diagnosis and presurgical assessment of epilepsy but require more reliable biomarkers [Amarreh et al., 2014; Ciumas et al., 2014; Zhang et al., 2012]. BECTS is characterized by infrequent brief, simple partial motor seizures with somatosensory symptoms, language arrest, and centrotemporal spikes. However, it is often difficult to identify BECTS patients with rare or absent epileptic transients on scalp EEG. This study has identified several potential diagnostic biomarkers that together accurately distinguished BECTS without IEDs from age‐matched controls.
Our MVPA classification approach was evaluated using split‐half cross‐validation. Classification accuracy for distinguishing BECTS without IEDs from controls was 88%, in line with other recent studies using this same approach on various neuroimaging data [Ciumas et al., 2014; Zhang et al., 2012]. In addition, we have demonstated that the developed classification model is generalizable to new scans obtained from the same individuals at a later point in time. Future studies may benefit from including more information in the classifiers, such as diffusion imaging data, genotypes, and additional clinical variables [Gong et al., 2014].
Methodological Considerations and Limitations
We used RS‐fMRI rather than task‐driven fMRI activity because RS‐fMRI allows for an unbiased measurement of whole‐brain neural activity [Thomason et al., 2011]. Transient epileptic events result in robust BOLD signals, and the ALFF approach has been widely used to detect brain dysfunction in various types of epilepsy [Laufs et al., 2014; Zhang et al., 2010]. In addition, the reproducibility or/and test‐retest reliability of ALFF measurements is relatively high [Kublbock et al., 2014; Zuo and Xing, 2014] as confirmed in this study (Fig. 2). The possibility that head movements can introduce artifactual group‐related differences in R‐fMRI metrics has become a growing concern. Both “scan nulling” for computing IED‐related BOLD (de)activation [Lemieux et al., 2007] and “scrubbing” for computing resting‐state functional connectivity [Power et al., 2012] are widely used to eliminate movement artifacts. In this work, we focused on the ALFF (a time‐dependent parameter) and so did not use “scrubbing” because removal of noncontiguous time points alters the underlying temporal structure of the data, precluding conventional frequency‐based analyses (e.g., the fast Fourier transform‐based ALFF measure) and requiring a more complicated and the discrete Fourier transform [Yan et al., 2013]. In addition, the relationships between motion (mean FD) and intrinsic brain activity (ALFF) across subjects (see Supporting Information Fig. S3) are consistent with a previous study on regional variation in the impact of head micromovements [Yan et al., 2013]. The strongest negative correlations (blue and green in Supporting Information Fig. S3) were mainly in the DMN, consistent with a previous study [Zeng et al., 2014] and indicting that greater head motion is associated with lower amplitude ALFF.
Nonetheless, this work has several methodological limitations. First, the antiepileptic medications taken by some patients may have confounded RS‐fMRI and neurocognitive test results. Future studies should recruit more homogeneous patient groups with controlled medication histories. In addition, we could not completely eliminate the effects of head motion. Finally, we filtered the frequency of BOLD signals to retain only the 0.01 − 0.08 Hz band, which may have resulted in the loss of valuable information on neural activity in epilepsy [Wang et al., 2014].
In conclusion, this study mapped features of the RS‐fMRI pattern common to BECTS patients with and without IEDs and features distinguishing these BECTS subtypes from each other and age‐matched controls. The presence of regional dysfunction in patients without IEDs supports a contribution from both chronic and transient abnormalities to BECTS development and expression, as well as on BECTS‐associated sequela (e.g., cognitive/language impairments). Importantly, the associated neural circuits may be potential diagnostic biomarkers for differentiating BECTS without epileptic transients from HCs.
Supporting information
Supporting Information
ACKNOWLEDGMENT
We are grateful to all the participants in this study.
Correction added on 17 August 2015, after first online publication.
REFERENCES
- Amarreh I, Meyerand ME, Stafstrom C, Hermann BP, Birn RM (2014): Individual classification of children with epilepsy using support vector machine with multiple indices of diffusion tensor imaging. Neuroimage Clin 4:757–764. [DOI] [PMC free article] [PubMed] [Google Scholar]
- Archer JS, Briellman RS, Abbott DF, Syngeniotis A, Wellard RM, Jackson GD (2003): Benign epilepsy with centro‐temporal spikes: Spike triggered fMRI shows somato‐sensory cortex activity. Epilepsia 44:200–204. [DOI] [PubMed] [Google Scholar]
- Avanzini G, Manganotti P, Meletti S, Moshe SL, Panzica F, Wolf P, Capovilla G (2012): The system epilepsies: A pathophysiological hypothesis. Epilepsia 53:771–778. [DOI] [PubMed] [Google Scholar]
- Bedoin N, Ciumas C, Lopez C, Redsand G, Herbillon V, Laurent A, Ryvlin P (2012): Disengagement and inhibition of visual‐spatial attention are differently impaired in children with rolandic epilepsy and Panayiotopoulos syndrome. Epilepsy Behav 25:81–91. [DOI] [PubMed] [Google Scholar]
- Berg AT, Berkovic SF, Brodie MJ, Buchhalter J, Cross JH, van Emde Boas W, Engel J, French J, Glauser TA, Mathern GW, Moshe SL, Nordli D, Plouin P, Scheffer IE (2010): Revised terminology and concepts for organization of seizures and epilepsies: Report of the ILAE commission on classification and terminology, 2005‐2009. Epilepsia 51:676–685. [DOI] [PubMed] [Google Scholar]
- Boor S, Vucurevic G, Pfleiderer C, Stoeter P, Kutschke G, Boor R (2003): EEG‐related functional MRI in benign childhood epilepsy with centrotemporal spikes. Epilepsia 44:688–692. [DOI] [PubMed] [Google Scholar]
- Boor R, Jacobs J, Hinzmann A, Bauermann T, Scherg M, Boor S, Vucurevic G, Pfleiderer C, Kutschke G, Stoeter P (2007): Combined spike‐related functional MRI and multiple source analysis in the non‐invasive spike localization of benign rolandic epilepsy. Clin Neurophysiol 118:901–909. [DOI] [PubMed] [Google Scholar]
- Camfield CS, Camfield PR (2014): Rolandic epilepsy has little effect on adult life 30 years later: A population‐based study. Neurology 82:1162–1166. [DOI] [PubMed] [Google Scholar]
- Centeno M, Carmichael DW (2014): Network connectivity in epilepsy: Resting state fMRI and EEG‐fMRI contributions. Front Neurol 5:93. [DOI] [PMC free article] [PubMed] [Google Scholar]
- Chao‐Gan Y, Yu‐Feng Z (2010): DPARSF: A MATLAB toolbox for "pipeline" data analysis of resting‐state fMRI. Front Syst Neurosci 4:13. [DOI] [PMC free article] [PubMed] [Google Scholar]
- Ciumas C, Saignavongs M, Ilski F, Herbillon V, Laurent A, Lothe A, Heckemann RA, de Bellescize J, Panagiotakaki E, Hannoun S, Marinier DS, Montavont A, Ostrowsky‐Coste K, Bedoin N, Ryvlin P (2014): White matter development in children with benign childhood epilepsy with centro‐temporal spikes. Brain 137:1095–1106. [DOI] [PubMed] [Google Scholar]
- Elger CE (2014): Epilepsy: Lost in translation. Lancet Neurol 13:862–863. [DOI] [PubMed] [Google Scholar]
- Garrett DD, Samanez‐Larkin GR, MacDonald SW, Lindenberger U, McIntosh AR, Grady CL (2013): Moment‐to‐moment brain signal variability: A next frontier in human brain mapping? Neurosci Biobehav Rev 37:610–624. [DOI] [PMC free article] [PubMed] [Google Scholar]
- Gong YX, Cai TS (1993): Manual of Chinese Revised Wechsler Intelligence Scale for Children (In Chinese). Changsha: Human Atlas Press. [Google Scholar]
- Gong Q, Li L, Du M, Pettersson‐Yeo W, Crossley N, Yang X, Li J, Huang X, Mechelli A (2014): Quantitative prediction of individual psychopathology in trauma survivors using resting‐state FMRI. Neuropsychopharmacology 39:681–687. [DOI] [PMC free article] [PubMed] [Google Scholar]
- Guerrini R, Pellacani S (2012): Benign childhood focal epilepsies. Epilepsia 53:9–18. [DOI] [PubMed] [Google Scholar]
- Ibrahim GM, Cassel D, Morgan BR, Smith ML, Otsubo H, Ochi A, Taylor M, Rutka JT, Snead OC III, Doesburg S (2014): Resilience of developing brain networks to interictal epileptiform discharges is associated with cognitive outcome. Brain 137:2690–2702. [DOI] [PMC free article] [PubMed] [Google Scholar]
- Jenkinson M, Bannister P, Brady M, Smith S (2002): Improved optimization for the robust and accurate linear registration and motion correction of brain images. Neuroimage 17:825–841. [DOI] [PubMed] [Google Scholar]
- Ji GJ, Zhang Z, Zhang H, Wang J, Liu DQ, Zang YF, Liao W, Lu G (2013): Disrupted causal connectivity in mesial temporal lobe epilepsy. PLoS One 8:e63183. [DOI] [PMC free article] [PubMed] [Google Scholar]
- Kavros PM, Clarke T, Strug LJ, Halperin JM, Dorta NJ, Pal DK (2008): Attention impairment in rolandic epilepsy: Systematic review. Epilepsia 49:1570–1580. [DOI] [PubMed] [Google Scholar]
- Kellaway P (2000): The electroencephalographic features of benign centrotemporal (rolandic) epilepsy of childhood. Epilepsia 41:1053–1056. [DOI] [PubMed] [Google Scholar]
- Kublbock M, Woletz M, Hoflich A, Sladky R, Kranz GS, Hoffmann A, Lanzenberger R, Windischberger C (2014): Stability of low‐frequency fluctuation amplitudes in prolonged resting‐state fMRI. Neuroimage 103:249–257. [DOI] [PubMed] [Google Scholar]
- Laufs H, Rodionov R, Thornton R, Duncan JS, Lemieux L, Tagliazucchi E (2014): Altered FMRI connectivity dynamics in temporal lobe epilepsy might explain seizure semiology. Front Neurol 5:175. [DOI] [PMC free article] [PubMed] [Google Scholar]
- Lemieux L, Salek‐Haddadi A, Lund TE, Laufs H, Carmichael D (2007): Modelling large motion events in fMRI studies of patients with epilepsy. Magn Reson Imaging 25:894–901. [DOI] [PubMed] [Google Scholar]
- Lengler U, Kafadar I, Neubauer BA, Krakow K (2007): fMRI correlates of interictal epileptic activity in patients with idiopathic benign focal epilepsy of childhood. A simultaneous EEG‐functional MRI study. Epilepsy Res 75:29–38. [DOI] [PubMed] [Google Scholar]
- Li Q, Luo C, Yang T, Yao Z, He L, Liu L, Xu H, Gong Q, Yao D, Zhou D (2009): EEG‐fMRI study on the interictal and ictal generalized spike‐wave discharges in patients with childhood absence epilepsy. Epilepsy Res 87:160–168. [DOI] [PubMed] [Google Scholar]
- Luo C, Li Q, Xia Y, Lei X, Xue K, Yao Z, Lai Y, Martinez‐Montes E, Liao W, Zhou D, Valdes‐Sosa PA, Gong Q, Yao D (2012): Resting state basal ganglia network in idiopathic generalized epilepsy. Hum Brain Mapp 33:1279–1294. [DOI] [PMC free article] [PubMed] [Google Scholar]
- Mankinen K, Long XY, Paakki JJ, Harila M, Rytky S, Tervonen O, Nikkinen J, Starck T, Remes J, Rantala H, Zang YF, Kiviniemi V (2011): Alterations in regional homogeneity of baseline brain activity in pediatric temporal lobe epilepsy. Brain Res 1373:221–229. [DOI] [PubMed] [Google Scholar]
- Masterton RA, Harvey AS, Archer JS, Lillywhite LM, Abbott DF, Scheffer IE, Jackson GD (2010): Focal epileptiform spikes do not show a canonical BOLD response in patients with benign rolandic epilepsy (BECTS). Neuroimage 51:252–260. [DOI] [PubMed] [Google Scholar]
- Masterton RA, Jackson GD, Abbott DF (2012): Mapping brain activity using event‐related independent components analysis (eICA): Specific advantages for EEG‐fMRI. Neuroimage 70C:164–174. [DOI] [PubMed] [Google Scholar]
- Moeller F, Moehring J, Ick I, Steinmann E, Wolff S, Jansen O, Boor R, Stephani U, Siniatchkin M (2013): EEG‐fMRI in atypical benign partial epilepsy. Epilepsia 54:e103–8. 10 [DOI] [PubMed] [Google Scholar]
- Nobili L, Ferrillo F, Baglietto MG, Beelke M, De Carli F, De Negri E, Schiavi G, Rosadini G, De Negri M (1999): Relationship of sleep interictal epileptiform discharges to sigma activity (12‐16 Hz) in benign epilepsy of childhood with rolandic spikes. Clin Neurophysiol 110:39–46. [DOI] [PubMed] [Google Scholar]
- Orru G, Pettersson‐Yeo W, Marquand AF, Sartori G, Mechelli A (2012): Using support vector machine to identify imaging biomarkers of neurological and psychiatric disease: A critical review. Neurosci Biobehav Rev 36:1140–1152. [DOI] [PubMed] [Google Scholar]
- Panayiotopoulos CP, Michael M, Sanders S, Valeta T, Koutroumanidis M (2008): Benign childhood focal epilepsies: Assessment of established and newly recognized syndromes. Brain 131:2264–2286. [DOI] [PubMed] [Google Scholar]
- Power JD, Barnes KA, Snyder AZ, Schlaggar BL, Petersen SE (2012): Spurious but systematic correlations in functional connectivity MRI networks arise from subject motion. Neuroimage 59:2142–2154. [DOI] [PMC free article] [PubMed] [Google Scholar]
- Siniatchkin M, Moeller F, Jacobs J, Stephani U, Boor R, Wolff S, Jansen O, Siebner H, Scherg M (2007): Spatial filters and automated spike detection based on brain topographies improve sensitivity of EEG‐fMRI studies in focal epilepsy. Neuroimage 37:834–843. [DOI] [PubMed] [Google Scholar]
- Sundermann B, Herr D, Schwindt W, Pfleiderer B (2014): Multivariate classification of blood oxygen level‐dependent FMRI data with diagnostic intention: A clinical perspective. Am J Neuroradiol 35:848–855. [DOI] [PMC free article] [PubMed] [Google Scholar]
- Tang YL, Ji GJ, Yu Y, Wang J, Wang ZJ, Zang YF, Liao W, Ding MP (2014): Altered regional homogeneity in rolandic epilepsy: A resting‐state FMRI study. Biomed Res Int 2014:960395. [DOI] [PMC free article] [PubMed] [Google Scholar]
- Thomason ME, Dennis EL, Joshi AA, Joshi SH, Dinov ID, Chang C, Henry ML, Johnson RF, Thompson PM, Toga AW, Glover GH, Van Horn JD, Gotlib IH (2011): Resting‐state fMRI can reliably map neural networks in children. Neuroimage 55:165–175. [DOI] [PMC free article] [PubMed] [Google Scholar]
- Vannest J, Szaflarski JP, Eaton KP, Henkel DM, Morita D, Glauser TA, Byars AW, Patel K, Holland SK (2013): Functional magnetic resonance imaging reveals changes in language localization in children with benign childhood epilepsy with centrotemporal spikes. J Child Neurol 28:435–445. [DOI] [PubMed] [Google Scholar]
- Wang Z, Zhang Z, Liao W, Xu Q, Zhang J, Lu W, Jiao Q, Chen G, Feng J, Lu G (2014): Frequency‐dependent amplitude alterations of resting‐state spontaneous fluctuations in idiopathic generalized epilepsy. Epilepsy Res 108:853–860. [DOI] [PubMed] [Google Scholar]
- Xia M, Wang J, He Y (2013): BrainNet Viewer: A network visualization tool for human brain connectomics. PLoS One 8:e68910. [DOI] [PMC free article] [PubMed] [Google Scholar]
- Yan CG, Cheung B, Kelly C, Colcombe S, Craddock RC, Di Martino A, Li Q, Zuo XN, Castellanos FX, Milham MP (2013): A comprehensive assessment of regional variation in the impact of head micromovements on functional connectomics. Neuroimage 76:183–201. [DOI] [PMC free article] [PubMed] [Google Scholar]
- Zang YF, He Y, Zhu CZ, Cao QJ, Sui MQ, Liang M, Tian LX, Jiang TZ, Wang YF (2007): Altered baseline brain activity in children with ADHD revealed by resting‐state functional MRI. Brain Dev 29:83–91. [DOI] [PubMed] [Google Scholar]
- Zeng LL, Wang D, Fox MD, Sabuncu M, Hu D, Ge M, Buckner RL, Liu H (2014): Neurobiological basis of head motion in brain imaging. Proc Natl Acad Sci USA 111:6058–6062. [DOI] [PMC free article] [PubMed] [Google Scholar]
- Zhang Z, Lu G, Zhong Y, Tan Q, Chen H, Liao W, Tian L, Li Z, Shi J, Liu Y (2010): fMRI study of mesial temporal lobe epilepsy using amplitude of low‐frequency fluctuation analysis. Hum Brain Mapp 31:1851–1861. [DOI] [PMC free article] [PubMed] [Google Scholar]
- Zhang J, Cheng W, Wang Z, Zhang Z, Lu W, Lu G, Feng J (2012): Pattern classification of large‐scale functional brain networks: Identification of informative neuroimaging markers for epilepsy. PLoS One 7:e36733. [DOI] [PMC free article] [PubMed] [Google Scholar]
- Zhang Z, Xu Q, Liao W, Wang Z, Li Q, Yang F, Liu Y, Lu G (2015): Pathological uncoupling between amplitude and connectivity of brain fluctuations in epilepsy. Hum Brain Mapp, doi: 10.1002/hbm.22805. [DOI] [PMC free article] [PubMed] [Google Scholar]
- Zuo XN, Xing XX (2014): Test‐retest reliabilities of resting‐state FMRI measurements in human brain functional connectomics: A systems neuroscience perspective. Neurosci Biobehav Rev 45:100–118. [DOI] [PubMed] [Google Scholar]
Associated Data
This section collects any data citations, data availability statements, or supplementary materials included in this article.
Supplementary Materials
Supporting Information