

Abstract
Detailed information regarding the neuroanatomy of reciprocal cerebrocerebellar pathways is based on well‐documented animal models. This knowledge has not yet been fully translated to humans, in that the structure of reciprocal cerebrocerebellar pathways connecting the cerebellum with frontal lobe has not been shown in its entirety. We investigated the impact of injury and age on cerebrocerebellar pathway microstructure using diffusion tensor imaging (DTI) and probabilistic tractography. We used medulloblastoma (MB) as an injury model due to the known impact of tumor/treatment on the cerebellum, one of the main nodes of cerebrocerebellar pathways. We delineated and segmented reciprocal cerebrocerebellar pathways connecting the cerebellum with frontal lobe in 38 healthy children (HC) and 34 children treated for MB, and compared pathway segment DTI measures between HC and MB and across three age cohorts: childhood, early adolescence, and late adolescence. Pathway compromise was evident for the MB group compared to HC, particularly within posterior segments (Ps<0.01). Though we found no age effect, group differences in microstructure were driven by pathway segment (posterior) and age cohort (adolescence), which may reflect the extent of injury to the posterior fossa following treatment for MB and age cohort differences in radiation treatment protocol in our sample. We have examined the microstructure of reciprocal cerebrocerebellar connections in the pediatric brain and have found that these pathways are injured in MB, a clinical population treated with surgery, radiation, and chemotherapy. Our findings support the late effects literature describing white matter injury emergence in the years following treatment for MB. Hum Brain Mapp 36:2615–2628, 2015. © 2015 Wiley Periodicals, Inc.
Keywords: cerebrocerebellar pathways, medulloblastoma, diffusion tensor imaging, probabilistic tractography, posterior fossa tumor, white matter injury, radiation
Abbreviations
- CPC
cerebro‐ponto‐cerebellar
- CRT
cranial radiation therapy
- CTC
cerebello‐thalamo‐cerebral
- CTX
chemotherapy
- HC
healthy controls
- MB
medulloblastoma
INTRODUCTION
Our current understanding of the structural and functional connectivity of cerebrocerebellar circuits is based on well‐documented animal models and several adult human studies, but the structure of reciprocal cerebrocerebellar pathways connecting the cerebellum and frontal lobe has not yet been shown in its entirety in humans, particularly in the pediatric brain. Moreover, a detailed segmentation of these pathways to provide insight into localized microstructure of cerebrocerebellar circuitry has yet to be completed. We established an approach to document cerebellar‐frontal and frontal‐cerebellar (i.e., reciprocal) connections and their segmentations in healthy children and in children treated for a brain tumor. Comparing white matter connections across these groups of children can increase our understanding of how injury may disrupt cerebrocerebellar communication. Specifically, we used medulloblastoma (MB), the most common malignant central nervous system (CNS) tumor in childhood, as a brain injury model due to the known impact of tumor and treatment on the cerebellum. Our findings have the potential to contribute to the understanding of the late effects of treatment for this disease, in that examining the structure of cerebrocerebellar pathways may aid in identifying a neurological substrate of specific cognitive and behavioral outcomes in pediatric brain tumor survivors.
MB is the most common malignant pediatric brain tumor arising in the posterior fossa (PF). MB is typically treated with a combination of surgery, craniospinal radiation therapy (CRT), and chemotherapy (CTX) and significant neurotoxicity has been documented in this population post‐treatment [Khong et al., 2003; Mabbott et al., 2006b; Mulhern et al., 2001; Reddick et al., 2005; Law et al., 2011, 2012]. Late effects following treatment for MB are also well documented and include multiple neurocognitive and psychosocial problems; many of these problems are attributed to diffuse white matter damage following whole‐brain CRT [Mulhern et al., 2001; Mabbott et al., 2006a, b; Law et al., 2011; Reddick et al., 2003]. Overall, research has focused on describing the nature and time course of neurocognitive late effects in survivors of pediatric PF tumors. Less well understood are the neural mechanisms or correlates of such declines—particularly with respect to examining the microstructure of white matter connections and how injury to specific pathways may relate to deficits. Children treated for MB provide an ideal brain injury model to investigate cerebrocerebellar connections for several reasons. First, children treated for MB may show significant compromise to these connections because one of the main nodes in the pathway is impacted due to mass effect of tumor and both whole‐brain and targeted PF/tumor bed CRT. Additionally, the structural organization of these pathways may have important implications for cognitive and behavioral outcome in children following treatment for MB. Examining cerebrocerebellar connections and their localized segments will provide insight into the regions along these circuits that sustain the most damage from treatment for MB and serve as a starting point for future investigations of cerebrocerebellar contribution to cognitive and behavioral outcomes in this population.
The cerebrocerebellar system represents one of the largest white matter pathways in the CNS [Apps and Watson, 2009], comprised of a closed‐loop circuit connecting the cerebellum with cerebral cortex. Cerebro‐ponto‐cerebellar (CPC) connections serve to relay information from the cortex to cerebellum via pontine nuclei; the cerebellum returns these projections to the cerebral cortex by way of thalamic nuclei, via cerebello‐thalamo‐cerebral (CTC) connections [Asanuma et al., 1983; Brodal, 1978; Middleton and Strick, 1997, 2000, 2001; Schmahmann and Pandya, 1997a, b; Thach, 1972; Thach and Jones, 1979]. Thus, CPC and CTC pathways serve as bilateral, reciprocal cerebrocerebellar feedforward and feedback mechanisms. The frontal cortex (e.g., prefrontal and premotor regions) is conventionally regarded as the main cortical node of these pathways [Schmahmann, 1991, 1996; Middleton and Strick 1994, 1997], though the cerebellum also has projections to posterior parietal, superior temporal, parahippocampal, and cingulate regions via thalamic and basilar pontine relays [see Schmahmann 1996, for a review]. This study focuses on cerebrocerebellar pathways that are reciprocal in connecting the cerebellum with frontal lobe (herein referred to as CPC and CTC pathways), as these cerebellar‐frontal connections are thought to underlie not only motor control and timing of movement [Brodal and Bjaalie, 1997; Glickstein, 1992, 1993; Stein and Glickstein, 1992], but many aspects of cognition and behavior [Allen et al., 1997; Chen and Desmond, 2005; Desmond et al., 1998; Fiez et al., 1996; Ivry and Baldo, 1992; Kim et al., 1994; Law et al., 2011; Schmahmann, 2004].
Evidence for the structure and directionality of reciprocal CPC and CTC pathways connecting the cerebellum with frontal lobe is derived primarily from nonhuman primate studies; these cerebrocerebellar connections have been described postmortem and in vivo using virus tracers to label synaptically linked neurons [Kelly and Strick, 2003; Middleton and Strick, 1994, 2001]. As the main cerebellar afferent pathway, CPC fibers arise from nerve cells in the frontal cortex and descend through the posterior limb of the internal capsule, terminating on the pontine nuclei [Bähr et al., 2005; Schmahmann, 1996]. Fibers then decussate within the pons and enter the contralateral cerebellar hemisphere via the middle cerebellar peduncle [Bähr et al., 2005; Schmahmann, 1996]. This feedforward portion of the cerebrocerebellar pathway is synaptically interrupted in the pontine nuclei [Brodal and Bjaalie, 1997], hence forming cerebro‐ponto and pontocerebellar pathways. The CTC pathway is one of the main cerebellar efferent circuits, originating in deep cerebellar nuclei and projecting to the contralateral red nucleus [Bähr et al., 2005; Schmahmann, 1996]. From the red nucleus, this pathway continues until it reaches synaptic relay nuclei in the thalamus; these fibers then ascend to terminate within the frontal cortex [Bähr et al., 2005; Schmahmann, 1996]. Thus, the CTC pathway can be parsed into component pathways: cerebello‐rubro, rubro‐thalamo, and thalamo‐cerebral.
Functional imaging in adult human populations has shown evidence of these pathways [Allen et al., 2005; Dum and Strick, 2003; Kim et al., 1994; Middleton and Strick, 1997, 2000]. Furthermore, solitary (e.g., nonreciprocal) connections from cerebellum to cortex have been outlined using diffusion tensor imaging (DTI). These include cerebellar projections to frontal cortex [Salmi et al., 2010], and to prefrontal and posterior parietal cortices [Jissendi et al., 2008] in small samples of adult humans, and the connection between cerebellum and dorsolateral prefrontal cortex in children [Law et al., 2011, 2012]. DTI has also been used to define segments of pathways that constitute reciprocal cerebrocerebellar connections in adult humans [Habas and Cabanis, 2006, 2007a, b; Ramnani et al., 2006]. However, the structure of complete and reciprocal cerebrocerebellar pathways has not yet been shown in children or in the injured brain.
We used DTI and probabilistic tractography to define cerebrocerebellar pathways in the pediatric brain. Tractography defines white matter pathways based on regions of interest (ROIs) including a specific start point (i.e., seed point) and areas of relay or endpoints (i.e., way points). The main limitation of the above body of literature is a lack of utilizing anatomically defined, known points of synapse within the pathways as ROIs (e.g., seed and waypoints). In this study, our intent was to rectify this problem by clearly delineating these pathways using DTI tractography combined with anatomically relevant seed and waypoints, based on known animal models of cerebrocerebellar connectivity. Further, we sought to segment these pathways based on synaptically defined points along the circuits to produce discrete pathways: using cerebro‐ponto and pontocerebellar segmentations for the CPC pathway, and cerebello‐rubro, rubro‐thalamo, and thalamo‐cerebral segmentations for the CTC pathway. This segmentation was necessary to examine and compare localized regions of the pathway in injury and health, and to identify areas of the pathway most affected by cerebellar injury.
Once pathways were defined, we examined their microstructure using DTI. DTI is an ideal technology to use for these purposes because it generates indices that reflect white matter microstructure based on the amplitude and directional anisotropy of water diffusion in tissue [Basser, 1995]. DTI indices include eigenvalues, λ 1, λ 2, λ 3; these eigenvalues are combined to provide summary measures of fractional anisotropy (FA) and mean diffusivity (MD), as well as axial and radial diffusivity (AD and RD, respectively). This data can in turn be used to infer the microstructural organization of white matter and to identify whether injury to white matter regions or pathways (e.g., demyelination, axonal damage) is evident [Jones and Leemans, 2011; Mori and Zhang, 2006; Song et al., 2002]. Lower measures of FA and higher measures of MD, AD, and RD are thought to reflect axonal degeneration and compromised myelin sheath integrity [Beaulieu, 2002; Song et al., 2002].
We predicted that we would successfully obtain and segment cerebrocerebellar connections into their distinct and reciprocal feedforward and feedback loops in all participants. We also predicted that DTI indices reflective of white matter injury (e.g., lower FA and higher MD, AD, and RD) would be evident in children treated for MB relative to healthy children, particularly for more posteriorly located pathway segments (i.e., within the PF, such as cerebello‐rubro, pontocerebellar), as these regions are likely to sustain significant injury due to tumor and treatment effects.
MATERIALS AND METHODS
Participants
Thirty‐eight healthy control children (HC) and 34 children treated for MB participated in this study. All participants were seen at the Hospital for Sick Children (SickKids) and the protocol for this study was approved by the Research Ethics Board. All participants provided written informed consent or assent and parental consent was obtained where applicable. Demographic variables were compared between HC and MB groups (see Table 1). There were no differences between the groups for gender [χ 2 (1) = 0.076, P = 0.782], age at time of MRI scan [F(1,70) = .001, P = 0.976], type of MRI (1.5T vs. 3T, see below) [χ 2 (1) = 2.006, P = 0.157], and handedness [χ 2 (1) = 0.713, P = 0.398]. Medical variables for the MB group are presented in Table 2.
Table 1.
Demographic variables for the MB and HC groups
| MB | HC | |
|---|---|---|
| n = 34 | n = 38 | |
| Sex (Male : Female) | 19 : 15 | 20 : 18 |
| Age at scan (years) | ||
| Mean (SD) | 12.74 (3.29) | 12.72 (2.95) |
| Range | 8.04–18.98 | 7.02–18.87 |
| Age tertiles | ||
| 7–11 years (Childhood) | 13 | 10 |
| 11.01–13.99 years (Early adolescence) | 9 | 15 |
| 14 years and over (Late adolescence) | 12 | 13 |
| Handednessa | ||
| Right | 27 (79.4%) | 33(86.8%) |
| Left | 7 (20.6%) | 5 (13.2%) |
| MRI Scan Type | ||
| 1.5T | 14 (41.2%) | 22 (57.9%) |
| 3T | 20 (58.8%) | 16 (42.1%) |
Numbers reflect handedness at time of current assessment (note that for 3 MB, handedness changed postoperatively). Percentages represent within group totals.
Table 2.
Medical variables for the MB group
| MB | |
|---|---|
| n = 34 | |
| Age at diagnosis (years) | |
| Mean (SD) | 7.12 (2.81) |
| Range | 1.32–15.16 |
| Age tertiles—mean (SD) | |
| Childhood | 6.77 (2.17) |
| Early adolescence | 6.29 (2.09) |
| Late adolescence | 8.31 (3.66) |
| Time since diagnosis to testing (years) | |
| Mean (SD) | 5.71 (3.80) |
| Range | 1.10–13.64 |
| Age tertiles—mean (SD) | |
| Childhood | 3.00 (1.76) |
| Early adolescence | 5.43 (2.35) |
| Late adolescence | 8.42 (4.25) |
| Tumor size (mm2)a | |
| Mean (SD) | 2,019.31 (817.23) |
| Range | 957–3770 |
| Tumor location within PF | |
| Midline | 31 (91.2%) |
| Left hemispheric | 1 (2.9%) |
| Right hemispheric | 2 (5.9%) |
| Surgical outcome/extent of resection (%) | |
| Greater than 95% of the tumor resected | 31 (91.2%) |
| Between 50% and 95% of the tumor resected | 3 (8.8%) |
| Hydrocephalus | |
| No hydrocephalus | 7 (20.6%) |
| Hydrocephalus not requiring treatment (resolved) | 11 (32.3%) |
| Hydrocephalus requiring medical intervention or CSF diversion | 16 (47.1%) |
| EVD and/or shunt | |
| Yes | 18 (52.9%) |
| No | 16 (47.1%) |
| Ventriculostomy | |
| Yes | 5 (14.7%) |
| No | 29 (85.3%) |
| Presence of postoperative/residual complicationb | |
| Yes | 31 |
| No | 3 |
| Presence of multiple postoperative complications | |
| Yes | 21 |
| No | 13 |
| Radiation dose (cGy) and fieldc | |
| Standard CRT dose + tumor bed boostd | 3 |
| Median head/spine dose (Range) | 3,600 (3,060–3,600) |
| Median boost dose (Range) | 1,980 (1,800–2,340) |
| Standard CRT dose + PF boost | 6 |
| Median head/spine dose (Range) | 3,600 (3,060–3,600) |
| Median boost dose (Range) | 1,800 (1,800–1,980) |
| Reduced CRT dose + tumor bed boost | 16 |
| Median head/spine dose (Range) | 2,340 (1,980–2,340) |
| Median boost dose (Range) | 3,240 (3,060–3,240) |
| Reduced CRT dose + PF boost | 9 |
| Median head/spine dose (Range) | 2,340 (1,980–2,340) |
| Median boost dose (Range) | 3,150 (3,060–3,600) |
| Radiation dose and field by age tertile | |
| Childhood | |
| Reduced CRT dose + tumor bed boost | 10 |
| Other | 3 |
| Early adolescence | |
| Reduced CRT dose + tumor bed boost | 2 |
| Other | 7 |
| Late adolescence | |
| Reduced CRT dose + tumor bed boost | 4 |
| Other | 8 |
| Chemotherapye | |
| Yes | 33 (97.1%) |
| No | 1 (2.9%) |
Tumor size was calculated by multiplying the two largest measurements of the tumor from an anatomical MRI scan. Measurements are in mm2. Tumor size dimensions were not available for 6 MB.
Indicates the presence of a single postoperative or residual complication, whether a cerebellar complication (i.e., ataxia, mutism, and dysarthria) or other complications (i.e., hydrocephalus, nystagmus, diplopia, hemiparesis, hearing impairment, and cranial nerve deficits). Presence of multiple postoperative complications indicates the incidence of 2 or more of the complications listed above.
All in the MB group received CRT at time of diagnosis, with the exception of one patient for which CRT was administered years following diagnosis, on recurrence (age of diagnosis < 2 years, thus CRT was not considered on initial treatment).
Four radiation dose and field protocol were considered—reduced CRT dose + tumor bed boost versus “other” protocols: reduced CRT dose + PF boost, standard CRT dose + tumor bed boost, and standard CRT dose + PF boost.
Agents included Carboplatin, Cisplatin, Cyclophosphamide, Lomustine (CCNU), and Vincristine.
To simplify and account for the potential impact of age on the structure of cerebrocerebellar pathways, we used two tertiles (11 and 14) to split age across groups into thirds, producing three age bands: 7–11 years, 11.01–13.99 years, and 14 years and over (Table 2). This tertile split of age roughly coincides with major milestones in development: age 7–11 marks a time of middle childhood or preadolescence prior to puberty; age 12–14 is early adolescence in which puberty takes place, and ages 15–18 reflect a transition from late adolescence into young adulthood. No differences were found when examining the distribution of participants in both the HC and MB groups for age tertiles [χ 2 (2) = 1.714, P = 0.424]. Within the MB group, there were no differences between age tertiles and age at diagnosis [F(2,31) = 1.589, P = 0.220]; there was, however, a significant difference for time since diagnosis/treatment to testing between age tertiles [F(2,31) = 10.169, P < 0.001] with the 7–11 year group being fewer years out from treatment compared to the 14 years and over group (P < 0.001). Lastly, when comparing radiation dose between age tertiles, there was no significant difference for treatment with standard‐ versus reduced‐dose CRT + PF/tumor bed boost [χ 2 (2) = 3.730, P = 0.155]. A recent study has shown that it may be radiation field size, not radiation dose alone, that has implications for late effects following treatment for MB [Moxon‐Emre et al., 2014]. Between age tertiles, there was a significant difference when considering radiation dose and field together (i.e., reduced CRT + tumor bed boost versus “other”, more intensive protocols: reduced CRT + PF boost, standard CRT + tumor bed boost, and standard CRT + PF boost) [χ 2 (2) = 6.103, P = 0.047]. A greater proportion of the childhood group received the less intensive reduced CRT + tumor bed boost while a greater proportion of the late adolescence group were treated with the “other” protocols (see Table 2).
Neuroimaging Protocol
MRI measurements were performed at SickKids using either a GE LX 1.5T MRI scanner with eight channel head coil (22 HC and 14 MB) or a Siemens 3T whole‐body MRI scanner (Trio Tim syngo MR B17 system) with a 12‐channel head coil (16 HC and 20 MB). The GE LX 1.5T MRI protocol included a 3D‐T1 FSPGR gradient echo, inversion recovery‐prepared sequence (IR time = 400 ms, TE/TR = 4.2/10.056 ms, 116–124 contiguous axial slices, flip angle = 90°, NEX = 1, 256 × 192 matrix interpolated to 256 × 256, FOV = 240 × 240mm, rbw = 162.734 kHz, slice thickness = 1.5 mm) and a diffusion‐weighted single shot spin echo DTI sequence with EPI readout (25–31 directions, b = 1,000s/mm2, TE/TR = 85.5/15,000 ms, 45–50 contiguous axial slices, flip angle = 90°, NEX = 1, 128 × 128 matrix interpolated to 256 × 256, FOV = 240 × 240mm, rbw = 1,953.12 kHz, slice thickness = 3 mm). The Siemens 3T MRI protocol utilized a 3D‐T1 MPRAGE Grappa 2 protocol (TE/TR = 3.91/2,300 ms, 160 contiguous axial slices, flip angle = 90°, 256 × 224 matrix, FOV = 256 × 224 mm, voxel size = 1 mm ISO) and diffusion‐weighted single shot spin echo DTI sequence with EPI readout (30 directions, b = 1,000 s/mm2, TE/TR = 90/9,000 ms, 70 contiguous axial slices, flip angle = 90°, 122 × 122 matrix interpolated to 244 × 244, FOV = 244 × 244 mm, voxel size = 2 mm ISO). The images were preprocessed and DTI indices and maps (e.g., eigenvalues, FA, MD, AD, and RD) were calculated using the FMRIB Software Library (FSL) [Behrens et al., 2003a, b; Smith et al., 2004; Woolrich et al., 2009] to serve as a basis for probabilistic tractography. The 3T MRI was our preference for collecting imaging data for this study due to its higher field strength and thus, greater capacity for higher resolution images. However, to ensure a greater sample size, it was necessary to use data acquired with the 1.5T MRI. Data was acquired at 1.5T for two reasons. First, due to the presence of external ventricular drains or shunts occasionally required as part of tumor treatment, a proportion of children treated for MB were ineligible to be scanned on the 3T (see Table 1); these devices are deemed 3T incompatible as artifact (e.g., susceptibility) is more prevalent at higher field strengths (Olsrud et al., 2005). Second, due to the retrospective nature of this study, MB patients previously seen at 1.5T (when 3T was unavailable) were included in this study. We scanned one individual on both the 1.5T and 3T machines to compare the signal to noise (SNR) ratios for the zero diffusion weighted images (SNR = 28.5 for 1.5T and SNR = 70.7 for 3T). Because of the differing MRI protocol and SNR, we ensured to match HC and MB for scanner type for both the retrospective and newly acquired data. Further, MRI scanner type was included as a covariate in all analyses of imaging data.
ROI Placement and Standardization for DTI Tractography
To provide a standardized protocol for ROI placement, all ROIs were drawn on axial sections of the zero diffusion‐weighted (β 0) images of 10 randomly selected HC. The following ROIs were produced for all 10 individuals using FSL [Behrens et al., 2003a, b; Smith et al., 2004; Woolrich et al., 2009]: left and right frontal hemispheric white matter; left and right thalamus; left and right red nucleus; pons; left and right superior cerebellar peduncles; and left and right cerebellar hemispheric white matter (See Fig. 1 for detailed description of ROI placement). The 10 sets of individually‐delineated ROIs (11 ROIs per individual) were then combined into a single composite volume using Analyze Software (Biomedical Imaging Resource, Mayo Foundation, Rochester, MN) and registered to a template brain using Automated Image Registration (AIR) [Woods et al., 1998] software to produce template ROIs. Prior to tractography, the resultant template ROIs were registered to each participant's β 0 image using AIR [Woods et al., 1998]. Once ROIs were brought into the native space for each participant, they were visually examined and, if necessary, smaller ROIs (e.g., superior cerebellar peduncle, red nucleus) were manually refined so that they covered only the appropriate region. For an outline of pathways of interest, their segmentations, and ROIs used, see Table 3.
Figure 1.
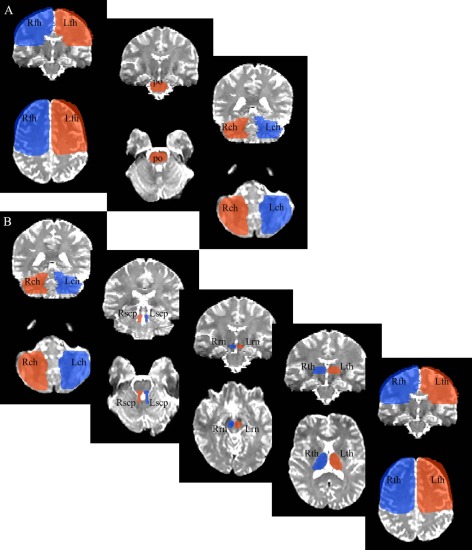
ROIs used for probabilistic tractography. Panel A: the ROIs used to delineate the bilateral CPC pathway. Panel B: the ROIs used to delineate the bilateral CTC pathway. Top boxes depict coronal sections and bottom boxes axial sections (in radiological orientation). Because left frontal hemisphere (Lfh) and right frontal hemisphere (Rfh) ROIs included the whole of the frontal lobe, an existing anatomical template protocol [described in Kabani et al., 2002; Mabbott et al., 2009; Law et al., 2011; Law et al., 2012] was used to delineate these ROIs. Left thalamus (Lth) and right thalamus (Rth) ROIs were delineated using the third ventricle as the medial boundary and genu and posterior limb of the internal capsule as anterior and lateral boundaries, respectively. At its most ventral and posterior aspect, Lth and Rth ROIs were terminated once the anterior and posterior commissures were no longer visible. The pons (po) ROI was drawn on the first dorsal/anterior slice that it was visible (e.g., trigeminal nerve and fourth ventricle just becoming apparent), using midbrain structures (e.g., cerebral peduncles) as the anterior boundaries, and medial lemniscus as caudal/posterior boundary, and was terminated once the first segment of basilar pons was encountered. The left red nucleus (Lrn) and right red nucleus (Rrn) ROIs were drawn on the first rostral midbrain slice in which it becomes visible, using the cerebral peduncles and substantia nigra as anterior/rostral and posterior/caudal reference points, respectively. The left superior cerebellar peduncle (Lscp) and right superior cerebellar peduncle (Rscp) ROIs were defined on the most dorsal slice in which the structure became present, avoiding the pons rostrally and the fourth ventricle caudally and medially, terminating once middle cerebellar peduncles were evident. Lastly, left cerebellar hemisphere (Lch) and right cerebellar hemisphere (Rch) ROIs included the cerebellar hemispheres, avoiding the vermis and fourth ventricle medially, and concluding once cerebellar white matter was no longer evident. ROIs of the same colour depict those used to define a pathway, with the exception of po, which was used for both the left and right (bilateral) CPC pathways.
Table 3.
Delineating CPC and CTC pathways
| Pathway | CPC | CTC | ||
|---|---|---|---|---|
| Side | Left | Right | Left | Right |
| ROIs | Seed point: Left frontal hemisphere/lobe (Lfh) | Seed point: Right frontal hemisphere/lobe (Rfh) | Seed point: Left cerebellar hemisphere (Lch) | Seed point: Right cerebellar hemisphere (Rch) |
| Way points: pons (po), Right cerebellar hemisphere (Rch) | Way points: pons (po), Left cerebellar hemisphere (Lch) | Way points: Left superior cerebellar peduncle (Lscp), Right red nucleus (Rrn), Right thalamus (Rth), Right frontal hemisphere/lobe (Rfh) | Way points: Right superior cerebellar peduncle (Rscp), Left red nucleus (Lrn), Left thalamus (Lth), Left frontal hemisphere/lobe (Lfh) | |
| Segmentations | cerebro‐ponto | cerebro‐ponto | cerebello‐rubro | cerebello‐rubro |
| pontocerebellar | pontocerebellar | rubro‐thalamo | rubro‐thalamo | |
| thalamo‐cerebral | thalamo‐cerebral | |||
Pathway type, side, and segmentations are detailed, as well as the ROIs used for probabilistic tractography.
DTI Probabilistic Tractography and Pathway Segmentation
Probabilistic tractography was used to delineate bilateral CPC and CTC pathways connecting each cerebellar hemisphere with contralateral frontal cortex and to examine the microstructure of pathways. First, BEDPOSTX was run using FSL's Diffusion Toolbox (FDT) [Behrens et al., 2003a, b] to build up distributions on diffusion parameters at each voxel (creating all of the information necessary to run tractography). Then, probabilistic tractography was completed using FDT PROBTRACKX algorithm [Behrens et al., 2003a, b]. To delineate the CPC pathway (Fig. 1A), the left (or right) frontal hemisphere was used as a seed point and the pons and right (or left) cerebellar hemisphere were waypoints. To delineate the CTC pathway (Fig. 1B), the left (or right) cerebellar hemisphere was used as a seed point and the left (or right) superior cerebellar peduncle, right (or left) red nucleus, right (or left) thalamus, and right (or left) frontal hemisphere were waypoints (see Table 3). Thresholds of 10% were set for all pathways and, if necessary, pathways were edited to eliminate erroneous streamlines. Following the delineation of each pathway in its entirety, manual segmentation into component pathways was completed to examine discrete, localized microstructure of white matter comprising the pathways. Segmentations were based on known points of synapse within cerebrocerebellar pathways documented in animal models. The bilateral CPC pathway was parsed into two segments: cerebro‐ponto and pontocerebellar pathways. Cerebro‐ponto pathways included the whole of the CPC pathway within the forebrain and concluded once entrance into the pons was attained. Ponto‐cerebellar pathways included the remainder of the CPC pathway from pons to contralateral cerebellum. The bilateral CTC was parsed into three segments: cerebello‐rubro, rubro‐thalamo, and thalamo‐cerebral pathways. Cerebello‐rubro pathways included the CTC pathway within the cerebellum and ipsilateral superior cerebellar peduncles, and concluded once it reached contralateral red nucleus. Rubro‐thalamo pathways began within the red nucleus and terminated at its entrance into the thalamus. Thalamo‐cerebral pathways thus comprised the remainder of the CTC pathway from thalamus to frontal cortex. Means and standard deviations for DTI indices FA, MD, AD, and RD were calculated for each segment of each pathway.
To qualitatively examine the range of outcome for each pathway between the groups (e.g., the distribution of location points along the pathways), we began by registering all participants' pathways to a common space (i.e., the template brain that was used for our ROI generation). Then, the x, y, and z coordinates for CPC and CTC pathway points within each ROI were obtained for every participant. Specifically, for the CPC pathway: coordinates were recorded for each participant for the point in which this pathway (a) originated in the frontal lobe, (b) begun its decussation within the pons, and (c) terminated in the cerebellum. Similarly, for the CTC pathway: coordinates were recorded for each participant in which this pathway (a) originated in the cerebellum, (b) entered the superior cerebellar peduncle, (c) entered the red nucleus, (d) begun its exit from the thalamus, and (e) terminated in the frontal lobe.
Statistics/Analytic Approach
Using SPSS version 19, we performed eight repeated‐measures ANOVAs (side × segment), running DTI indices separately, with group and age tertiles as between‐subject variables. The first four of these models examined FA, MD, AD, and RD of the CPC pathway between group and age using 2 side (left or right) × 2 segment (cerebro‐ponto or pontocerebellar) repeated measures ANOVAs. The next four models examined FA, MD, AD, and RD of the CTC pathway using 2 side (left or right) × 3 segment (cerebello‐rubro, rubro‐thalamo, or thalamo‐cerebral) repeated measures ANOVAs. As part of these analyses, planned tests of simple effects were used. This was done to examine the a priori hypothesis that MB patients show compromise to white matter microstructure within the CPC and CTC pathways relative to HC. Bonferroni‐adjusted significance tests were used for all pairwise comparisons within the parameters of SPSS.
RESULTS
Visualization and Examination of Bilateral Reciprocal Cerebrocerebellar Pathways
CPC and CTC pathways were produced in all participants (Fig. 2). Pathway anatomical locations were confirmed by a neuroradiologist (SL). For all participants, the CPC pathway connected frontal cortex with pontine nuclei via internal capsule and cerebral peduncle; after decussating in the pons, the CPC pathway proceeded into cerebellar hemispheric white matter via middle cerebellar peduncle. The CTC pathway connected cerebellar hemispheric white matter with contralateral red nucleus via superior cerebellar peduncle (decussating in the midbrain); from there, the CTC pathway continued ipsilaterally to thalamic nuclei before proceeding to frontal white matter. Regardless of group, pathways were qualitatively similar, shown by the distribution of pathway locations within each ROI between the MB and HC groups (see Fig. 3). However, there appeared to be a pattern for the CPC and CTC pathway points within the cerebellar ROIs. Specifically, the range of outcomes for the MB group seemed to be distributed more midline cerebellar compared to the HC group, which appeared more lateral cerebellar (see Fig. 3 for an example of the CPC and CTC range of outcomes within the right cerebellar hemisphere).
Figure 2.
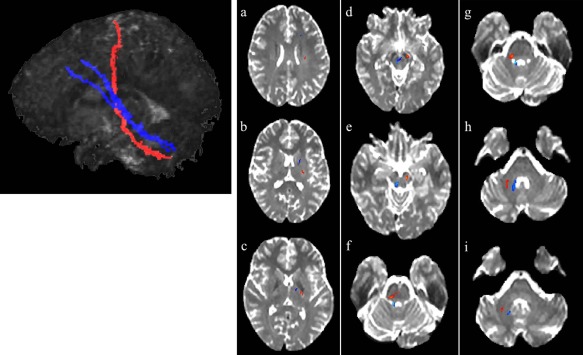
CPC and CTC pathways connecting left frontal hemisphere with right cerebellar hemisphere in a healthy brain (radiological orientation). The leftmost panel depicts the CPC (in orange) and CTC (in blue) pathways in their entirety in sagittal view (for visualization purposes). Panels a–i: the CPC and CTC pathways from the frontal lobe to the cerebellum in axial sections. Panels a–c: the CPC and CTC pathways within the forebrain. Note the more rostral and anterior position of the CTC relative to the CPC pathway (which is more posterior and dorsal). Panels a,b: the CPC and CTC pathways as they are situated within the frontal cortex. Panel c: the CPC and CTC pathways after exiting the cerebral cortex but prior to entering midbrain. The CTC pathway is within the thalamus while the CPC pathway runs through the posterior limb of the internal capsule. Panel d,e: CPC and CTC pathways within the midbrain. Panel d: the CTC pathway progressing through the red nucleus and beginning its decussation. The CPC pathway runs through the cerebral peduncles. Panel e: the CPC pathway continuing through the cerebral peduncles and the CTC completing its decussation and progressing toward superior cerebellar peduncles. Panels f–i: CPC and CTC pathways within the hindbrain. Panels f,g: the CPC pathway as it decussates within the pons (f) and proceeds through middle cerebellar peduncles (g) while the CTC pathway progresses through the superior cerebellar peduncles. Panels h,i: the CPC and CTC pathways within cerebellar hemispheric white matter. Note the more medial position of the CTC pathway relative to the lateral location of the CPC pathway. Generated with Analyze and FSL Software.
Figure 3.
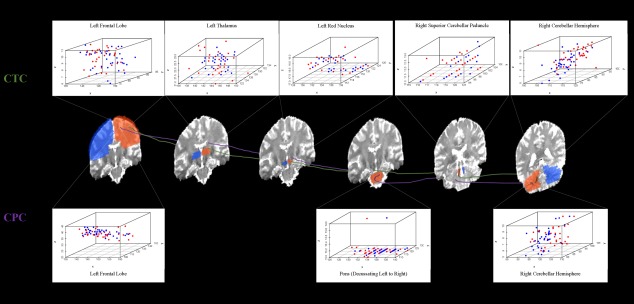
Morphological distribution of points along the CPC and CTC pathways by group (MB = red dots, HC = blue dots). The approximate locations of the CPC (purple) and CTC (green) pathways within the ROIs (blue and orange brain regions; refer to Fig. 1) as they connect the left frontal lobe with right cerebellar hemisphere. Distribution of tractography location points are depicted for the MB and HC groups within the left frontal lobe ROI, pons ROI (decussation from left to right), and left cerebellar hemisphere ROI for the CPC pathway and within the left frontal lobe ROI, left thalamus ROI, left red nucleus ROI, right superior cerebellar peduncle ROI, and right cerebellar hemisphere ROI for the CTC pathway. Comparable scatterplots within each ROI were obtained for the CPC and CTC pathways connecting the right frontal lobe with left cerebellar hemisphere.
Microstructure of Reciprocal Cerebrocerebellar Pathways—Impact of Injury and Age
All main effects and interactions are shown in Table 4. We found significant main effects of group for CPC pathway FA (P = 0.001; Fig. 4a), MD (P < 0.001), and RD (P < 0.001). For CPC FA, there was a main effect of segment (P = 0.01), with higher FA in cerebro‐ponto versus pontocerebellar pathways. There were group × side interactions for CPC MD and RD; higher measures of both were found for the left CPC pathway for the MB group compared to HC. We also found a significant group × age × side × segment interaction for FA (P = 0.04). Tests of simple effects showed no effect of group in childhood; however, we observed group effects in early adolescence for the left cerebro‐ponto (P = 0.005) and left ponto‐cerebellar pathways (P = 0.008), as well as in late adolescence for the right ponto‐cerebellar segment (P = 0.002) (see Fig. 4b).
Table 4.
Significant main effects and interactions across cerebrocerebellar pathways for the HC and MB groups
| Pathway | ||||||||
|---|---|---|---|---|---|---|---|---|
| CPC | CTC | |||||||
| Main Effect | FA | MD | AD | RD | FA | MD | AD | RD |
| Group | ||||||||
| F (P) | 11.53 (0.001) | 12.97 (0.001) | — | 17.69 (<0.001) | 7.88 (0.007) | 17.80 (<0.001) | 9.83 (0.003) | 17.73 (<0.001) |
| Side | ||||||||
| F (P) | — | — | — | — | 6.142 (0.02) | — | — | — |
| Segment | ||||||||
| F (P) | 6.40 (0.01) | — | — | — | 10.62 (<0.001) | — | 6.38 (0.003) | — |
| Interactions | ||||||||
| Group × Side | ||||||||
| F (P) | — | 6.85 (0.01) | — | 5.34 (0.02) | — | — | — | — |
| Group × Segment | ||||||||
| F (P) | — | — | — | — | 3.19 (<0.05) | 5.67 (0.005) | 5.25 (0.008) | 6.27 (0.003) |
| Group × Age × Side | ||||||||
| F (P) | — | — | — | — | 5.97 (0.004) | — | — | — |
| Group × Age × Side × Segment | ||||||||
| F (P) | 3.36 (0.04) | — | — | — | — | — | — | — |
Figure 4.
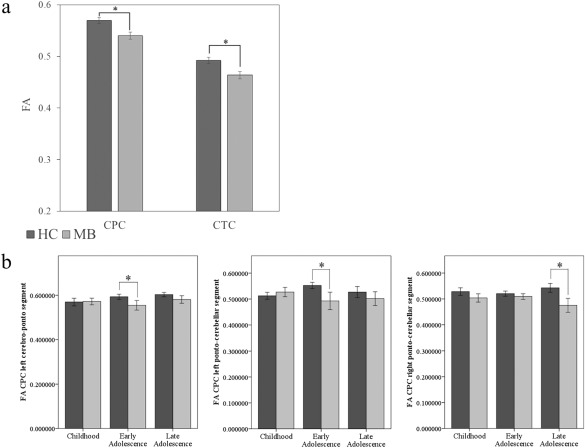
Cerebrocerebellar pathway microstructure as a function of group and age tertile. Panel a: main effect of group for FA of the CPC and CTC pathways (bars represent estimated marginal means; error bars represent the standard error of the mean). HC group = dark grey bars, MB group = light grey bars. Panel b: FA of the CPC pathway for each group (HC = dark grey bars, MB = light grey bars) across age tertiles, based on significant group × age tertile × side × segment interaction. From left to right: FA of the left cerebro‐ponto segment, FA of the left pontocerebellar segment, and FA of the right pontocerebellar segment. Error bars reflect standard error.
Our analyses also revealed significant main effects of groups for CTC pathway FA (P = 0.007; Fig. 4a), MD (P < 0.001), and AD (P = 0.003). For CTC FA, analyses revealed a significant main effect of side (P = 0.02); the left CTC pathway had lower FA than the right. A significant main effect of segment was evident for CTC FA and AD (P < 0.001, P = 0.003); lower FA and higher MD was found for the cerebello‐rubro segment relative to both the thalamo‐cerebral segment (P < 0.001), and the rubro‐thalamo segment (P = 0.001). We found a group × segment interaction for CTC FA (P < 0.05), MD (P = 0.005), AD (P = 0.008), and RD (P = 0.003); this interaction was driven by group differences in the cerebello‐rubro (P = 0.003) and rubro‐thalamo (P = 0.02) segments for FA, MD, and RD, and the cerebello‐rubro (P = 0.001) and thalamo‐cerebral (P = 0.007) segments for AD. Lastly, we found a significant group × age × side interaction for CTC FA (P = 0.004). Again, group effects were not seen in childhood, but were present in both early and late adolescence, for the left CTC pathway (P = 0.01) and the right CTC pathway (P = 0.005), respectively. Thus, for both the CPC and CTC pathways, it appears that group differences in pathway microstructure interact with both age group and the side/segment of the pathways.
DISCUSSION
We have detailed and outlined a reliable, standardized approach to obtain and visualize reciprocal cerebrocerebellar pathways. We have used this methodology to examine bilateral cerebellar‐frontal and frontal‐cerebellar white matter connections using DTI, and have compared the microstructure of these distinct pathways in healthy children and in children who have been treated for MB. Using the above method, we parsed the pathways into anatomically relevant, synaptically defined segments to examine localized microstructure within each bilateral pathway. Our findings revealed that children treated for MB showed damage to select segments of the cerebrocerebellar pathways compared to controls—specifically, within posterior segments of both the CPC and CTC pathways. Further, we showed that differences in pathway microstructure between healthy children and those treated for MB were driven by specific areas of the pathway (e.g., posterior segments of the CPC and CTC pathways) and by age cohort (e.g., adolescence).
Our methodology, utilizing previously identified anatomical landmarks of cerebrocerebellar pathways in animal models, enabled us to describe bilateral pathways connecting the cerebellum with frontal lobe. CPC pathways connecting frontal white matter with contralateral cerebellar white matter via pontine nuclei and middle cerebellar peduncle were obtained in all participants. CTC pathways were also defined in all participants connecting cerebellar white matter with contralateral frontal white matter via superior cerebellar peduncle, red nucleus, and thalamic nuclei. Connections we have obtained for both pathways replicate previous findings in animal models [Kelly and Strick, 2003; Middleton and Strick, 1994, 2001] and expand on findings describing solitary connections between cerebellum and cortex [Jissendi et al., 2008; Law et al., 2011; Salmi et al., 2010] and portions of cerebrocerebellar connections [Habas and Cabanis, 2007a, b; Ramnani et al., 2006] detailed in adult human models. We also successfully segmented the reciprocal bilateral pathways into anatomically relevant, synaptically defined components to examine localized microstructure in the developing brain.
Though regional white matter damage has been described previously in children treated for MB [Khong et al., 2006; Law et al., 2011; Mabbott et al., 2006b; Mulhern et al., 1999; Qiu et al., 2007], our study is the first to examine specific, anatomically based white matter pathways in this population using DTI and compare their microstructure with that of healthy age‐matched peers. Considering the dual insult to the cerebellum/PF from resection of tumor and the effect of CRT, cerebrocerebellar pathways may be particularly vulnerable to injury. Our findings revealed a significant group effect of both side and segment of the pathways. Children treated for MB showed the most substantial damage to posterior segments of both the CPC and CTC pathways compared to controls. This damage was indicated by DTI measures of lower FA and higher MD, and RD within the bilateral pontocerebellar segments of the CPC pathway and lower FA and higher MD and AD in bilateral cerebello‐rubro and rubro‐thalamo segments of the CTC pathway. As the main impact of treatment for MB is within the PF, we predicted that the most damage would be observed in posterior segments of the pathways contained within this “vulnerable” area.
Group differences were also found between MB and HC for anterior segments of the CPC (i.e., left cerebro‐ponto) and CTC pathway (i.e., bilateral thalamo‐cerebral). This may be a result of the direct effect of whole‐brain CRT, affecting not only the PF region, but supratentorial regions as well. This result may also reflect the indirect effect of injury occurring to one part of the system (e.g., cerebellum, pontine nuclei) that produces eventual injury or compromise to another, more distant region—a diaschisis effect. Thus, compromise to the entire CPC or CTC circuit (e.g., damage to all segments, as indicated by lower FA and higher MD, AD, and RD) may reflect a combined effect of diffuse CRT and progressive white matter injury to the PF that impacts other distant, but connected areas of the brain. Further, we observed a left‐hemispheric bias for damage to the CTC pathway. This may reflect previous developmental findings postulating a right to left hemispheric lateralization gradient of neuronal differentiation and maturation [Kucyi et al., 2012], findings of higher white matter volume in right versus left frontal lobe [Weinberger et al., 1982], and findings of a greater preponderance of cortical grey matter (and thus, less white matter) within left versus right hemispheres [de Lacoste et al., 1991; Filipek et al., 1994; Reiss et al., 1996].
From our qualitative analysis of the range of outcomes of tractography, the HC and MB groups appeared to be similar across almost all points along the CPC and CTC pathways. In examining CPC and CTC pathway distribution within the cerebellar ROIs, the range of outcomes for the MB group seemed to be distributed more midline cerebellar compared to the HC group, which appeared more lateral cerebellar. This apparent difference may reflect dysmorphology of the cerebellum from the impact of the tumor itself and subsequent treatment for MB.
While we found no effect of age on cerebrocerebellar pathways, there was a significant group × age × side × segment interaction for the CPC pathway and group × age × side interaction for the CTC pathway. These findings likely reflected differences in treatment and time since diagnosis between the age cohorts. Specifically, CRT protocol cohort effects (i.e., differences in radiation dose and field size) emerged in the MB group when we split our sample by age tertiles. Comparatively, our childhood cohort received less intensive radiation protocol (i.e., reduced CRT dose + tumor bed boost) relative to our adolescent cohorts (i.e., protocols included reduced CRT dose + PF boost, standard CRT dose + tumor bed boost, and standard CRT dose + PF boost). Recent literature has shown that it is the combination of radiation dose and field size that contributes to outcome in MB [Moxon‐Emre et al., 2014]. Moreover, participants treated for MB in the early and late adolescence groups were further out from treatment than those in the childhood group. It is possible that the further out from treatment, the more opportunity for developmental injury to manifest itself. Indeed, late effects emerge and continue to develop years after treatment for MB and greater time since diagnosis has been shown to predict functional and neurocognitive declines [Briere et al., 2008; Dennis et al., 1996; Mabbott et al., 2005; Spiegler et al., 2004]. Future investigations using longitudinal models of cerebrocerebellar development is necessary to confirm our findings.
Though we found novel evidence of the impact of treatment for MB (e.g., CRT protocol cohort effects, made apparent by an age tertile split) on cerebrocerebellar microstructure, several limitations must be considered. Due to the nature of DTI, this imaging method does not provide sufficient resolution to determine precise thalamic nuclei or cerebellar nuclei—therefore, we were able to note only the relative positions of the reciprocal pathways and could not comment on precise thalamic or cerebellar nuclei. Further, utilizing imaging data with “mixed” field strengths may be of concern, though it has been documented that the inclusion of 1.5T in studies utilizing 3T data does not necessarily reduce the validity of group analyses [Han and Talavage, 2011]. Additionally, DTI suffers a well‐known limitation in voxels containing crossing fibers, in that the tensor cannot represent intravoxel fiber orientations; future research should examine cerebrocerebellar pathways using a greater number of diffusion directions (e.g., high‐angular resolution diffusion imaging; HARDI) in attempt to resolve this issue. As radiation dose and field size may influence neurocognitive outcome in MB, it is pertinent to examine whether these parameters have an impact on cerebrocerebellar circuitry development. There were differences between the age tertiles for radiation dose and field (i.e., a larger proportion of patients in the childhood group were treated with reduced CRT + tumor bed boost versus “other” protocols). However, in the current study, our cell sizes were too small to consider the effect of both age tertile and CRT dose and field (i.e., tumor bed versus PF) on CTC and CPC pathway microstructure. Our age tertile effects should also be interpreted with caution, due to relatively small group sizes. Lastly, as DTI parameters are not independent, multivariate analyses should be used in future studies; we treated each parameter as independent to test what we believed was the most parsimonious model that incorporated both side and segment of pathways.
We have delineated and segmented, for the first time in children and in the pediatric injured brain, discrete and complete reciprocal cerebrocerebellar connections using DTI. Our findings provide a glimpse of what may occur structurally to the pediatric brain following resection of a PF tumor as well as the combined effect of whole‐brain radiation plus boost dose to the PF/tumor bed and CTX. DTI measures reflective of white matter injury were evident in children treated for MB versus controls, within many segments of the bilateral CPC and CTC pathways. Interestingly, not all white matter is damaged following CRT. Greater compromise was found for posterior segments of CPC and CTC pathways in patients compared to controls, and age differences in CRT protocol in our patient group contributed to these differences, reflecting the timing and impact of treatment for brain tumors on white matter. Using our methodology to define reciprocal cerebrocerebellar pathways, future studies can begin to examine the relations between the microstructure of such connections and cognitive and behavioral outcome in survivors of childhood brain tumors. Additionally, further research can expand on our model by elucidating the effects of treatment cohort (CRT dose and field) on cerebrocerebellar structure and function. Discovering a specific location of white matter loss or damage in MB may be of great importance for predicting the potential impact on mental processes and late effects following treatment. Given that CPC and CTC connections exist as the major cerebellar information input, output and modulation pathways and that both the cerebellum and frontal lobe are involved in mediating language, behavioral regulation, executive function, and working memory, damage to these feedforward and feedback mechanisms may produce widespread deficits.
Supporting information
Supplementary Information
ACKNOWLEDGMENTS
The authors thank all of the participants and their families that took part in this research at the Hospital for Sick Children. The authors would also like to thank Dr. Kamila Szulc for her help with plotting our tractography results.
Conflict of interest: The authors of this manuscript have no conflict of interest to declare.
Footnotes
Though we included scanner type (1.5T or 3T) as a covariate, we re‐ran the above analyses first on a subset of participants scanned at 1.5T and then on a subset of participants scanned at 3T, to account for the issue of potential scanner bias. The above results held when we examined group differences in pathways using only 1.5T (and 3T) data.
REFERENCES
- Allen G, Buxton RB, Wong EC, Courchesne E (1997): Attentional activation of the cerebellum independent of motor involvement. Science 275:1940–1943. [DOI] [PubMed] [Google Scholar]
- Allen G, McColl R, Barnard H, Ringe WK, Fleckenstein J, Cullum CM (2005): Magnetic resonance imaging of cerebellar‐prefrontal and cerebellar‐parietal functional connectivity. Neuroimage 28:39–48. [DOI] [PubMed] [Google Scholar]
- AnalyzeDirect , Analyze 11.0. Rochester, MN: Biomedical Imaging Resource, Mayo Foundation. [Google Scholar]
- Apps R, Watson TC. 2009. The cerebellum and its connections In: Snell RS, editor. Clinical Neuroanatomy. 7th ed Philadelphia, PA: Lippincott, Williams & Wilkins. [Google Scholar]
- Asanuma C, Thach WT, Jones EG (1983): Distribution of cerebellar terminations and their relation to other afferent terminations in the ventral lateral thalamic region of the monkey. Brain Res 286:237–265. [DOI] [PubMed] [Google Scholar]
- Bähr M, Frotscher M, Duus P (2005): Duus' topical diagnosis in neurology : Anatomy, physiology, signs, symptoms. Stuttgart, New York: Thieme; p xiv, 517. [Google Scholar]
- Basser PJ (1995): Inferring microstructural features and the physiological state of tissues from diffusion‐weighted images. NMR Biomed 8:333–344. [DOI] [PubMed] [Google Scholar]
- Beaulieu C (2002): The basis of anisotropic water diffusion in the nervous system—A technical review. NMR Biomed 15:435–455. [DOI] [PubMed] [Google Scholar]
- Behrens TE, Johansen‐Berg H, Woolrich MW, Smith SM, Wheeler‐Kingshott CA, Boulby PA, Barker GJ, Sillery EL, Sheehan K, Ciccarelli O, Thompson AJ, Brady JM, Matthews PM (2003a): Non‐invasive mapping of connections between human thalamus and cortex using diffusion imaging. Nat Neurosci 6:750–757. [DOI] [PubMed] [Google Scholar]
- Behrens TE, Woolrich MW, Jenkinson M, Johansen‐Berg H, Nunes RG, Clare S, Matthews PM, Brady JM, Smith SM (2003b): Characterization and propagation of uncertainty in diffusion‐weighted MR imaging. Magn Reson Med 50:1077–1088. [DOI] [PubMed] [Google Scholar]
- Briere ME, Scott JG, McNall‐Knapp RY, Adams RL (2008): Cognitive outcome in pediatric brain tumor survivors: Delayed attention deficit at long‐term follow‐up. Pediatr Blood Cancer 50:337–340. [DOI] [PubMed] [Google Scholar]
- Brodal P (1978): Principles of organization of the monkey corticopontine projection. Brain Res 148:214–248. [DOI] [PubMed] [Google Scholar]
- Brodal P, Bjaalie JG (1997): Salient anatomic features of the cortico‐ponto‐cerebellar pathway. Prog Brain Res 114:227–249. [DOI] [PubMed] [Google Scholar]
- Chen SH, Desmond JE (2005): Cerebrocerebellar networks during articulatory rehearsal and verbal working memory tasks. Neuroimage 24:332–338. [DOI] [PubMed] [Google Scholar]
- de Lacoste MC, Horvath DS, Woodward DJ (1991): Possible sex differences in the developing human fetal brain. J Clin Exp Neuropsychol 13:831–846. [DOI] [PubMed] [Google Scholar]
- Dennis M, Spiegler BJ, Hetherington CR, Greenberg ML (1996): Neuropsychological sequelae of the treatment of children with medulloblastoma. J Neurooncol 29:91–101. [DOI] [PubMed] [Google Scholar]
- Desmond JE, Gabrieli JD, Glover GH (1998): Dissociation of frontal and cerebellar activity in a cognitive task: Evidence for a distinction between selection and search. Neuroimage 7(Pt 1):368–376. [DOI] [PubMed] [Google Scholar]
- Dum RP, Strick PL (2003): An unfolded map of the cerebellar dentate nucleus and its projections to the cerebral cortex. J Neurophysiol 89:634–639. [DOI] [PubMed] [Google Scholar]
- Fiez JA, Raife EA, Balota DA, Schwarz JP, Raichle ME, Petersen SE (1996): A positron emission tomography study of the short‐term maintenance of verbal information. J Neurosci 16:808–822. [DOI] [PMC free article] [PubMed] [Google Scholar]
- Filipek PA, Richelme C, Kennedy DN, Caviness VS, Jr . (1994): The young adult human brain: An MRI‐based morphometric analysis. Cereb Cortex 4:344–360. [DOI] [PubMed] [Google Scholar]
- Glickstein M (1992): The cerebellum and motor learning. Curr Opin Neurobiol 2:802–806. [DOI] [PubMed] [Google Scholar]
- Glickstein M (1993): Motor skills but not cognitive tasks. Trends Neurosci 16:450–451; discussion 453‐4. [DOI] [PubMed] [Google Scholar]
- Habas C, Cabanis EA (2006): Cortical projections to the human red nucleus: A diffusion tensor tractography study with a 1.5‐T MRI machine. Neuroradiology 48:755–762. [DOI] [PubMed] [Google Scholar]
- Habas C, Cabanis EA (2007a): Anatomical parcellation of the brainstem and cerebellar white matter: A preliminary probabilistic tractography study at 3 T. Neuroradiology 49:849–863. [DOI] [PubMed] [Google Scholar]
- Habas C, Cabanis EA (2007b): Cortical projection to the human red nucleus: Complementary results with probabilistic tractography at 3 T. Neuroradiology 49:777–784. [DOI] [PubMed] [Google Scholar]
- Han K, Talavage TM (2011): Effects of combining field strengths on auditory functional MRI group analysis: 1.5T and 3T. J Magn Reson Imaging 34:1480–1488. [DOI] [PMC free article] [PubMed] [Google Scholar]
- Ivry RB, Baldo JV (1992): Is the cerebellum involved in learning and cognition? Curr Opin Neurobiol 2:212–216. [DOI] [PubMed] [Google Scholar]
- Jissendi P, Baudry S, Baleriaux D (2008): Diffusion tensor imaging (DTI) and tractography of the cerebellar projections to prefrontal and posterior parietal cortices: A study at 3T. J Neuroradiol 35:42–50. [DOI] [PubMed] [Google Scholar]
- Jones DK, Leemans A (2011): Diffusion tensor imaging. Methods Mol Biol 711:127–144. [DOI] [PubMed] [Google Scholar]
- Kabani NJ, Sled JG, Chertkow H (2002): Magnetization transfer ratio in mild cognitive impairment and dementia of Alzheimer's type. Neuroimage 15:604–610. [DOI] [PubMed] [Google Scholar]
- Kelly RM, Strick PL (2003): Cerebellar loops with motor cortex and prefrontal cortex of a nonhuman primate. J Neurosci 23:8432–8444. [DOI] [PMC free article] [PubMed] [Google Scholar]
- Khong PL, Kwong DL, Chan GC, Sham JS, Chan FL, Ooi GC (2003): Diffusion‐tensor imaging for the detection and quantification of treatment‐induced white matter injury in children with medulloblastoma: A pilot study. AJNR Am J Neuroradiol 24:734–740. [PMC free article] [PubMed] [Google Scholar]
- Khong PL, Leung LH, Fung AS, Fong DY, Qiu D, Kwong DL, Ooi GC, McAlonan G, Cao G, Chan GC (2006): White matter anisotropy in post‐treatment childhood cancer survivors: Preliminary evidence of association with neurocognitive function. J Clin Oncol 24:884–890. [DOI] [PubMed] [Google Scholar]
- Kim SG, Ugurbil K, Strick PL (1994): Activation of a cerebellar output nucleus during cognitive processing. Science 265:949–951. [DOI] [PubMed] [Google Scholar]
- Klingberg T, Vaidya CJ, Gabrieli JD, Moseley ME, Hedehus M (1999): Myelination and organization of the frontal white matter in children: A diffusion tensor MRI study. Neuroreport 10:2817–2821. [DOI] [PubMed] [Google Scholar]
- Kucyi A, Moayedi M, Weissman‐Fogel I, Hodaie M, Davis KD (2012): Hemispheric asymmetry in white matter connectivity of the temporoparietal junction with the insula and prefrontal cortex. PLoS One 7:e35589. [DOI] [PMC free article] [PubMed] [Google Scholar]
- Law N, Bouffet E, Laughlin S, Laperriere N, Briere ME, Strother D, McConnell D, Hukin J, Fryer C, Rockel C, Dickson J, Mabbott D (2011): Cerebello‐thalamo‐cerebral connections in pediatric brain tumor patients: Impact on working memory. Neuroimage 56:2238–2248. [DOI] [PubMed] [Google Scholar]
- Law N, Greenberg M, Bouffet E, Taylor MD, Laughlin S, Strother D, Fryer C, McConnell D, Hukin J, Kaise C, Wang F, Mabbott DJ (2012): Clinical and neuroanatomical predictors of cerebellar mutism syndrome. Neuro Oncol 14:1294–1303. [DOI] [PMC free article] [PubMed] [Google Scholar]
- Mabbott DJ, Spiegler BJ, Greenberg ML, Rutka JT, Hyder DJ, Bouffet E (2005): Serial evaluation of academic and behavioral outcome after treatment with cranial radiation in childhood. J Clin Oncol 23:2256–2263. [DOI] [PubMed] [Google Scholar]
- Mabbott DJ, Noseworthy M, Bouffet E, Laughlin S, Rockel C (2006a): White matter growth as a mechanism of cognitive development in children. Neuroimage 33:936–946. [DOI] [PubMed] [Google Scholar]
- Mabbott DJ, Noseworthy MD, Bouffet E, Rockel C, Laughlin S (2006b): Diffusion tensor imaging of white matter after cranial radiation in children for medulloblastoma: Correlation with IQ. Neuro Oncol 8:244–252. [DOI] [PMC free article] [PubMed] [Google Scholar]
- Mabbott DJ, Rovet J, Noseworthy MD, Smith ML, Rockel C (2009): The relations between white matter and declarative memory in older children and adolescents. Brain Res 1294:80–90. [DOI] [PubMed] [Google Scholar]
- Middleton FA, Strick PL (1994): Anatomical evidence for cerebellar and basal ganglia involvement in higher cognitive function. Science 266:458–461. [DOI] [PubMed] [Google Scholar]
- Middleton FA, Strick PL (1997): Cerebellar output channels. Int Rev Neurobiol 41:61–82. [DOI] [PubMed] [Google Scholar]
- Middleton FA, Strick PL (2000): Basal ganglia and cerebellar loops: Motor and cognitive circuits. Brain Res Brain Res Rev 31:236–250. [DOI] [PubMed] [Google Scholar]
- Middleton FA, Strick PL (2001): Cerebellar projections to the prefrontal cortex of the primate. J Neurosci 21:700–712. [DOI] [PMC free article] [PubMed] [Google Scholar]
- Mori S, Zhang J (2006): Principles of diffusion tensor imaging and its applications to basic neuroscience research. Neuron 51:527–539. [DOI] [PubMed] [Google Scholar]
- Moxon‐Emre I, Bouffet E, Taylor MD, Laperriere N, Scantlebury N, Law N, Spiegler BJ, Malkin D, Janzen L, Mabbott D (2014): Impact of craniospinal dose, boost volume, and neurologic complications on intellectual outcome in patients with medulloblastoma. J Clin Oncol 32:1760–1768. [DOI] [PubMed] [Google Scholar]
- Mulhern RK, Reddick WE, Palmer SL, Glass JO, Elkin TD, Kun LE, Taylor J, Langston J, Gajjar A (1999): Neurocognitive deficits in medulloblastoma survivors and white matter loss. Ann Neurol 46:834–841. [DOI] [PubMed] [Google Scholar]
- Mulhern RK, Palmer SL, Reddick WE, Glass JO, Kun LE, Taylor J, Langston J, Gajjar A (2001): Risks of young age for selected neurocognitive deficits in medulloblastoma are associated with white matter loss. J Clin Oncol 19:472–479. [DOI] [PubMed] [Google Scholar]
- Olsrud J, Latt J, Brockstedt S, Romner B, Bjorkman‐Burtscher IM (2005): Magnetic resonance imaging artifacts caused by aneurysm clips and shunt valves: Dependence on field strength (1.5 and 3 T) and imaging parameters. J Magn Reson Imaging 22:433–437. [DOI] [PubMed] [Google Scholar]
- Qiu D, Kwong DL, Chan GC, Leung LH, Khong PL (2007): Diffusion tensor magnetic resonance imaging finding of discrepant fractional anisotropy between the frontal and parietal lobes after whole‐brain irradiation in childhood medulloblastoma survivors: Reflection of regional white matter radiosensitivity? Int J Radiat Oncol Biol Phys 69:846–851. [DOI] [PubMed] [Google Scholar]
- Ramnani N, Behrens TE, Johansen‐Berg H, Richter MC, Pinsk MA, Andersson JL, Rudebeck P, Ciccarelli O, Richter W, Thompson AJ, Gross CG, Robson MD, Kastner S, Matthews PM (2006): The evolution of prefrontal inputs to the cortico‐pontine system: Diffusion imaging evidence from Macaque monkeys and humans. Cereb Cortex 16:811–818. [DOI] [PubMed] [Google Scholar]
- Reddick WE, White HA, Glass JO, Wheeler GC, Thompson SJ, Gajjar A, Leigh L, Mulhern RK (2003): Developmental model relating white matter volume to neurocognitive deficits in pediatric brain tumor survivors. Cancer 97:2512–2519. [DOI] [PubMed] [Google Scholar]
- Reddick WE, Glass JO, Palmer SL, Wu S, Gajjar A, Langston JW, Kun LE, Xiong X, Mulhern RK (2005): Atypical white matter volume development in children following craniospinal irradiation. Neuro Oncol 7:12–19. [DOI] [PMC free article] [PubMed] [Google Scholar]
- Reiss AL, Abrams MT, Singer HS, Ross JL, Denckla MB (1996): Brain development, gender and IQ in children. A volumetric imaging study. Brain 119(Pt 5):1763–1774. [DOI] [PubMed] [Google Scholar]
- Salmi J, Pallesen KJ, Neuvonen T, Brattico E, Korvenoja A, Salonen O, Carlson S (2010): Cognitive and motor loops of the human cerebro‐cerebellar system. J Cogn Neurosci 22:2663–2676. [DOI] [PubMed] [Google Scholar]
- Schmahmann JD (1991): An emerging concept. The cerebellar contribution to cognitive function. Arch Neurol 48:1178–1187. [DOI] [PubMed] [Google Scholar]
- Schmahmann JD (1996): From movement to thought: Anatomic substrates of the cerebellar contribution to cognitive processing. Hum Brain Mapp 4:174–198. [DOI] [PubMed] [Google Scholar]
- Schmahmann JD (2004): Disorders of the cerebellum: ataxia, dysmetria of thought, and the cerebellar cognitive affective syndrome. J Neuropsychiatry Clin Neurosci 16:367–378. [DOI] [PubMed] [Google Scholar]
- Schmahmann JD, Pandya DN (1997a): Anatomic organization of the basilar pontine projections from prefrontal cortices in rhesus monkey. J Neurosci 17:438–458. [DOI] [PMC free article] [PubMed] [Google Scholar]
- Schmahmann JD, Pandya DN (1997b): The cerebrocerebellar system. Int Rev Neurobiol 41:31–60. [DOI] [PubMed] [Google Scholar]
- Smith SM, Jenkinson M, Woolrich MW, Beckmann CF, Behrens TE, Johansen‐Berg H, Bannister PR, De Luca M, Drobnjak I, Flitney DE, Niazy RK, Saunders J, Vickers J, Zhang Y, De Stefano N, Brady JM, Matthews PM (2004): Advances in functional and structural MR image analysis and implementation as FSL. Neuroimage 23(Suppl 1):S208–S219. [DOI] [PubMed] [Google Scholar]
- Song SK, Sun SW, Ramsbottom MJ, Chang C, Russell J, Cross AH (2002): Dysmyelination revealed through MRI as increased radial (but unchanged axial) diffusion of water. Neuroimage 17:1429–1436. [DOI] [PubMed] [Google Scholar]
- Spiegler BJ, Bouffet E, Greenberg ML, Rutka JT, Mabbott DJ (2004): Change in neurocognitive functioning after treatment with cranial radiation in childhood. J Clin Oncol 22:706–713. [DOI] [PubMed] [Google Scholar]
- Stein JF, Glickstein M (1992): Role of the cerebellum in visual guidance of movement. Physiol Rev 72:967–1017. [DOI] [PubMed] [Google Scholar]
- Tamnes CK, Ostby Y, Fjell AM, Westlye LT, Due‐Tonnessen P, Walhovd KB (2010): Brain maturation in adolescence and young adulthood: regional age‐related changes in cortical thickness and white matter volume and microstructure. Cereb Cortex 20:534–548. [DOI] [PubMed] [Google Scholar]
- Thach WT (1972): Cerebellar output: Properties, synthesis and uses. Brain Res 40:89–102. [DOI] [PubMed] [Google Scholar]
- Thach WT, Jones EG (1979): The cerebellar dentatothalamic connection: Terminal field, lamellae, rods and somatotopy. Brain Res 169:168–172. [DOI] [PubMed] [Google Scholar]
- Weinberger DR, Luchins DJ, Morihisa J, Wyatt RJ (1982): Asymmetrical volumes of the right and left frontal and occipital regions of the human brain. Ann Neurol 11:97–100. [DOI] [PubMed] [Google Scholar]
- Woods RP, Grafton ST, Holmes CJ, Cherry SR, Mazziotta JC (1998): Automated image registration: I. General methods and intrasubject, intramodality validation. J Comput Assist Tomogr 22:139–152. [DOI] [PubMed] [Google Scholar]
- Woolrich MW, Jbabdi S, Patenaude B, Chappell M, Makni S, Behrens T, Beckmann C, Jenkinson M, Smith SM (2009): Bayesian analysis of neuroimaging data in FSL. Neuroimage 45(Suppl 1):S173–S186. [DOI] [PubMed] [Google Scholar]
Associated Data
This section collects any data citations, data availability statements, or supplementary materials included in this article.
Supplementary Materials
Supplementary Information