

Abstract
In this multicenter study, we applied functional magnetic resonance imaging (fMRI) to define the functional correlates of cognitive dysfunction in patients with multiple sclerosis (MS). fMRI scans during the performance of the N‐back task were acquired from 42 right‐handed relapsing remitting (RR) MS patients and 52 sex‐matched right‐handed healthy controls, studied at six European sites using 3.0 Tesla scanners. Patients with at least two abnormal (<2 standard deviations from the normative values) neuropsychological tests at a standardized evaluation were considered cognitively impaired (CI). FMRI data were analyzed using the SPM8 software, modeling regions showing load‐dependent activations/deactivations with increasing task difficulty. Twenty (47%) MS patients were CI. During the N‐back load condition, compared to controls and CI patients, cognitively preserved (CP) patients had increased recruitment of the right dorsolateral prefrontal cortex. As a function of increasing task difficulty, CI MS patients had reduced activations of several areas located in the fronto‐parieto‐temporal lobes as well as reduced deactivations of regions which are part of the default mode network compared to the other two groups. Significant correlations were found between abnormal fMRI patterns of activations and deactivations and behavioral measures, cognitive performance, and brain T2 and T1 lesion volumes. This multicenter study supports the theory that a preserved fMRI activity of the frontal lobe is associated with a better cognitive profile in MS patients. It also indicates the feasibility of fMRI to monitor disease evolution and treatment effects in future studies. Hum Brain Mapp 35:5799–5814, 2014. © 2014 Wiley Periodicals, Inc.
Keywords: multiple sclerosis, fMRI, cognition, cognitive impairment, prefrontal cortex, default mode network, functional reserve
INTRODUCTION
A large proportion of patients with multiple sclerosis (MS) have cognitive deficits, with a prominent involvement of attention, information processing speed, executive functions, memory, and visuo‐spatial abilities [Chiaravalloti and DeLuca, 2008]. Considering the dramatic impact cognitive impairment has on patients' activities, the definition of the underlying substrates is of paramount importance, since this is likely to contribute to the development of valid therapeutic strategies or to monitor the functional state of patients.
The application of modern magnetic resonance imaging (MRI) techniques has markedly improved our understanding of the mechanisms associated with MS‐related cognitive impairment. Damage to the brain normal‐appearing white matter (NAWM) and gray matter (GM), in terms of lesions [Calabrese et al., 2009; Roosendaal et al., 2009], diffuse microstructural abnormalities [Dineen et al., 2009; Mesaros et al., 2012], and tissue loss [Amato et al., 2004; Calabrese et al., 2009] has been variously related to the severity of cognitive impairment in patients with different MS clinical phenotypes. Functional MRI (fMRI) studies have suggested that redistribution of function within cognitive‐related networks might counteract such structural damage, at least at some stages of the disease process [Cader et al., 2006; Cader et al., 2009; Rocca et al., 2010a; Staffen et al., 2002; Sumowski et al., 2010].
Experimental evidence suggests that fMRI might represent a valid tool to monitor the effect of specific therapeutic interventions on cognition. A few single‐center studies have applied fMRI to assess the functional correlates of acute and chronic administration of acetylcholinesterase inhibitors in MS patients [Cader et al., 2009; Parry et al., 2003]. More recently, the beneficial effects of cognitive rehabilitation on attention, executive functions and memory performances have been associated with the optimization of compensatory strategies in cognitive‐related networks during training [Filippi et al., 2012; Leavitt et al., 2012; Sastre‐Garriga et al., 2011].
Several steps are required to confirm the utility of fMRI in the context of MS trials assessing treatment efficacy for cognitive disturbances. The first is the validation of the approach obtained in a multicenter setting. Should this be achieved, the next step would be its application in a longitudinal frame, to define how these measures relate to disease clinical manifestations and how they are modulated by treatment. Against this background, we applied fMRI to define the functional correlates of cognitive dysfunction in patients with MS in a multicenter setting.
METHODS
Subjects
Subjects were recruited at six European centers (http://www.magnims.eu), which included: (a) the Department of Radiology, VU University Medical Centre, Amsterdam (Netherlands); (b) the CEM‐Cat, Hospital Vall d'Hebron, Barcelona (Spain); (c) the Research Unit for Neuronal Repair and Plasticity, Medical University Graz, Graz (Austria); (d) the Queen Square Imaging Centre, Institute of Neurology, University College London, London (UK); (e) the Neuroimaging Research Unit, San Raffaele Scientific Institute, Milan (Italy); and (f) the MRI Center “SUN‐FISM”, Second University of Naples, Naples (Italy).
The inclusion criteria for this study required all subjects to be right‐handed [Oldfield, 1971] and aged between 20 and 55 years. In addition, patients had to have a diagnosis of relapsing remitting (RR) MS [Lublin and Reingold, 1996; Polman et al., 2011]; a disease duration ≤15 years (to exclude patients with benign MS); an Expanded Disability Status Scale (EDSS) [Kurtzke, 1983] ≤4.0; no relapse or corticosteroids treatment within the month prior to scanning; and no clinically apparent motor impairment of the right upper limb.
Ten patients and three healthy controls (HC) had to be excluded from the final analysis: four patients and one HC were excluded because they were left handed; six patients and two HCs because they did not complete the scanning protocol appropriately.
The final dataset used for this analysis included 42 RRMS patients (19/23 men/women; mean age = 39.6 years, standard deviation [SD] = 8.5 years, range = 24–55 years; mean disease duration = 7.7 years, range = 2–15 years; median EDSS score = 2.0, range = 1.0–4.0) and 52 HC (24/28 men/women, mean age = 34.9 years, SD = 8.6 years, range = 22–52 years). Table 1 shows the main demographic and clinical characteristics of the study subjects per site. Gender did not differ significantly between HC and MS patients (P = 0.9), whereas HC were significantly younger than MS patients (P = 0.01). As a consequence, age was included as nuisance covariate in all statistical models used. Local ethics approval was obtained at all sites and all subjects gave informed consent.
Table 1.
Main demographic, clinical and conventional MRI characteristics of patients with multiple sclerosis and healthy controls enrolled in this study at six European centers
| Amsterdam | Barcelona | Graz | London | Milan | Naples | P a | |||||||
|---|---|---|---|---|---|---|---|---|---|---|---|---|---|
| Group | HC | MS | HC | MS | HC | MS | HC | MS | HC | MS | HC | MS | |
| M/W | 3/6 | 4/2 | 2/4 | 1/5 | 9/3 | 5/1 | 4/5 | 3/4 | 4/6 | 3/7 | 2/4 | 3/4 | n.s. |
| Mean age (SD) (years) | 45.2 (6.7) | 50.0 (5.1) | 28.0 (7.3) | 33.8 (7.3) | 34.6 (6.3) | 36.6 (6.8) | 32.2 (5.0) | 39.4 (9.7) | 33.8 (8.2) | 37.4 (8.3) | 32.8 (10.4) | 38.4 (6.2) | 0.002 |
| Education (SD) (years) | 15.3 (3.1) | 17.2 (0.4) | 18.2 (2.3) | 13.7 (2.9) | 17.8 (2.9) | 12.1 (0.8) | 18.2 (1.4) | 17.0 (0.8) | 16.0 (2.8) | 11.1 (3.2) | 14.5 (3.0) | 14.0 (4.2) | n.s. |
| Median EDSS (range) | — | 3.5 (2.5–4.0) | — | 1.5 (1.5—4.0) | — | 2.5 (1.5—3.5) | — | 2.0 (1.0—4.0) | — | 1.5 (1.0—4.0) | — | 1.5 (1.0—2.0) | 0.01 |
| Mean disease duration (SD) (years) | — | 8.3 (4.7) | — | 5.1 (2.0) | — | 11.0 (7.4) | — | 4.4 (2.4) | — | 7.3 (9.1) | — | 10.6 (3.1) | 0.03 |
| CP/CI patients | — | 2/4 | — | 5/1 | — | 4/2 | — | 3/4 | — | 4/6 | — | 4/3 | n.s. |
| Mean T2 LV (SD) (ml) | — | 12.9 (13.0) | — | 4.4 (4.3) | — | 30.7 (23.4) | — | 16.8 (22.9) | — | 8.9 (8.6) | — | 6.9 (6.8) | n.s. |
| Mean T1 LV (SD) (ml) | — | 7.3 (8.3) | — | 3.5 (3.6) | — | 11.9 (9.3) | — | 6.5 (7.0) | — | 4.6 (4.5) | — | 6.2 (5.9) | n.s. |
| Mean NBV (SD) (ml) | 1,529 (49) | 1,384 (119) | 1,590 (53) | 1,480 (40) | 1,552 (75) | 1,428 (148) | 1,601 (76) | 1,521 (118) | 1,493 (67) | 1,444 (85) | 1,548 (65) | 1,399 (107) | 0.02 |
SD, standard deviation; M, men; W, women; HC, healthy controls; MS, multiple sclerosis; EDSS, Expanded Disability Status scale; CP, cognitively preserved; CI, cognitively impaired; LV, lesion volume; NBV, normalized brain volume.
Kruskal‐Wallis test for site heterogeneity.
Functional and Neuropsychological Assessment
Within 48 h from the MRI acquisition, MS patients underwent a neuropsychological evaluation, performed at each participating site by an experienced neuropsychologist, unaware of the MRI results, using validated translations of the neuropsychological tests. Cognitive performance was assessed using the Brief Repeatable Battery of Neuropsychological Tests (BRB‐N) [Rao, 1990], which includes the Selective Reminding Test (SRT) to assess verbal memory; the 10/36 Spatial Recall Test (10/36 SRT) to assess visual memory; the Symbol Digit Modalities Test (SDMT) and the Paced Auditory Serial Addition Test (PASAT) 2′′ and 3′′ [Gronwall, 1977] to assess attention and information processing speed; and the Word List Generation (WLG) test to assess verbal fluency. As previously described [Sepulcre et al., 2006], Z‐scores for each of the previous domains and a global Z‐score of cognitive function (obtained by averaging Z‐scores of all tests) were calculated.
In addition, the Wisconsin Card Sorting Test (WCST) was administered to evaluate executive functions [Heaton et al., 1993]. Performance at the WCST was evaluated by computing scores related to the total errors (WCSTte), the number of perseverative errors (WCSTpe), and the number of perseverative responses (WCSTpr) [Heaton et al., 1993]. Patients with a score ≤2 SD in at least one of these measures were considered impaired at the WCST [Filippi et al., 2012; Mattioli et al., 2010; Parisi et al., 2012].
Patients with at least two abnormal tests (defined as a score more than 2 SDs below the normative value provided by Boringa et al. [2001] for the BRB‐N and by Heaton et al. [1993] for the WCST) were considered cognitively impaired (CI) [Lazeron et al., 2005; Portaccio et al., 2009]. It has been previously shown that the BRB‐N is only marginally influenced by language or cultural differences, and that normative values obtained from healthy controls from different countries are not significantly different [Sepulcre et al., 2006].
MRI Acquisition
Brain MRI scans were obtained using magnets operating at 3.0 Tesla at all sites (Amsterdam and Naples: GE Signa; Barcelona, Graz and London: Siemens Trio; Milan: Philips Intera). Functional MR images were obtained at all sites using a T2*‐weighted single‐shot echo‐planar imaging (EPI) sequence with the following parameters: repetition time (TR) = 2,800 ms, echo time (TE) = 30 ms, flip angle = 85°, matrix size = 128 × 128, field of view (FOV) = 240 mm2. During each fMRI run, 264 sets of 30 axial slices, parallel to the AC‐PC plane, with a thickness of 4 mm, covering the whole brain were acquired. During the same scanning session, the following brain sequences were obtained: (1) dual‐echo turbo‐spin‐echo (TSE): TR = ranging from 4,000 to 5,380 ms, TE1 = ranging from 10 to 23 ms, TE2 = ranging from 90 to 102 ms, echo train length (ETL) = ranging from 5 to 11, 44 contiguous, 3‐mm‐thick axial slices, parallel to the AC‐PC plane, with a matrix size = 256 × 192 and a FOV = 240 × 180 mm2 (recFOV = 75%); (2) 3D T1‐weighted scan: TR = ranging from 5.5 to 8.3 ms (for GE/Philips scanners) and from 1,900 to 2,300 ms (for Siemens scanners); TE = ranging from 1.7 to 3.0 ms; flip angle ranging from 8° to 12°, 176 to 192 sagittal slices with thickness = 1 mm and in‐plane resolution = 1 × 1 mm2.
Experimental Design
The N‐back working memory task was implemented as a parametric design with different N‐back levels randomly occurring in blocks. Subjects were presented with letters and had to respond by indicating whether the letter matched the target (an x for n = 0, the immediately previous letter for n = 1, similarly for two or three letters back, n = 2 and n = 3, respectively) or not. The letters were selected from the English alphabet except j, k, w, y due to ambiguity in lower case form. The letter x was excluded in 1‐, 2‐, 3‐ back conditions since it was always used as target in the 0‐back task. The difficulty of the task (cognitive load) increased with “n.” Each block consisted of 20 trials (1‐s stimulus, 1.8‐s blank) with a total duration of 56 s, and was preceded by an initial 6‐s prompt. The four blocks of the 0‐, 1‐, 2‐, and 3‐back conditions, presented in random order, were repeated three times, for a total stimulus duration of 12 min and 20 s. The stimulation paradigm was generated at the Neuroimaging Research Unit (Milan, Italy) using Presentation® software (Neurobehavioral System) and then delivered to the other participating sites. Stimuli were back‐projected onto a screen in the scanner room which the subjects saw through a mirror standard system located on the scanner's head coil. A response box allowed to record letter choice (accuracy) and reaction time (RT).
MRI Analysis
The analysis of structural and fMRI data was done centrally at the Neuroimaging Research Unit (Milan, Italy) by experienced observers.
T2 hyperintense and T1 hypointense lesion volumes (LV) were measured on dual‐echo TSE and 3D T1‐weighted scans, respectively, using a local thresholding segmentation technique (Jim 5.0, Xinapse System, Leicester, UK). Normalized brain volumes (NBV) were measured on 3D T1‐weighted scans using the SIENAx software [Smith et al., 2002].
FMRI data were analyzed using the statistical parametric mapping (SPM8) software. Prior to statistical analysis, all images were realigned to the mean image to correct for subject motion, spatially normalized into the Montreal Neurological Institute (MNI) space, and smoothed with a 10‐mm, three‐dimesional (3D) Gaussian filter. Subjects were included in the subsequent statistical analysis if they had a maximum cumulative translation lower than 3.0 mm in the x,y,z planes (lower than 1.0 mm for each plane) or a maximum cumulative rotation of 0.5° (none of the subjects were excluded due to movement). Mean cumulative translations and rotations did not differ significantly between healthy controls and MS patients (P = 0.12 and 0.27 respectively, ANOVA models adjusted for site effect). Changes in blood oxygenation level dependent (BOLD) contrast associated with the performance of the N‐back task were assessed on a voxel by voxel basis, using the general linear model and the theory of Gaussian fields [Friston et al., 1995]. A first‐level design matrix, including motion parameters as regressors, was built and specific effects were tested by applying appropriate linear contrasts. For each subject, the three task conditions (1‐, 2‐, and 3‐back) were contrasted with the 0‐back condition. Finally, areas showing increasing activation (or deactivation) with increasing task difficulty were identified by creating a linear contrast (N‐back load) from 0‐ to 3‐back.
Statistical Analysis
Patients' clinical and MRI characteristics were reported as medians and ranges or as frequencies and percentages for continuous and categorical variables, respectively. Between‐group and between‐center comparisons were performed using the Pearson χ 2 test and Mann‐Whitney U‐test or Kruskal‐Wallis test for categorical and continuous variables, respectively. Because of potential presence of between‐center heterogeneity, univariate, and age‐adjusted between‐group comparisons were also performed using generalized linear mixed effect models with random intercepts and unstructured covariance matrix. Given the length of the fMRI task, we explored the possible influence of fatigue during the N‐back task by performing an analysis of variance on the percentage of incorrect responses. The following effects were included in the model: time, task (i.e., 0‐, 1‐, 2‐, or 3‐back) and interaction term time x task. A P‐value <0.05 was considered as statistically significant (SAS Release 9.1.3 software).
fMRI analysis was performed using SPM8 and second‐level statistics. One‐sample t tests (P < 0.05, family‐wise error [FWE] corrected for multiple comparisons) were used to assess the average activity during the 1‐ vs. 0‐, 2‐ vs. 0‐, 3‐ vs. 0‐back, and N‐back load conditions in HC and MS patients (as a whole, and according to the presence/absence of CI). Between‐group comparisons of fMRI activity during the load contrast were performed using full factorial models adjusted for site and age effects. The analysis was repeated including NBV as an additional covariate. Results were tested both at P < 0.001, uncorrected, and at P < 0.05, FWE corrected. Between‐center heterogeneity of fMRI activity as well as between‐center heterogeneity of differences between patients and controls in such an activity was assessed by creating two F contrasts in the SPM8 design matrix, one testing site effect and one testing group x site interaction. Multiple linear regression models, adjusted for age and site, were used to assess the correlation between fMRI activity during the N‐back load condition and behavioral (accuracy, RT), clinical (EDSS, disease duration), neuropsychological (global Z score of cognitive performance and Z scores of single cognitive domains and WCST), and conventional MRI (T2 LV and T1 LV) variables (P < 0.001, uncorrected).
RESULTS
Clinical, Neuropsychological, and Conventional MRI Measures
The mean T2 and T1 LVs of MS patients were 12.9 ml (SD = 15.9 ml) and 6.5 ml (SD = 6.6 ml), respectively. Compared to HC, MS patients had significantly lower NBV (mean NBV = 1,549 [SD = 73] ml in HC vs. 1,444 [SD = 110] ml in MS patients; P < 0.001). A significant site effect was found for age, EDSS, disease duration, and NBV, whereas no effect was found for education, gender, T2 LV, and T1 LV (Table 1).
Twenty (48%) MS patients were classified as CI. All patients impaired at WCST (n = 10) were also classified as CI on the BRB‐N. The domains most frequently involved were: attention and information processing speed (38% of the patients), executive functions (29%), verbal memory (27%), spatial memory (21%), and fluency (21%) (Table 2). The distribution of CI and cognitively preserved (CP) patients did not differ significantly among sites (Table 1). Compared to CP patients, CI MS patients were significantly older (mean age = 36.9 years, SD = 8.0 years for CP and 42.6 years, SD = 8.1 years for CI patients; P = 0.04), had higher T2 LV (mean T2 LV = 8.6 ml, SD = 11.9 ml for CP and 18.2 ml, SD = 18.5 ml for CI patients; P = 0.02), and T1 LV (mean T1 LV = 4.2 ml, SD = 3.9 ml for CP and 9.3 ml, SD = 7.9 ml for CI patients; P = 0.005), as well as lower NBV (mean NBV = 1,485 ml, SD = 81 ml for CP and 1,398 ml, SD = 120 ml for CI patients; P = 0.01). No differences were found for gender (P = 0.10), education (P = 0.63), EDSS (P = 0.58), and disease duration (P = 0.15).
Table 2.
Number and frequency of patients with multiple sclerosis (MS) having abnormal performances at neuropsychological tests and distribution across centers
| Cognitive domains | All centres (N = 42) | Amsterdam (N = 6) | Barcelona (N = 6) | Graz (N = 6) | London (N = 7) | Milan (N = 10) | Naples (N = 7) |
|---|---|---|---|---|---|---|---|
| Attention/information processing speed (%) | 16 (38%) | 2 (33%) | 2 (33%) | 2 (33%) | 2 (29%) | 6 (60%) | 2 (29%) |
| Executive functions (%) | 12 (29%) | 2 (33%) | 0 (0%) | 1 (17%) | 5 (71%) | 4 (40%) | 0 (0%) |
| Verbal memory (%) | 11 (26%) | 3 (50%) | 0 (0%) | 1 (17%) | 2 (29%) | 2 (20%) | 3 (43%) |
| Spatial memory (%) | 7 (17%) | 0 (0%) | 0 (0%) | 1 (17%) | 2 (29%) | 3 (30%) | 1 (17%) |
| Verbal fluency (%) | 9 (21%) | 1 (17%) | 2 (33%) | 3 (50%) | 0 (0%) | 1 (10%) | 2 (29%) |
Abnormalities of attention/information processing speed, verbal memory, spatial memory and verbal fluency domains were derived from the scores obtained at the Brief Repeatable Battery‐Neuropsychological (BRB‐N) battery, abnormalities of the executive functions were derived from the scores obtained at the Wisconsin Card Sorting Test (WCST). See text for further details.
During N‐back task performance, MS patients had a higher percentage of incorrect responses vs. HC (12.7% vs. 6.7%, P < 0.001), whereas RT did not differ between the two groups (RT on correct/incorrect responses = 0.62/0.89 sec in HC vs. 0.64/0.89 in MS patients, P = 0.20 and 0.75, respectively). Compared to CP, CI MS patients had a higher percentage of incorrect responses (15.5% vs. 11.2%, P = 0.02) and a trend toward longer RTs on correct responses (P = 0.06, RTs for CP/CI MS patients = 0.63/0.71 sec). Conversely, RTs on incorrect responses were comparable between the two groups of patients (P = 0.88, RTs for CP/CI MS patients = 0.89/0.93 sec). The analysis of variance model testing the effect of fatigue found a significant effect of task (P < 0.001) on the percentage of incorrect responses, indicating that there was an increased number of incorrect responses with increasing task difficulty. Conversely, there was neither effect of time (P = 0.76) nor time x task interaction (P = 0.13), thus indicating that the percentage of incorrect responses during each tasks did not change significantly with time.
N‐Back Task‐Related Activation/Deactivations
Figure 1 and Table 3 show brain regions significantly activated/deactivated during the N‐back load condition in HC and MS patients. The patterns of activations during the 1‐ vs. 0‐, 2‐ vs. 0‐, and 3‐ vs. 0‐back conditions separately in the two groups are illustrated in the Supporting Information Figure 1. Both groups showed task‐related activations in bilateral parietal regions, bilateral middle and inferior frontal (IFG) gyri, bilateral medial frontal and dorsolateral prefrontal cortex (DL‐PFC), bilateral anterior cingulate cortex (ACC), bilateral insula, and cerebellum. These regions showed also a linear increase of activity with increasing task difficulty (Figure 1, Table 3). Conversely, a pattern of brain regions, usually described as part of the default mode network (DMN) (including the bilateral precuneus/posterior cingulate cortex [PCC], bilateral angular and superior temporal gyri (STG), and medial superior frontal cortex), was deactivated with increasing task difficulty (Figure 1, Table 3). Compared to HC, MS patients had significantly lower activation during the N‐back load condition of the bilateral inferior parietal lobule (IPL), left IFG, and left DL‐PFC (Table 3, Figure 1). Similar between‐group differences, with smaller cluster extents, were found for the 2‐ vs. 0‐ and 3‐ vs. 0‐conditions (data not shown). Similar results were obtained when including NBV as an additional covariate in the analysis (data not shown). No significant heterogeneity of fMRI activity was detected among site at P < 0.05 (FWE corrected). Using a threshold of P < 0.001 (uncorrected), a significant group x site interaction was detected in a cluster located at the level of the left IFG (MNI space coordinates: −52 28 6, cluster extent k = 75), which did not correspond to clusters showing significant differences of fMRI activity between controls and MS patients (Table 3), suggesting only minimal effect of site on our findings.
Figure 1.
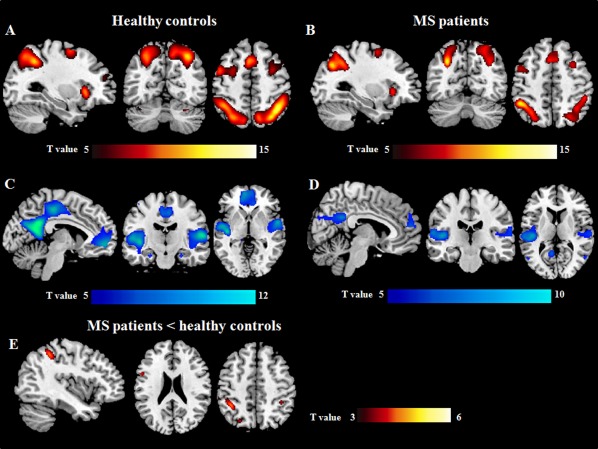
Brain regions showing linearly increasing (A, B) and decreasing (C, D) functional magnetic resonance imaging (fMRI) activations with increasing N‐back task difficulty in healthy controls (A, C) and patients with multiple sclerosis (MS) (B, D) (one‐sample t tests, P < 0.05 family‐wise error corrected for multiple comparisons). Areas with lower increase of activity with increasing N‐back load in MS patients vs. healthy controls are shown in E. Images are in neurological convention.
Table 3.
Brain regions significantly activated/deactivated during the N‐back load condition in healthy controls and patients with multiple sclerosis (MS) (one sample t test, P < 0.05 family‐wise error corrected for multiple comparisons) and between‐group comparisons (P < 0.001 uncorrected)
| Group | Contrast | Brain region | Side | BA | MNI space coordinates | Cluster extent k | T value |
|---|---|---|---|---|---|---|---|
| Healthy controls | N‐back load activations | IPL | L | 40 | −36 −52 46 | 3,146 | 13.1 |
| SPL | L | 7 | −24 −70 46 | 11.9 | |||
| IPL | R | 40 | 40 −52 40 | 3,605 | 13.7 | ||
| SPL | R | 7 | 30 −66 52 | 11.7 | |||
| Precentral gyrus | L | 6 | −44 6 38 | 3,649 | 11.7 | ||
| DL‐PFC | L | 46 | −34 50 22 | 7.6 | |||
| IFG | L | 48 | −48 14 26 | 11.0 | |||
| MFG | R | 8 | 32 6 58 | 2,601 | 10.2 | ||
| DL‐PFC | R | 46 | 38 54 22 | 7.0 | |||
| IFG | R | 44 | 52 22 32 | 8.3 | |||
| Insula | L | 47 | −34 20 2 | 567 | 12.6 | ||
| Insula | R | 47 | 34 24 −4 | 460 | 11.2 | ||
| ACC | L | 32 | −2 18 50 | 935 | 10.6 | ||
| SMA | L | 6 | −4 8 58 | 7.3 | |||
| Cerebel (crI) | R | — | 36 −62 −28 | 49 | 7.4 | ||
| Cerebel (crI) | L | — | −36 −66 −26 | 21 | 5.5 | ||
| Healthy controls | N‐back | Precuneus/PCC | L | 23 | −6 −52 26 | 5,900 | 7.6 |
| load deactivations | Precuneus/PCC | R | 23 | 4 −52 24 | 7.7 | ||
| STG | L | 48 | −50 −26 12 | 3,201 | 10.9 | ||
| STG | R | 48 | 58 −18 12 | 3,225 | 10.2 | ||
| Mid SFG | L | 10 | −6 52 −6 | 2,557 | 8.3 | ||
| Mid SFG | R | 10 | 8 60 6 | 7.4 | |||
| Angular gyrus | L | 39 | −44 −74 30 | 576 | 8.6 | ||
| Angular gyrus | R | 39 | 56 −64 18 | 81 | 5.4 | ||
| PHG | R | 28 | 26 −16 −22 | 131 | 6.2 | ||
| Fusiform gyrus | R | 37 | 22 −46 −12 | 57 | 5.7 | ||
| MS patients | N‐back load activations | IPL | L | 40 | −46 −48 52 | 1,998 | 8.6 |
| SPL | L | 7 | −28 −66 38 | 8.5 | |||
| IPL | R | 40 | 40 −44 40 | 1,944 | 7.6 | ||
| SPL | R | 7 | 26 −68 58 | 7.2 | |||
| Precentral gyrus | L | 6 | −46 4 44 | 1,973 | 7.7 | ||
| IFG | L | 44 | −46 12 30 | 8.1 | |||
| DL‐PFC | L | 46 | −34 48 18 | 24 | 5.5 | ||
| Precentral gyrus | R | 44 | 42 4 28 | 790 | 5.5 | ||
| IFG | R | 45 | 46 36 28 | 7.2 | |||
| MFG | R | 8 | 30 14 60 | 612 | 8.0 | ||
| DL‐PFC | R | 46 | 42 54 10 | 27 | 5.8 | ||
| Insula | L | 47 | −32 24 −2 | 160 | 7.1 | ||
| Insula | R | 47 | 32 24 −4 | 82 | 6.3 | ||
| SMA | L | 6 | −2 16 56 | 846 | 7.6 | ||
| ACC | L | 32 | −4 26 44 | 5.5 | |||
| Cerebel (lobule VI) | R | — | 34 −64 −26 | 14 | 4.4 | ||
| MS patients | N‐back load deactivations | Precuneus/PCC | L | 23 | −4 −48 28 | 1,900 | 8.9 |
| Precuneus/PCC | R | 23 | 6 −48 28 | 7.6 | |||
| STG | L | 48 | −44 −22 10 | 1,582 | 8.1 | ||
| STG | R | 48 | 64 −26 20 | 480 | 6.6 | ||
| Mid SFG | L | 10 | −10 52 42 | 553 | 7.0 | ||
| Mid SFG | R | 10 | 2 54 30 | 6.2 | |||
| MTG | L | 37 | −52 −66 14 | 118 | 6.4 | ||
| MTG | R | 37 | 54 −64 10 | 36 | 6.0 | ||
| MS patients < healthy controls | N‐back load activations | IPL | L | 40 | −38 −46 50 | 268 | 4.1 |
| IPL | R | 40 | 38 −40 44 | 68 | 3.9 | ||
| IFG | L | 44 | −54 8 24 | 71 | 3.6 | ||
| DL‐PFC | L | 46 | −34 46 32 | 51 | 4.1 |
L, left, R, right; BA, Brodmann area; IPL, inferior parietal lobule; SPL, superior parietal lobule; DL‐PFC, dorsolateral prefrontal cortex; IFG, inferior frontal gyrus; MFG, middle frontal gyrus; ACC, anterior cingulate cortex; SMA, supplementary motor area; Cerebel, cerebellum; Mid SFG, medial superior frontal gyrus; PHG, parahyppocampal gyrus; PCC, posterior cingulate cortex; STG, superior temporal gyrus; MTG, middle temporal gyrus.
Effect of Cognitive Impairment
Brain regions activated/deactivated during the N‐back load condition in CP and CI MS patients are shown in Figure 2 and summarized in Table 4; the results of the between‐group comparisons are shown in Figures 3 and 4 and Table 5. Compared to HC, CP MS patients had a reduced recruitment of the left DL‐PFC during the N‐back load condition, whereas compared to HC and CI MS patients they showed an increased recruitment of the right DL‐PFC. With increasing task difficulty compared to HC and CP patients, CI MS patients experienced reduced activations of several areas located in the fronto‐parietal and temporal lobes (Table 5). The conjunction analysis identified the left precentral gyrus, supplementary motor area (SMA) and right insula as areas with lower activation in CI MS patients vs. the other two groups during the N‐back load condition.
Figure 2.
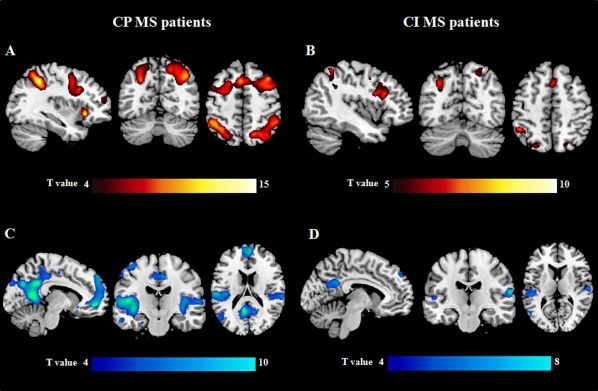
Brain regions showing linearly increasing (A, B) and decreasing (C, D) functional magnetic resonance imaging (fMRI) activations with increasing N‐back task difficulty in cognitively preserved (CP) (A, C) and cognitively impaired (CI) (B, D) patients with multiple sclerosis (MS) (one‐sample t tests, P < 0.05 family‐wise error corrected for multiple comparisons). Images are in neurological convention.
Table 4.
Brain regions significantly activated/deactivated during the N‐back load condition in cognitively preserved (CP) and cognitively impaired (CI) patients with multiple sclerosis (MS) (one‐sample t test, P < 0.05 family‐wise error corrected for multiple comparisons)
| Group | Contrast | Brain region | Side | BA | MNI space coordinates | Cluster extent k | T values |
|---|---|---|---|---|---|---|---|
| CP MS patients | N‐back load activations | IPL | L | 40 | −40 −44 46 | 2,631 | 9.6 |
| SPL | L | 7 | −28 −70 38 | 7.3 | |||
| IPL | R | 40 | 38 −46 42 | 3,474 | 8.6 | ||
| SPL | R | 7 | 20 −62 50 | 6.4 | |||
| Precentral gyrus | L | 6 | −44 4 42 | 11,266 | 7.3 | ||
| IFG | L | 45 | −52 28 32 | 10.6 | |||
| SFG | L | 8 | −20 16 60 | 6.5 | |||
| Precentral gyrus | R | 44 | 42 6 34 | 7.0 | |||
| IFG | R | 45 | 46 38 30 | 8.8 | |||
| MFG | R | 6/8 | 32 14 60 | 7.6 | |||
| DL‐PFC | R | 9 | 40 22 50 | 6.8 | |||
| SMA | L | 6 | −2 14 58 | 8.1 | |||
| ACC | R | 32 | 8 34 40 | 6.1 | |||
| Insula | R | 47 | 32 22 −6 | 8.7 | |||
| Insula | L | 47 | −36 22 −4 | 445 | 7.7 | ||
| CP MS patients | N‐back load deactivations | Precuneus/PCC | L | 23 | −4 −46 32 | 6,742 | 9.1 |
| Precuneus/PCC | R | 23 | −2 −58 26 | 7.7 | |||
| STG | L | 48 | −44 −22 6 | 3,933 | 8.8 | ||
| STG | R | 48 | 62 −30 22 | 3,019 | 6.5 | ||
| Mid SFG | L | 10 | −12 54 44 | 2,890 | 6.7 | ||
| Mid SFG | R | 10 | 4 58 14 | 6.8 | |||
| Fusiform gyrus | R | 37 | 40 −36 −24 | 425 | 6.4 | ||
| CI MS patients | N‐back load activations | IPL | L | 40 | −44 −50 54 | 1,638 | 5.7 |
| SPL | L | 7 | −20 −72 54 | 5.0 | |||
| IPL | R | 40 | 36 −56 58 | 287 | 4.0 | ||
| SPL | R | 7 | 20 −70 52 | 4.6 | |||
| Precentral gyrus | L | 6 | −48 6 38 | 1,350 | 5.8 | ||
| IFG | L | 48 | −46 18 26 | 5.8 | |||
| SMA | R | 8 | 2 20 48 | 292 | 5.1 | ||
| ACC | L | 24 | −6 2 52 | 4.0 | |||
| CI MS patients | N‐back load deactivations | Precuneus/PCC | L | 23 | −6 −48 26 | 483 | 5.1 |
| Precuneus/PCC | R | 23 | 8 −46 26 | 4.2 | |||
| STG | L | 42 | −58 −28 14 | 343 | 5.4 | ||
| STG | R | 48 | 64 −20 16 | 261 | 6.3 | ||
L, left, R, right; BA, Brodmann area; IPL, inferior parietal lobule; SPL, superior parietal lobule; DL‐PFC, dorsolateral prefrontal cortex; IFG, inferior frontal gyrus; MFG, middle frontal gyrus; SMA, supplementary motor area; ACC, anterior cingulate cortex; (Mid) SFG, (medial) superior frontal gyrus; PCC, posterior cingulate cortex; STG, superior temporal gyrus.
Figure 3.
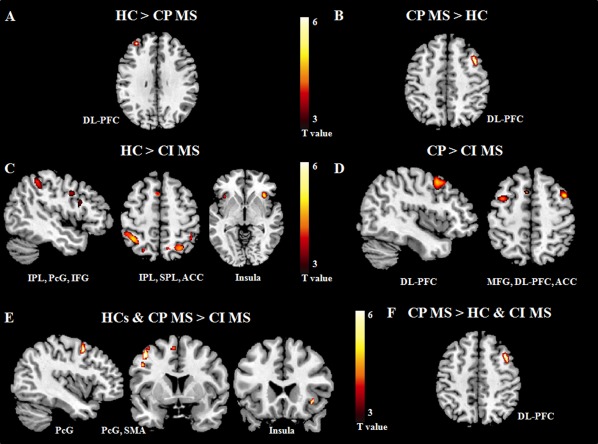
Brain regions showing significantly different fMRI activations with increasing N‐back task difficulty in cognitively impaired (CI) and cognitively preserved (CP) patients with multiple sclerosis (MS) vs. healthy controls (HC): (A) HC vs. CP MS patients; (B) CP MS patients vs. HC; (C) HC vs. CI MS patients; (D) CP vs. CI MS patients; (E) HC and CP MS vs. CI MS patients (conjunction analysis); (F) CP MS vs. CI MS patients and HC (conjunction analysis). Images are in neurological convention. Abbreviations: IPL, inferior parietal lobule; SPL, superior parietal lobule; PcG, precentral gyrus; IFG, inferior frontal gyrus; MFG, middle frontal gyrus; DL‐PFC, dorsolateral prefrontal cortex; SMA, supplementary motor area; ACC, anterior cingulate cortex.
Figure 4.
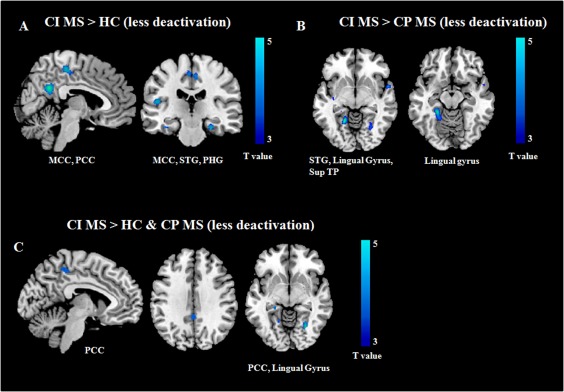
Brain regions showing significantly different fMRI deactivations with increasing N‐back task difficulty in cognitively impaired (CI) patients with multiple sclerosis (MS) vs. the other study groups: (A) CI MS patients vs. healthy controls (HC); (B) CI vs. cognitively preserved (CP) MS patients; (C) CI MS vs. CP MS patients and HC (conjunction analysis). Images are in neurological convention. Abbreviations: MCC, middle cingulate cortex; PCC, posterior cingulate cortex; STG, superior temporal gyrus; PHG, parahippocampal gyrus; Sup TP, superior temporal pole.
Table 5.
Brain regions showing significant differences of fMRI activations/deactivations during the N‐back load condition between cognitively preserved (CP), cognitively impaired (CI) multiple sclerosis (MS) patients and healthy controls (full factorial model adjusted for age and site effect, P < 0.001 uncorrected)
| Tasks | Contrasts | Brain regions | Side | BA | MNI space coordinates | Cluster extents k | T values |
|---|---|---|---|---|---|---|---|
| N‐back load activation | Healthy controls > CP MS patients | DL‐PFC | L | 46 | −32 46 34 | 10 | 3.4 |
| CP MS patients > healthy controls | DL‐PFC | R | 9 | 40 16 48 | 27 | 3.6 | |
| Healthy controls > CI MS patients | IPLa | L | 40 | −38 −46 48 | 761 | 4.9 | |
| SPLa | L | 7 | −26 −68 48 | 4.0 | |||
| IPLa | R | 40 | 40 −42 46 | 303 | 4.6 | ||
| Precentral gyrusa | L | 6 | −46 2 36 | 456 | 4.0 | ||
| IFGa | L | 44 | −50 10 16 | 3.9 | |||
| Insula | L | 47 | −36 22 −4 | 128 | 4.1 | ||
| Insula | R | 47 | 36 24 −4 | 226 | 4.6 | ||
| SPL | R | 7 | 28 −62 54 | 222 | 4.0 | ||
| ACC | L | 32 | −4 10 58 | 30 | 3.7 | ||
| DL‐PFC | L | 46 | −34 46 32 | 27 | 3.4 | ||
| CP > CI MS patients | DL‐PFCa | R | 9 | 44 8 48 | 574 | 4.5 | |
| MFGa | L | 6 | −36 4 52 | 331 | 3.8 | ||
| ACCa | L | 32 | −8 10 58 | 4.0 | |||
| SMAa | L | 6 | −8 6 60 | 3.7 | |||
| Healthy controls & CP > CI MS patients | Precentral gyrus | L | 6 | −44 6 50 | 31 | 3.5 | |
| (conjunction analysis) | SMA | L | 6 | −6 8 58 | 14 | 3.5 | |
| Insula | R | 47 | 36 22 −6 | 10 | 3.3 | ||
| CP > CI MS patients & healthy controls (conjunction analysis) | DL‐PFC | R | 9 | 40 16 48 | 27 | 3.6 | |
| N‐back load deactivation | CI MS patients > healthy controls | Precuneus/PCCa | L | 23 | −4 −46 30 | 555 | 4.0 |
| (CI patients less deactivation) | Precuneus/PCCa | R | 23 | 8 −56 28 | 3.9 | ||
| MCCa | L | 4 | −6 −34 52 | 529 | 4.5 | ||
| PHGa | L | 30 | −26 −34 −12 | 427 | 4.5 | ||
| PHGa | R | 30 | 26 −18 −24 | 369 | 4.4 | ||
| MTG | L | 20 | −50 6 −34 | 134 | 4.1 | ||
| Fusiform gyrus | R | 19 | 28 −64 −6 | 141 | 4.0 | ||
| STG | L | 48 | −48 −22 14 | 68 | 3.9 | ||
| Angular gyrus | L | 39 | −52 −66 26 | 64 | 3.8 | ||
| CI > CP MS patients | Lingual gyrusa | L | 19 | −18 −52 −4 | 552 | 4.5 | |
| (CI patients less deactivation) | Lingual/Fusiform gyrus | R | 19 | 26 −62 −6 | 201 | 3.9 | |
| Sup TP | R | 38 | 56 6 −6 | 110 | 4.1 | ||
| STG | L | 48 | −38 −14 −4 | 155 | 3.9 | ||
| PCC | R | 23/31 | 2 −40 36 | 72 | 3.6 | ||
| STG | R | 41 | 58 −32 4 | 52 | 3.6 | ||
| CI MS patients > healthy controls & CP MS patients (conjunction analysis) | PCC | L | 5 | −8 −38 50 | 31 | 3.4 | |
| (CI patients less deactivation) | PCC | R | 23 | 0 −42 32 | 22 | 3.4 | |
| Lingual gyrus/PHG | L | 27/30 | −24 −36 −14 | 143 | 4.2 | ||
| Lingual gyrus | R | 19 | 28−64 −6 | 81 | 3.8 |
L, left, R, right; BA, Brodmann area; DL‐PFC, dorsolateral prefrontal cortex; IPL, inferior parietal lobule; SPL, superior parietal lobule; IFG, inferior frontal gyrus; SMA, supplementary motor area; ACC, anterior cingulate cortex; PCC, posterior cingulate cortex; MCC, middle cingulate cortex; PHG, parahippocampal gyrus; MTG, middle temporal gyrus; STG, superior temporal gyrus; Sup TP, superior temporal pole.
P < 0.05, family‐wise error corrected for multiple comparisons.
Compared to HC and CP patients, CI MS patients also had a diminished deactivation, during the N‐back load condition, of several regions mainly located at the level of the parietal‐temporal‐occipital lobes (Table 5, Figure 4). At conjunction analysis, the bilateral PCC and lingual gyrus were less deactivated in CI MS patients vs. the other two groups (Table 5, Figure 4).
Analysis of Correlations
In MS patients, reduced activations of regions of the frontal lobes during the N‐back load condition were associated with longer disease duration, higher T2 LV, and higher T1 LV (Table 6). Significant correlations were also found between abnormal patterns of activations and deactivations during the N‐back load condition and behavioral measures and cognitive performance, as well as performance at individual cognitive domains (Table 6).
Table 6.
Brain regions showing significant correlations between fMRI activations/deactivations during the N‐back load condition with clinical, conventional MRI and neuropsychological characteristics of MS patients (multiple regression models adjusted for age and site effect, P < 0.001 uncorrected)
| Variables | N‐back load activations | N‐back load deactivations | ||
|---|---|---|---|---|
| Brain regions | r | Brain regions | r | |
| Accuracy (% of correct responses) | L DL‐PFCa | 0.60 | L PHG | −0.60 |
| L SMA/ACC | 0.54 | L lingual gyrus | −0.58 | |
| R MFG | 0.59 | R PHG | −0.56 | |
| R IFG | 0.57 | |||
| R SPL | 0.54 | |||
| Reaction time | R IPL | −0.62 | L precuneus/PCC | 0.52 |
| L IPL | −0.57 | |||
| Disease duration | R DL‐PFC | −0.57 | — | — |
| L DL‐PFC | −0.57 | |||
| T2 LV | R ACC | −0.61 | — | — |
| T1 LV | R ACC | −0.61 | — | — |
| Global cognitive Z‐score | R precentral gyrus/SFGa | 0.67 | L precuneus/PCCa | −0.63 |
| R SMA | 0.65 | R precuneus | −0.59 | |
| L ACC | 0.45 | R STG | −0.62 | |
| L IFG | 0.59 | L lingual gyrus/PHG | −0.50 | |
| R insula | 0.58 | |||
| R DL‐PFC | 0.56 | |||
| Z‐score of attention functions | R precentral gyrus/SFGa | 0.67 | — | — |
| L IFG | 0.57 | |||
| R IFG | 0.55 | |||
| Z‐score of visual memory | R MFG | 0.63 | L precuneus/MCCa | −0.65 |
| R IPL | 0.48 | L STG | −0.62 | |
| R STG | −0.55 | |||
| Z‐score of verbal memory | — | — | L MOG | −0.61 |
| Z‐score of fluency | — | — | R angular gyrus | −0.57 |
| WCSTte | L DL‐PFC | 0.44 | — | — |
| L postcentral gyrus | 0.48 | |||
| WCSTpe | L DL‐PFC | 0.45 | — | — |
| L postcentral gyrus | 0.47 | |||
| WCSTpr | L DL‐PFC | 0.49 | — | — |
| L paracentral lobulea | 0.49 | |||
| R paracentral lobule | 0.43 | |||
LV, lesion volume; L, left; R, right; DL‐PFC, dorsolateral prefrontal cortex; ACC, anterior cingulate cortex; SFG, superior frontal gyrus; MFG, middle frontal gyrus; IFG, inferior frontal gyrus; SMA, supplementary motor area; PCC, posterior cingulate cortex; STG, superior temporal gyrus; MOG, middle occipital gyrus; PHG, parahippocampal gyrus; SPL, superior parietal lobule.
P < 0.05 family‐wise error corrected for multiple comparisons.
DISCUSSION
In this prospective, cross‐sectional study, we wished to confirm the feasibility of the application of fMRI in a multicenter setting for the assessment of the functional correlates of cognitive function in patients with MS. To this aim, we applied relatively strict inclusion criteria, a validated neuropsychological evaluation, and a standardized fMRI task to evaluate patients and HC enrolled from six different European sites. All centers used 3.0 T magnets and similar MRI sequences. In addition, structural and functional MRI analysis was preplanned and centralized. For fMRI investigation, we chose to apply the N‐back task, which allows assessing working memory and which has been already applied in several previous single‐center studies of MS patients [Amann et al., 2011; Cader et al., 2006; Cader et al., 2009; Forn et al., 2007; Rocca et al., 2010a; Sweet et al., 2004] and in multicenter studies of healthy individuals [Gradin et al., 2010].
In line with the results of previous studies, which have applied a similar fMRI paradigm [Cader et al., 2006; Cader et al., 2009; Rocca et al., 2010a; Sumowski et al., 2010], during the N‐back task both HC and MS patients experienced a distributed pattern of activations of several regions located in the fronto‐parietal lobes, insula and cerebellum, as well as a consistent deactivation of areas usually described as part of the DMN [Amann et al., 2011; Morgen et al., 2007; Sumowski et al., 2010]. Such a pattern of brain recruitment was independent of center and brain atrophy. All of the previous regions are known to contribute to different aspects of working memory processing, and most of them have been demonstrated to have load‐dependent activations/deactivations during working memory tasks [Braver et al., 1997; Buckner et al., 2008; Owen et al., 2005]. These regions included not only areas with a well‐characterized role for cognitive functions (see Owen et al., 2005 for a review), such as the DL‐PFC (involved in holding spatial information on‐line, response selection, monitoring within working memory, and implementation of strategies to facilitate memory), anterior cingulum (which plays a role in error detection and response correction), parietal cortex (involved in storage of working memory contents and implementation of stimuli response mapping), and cerebellum (involved in high‐level cognitive functions and conflict adaptation) but also regions which are part of the sensorimotor network, such as the precentral gyrus and SMA. The recruitment of sensorimotor areas can be related to the motor response required during the fMRI task.
Interestingly, in agreement with the results of a recent meta‐analysis of MS studies [Kollndorfer et al., 2013], when we compared the whole group of MS patients vs. HC, we found in patients a consistently reduced activation during the different experimental conditions of the bilateral IPL, left IFG, and left DL‐PFC.
Second to the proof of the applicability and reliability of the fMRI task and meaningfulness of the results in a multicenter set‐up, our next aim was to define how these findings relate to patients' cognitive status. To do this, we performed two different analyses, which yielded very similar results. In the first one, patients were dichotomized according to the presence/absence of cognitive impairment as defined by established criteria [Lazeron et al., 2005; Portaccio et al., 2009]. The second was an analysis of correlation between fMRI activity and global cognitive Z‐score. Both these analyses revealed that, in MS patients, better cognitive performance was associated with an increased recruitment, during the N‐back load condition, of the right DL‐PFC. At present, the role of right DL‐PFC activity in mediating cognitive performance is largely debated since available studies in MS and in other conditions such as traumatic brain injury demonstrated varied and sometimes conflicting results [Hillary, 2008; Hillary et al., 2006]. Many factors are likely to contribute to discrepancies among studies, including clinical characteristics of the patients enrolled, measures of performance analyzed (accuracy vs. RT) and additional variables possibly related to both task performance and fMRI activity (e.g., lesions, normal‐appearing white matter damage, etc.). In patients with MS, several lines of evidence support the role of this region in contributing favorably to cognitive outcomes. Increased activation and/or connectivity of the right DL‐PFC has been described in patients with clinically isolated syndromes suggestive of MS [Au Duong et al., 2005], early RRMS [Staffen et al., 2002] and nondisabling MS [Colorado et al., 2012] without overt cognitive deficits, suggesting that this might represent an adaptive mechanism which contributes to limiting disease clinical manifestations due to underlying structural brain damage. In line with this, a relatively preserved cortical plasticity has been found in patients with benign MS [Rocca et al., 2012; Rocca et al., 2009], and not in those with secondary progressive MS [Rocca et al., 2012]. Of note, a few longitudinal studies have suggested that an altered recruitment of the right DL‐PFC is associated with improved cognitive performance in observational studies [Audoin et al., 2008] as well as following pharmacological treatment [Cader et al., 2009; Parry et al., 2003] and cognitive rehabilitation [Filippi et al., 2012; Parisi et al., 2012].
Patients with global cognitive impairment experienced reduced activations, with increasing N‐back load, of the left prefrontal gyrus, left SMA and right insula, as well as less deactivation of regions which are part of the DMN, including the PCC and lingual gyrus. A reduced capability to modulate the deactivation of the DMN with increasing task complexity has been demonstrated in several neurological and psychiatric conditions, such as fragile‐X syndrome [Menon et al., 2004], bipolar disorders [Kronhaus et al., 2006], mild cognitive impairment (MCI) [Celone et al., 2006], and also MS [Amann et al., 2011; Loitfelder et al., 2011; Morgen et al., 2007]. A considerable body of evidence supports the notion that such a deficit of DMN modulation might represent a maladaptive mechanism contributing to the clinical manifestations of the disease [Anticevic et al., 2012]. For instance, patients with Alzheimer's disease and MCI with more severe memory deficits have a failure of DMN deactivation when compared to less‐impaired MCI patients [Celone et al., 2006].
The assessment and interpretation of active cognitive fMRI tasks in patients with cognitive impairment may be challenging and might be influenced by a worse task performance in patients vs. controls. Indeed, compared to HC, our MS patients showed a higher number of errors during N‐back performance, with similar RTs. To avoid such an impact, the analysis of resting state (RS) brain functional connectivity has been proposed as a valid alternative to active fMRI investigations, particularly in clinically impaired populations [Raichle and Snyder, 2007]. In line with this, previous RS fMRI studies in MS have markedly contributed to improve our understanding of the role of brain functional reorganization in patients with severe clinical and/or cognitive impairment by showing that a reduced functional connectivity of anterior regions of the brain, mostly located in the frontal lobes [Bonavita et al., 2011; Rocca et al., 2010b], is related not only to the severity of CI, but also to structural disruption of connecting white matter tracts [Rocca et al., 2010b]. Despite this, we preferred to apply an active paradigm in this study because there might be some mechanisms related to cognitive function which are likely not captured properly by the use of a nonactive/resting paradigm. Specifically, previous studies have suggested that patients with MS might have a limited cognitive functional reserve, that is, the ability to match brain activity to increasing cognitive demand [Amann et al., 2011; Cader et al., 2006; Loitfelder et al., 2011; Tortorella et al., 2013]. Such an impaired functional reserve is present across all stages of the disease, including patients with clinically isolated syndrome [Tortorella et al., 2013], even if it is more pronounced in patients with the progressive forms of the disease [Loitfelder et al., 2011]. Therefore, the use of tasks with graded difficulty offers a parametric approach to test the ability of brain regions to increase/decrease activity with increasing task demand and might ultimately allow detection of subtle abnormalities of brain function, similar to those we found in CP and CI MS patients.
Our study has two collateral findings which deserve a brief discussion. First, as expected, in line with the specific role played by cognitive‐related regions in selected aspects of cognitive processes, the analysis of correlation showed that deficits at selected cognitive domains were related to abnormalities of function of specific brain regions during the N‐back load conditions. For instance, impaired WCST performance, which assesses higher executive abilities, were related to abnormal recruitment of regions mostly located in the frontal lobes. This suggests that the task we used might also be useful for investigating the rewiring of cognitive networks in patients with deficits in single cognitive domains. Second, in line with many previous studies, we found a correlation between fMRI abnormalities and measures of structural damage (T2 and T1 LV), which further support the notion that, at least until a certain level, functional plasticity might have an adaptive role and contribute to limit the clinical consequences of disease‐related damage.
Supporting information
Supplementary Information Figure 1.
Supplementary Information Figure legend
ACKNOWLEDGEMENTS
Conflict of interest: Dr. Rocca received speakers honoraria from Novartis and Serono Symposia International Foundation and receives research support from the Italian Ministry of Health and Fondazione Italiana Sclerosi Multipla. Drs Valsasina, Abdel‐Aziz, Enzinger, Pareto, Riccitelli, and Muhlert report no conflicts of intererst. Dr. Hulst receives research support from the Dutch MS Research Foundation, grant number 08–648. Dr. Gallo received honoraria for speaking and travel grants from Biogen, Sanofi‐Aventis, Merck Serono, Genzyme, Teva, Bayer‐Schering and Novartis. Dr. Ciccarelli receives research grant support from the Multiple Sclerosis Society in the UK and from the Department of Health NIHR Comprehensive Biomedical Centre; she has received honoraria and funding for travel from Bayer Schering and TEVA; she receives honoraria for consultancy from GE. Prof Barkhof serves as a consultant for Bayer‐Schering Pharma, Sanofi‐Aventis, Biogen Idec, UCB, Merck Serono, Novartis, Roche, Synthon, Jansen Research, and Lundbeck. Prof Fazekas serves on scientific advisory boards for Bayer Schering, Biogen Idec, Genzyme, Merck Serono, Pfizer, Novartis and Teva Pharmaceutical Industries Ltd.; performs reading services for Parexel; and has received speaker honoraria and support from Biogen Idec, Bayer Schering, Merck Serono, Novartis, Sanofi‐Aventis and Teva Pharmaceutical Industries Ltd. Prof Tedeschi has received speaker honoraria from Sanofi‐Aventis, Merck Serono, Bayer Schering Pharma, Novartis, and Biogen‐Dompè; and has received funding for travel from Bayer Schering Pharma, Biogen‐Dompè, Merck Serono, Novartis, and Sanofi Aventis. Dr. Arevalo received speaking honoraria from Bayer Schering Pharma, Merck Serono and Teva Pharmaceutical Industries. Prof Filippi serves on scientific advisory boards for Teva Pharmaceutical Industries; has received compensation for consulting services and/or speaking activities from Bayer Schering Pharma, Biogen Idec, Merck Serono, and Teva Pharmaceutical Industries; and receives research support from Bayer Schering Pharma, Biogen Idec, Merck Serono, Teva Pharmaceutical Industries, Italian Ministry of Health, Fondazione Italiana Sclerosi Multipla, Cure PSP, and the Jacques and Gloria Gossweiler Foundation (Switzerland).
REFERENCES
- Amann M, Dossegger LS, Penner IK, Hirsch JG, Raselli C, Calabrese P, Weier K, Radu EW, Kappos L, Gass A (2011): Altered functional adaptation to attention and working memory tasks with increasing complexity in relapsing‐remitting multiple sclerosis patients. Hum Brain Mapp 32:1704–1719. [DOI] [PMC free article] [PubMed] [Google Scholar]
- Amato MP, Bartolozzi ML, Zipoli V, Portaccio E, Mortilla M, Guidi L, Siracusa G, Sorbi S, Federico A, De Stefano N (2004): Neocortical volume decrease in relapsing‐remitting MS patients with mild cognitive impairment. Neurology 63:89–93. [DOI] [PubMed] [Google Scholar]
- Anticevic A, Cole MW, Murray JD, Corlett PR, Wang XJ, Krystal JH (2012): The role of default network deactivation in cognition and disease. Trends Cogn Sci 16:584–592. [DOI] [PMC free article] [PubMed] [Google Scholar]
- Au Duong MV, Boulanouar K, Audoin B, Treseras S, Ibarrola D, Malikova I, Confort‐Gouny S, Celsis P, Pelletier J, Cozzone PJ, JP Ranjeva (2005): Modulation of effective connectivity inside the working memory network in patients at the earliest stage of multiple sclerosis. Neuroimage 24:533–538. [DOI] [PubMed] [Google Scholar]
- Audoin B, Reuter F, Duong MV, Malikova I, Confort‐Gouny S, Cherif AA, Cozzone PJ, Pelletier J, Ranjeva JP (2008): Efficiency of cognitive control recruitment in the very early stage of multiple sclerosis: A one‐year fMRI follow‐up study. Mult Scler 14:786–792. [DOI] [PubMed] [Google Scholar]
- Bonavita S, Gallo A, Sacco R, Corte MD, Bisecco A, Docimo R, Lavorgna L, Corbo D, Costanzo AD, Tortora F, M Cirillo, F Esposito, G Tedeschi (2011): Distributed changes in default‐mode resting‐state connectivity in multiple sclerosis. Mult Scler 17:411–422. [DOI] [PubMed] [Google Scholar]
- Boringa JB, Lazeron RH, Reuling IE, Ader HJ, Pfennings L, Lindeboom J, de Sonneville LM, Kalkers NF, Polman CH (2001): The brief repeatable battery of neuropsychological tests: Normative values allow application in multiple sclerosis clinical practice. Mult Scler 7:263–267. [DOI] [PubMed] [Google Scholar]
- Braver TS, Cohen JD, Nystrom LE, Jonides J, Smith EE, Noll DC (1997): A parametric study of prefrontal cortex involvement in human working memory. Neuroimage 5:49–62. [DOI] [PubMed] [Google Scholar]
- Buckner RL, Andrews‐Hanna JR, Schacter DL (2008): The brain's default network: Anatomy, function, and relevance to disease. Ann N Y Acad Sci 1124:1–38. [DOI] [PubMed] [Google Scholar]
- Cader S, Cifelli A, Abu‐Omar Y, Palace J, Matthews PM (2006): Reduced brain functional reserve and altered functional connectivity in patients with multiple sclerosis. Brain 129:527–537. [DOI] [PubMed] [Google Scholar]
- Cader S, Palace J, Matthews PM (2009): Cholinergic agonism alters cognitive processing and enhances brain functional connectivity in patients with multiple sclerosis. J Psychopharmacol 23:686–696. [DOI] [PubMed] [Google Scholar]
- Calabrese M, Agosta F, Rinaldi F, Mattisi I, Grossi P, Favaretto A, Atzori M, Bernardi V, Barachino L, Rinaldi L, P Perini, P Gallo, M Filippi (2009): Cortical lesions and atrophy associated with cognitive impairment in relapsing‐remitting multiple sclerosis. Arch Neurol 66:1144–1150. [DOI] [PubMed] [Google Scholar]
- Celone KA, Calhoun VD, Dickerson BC, Atri A, Chua EF, Miller SL, DePeau K, Rentz DM, Selkoe DJ, Blacker D, MS Albert, RA Sperling (2006): Alterations in memory networks in mild cognitive impairment and Alzheimer's disease: An independent component analysis. J Neurosci 26:10222–10231. [DOI] [PMC free article] [PubMed] [Google Scholar]
- Chiaravalloti ND, DeLuca J (2008): Cognitive impairment in multiple sclerosis. Lancet Neurol 7:1139–1151. [DOI] [PubMed] [Google Scholar]
- Colorado RA, Shukla K, Zhou Y, Wolinsky JS, Narayana PA (2012): Multi‐task functional MRI in multiple sclerosis patients without clinical disability. Neuroimage 59:573–581. [DOI] [PMC free article] [PubMed] [Google Scholar]
- Dineen RA, Vilisaar J, Hlinka J, Bradshaw CM, Morgan PS, Constantinescu CS, Auer DP (2009): Disconnection as a mechanism for cognitive dysfunction in multiple sclerosis. Brain 132:239–249. [DOI] [PubMed] [Google Scholar]
- Filippi M, Riccitelli G, Mattioli F, Capra R, Stampatori C, Pagani E, Valsasina P, Copetti M, Falini A, Comi G, MA Rocca (2012): Multiple sclerosis: effects of cognitive rehabilitation on structural and functional MR imaging measures ‐ an explorative study. Radiology 262:932–940. [DOI] [PubMed] [Google Scholar]
- Forn C, Barros‐Loscertales A, Escudero J, Benlloch V, Campos S, Antonia Parcet M, Avila C (2007): Compensatory activations in patients with multiple sclerosis during preserved performance on the auditory N‐back task. Hum Brain Mapp 28:424–430. [DOI] [PMC free article] [PubMed] [Google Scholar]
- Friston KJ, Holmes AP, Poline JB, Grasby PJ, Williams SC, Frackowiak RS, Turner R (1995): Analysis of fMRI time‐series revisited. Neuroimage 2:45–53. [DOI] [PubMed] [Google Scholar]
- Gradin V, Gountouna VE, Waiter G, Ahearn TS, Brennan D, Condon B, Marshall I, McGonigle DJ, Murray AD, Whalley H, J Cavanagh, D Hadley, K Lymer, A McIntosh, TJ Moorhead, D Job, J Wardlaw, SM Lawrie, JD Steele (2010): Between‐ and within‐scanner variability in the CaliBrain study n‐back cognitive task. Psychiatry Res 184:86–95. [DOI] [PubMed] [Google Scholar]
- Gronwall DM (1977): Paced auditory serial‐addition task: a measure of recovery from concussion. Percept Mot Skills 44:367–373. [DOI] [PubMed] [Google Scholar]
- Heaton RK, Chelune GJ, Talley JL, Kay GG, Curtiss G (1993): Wisconsin Card sorting test (WCST) manual revised and expanded. Psychological Assessment Resources Inc, Odessa, FL. [Google Scholar]
- Hillary FG (2008): Neuroimaging of working memory dysfunction and the dilemma with brain reorganization hypotheses. J Int Neuropsychol Soc 14:526–534. [DOI] [PubMed] [Google Scholar]
- Hillary FG, Genova HM, Chiaravalloti ND, Rypma B, DeLuca J (2006): Prefrontal modulation of working memory performance in brain injury and disease. Hum Brain Mapp 27:837–847. [DOI] [PMC free article] [PubMed] [Google Scholar]
- Kollndorfer K, Krajnik J, Woitek R, Freiherr J, Prayer D, Schopf V (2013): Altered likelihood of brain activation in attention and working memory networks in patients with multiple sclerosis: An ALE meta‐analysis. Neurosci Biobehav Rev 37:2699–2708. [DOI] [PMC free article] [PubMed] [Google Scholar]
- Kronhaus DM, Lawrence NS, Williams AM, Frangou S, Brammer MJ, Williams SC, Andrew CM, Phillips ML (2006): Stroop performance in bipolar disorder: Further evidence for abnormalities in the ventral prefrontal cortex. Bipolar Disord 8:28–39. [DOI] [PubMed] [Google Scholar]
- Kurtzke JF (1983): Rating neurologic impairment in multiple sclerosis: An expanded disability status scale (EDSS). Neurology 33:1444–1452. [DOI] [PubMed] [Google Scholar]
- Lazeron RH, Boringa JB, Schouten M, Uitdehaag BM, Bergers E, Lindeboom J, Eikelenboom MI, Scheltens PH, Barkhof F, Polman CH (2005): Brain atrophy and lesion load as explaining parameters for cognitive impairment in multiple sclerosis. Mult Scler 11:524–531. [DOI] [PubMed] [Google Scholar]
- Leavitt VM, Wylie GR, Girgis PA, Deluca J, Chiaravalloti ND: Increased functional connectivity within memory networks following memory rehabilitation in multiple sclerosis. Brain Imaging Behav (in press). [DOI] [PubMed] [Google Scholar]
- Loitfelder M, Fazekas F, Petrovic K, Fuchs S, Ropele S, Wallner‐Blazek M, Jehna M, Aspeck E, Khalil M, Schmidt R, C Neuper, C Enzinger (2011): Reorganization in cognitive networks with progression of multiple sclerosis: Insights from fMRI. Neurology 76:526–533. [DOI] [PubMed] [Google Scholar]
- Lublin FD, Reingold SC (1996): Defining the clinical course of multiple sclerosis: Results of an international survey. National Multiple Sclerosis Society (USA) Advisory Committee on Clinical Trials of New Agents in Multiple Sclerosis. Neurology 46:907–911. [DOI] [PubMed] [Google Scholar]
- Mattioli F, Stampatori C, Zanotti D, Parrinello G, Capra R (2010): Efficacy and specificity of intensive cognitive rehabilitation of attention and executive functions in multiple sclerosis. J Neurol Sci 288:101–5. [DOI] [PubMed] [Google Scholar]
- Menon V, Leroux J, White CD, Reiss AL (2004): Frontostriatal deficits in fragile X syndrome: Relation to FMR1 gene expression. Proc Natl Acad Sci USA 101:3615–3620. [DOI] [PMC free article] [PubMed] [Google Scholar]
- Mesaros S, Rocca MA, Kacar K, Kostic J, Copetti M, Stosic‐Opincal T, Preziosa P, Sala S, Riccitelli G, Horsfield MA, J Drulovic, G Comi, M Filippi (2012): Diffusion tensor MRI tractography and cognitive impairment in multiple sclerosis. Neurology 78:969–975. [DOI] [PubMed] [Google Scholar]
- Morgen K, Sammer G, Courtney SM, Wolters T, Melchior H, Blecker CR, Oschmann P, Kaps M, Vaitl D (2007): Distinct mechanisms of altered brain activation in patients with multiple sclerosis. Neuroimage 37:937–946. [DOI] [PubMed] [Google Scholar]
- Oldfield RC (1971): The assessment and analysis of handedness: The Edinburgh inventory. Neuropsychologia 9:97–113. [DOI] [PubMed] [Google Scholar]
- Owen AM, McMillan KM, Laird AR, Bullmore E (2005): N‐back working memory paradigm: A meta‐analysis of normative functional neuroimaging studies. Hum Brain Mapp 25:46–59. [DOI] [PMC free article] [PubMed] [Google Scholar]
- Parisi L, Rocca MA, Valsasina P, Panicari L, Mattioli F, Filippi M: Cognitive rehabilitation correlates with the functional connectivity of the anterior cingulate cortex in patients with multiple sclerosis. Brain Imag Behav (in press). [DOI] [PubMed] [Google Scholar]
- Parry AM, Scott RB, Palace J, Smith S, Matthews PM (2003): Potentially adaptive functional changes in cognitive processing for patients with multiple sclerosis and their acute modulation by rivastigmine. Brain 126:2750–2760. [DOI] [PubMed] [Google Scholar]
- Polman CH, Reingold SC, Banwell B, Clanet M, Cohen JA, Filippi M, Fujihara K, Havrdova E, Hutchinson M, Kappos L, Lublin FD, Montalban X, O'Connor P, Sandberg‐Wollheim M, Thompson AJ, Waubant E, Weinshenker B, Wolinsky JS. (2011): Diagnostic criteria for multiple sclerosis: 2010 Revisions to the McDonald criteria. Ann Neurol 69:292–302. [DOI] [PMC free article] [PubMed] [Google Scholar]
- Portaccio E, Goretti B, Zipoli V, Siracusa G, Sorbi S, Amato MP (2009): A short version of Rao's brief repeatable battery as a screening tool for cognitive impairment in multiple sclerosis. Clin Neuropsychol 23:268–275. [DOI] [PubMed] [Google Scholar]
- Raichle ME, Snyder AZ (2007): A default mode of brain function: A brief history of an evolving idea. Neuroimage 37:1083–1090; discussion 1097–1099. [DOI] [PubMed] [Google Scholar]
- Rao SM and the Cognitive Function Study Group of the National Multiple Sclerosis Society (1990): A Manual for the Brief, Repeatable Battery of Neuropsychological Tests in Multiple Sclerosis. Medical College of Wisconsin, Milwaukee, WI. [Google Scholar]
- Rocca MA, Valsasina P, Ceccarelli A, Absinta M, Ghezzi A, Riccitelli G, Pagani E, Falini A, Comi G, Scotti G, M Filippi (2009): Structural and functional MRI correlates of Stroop control in benign MS. Hum Brain Mapp 30:276–290. [DOI] [PMC free article] [PubMed] [Google Scholar]
- Rocca MA, Riccitelli G, Rodegher M, Ceccarelli A, Falini A, Falautano M, Meani A, Comi G, Filippi M (2010a): Functional MR imaging correlates of neuropsychological impairment in primary‐progressive multiple sclerosis. AJNR Am J Neuroradiol 31:1240–1246. [DOI] [PMC free article] [PubMed] [Google Scholar]
- Rocca MA, Valsasina P, Absinta M, Riccitelli G, Rodegher ME, Misci P, Rossi P, Falini A, Comi G, Filippi M (2010b): Default‐mode network dysfunction and cognitive impairment in progressive MS. Neurology 74:1252–1259. [DOI] [PubMed] [Google Scholar]
- Rocca MA, Bonnet MC, Meani A, Valsasina P, Colombo B, Comi G, Filippi M (2012): Differential cerebellar functional interactions during an interference task across multiple sclerosis phenotypes. Radiology 265:864–873. [DOI] [PubMed] [Google Scholar]
- Roosendaal SD, Moraal B, Pouwels PJ, Vrenken H, Castelijns JA, Barkhof F, Geurts JJ (2009): Accumulation of cortical lesions in MS: Relation with cognitive impairment. Mult Scler 15:708–714. [DOI] [PubMed] [Google Scholar]
- Sastre‐Garriga J, Alonso J, Renom M, Arevalo MJ, Gonzalez I, Galan I, Montalban X, Rovira A. (2011): A functional magnetic resonance proof of concept pilot trial of cognitive rehabilitation in multiple sclerosis. Mult Scler 17:457–467. [DOI] [PubMed] [Google Scholar]
- Sepulcre J, Sastre‐Garriga J, Cercignani M, Ingle GT, Miller DH, Thompson AJ (2006): Regional gray matter atrophy in early primary progressive multiple sclerosis: A voxel‐based morphometry study. Arch Neurol 63:1175–1180. [DOI] [PubMed] [Google Scholar]
- Smith SM, Zhang Y, Jenkinson M, Chen J, Matthews PM, Federico A, De Stefano N (2002): Accurate, robust, and automated longitudinal and cross‐sectional brain change analysis. Neuroimage 17:479–489. [DOI] [PubMed] [Google Scholar]
- Staffen W, Mair A, Zauner H, Unterrainer J, Niederhofer H, Kutzelnigg A, Ritter S, Golaszewski S, Iglseder B, Ladurner G (2002): Cognitive function and fMRI in patients with multiple sclerosis: Evidence for compensatory cortical activation during an attention task. Brain 125:1275–1282. [DOI] [PubMed] [Google Scholar]
- Sumowski JF, Wylie GR, Deluca J, Chiaravalloti N (2010): Intellectual enrichment is linked to cerebral efficiency in multiple sclerosis: Functional magnetic resonance imaging evidence for cognitive reserve. Brain 133:362–374. [DOI] [PMC free article] [PubMed] [Google Scholar]
- Sweet LH, Rao SM, Primeau M, Mayer AR, Cohen RA (2004): Functional magnetic resonance imaging of working memory among multiple sclerosis patients. J Neuroimaging 14:150–157. [PubMed] [Google Scholar]
- Tortorella C, Romano R, Direnzo V, Taurisano P, Zoccolella S, Iaffaldano P, Fazio L, Viterbo R, Popolizio T, Blasi G, A Bertolino, M Trojano (2013): Load‐dependent dysfunction of the putamen during attentional processing in patients with clinically isolated syndrome suggestive of multiple sclerosis. Mult Scler 19:1153–1160. [DOI] [PubMed] [Google Scholar]
Associated Data
This section collects any data citations, data availability statements, or supplementary materials included in this article.
Supplementary Materials
Supplementary Information Figure 1.
Supplementary Information Figure legend