

Abstract
Objectives
To evaluate whether biases may influence the findings of whole‐brain structural imaging literature.
Methods
Forty‐seven whole‐brain voxel‐based meta‐analyses including voxel‐based morphometry (VBM) studies in neuropsychiatric conditions were included, for a total of 324 individual VBM studies. The total sample size, the overall number of foci, and different moderators were extracted both at the level of the individual studies and at the level of the meta‐analyses.
Results
Sample size ranged from 12 to 545 (median n = 47) per VBM study. The median number of reported foci per study was six. VBM studies with larger sample sizes reported only slightly more abnormalities than smaller studies (2% increase in the number of foci per 10‐patients increase in sample size). A similar pattern was seen in several analyses according to different moderator variables with some possible modulating evidence for the statistical threshold employed, publication year and number of coauthors. Whole‐brain meta‐analyses (median sample size n = 534) found fewer foci (median = 3) than single studies and overall they showed no significant increase in the number of foci with increasing sample size. Meta‐analyses with ≥10 VBM studies reported a median of three foci and showed a significant increase with increasing sample size, while there was no relationship between sample size and number of foci (median = 5) in meta‐analyses with <10 VBM studies.
Conclusions
The number of foci reported in small VBM studies and even in meta‐analyses with few studies may often be inflated. This picture is consistent with reporting biases affecting small studies. Hum Brain Mapp 35:3052–3065, 2014. © 2013 Wiley Periodicals, Inc.
Keywords: neuroimaging, VBM, structural, bias, psychosis, dementia
INTRODUCTION
Structural magnetic resonance imaging (sMRI) studies have been carried out by many researchers in different neuropsychiatric conditions including psychosis, depression, dementia, attention deficit hyperactivity disorder (ADHD) and autistic disorders. Often, the morphometric measurements used in these studies have been obtained from a priori regions of interests (ROIs) that can be clearly defined (such as the hippocampi or the ventricles) [Ashburner and Friston, 2000]. However, there are a number of morphometric features that may be more difficult to quantify by inspection, meaning that many structural differences may be over or under looked. The caveat of the ROIs structural analyses is that, because of these difficulties, researchers can introduce a large source of heterogeneity undermining the consistency of their results. These problems may ultimately prevent clinical application of sMRI to psychiatry [Borgwardt and Fusar‐Poli, 2012]. To address this limitation, an advanced structural imaging technique has been recently introduced and widely applied. Voxel‐based morphometry (VBM) involves a voxel‐wise comparison of the local concentration of gray matter between two or more groups of subjects. The procedure usually involves spatially normalizing high‐resolution images from all the subjects in the study into the same stereotactic space, segmenting the gray and white matter and smoothing the resulting gray‐matter segments. Some protocols also include a ‘modulation’ step, but its effects are disputed (Radua et al. 2013). Voxel‐wise parametric or non‐parametric statistical tests comparing the experimental groups are then performed correcting for multiple comparisons. The value of this automated analytical approach is that it gives an “even‐handed and comprehensive assessment of anatomical differences throughout the brain” without necessarily biasing attention a priori to a specific ROI [Laird et al., 2005]. Because of this, VBM is considered an objective method to analyze whole‐brain structural abnormalities in neuroscience and psychiatric research and bridge structural neuroimaging toward clinical applications. However, it is unclear whether the current VBM literature can still be affected by biases, in particular publication and other selective reporting biases, where investigators selectively report statistically significant results and under‐report non‐significant findings – as noted for sMRI studies [Ioannidis, 2011].
Detecting these biases in single studies is difficult: by default it is very difficult to unearth unpublished studies and unless the original protocol is available it is not possible to check whether the presented results are more favorable (e.g., claim more discovered foci with abnormalities) than an analysis based on the original protocol. However, one may obtain hints about the presence of such biases, when many studies have been performed. In the absence of bias, one would expect power to detect abnormalities to improve when sample size increases, other things being equal. Conversely, with such biases small studies with unimpressive null results may be unpublished, or they may be analyzed in a way that they provide more foci. Evidence from many different scientific fields suggests that bias may affect to a lesser extent large studies, since these are likely to be published regardless of their results and analytical manipulation may be less prominent [Rothstein HR et al., 2005].
The first aim of this study was to evaluate the relationship between sample size and reported discovered foci in published VBM studies across different neuropsychiatric conditions so as to probe into the possibility of reporting biases affecting preferentially smaller studies. This was achieved by focusing on available voxel‐based meta‐analyses of VBM studies, such those performed with Activation Likelihood Estimate [Laird et al., 2005] or Signed Differential Mapping [Radua and Mataix‐Cols, 2009, 2012; Radua et al., 2010a, 2012a]. These meta‐analyses are attempting to reconcile contrasting and inconclusive individual VBM findings by obtaining larger sample sizes with an associated greater statistical power. Thus, we assess whether larger sample sizes are associated with larger number of identified foci. If conversely, the same or even more foci are claimed to be identified by small studies as with larger ones this would offer evidence for bias. The second aim of this study was to explore the impact of a number of variables on the relationship between sample size and number of reported foci in the VBM literature including the type of neuropsychiatric disorder, the publication year, the sample size of the study, the slice thickness of the images, the degree of smoothing, the software used to preprocess or perform the statistical analysis of the data, the statistical threshold employed, and the use of a small volume corrections (SVC) in the analysis. Our third aim was then to evaluate whether sample size was related to the number of reported foci in meta‐analyses of VBM studies across different psychiatric conditions and whether these meta‐analyses report more or fewer foci than the much smaller studies that they include.
METHODS
Search Strategy
We conducted a four‐step literature search. First, we searched on PubMed using the Boolean terms “voxel‐based morphometry meta‐analysis.” All publications listed in PubMed prior to August 1, 2012 were included. In a second step we also searched the bibliographies of Brain Map (http://brainmap.org/pubs/) and SDM databases (http://sdmproject.com) (last search performed on July 31, 2012). All eligible publications were included. In a third step we hand searched the references of the included publications to minimize the possibility of biases in the literature search. Full texts were pulled for all potentially eligible publications. Then the retrieved publications underwent an initial culling of ineligible and duplicate analyses. These publications were then hand searched for inclusion criteria and selected by two analysts independently (MF & PFP), with any discrepancies adjudicated until 100% rater agreement was achieved. To achieve a high standard of reporting we have adopted ‘Preferred Reporting Items for Systematic Reviews and Meta‐Analyses’ (PRISMA) guidelines [Liberati et al., 2009].
In the final step, we searched and then collected all the individual studies listed in each included article.
Controlling for Independent Data
Many of the included articles conducted different meta‐analyses for more than one condition (sub‐meta‐analyses). These sub‐meta‐analyses were each considered separately for inclusion in our study. To avoid inclusion of overlapping data, when two meta‐analyses included overlapping sets of studies in a similar contrast, we retained only the more recent and largest number of studies/sample size meta‐analysis. In the case where the same paper included both an overall meta‐analysis and separate sub‐analyses for different conditions, the sub‐analyses were preferentially included (with the overall meta‐analysis being considered a duplicate and excluded). As a consequence, all the included meta‐analyses have addressed different between‐groups contrasts. We then carefully searched the included articles at the level of each individual study and studies were compiled and compared a second time to eliminate overlapping samples to insure that no individual study was double counted.
Inclusion Criteria
Articles were included in our analysis if they were independent (see above) whole‐brain voxel‐based meta‐analyses of magnetic resonance imaging (MRI) studies of human brain. Meta‐analyses were eligible regardless of the neurological or psychiatric condition investigated. Exclusion criteria were (i) meta‐analyses of ROI (not whole brain), (ii) structural modalities other than VBM (e.g., diffusion tensor imaging, cortical pattern matching), (iii) functional brain imaging meta‐analyses or (iv) non‐human studies, and (v) overlapping meta‐analyses. Meta‐analyses of studies investigating white matter differences (Peters et al., in press; Radua et al., 2010b) were also excluded. Only a minority of the retrieved meta‐analyses had fully listed the number of subjects and number of foci identified in each individual study, which was necessary to perform the statistical analysis. To circumvent this problem, include moderators and avoid missing data, we collected all the individual studies for each meta‐analysis and extracted these details (see below).
Data Extraction
At the level of each individual study, we extracted the total sample size, the overall number of foci, the condition, the contrast within the condition, the imaging parameters (magnet intensity, slice thickness, degree of smoothing, and software packages used), the statistical threshold [false discovery rate (FDR), family‐wise error (FWE) correction, uncorrected P‐value] and the use of SVC in the analysis. Similarly, at the level of the meta‐analyses, we extracted total sample size, the overall number of foci, the condition, the contrast within the condition, the statistical threshold and the software packages used.
Theoretical Framework and Statistical Analysis
Given that studies with large samples have more power to detect abnormalities, the number of reported foci should show a positive relationship with the sample size. As exemplified in Figure 1, small studies should detect only a small proportion of the true abnormalities, whilst larger studies should detect a larger part of the true abnormalities. A weak or null relationship could indicate potential reporting biases affecting the smaller studies more than the larger studies [David et al., 2013].
Figure 1.

Expected relationship between sample size and number of abnormalities detected by whole‐brain structural neuroimaging techniques.
Footnote: The number of abnormalities correctly detected as abnormal (P < 0.05) in a simulated study with that sample size is shown with solid lines. The number falsely detected abnormalities is shown with dotted lines. In all simulations, brain was composed of 5,000 independent parts, of which 95% were normal and 5% were abnormal.
Specifically, the relationship between the number of reported foci in each study and the sample size of the study was assessed with a zero‐inflated Poisson regression [Zeleis et al., 2008]. This model was used, instead of simpler ones, because the number of foci in VBM studies was observed to follow a mixture of a point mass at zero with a count distribution. However, for the sake of completeness, we also conducted meta‐analytical combination of Poisson coefficients, estimated separately for each published meta‐analysis, simple Pearson correlations, non‐linear Spearman correlations, Pearson correlations after discarding the most influential study according to the dfbetas statistic of the regression of foci by sample size [Belsley et al., 1980], and meta‐analytical combination of (Fisher‐transformed) Pearson correlations separately estimated per each published meta‐analysis.
It should be noted that variability in the way authors report VBM results could conceal the expected positive relationship between the sample size and the number of reported foci. Statistically significant voxels are usually grouped in clusters of spatially contiguous voxels, and only the local maxima (i.e., foci) are reported. Importantly, an increase of the sample size helps non‐significant voxels between two close clusters to achieve statistical significance, thus sometimes converting the two close clusters into a single larger one. The number of foci should not be affected by this conversion, but some authors choose to report only three foci per cluster. In other words, these authors could report up to six foci when describing the two close clusters, whilst no more than three when describing the single larger cluster obtained after an increase of the sample size. In such a case, the relationship between the sample size and the number of foci could be downwards biased.
A simulation framework was used to assess whether such potential bias could significantly affect the expected relationship. First, 84,000 gray‐matter datasets were simulated by adding normally distributed noise to a normal gray‐matter template (n = 42,000 controls), or to a gray‐matter template with abnormal volume in regions reported to have decreased gray matter in first psychotic episodes (n = 42,000 patients) [Radua et al., 2012b]. Second, these data were smoothed with a large Gaussian kernel [σ = 6 mm, full‐width at half maximum (FWHM) = 14 mm], thus simulating both the spatial covariance observable in raw data and the smoothing usually applied in VBM pre‐processing. Finally, individuals were grouped in 400 simulated studies with different numbers of participants (from n = 10 to 200 per group), and standard group‐level voxel‐based statistics were performed (uncorrected P = 0.001, 20 voxels extent). As shown in Figure 2, the number of clusters followed a clear positive relationship with the sample size. The relationship would be the same if each cluster was substituted by three reported foci.
Figure 2.

Relationship between sample size and number of clusters in simulated VBM data.
To explore experimental variables influencing the relationship between sample size and number of reported foci, subgroup regressions were conducted on the following subsets of studies: studies published up to and after 2008, studies with up to or more than six authors, studies with less than or at least 32 patients, studies with samples sizes up to 80 patients, studies conducted in MRI devices with magnets up to or stronger than 1.5 Tesla (T), studies with MRI acquisition slices thickness of at least or thinner than 1.5 mm, studies employing statistical parametric mapping (SPM) or other software packages to pre‐process and compare the images, studies applying a smoothing of up to or superior to 8 mm of FWHM, studies thresholding at P < 0.001 uncorrected for multiple comparisons, studies thresholding at P < 0.05 FDR‐ or FWE‐corrected for multiple comparisons, studies employing SVC, and studies investigating different neuropsychiatric conditions. Cutoffs for magnet intensity, slice thickness, and smoothing kernel were chosen because they allowed dividing the total sample of studies in two sub‐groups of fairly similar size. The year 2008 was chose as cutoff to specifically test the impact of advanced VBM algorithms such as the DARTEL, which were introduced shortly before [Ashburner, 2007b]. The sample size of 32 patients was chosen on the basis of evidence indicating that the minimum sample size for a neuroimaging study is 16 patients per group [Friston, 2012]. The number of authors of six was chosen on the basis of the previous findings by Sayo et al (2011). Regression slopes of complementary subgroups with different findings (e.g., one slope is significantly higher than zero and the other slope is not significantly higher than zero) were formally compared with zero‐inflated Poisson models. All calculations were performed with the “pscl” package for R [Jackman, 2012] [R_Development_Core_Team, 2011]. A regression line was applied to the reported plots for both significant and non‐significant relationships.
Finally, we also assessed the results of the meta‐analyses that had combined these VBM studies. First, we evaluated the relationship between the number of reported foci in each meta‐analysis and the combined sample size of the studies included in the meta‐analysis with a Poisson regression. Again, this model was used, instead of simpler ones, because the number of foci in VBM studies was observed to follow a count distribution. For the sake of completeness, we also conducted simple Pearson correlation, non‐linear Spearman correlation, and Pearson correlation after discarding the most influential study according to the dfbetas statistic of the regression of foci by sample size. Second, we evaluated whether the number of foci reported in the meta‐analyses was larger or smaller than the number of foci reported in each of the VBM studies that they had combined. We tested the hypothesis that the much larger sample size of the meta‐analyses would allow detecting more or at least as many foci as in the individual studies. In the presence of bias in single studies, the meta‐analyses may report even fewer validated foci than the single studies, because the biases may be diluted in the meta‐analysis. The analysis used the Wilcoxon paired test, where the number of foci in the meta‐analysis was compared paired against the number of foci in each study that it included.
RESULTS
Database
Our literature search identified 54 full text articles, which were assessed for inclusion criteria. The final database comprised 42 articles with 79 meta‐analyses (including sub‐analyses). After checking for duplicate or overlapping meta‐analyses, a final set of 47 meta‐analyses were included and the final dataset used in this study comprised a total of 324 individual VBM studies. The literature search and the characteristics of the included and excluded meta‐analyses are detailed in the Figure 3, Table 1 and Supporting Information Table IS. As shown in Table 2, the number of participants ranged from 12 to 545 in the studies (median = 47, interquartile range = 39), and from 149 to 4087 in the meta‐analyses (median = 534, interquartile range = 721). The median number of reported foci per study was six, while the median number of foci reported per meta‐analysis was three. Seventy‐four percent of the studies reported 10 foci or less, and 79% of the meta‐analyses five foci or less. Other descriptive details of the included studies and meta‐analyses are depicted in Table 2.
Figure 3.
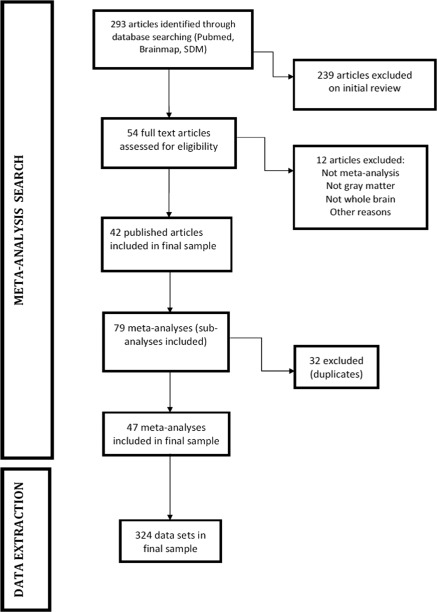
PRISMA Flow chart of literature search.
Table 1.
List of articles included in the present meta‐meta‐analysis. Each meta‐analysis (contrast) used for each included study is detailed in the specific column
| Author | Year | Statistical threshold | Condition | Contrast | Sample | Number of foci |
|---|---|---|---|---|---|---|
| Yang | 2012 (Yang et al., 2012) | P < 0.05 (FDR) | Semantic dementia | SD vs. HC | 235 | 10 |
| Bora | 2010 (Bora et al., 2010) | P < 0.001 | Bipolar disorder | BD vs. HC | 1430 | 3 |
| FE BD vs. HC | 197 | 1 | ||||
| Bora | 2011 (Bora et al., 2011) | P < 0.001 | Schizophrenia | SCZ vs. HC | 4087 | 5 |
| FEP vs. HC | 874 | 2 | ||||
| FEP vs. CHR SCZ | 4087 | 3 | ||||
| Bora | 2012 (Bora et al., 2012) | P < 0.001 | Depressive disorder | FE DEP vs. HC | 292 | 1 |
| ME DEP vs. HC | 1631 | 2 | ||||
| FE DEP vs. ME DEP | 1923 | 1 | ||||
| CO ANX vs. HC | 1117 | 1 | ||||
| NO CO ANX vs. HC | 558 | 2 | ||||
| C DEP vs. HC | 1414 | 1 | ||||
| Chen | 2010 (Chen and Ma 2010) | P < 0.001 | Amyotrophic lateral sclerosis | ALS vs. HC | 165 | 1 |
| Fusar‐Poli | 2011 (Fusar‐Poli et al., 2011a) | P < 0.05 (FDR) | Psychosis risk | Clinical HR vs. HC | 516 | 5 |
| HR NoTransition vs. HR Transition | 165 | 2 | ||||
| Genetic HR vs. HC | 952 | 3 | ||||
| Genetic HR vs. Clinical HR | 1468 | 5 | ||||
| HR vs. SCZ | 754 | 5 | ||||
| Fusar‐Poli | 2011 (Fusar‐Poli et al., 2011b) | P < 0.001 | Psychosis onset | FEP vs. HC | 413 | 3 |
| FEP vs. HR | 865 | 4 | ||||
| Lai | 2011 (Lai 2011) | P < 0.001 | Panic disorder | PD vs. HC | 226 | 2 |
| Li | 2012 (Palaniyappan et al., 2012) | P < 0.05 (FDR) | Epilepsy | RTLE vs. HC | 300 | 7 |
| LTLE vs. HC | 433 | 11 | ||||
| Modinos | 2012 (Modinos et al., 2012) | P < 0.001 | Auditory verbal hallucinations | AVHs Severe vs. AVHs Non severe | 259 | 6 |
| SCZ AVHs vs. SCZ No AVHs | 266 | 0 | ||||
| Nakao | 2011 (Nakao et al., 2011) | P < 0.001 | ADHD | ADHD vs. HC | 722 | 2 |
| Nickl‐Jockschat | 2012 (Nickl‐Jockschat et al., 2012b) | P < 0.05 (n.a.) | Mild cognitive impairment | MCI vs. HC | 1726 | 3 |
| Amnestic MCI vs. HC | 1659 | 5 | ||||
| Pan | 2012 (Pan et al., 2012a) | n.a. | Parkinson's disease | PKD vs. HC | 873 | 1 |
| Pan | 2012 (Pan,, 2012b) | P < 0.001 | BV‐Fronto temporal dementia | BV‐FTD vs. HC | 534 | 1 |
| Radua | 2010 (Radua et al. 2010a) | P < 0.001 | Anxiety disorders | OCD vs. HC | 836 | 4 |
| OAD vs. HC | 483 | 3 | ||||
| OCD vs. OAD | 1376 | 3 | ||||
| Richlan | 2012 (Richlan et al., 2012) | P < 0.005 | Dyslexia | DYL vs. HC | 266 | 5 |
| Schroeter | 2009 (Schroeter et al., 2009) | P < 0.0001 | Alzheimer's disease | AD vs. HC | 421 | 6 |
| Via | 2011 (Via et al., 2011) | P < 0.001 | Autism Spectrum Disorder | ASD vs. HC | 967 | 5 |
| AUT vs. ASP | 905 | 0 | ||||
| CHI ASD vs. ADU ASD | 967 | 1 | ||||
| Zheng | 2012 (Zheng et al., 2012) | P < 0.05 (FDR) | Focal dystonia | DYT vs. HC | 446 | 5 |
| Yu | 2010 (Yu et al., 2010) | P < 0.05 (FDR) | Bipolar disorder and schizophrenia | BD vs. SCZ | 2617 | 23 |
| Ferreira | 2011 (Ferreira et al., 2011) | P < 0.01 (FDR) | Mild cognitive impairment | MCI conv vs. MCI st | 479 | 1 |
| Yu | 2011 (Yu et al., 2011) | P < 0.05 (FDR) | Autism spectrum disorder | AUT vs. HC | 343 | 24 |
| ASP vs. HC | 374 | 13 | ||||
| Frodl | 2012 (Frodl and Skokauskas 2012) | P < 0.001 | ADHD | CHI ADHD vs. HC | 348 | 2 |
| ADU ADHD vs. HC | 260 | 2 | ||||
| Rotge | 2010 (Rotge et al., 2010) | P < 0.05 (FDR) | OCD | CHI OCD vs. HC | 149 | 16 |
| ADU OCD vs. HC | 512 | 13 |
AD = Alzheimer's disease; ADHD = attention deficit‐hyperactivity disorder; ADU = adults; ALS = amyotrophic lateral sclerosis; ASP = Asperger disorder; ASP = autism spectrum disorders; AUT = autism; AVHs = auditory verbal hallucinations; BD = bipolar disorder; BV‐FTD = behavioral variant fronto‐temporal dementia; C = currently; CHI = children; CHR = chronic; CO ANX = comorbid anxiety; conv = converters; DEP = depressive disorder; DYL = dyslexia; DYT = dystonia; FDR = false discovery rate; FE = first episode; FEP = first episode psychosis; HC = healthy controls; HR = high risk; LTLE = left temporal lobe epilepsy; MCI = mild cognitive impairment; n.a. = non available; OAD = other anxiety disorders; OCD = obsessive‐compulsive disorder; PD = panic disorder; PKD = Parkinson's disease; RTLE = right temporal lobe epilepsy; SCZ = schizophrenia; SD = semantic dementia; st = stable.
Table 2.
Number of participants and reported foci in the VBM studies (a) and meta‐analyses (b) included in the present study
| Number of participants | Number of foci | |||||||||
|---|---|---|---|---|---|---|---|---|---|---|
| Min | Q1 | Median | Q3 | Max | Min | Q1 | Median | Q3 | Max | |
| (a) All studies | 12 | 33 | 47 | 72 | 545 | 0 | 2 | 6 | 11 | 105 |
| Studies of psychiatric disorders | 12 | 34 | 52 | 79 | 425 | 0 | 2 | 5 | 10 | 58 |
| Studies of neurological disorders | 13 | 30 | 41 | 66 | 545 | 0 | 3 | 7 | 13 | 105 |
| Studies of non‐affective psychosis | 12 | 37 | 62 | 87 | 425 | 0 | 2 | 6 | 12 | 38 |
| Studies of dementia | 13 | 29 | 40 | 63 | 545 | 0 | 3 | 7 | 12 | 105 |
| Studies of neurological diseases other than dementia | 16 | 31 | 41 | 66 | 134 | 0 | 2 | 7 | 14 | 48 |
| Studies of anxiety disorders | 20 | 34 | 39 | 51 | 144 | 0 | 1 | 3 | 7 | 19 |
| Studies of autism | 20 | 30 | 33 | 65 | 188 | 0 | 1 | 5 | 9 | 58 |
| Studies of bipolar disorder | 26 | 48 | 68 | 84 | 132 | 0 | 2 | 6 | 17 | 33 |
| Studies of depressive disorders | 27 | 36 | 60 | 90 | 328 | 0 | 2 | 6 | 11 | 24 |
| Studies of ADHD | 24 | 31 | 40 | 57 | 128 | 0 | 0 | 4 | 8 | 17 |
| Studies published up to 2008 | 12 | 30 | 42 | 72 | 425 | 0 | 3 | 7 | 11 | 105 |
| Studies published after 2008 | 13 | 37 | 52 | 72 | 545 | 0 | 2 | 5 | 11 | 48 |
| Studies with up to six authors | 12 | 30 | 43 | 69 | 545 | 0 | 3 | 7 | 12 | 33 |
| Studies with more than six authors | 13 | 33 | 51 | 74 | 425 | 0 | 2 | 5 | 10 | 105 |
| Studies with less than 32 patients | 12 | 22 | 26 | 29 | 31 | 0 | 2 | 4 | 9 | 58 |
| Studies with at least 32 patients | 32 | 41 | 60 | 84 | 545 | 0 | 2 | 6 | 13 | 105 |
| Studies with up to 80 patients | 12 | 30 | 40 | 59 | 80 | 0 | 2 | 5 | 10 | 58 |
| Studies with magnets up to 1.5T | 12 | 34 | 52 | 78 | 545 | 0 | 2 | 6 | 10 | 105 |
| Studies with magnets stronger than 1.5T | 16 | 29 | 38 | 59 | 221 | 0 | 2 | 6 | 13 | 58 |
| Studies with slices of 1.5 mm or more | 13 | 35 | 57 | 77 | 425 | 0 | 2 | 6 | 10 | 105 |
| Studies with slices inferior to 1.5 mm | 12 | 30 | 40 | 70 | 545 | 0 | 2 | 6 | 13 | 58 |
| Studies employing SPM in pre‐processing | 12 | 32 | 45 | 72 | 545 | 0 | 2 | 6 | 12 | 105 |
| Studies not employing SPM in pre‐processing | 24 | 41 | 63 | 87 | 317 | 0 | 2 | 7 | 10 | 27 |
| Studies with 8 mm smoothing or less | 15 | 33 | 48 | 72 | 425 | 0 | 2 | 5 | 12 | 58 |
| Studies with more than 8 mm smoothing | 12 | 30 | 45 | 75 | 545 | 0 | 2 | 6 | 11 | 105 |
| Studies employing SPM in statistics | 12 | 32 | 45 | 72 | 545 | 0 | 2 | 6 | 12 | 105 |
| Studies not employing SPM in statistics | 24 | 37 | 61 | 83 | 317 | 0 | 2 | 7 | 10 | 27 |
| Studies thresholding at P < 0.001 uncorrected | 15 | 30 | 39 | 56 | 425 | 0 | 4 | 7 | 14 | 48 |
| Studies thresholding at P < 0.05 corrected | 12 | 33 | 49 | 72 | 382 | 0 | 2 | 5 | 10 | 105 |
| Studies thresholding at P < 0.05 FDR‐corrected | 16 | 36 | 50 | 64 | 188 | 0 | 2 | 6 | 12 | 58 |
| Studies thresholding at P < 0.05 FWE‐corrected | 13 | 36 | 59 | 90 | 382 | 0 | 2 | 4 | 8 | 105 |
| Studies not employing SVC | 12 | 32 | 47 | 71 | 545 | 2 | 6 | 12 | 105 | |
| Studies employing SVC | 20 | 40 | 71 | 123 | 317 | 2 | 3 | 7 | 27 | |
| (b) All meta‐analyses | 149 | 322 | 534 | 1042 | 4087 | 0 | 2 | 3 | 5 | 24 |
| Meta‐analyses with less than 10 studies | 149 | 259 | 343 | 446 | 952 | 0 | 2 | 5 | 7 | 24 |
| Meta‐analyses with at least 10 studies | 483 | 873 | 1247 | 1652 | 4087 | 0 | 1 | 3 | 4 | 23 |
Association Between Sample Size and Number of Foci in Individual VBM Studies
As shown in Table 3 and Figure 4, studies with larger sample sizes were found to report more abnormalities, but the slope was very small (2% increase in the number of foci per each 10‐patient increase in sample‐size, P < 0.001), thus indicating potential reporting biases affecting the smaller studies more than the larger studies. Results were similar when using Pearson and Spearman correlations, when discarding statistically influential studies, or when combining Pearson correlations separately estimated per each published meta‐analysis (simple Pearson r = 0.148, P = 0.004; Spearman rho = 0.139, P = 0.006; Pearson r without the most influential study = 0.176, P < 0.001; meta‐analytically combined Pearson r = 0.110, P = 0.010). The binomial part of the zero‐inflated Poisson regression was not found to be influenced by the sample size.
Table 3.
Relationship between sample size and number of reported foci in subgroups defined by different moderator factors: (a) analyses at the level of single studies and (b) analyses at the level of VBM meta‐analyses
| Zero‐inflated Poisson regression | Meta‐analytic Poisson regressiona | Pearson correlation | Spearman correlation | Meta‐analytic correlationa | |||||||
|---|---|---|---|---|---|---|---|---|---|---|---|
| Number of studies | Estimateb | P‐valuec | Estimateb | P valuec | R | P valuec | Rho | P valuec | R | P valuec | |
| (a) All studies | 324 | 1.935% | <0.001 | 2.121% | <0.001 | 0.148 | 0.004 | 0.139 | 0.006 | 0.110 | 0.005 |
| Studies of psychiatric disorders | 215 | 2.420% | <0.001 | 2.165% | <0.001 | 0.205 | 0.001 | 0.115 | 0.047 | 0.107 | 0.012 |
| Studies of neurological disorders | 109 | 1.458% | <0.001 | 1.888% | <0.001 | 0.111 | 0.126 | 0.246 | 0.005 | 0.126 | 0.113 |
| Studies of non‐affective psychosis | 98 | 3.154% | <0.001 | 3.319% | <0.001 | 0.405 | <0.001 | 0.284 | 0.002 | 0.339 | <0.001 |
| Studies of dementia | 58 | 1.076% | 0.004 | 1.749% | <0.001 | 0.089 | 0.253 | 0.305 | 0.010 | 0.122 | 0.174 |
| Studies of neurological diseases other than dementia | 51 | 8.341% | <0.001 | 4.191% | 0.025 | 0.227 | 0.054 | 0.194 | 0.087 | 0.133 | 0.223 |
| Studies of anxiety disorders | 29 | 7.376% | <0.001 | 7.220% | <0.001 | 0.244 | 0.101 | 0.227 | 0.118 | 0.330 | 0.003 |
| Studies of autism | 27 | −9.535% | 0.994 | −11.034% | >0.999 | −0.159 | 0.785 | −0.061 | 0.620 | −0.187 | 0.928 |
| Studies of bipolar disorder | 24 | −8.088% | 0.999 | −10.036% | >0.999 | −0.276 | 0.904 | −0.274 | 0.902 | −0.305 | 0.987 |
| Studies of depressive disorders | 23 | −2.563% | 0.987 | −1.634% | >0.999 | −0.109 | 0.690 | −0.127 | 0.718 | −0.151 | 0.918 |
| Studies of ADHD | 14 | 1.975% | 0.413 | −17.923% | >0.999 | −0.382 | 0.911 | −0.408 | 0.926 | −0.408 | 0.949 |
| Studies published up to 2008 | 202 | 2.939% | <0.001 | 0.217 | 0.001 | 0.179 | 0.005 | ||||
| Studies published after 2008 | 122 | 0.225% | 0.313 | 0.041 | 0.326 | 0.144 | 0.056 | ||||
| Studies up to six authors | 108 | 0.615% | 0.089 | 0.066 | 0.249 | 0.085 | 0.191 | ||||
| Studies with more than six authors | 214 | 2.592% | <0.001 | 0.175 | 0.005 | 0.161 | 0.009 | ||||
| Studies with less than 32 patients | 75 | 52.494% | <0.001 | 0.222 | 0.028 | 0.282 | 0.007 | ||||
| Studies with at least 32 patients | 249 | 1.749% | <0.001 | 0.146 | 0.011 | 0.113 | 0.037 | ||||
| Studies with up to 80 patients | 257 | 5.103% | <0.001 | 0.078 | 0.106 | 0.110 | 0.039 | ||||
| Studies with magnets up to 1.5T | 257 | 2.038% | <0.001 | 0.158 | 0.005 | 0.114 | 0.034 | ||||
| Studies with magnets stronger than 1.5T | 60 | 1.266% | 0.103 | 0.112 | 0.197 | 0.233 | 0.037 | ||||
| Studies with slices of 1.5 mm or more | 161 | 2.935% | <0.001 | 0.207 | 0.004 | 0.175 | 0.013 | ||||
| Studies with slices inferior to 1.5 mm | 151 | 0.850% | 0.010 | 0.074 | 0.183 | 0.083 | 0.156 | ||||
| Studies employing SPM in pre‐processing | 282 | 1.639% | <0.001 | 0.131 | 0.014 | 0.151 | 0.006 | ||||
| Studies not employing SPM in pre‐processing | 29 | 4.943% | <0.001 | 0.510 | 0.002 | 0.255 | 0.091 | ||||
| Studies with 8 mm smoothing or less | 147 | 1.746% | <0.001 | 0.102 | 0.110 | 0.055 | 0.256 | ||||
| Studies with more than 8 mm smoothing | 152 | 1.865% | <0.001 | 0.161 | 0.024 | 0.189 | 0.010 | ||||
| Studies employing SPM in statistics | 281 | 1.622% | <0.001 | 0.130 | 0.015 | 0.150 | 0.006 | ||||
| Studies not employing SPM in statistics | 30 | 5.142% | <0.001 | 0.529 | 0.001 | 0.283 | 0.065 | ||||
| Studies thresholding at P < 0.001 uncorrected | 67 | 1.270% | 0.017 | 0.129 | 0.149 | 0.242 | 0.024 | ||||
| Studies thresholding at P < 0.05 corrected | 182 | 2.464% | <0.001 | 0.150 | 0.022 | 0.078 | 0.147 | ||||
| Studies thresholding at P < 0.05 FDR‐corrected | 60 | −2.760% | 0.923 | −0.135 | 0.847 | −0.115 | 0.808 | ||||
| Studies thresholding at P < 0.05 FWE‐corrected | 49 | 2.253% | <0.001 | 0.204 | 0.080 | 0.382 | 0.003 | ||||
| Studies not employing SVC | 296 | 1.877% | <0.001 | 0.145 | 0.072 | 0.165 | 0.002 | ||||
| Studies employing SVC | 26 | 5.693% | <0.001 | 0.479 | 0.007 | −0.130 | 0.263 | ||||
| Poisson regression | Pearson correlation | Spearman correlation | |||||
|---|---|---|---|---|---|---|---|
| Number of studies | Estimateb | P valuec | R | P valuec | Rho | P valuec | |
| (b) All meta‐analyses | 47 | 0.0148% | 0.423 | 0.012 | 0.469 | −0.065 | 0.668 |
| Meta‐analyses with <10 studies | 25 | −0.1653% | 0.641 | −0.031 | 0.558 | 0.149 | 0.238 |
| Meta‐analyses with 10 studies or more | 22 | 0.3498% | <0.001 | 0.348 | 0.056 | 0.330 | 0.067 |
Meta‐analytical combination of the Poisson regressions or the (Fisher‐transformed) correlations separately estimated per each published meta‐analysis.
Increase in the number of reported foci per each increase of 10 patients.
P values were obtained from one‐tailed tests.
Figure 4.

Relationship between sample size and identified number of foci with abnormalities.
Effect of Moderators
No major differences according to the field (psychiatry or neurology, Supporting Information Fig. 1S) and clinical conditions (Supporting Information Fig. 2S) were observed. With respect to methodological moderators the only subgroup where the regression between sample size and number of reported foci was relatively stronger was the set of studies with less than 32 patients (52% increase in the number of foci per each 10‐patient increase in sample‐size, P < 0.001). The regression slope was nominally significant but small in studies with at least 32 patients (2% increase in the number of foci per each 10‐patient increase in sample‐size, P < 0.001), with differences in regression slope between these two subgroups being statistically significant (P < 0.001). The regression slope was small but still nominally significant in studies published up to 2008, in studies with more than six authors (Fig. 5), and in studies thresholding at P < 0.05 FWE‐corrected for multiple comparisons (Fig. 6) (2–3% increase in the number of foci per each 10‐patient increase in sample‐size, P < 0.001). Conversely, it was null in studies published after 2008, in studies with up to six authors, and in studies thresholding at P < 0.05 FDR‐corrected for multiple comparisons (<1% increase in the number of foci per each 10‐patient increase in sample‐size, P > 0.05), with differences in regression slope between these pairs of subgroups being statistically significant (P ≤ 0.005 in all cases).
Figure 5.

Relationship between number of authors and number of identified foci.
Figure 6.
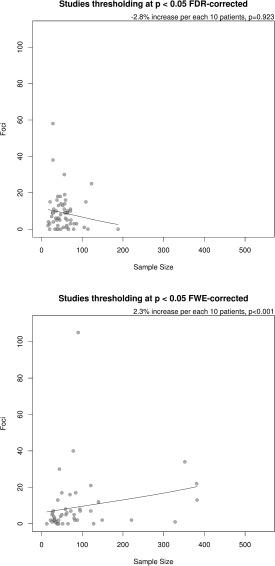
Relationship between sample size and number of identified foci in studies using FDR correction for multiple comparisons and those using FWE correction for multiple comparisons. Difference in regression slope P = 0.005.
There were no significant differences in the other methodological subgroups (up to 80 patients, studies with magnets up to 1.5T, studies with magnets stronger than 1.5T, MRI slices of 1.5 mm or more, MRI slices inferior to 1.5 mm, SPM used for pre‐processing, other software used for pre‐processing, FWHM of 8 mm or less, FWHM superior to 8 mm, SPM used for statistics, other software used for statistics, no correction for multiple comparisons, use of SVC, and no use of SVC). Similarly, exclusion of foci detected with SVC from the main analysis did not change the main results (2% increase in the number of foci per each 10‐patient increase in sample‐size, P < 0.001; Pearson r = 0.138, P = 0.007; Spearman rho = 0.113, P = 0.023; Pearson r without the most influential study = 0.166, P = 0.002).
Association Between Sample Size and Number of Foci in VBM Meta‐Analyses
The regression was not nominally significant when meta‐analyses, rather than individual studies, were analyzed as a whole group. However, this was only true for those meta‐analyses which include less than 10 studies (−0.17% increase in the number of foci per each 10‐patient increase in sample‐size, P = 0.641), while the regression achieved statistical significance for those meta‐analyses including 10 studies or more (0.35% increase in the number of foci per each 10‐patient increase in sample‐size, P < 0.001, Fig. 7). As shown in Figure 7, there were many meta‐analyses with fewer than 10 studies and total sample size <1,000 that reported a substantial number of loci, e.g., six of them reported at least 10 loci, while this occurred in only one meta‐analysis with 10 or more studies. The median number of loci was three in meta‐analyses with at least 10 studies and five in meta‐analyses with fewer than 10 studies.
Figure 7.

Relationship between sample size and number of identified foci in all meta‐analyses (above), meta‐analyses with at least 10 studies (bottom left) and meta‐analyses with less than 10 studies (bottom right).
Number of Reported Foci in Meta‐analyses Versus Single Studies Contained in Each Meta‐Analysis
The number of foci reported in the meta‐analyses was significantly smaller than the number of foci reported in the respective studies contained in each meta‐analysis (P < 0.001 with paired test). This difference was also significant when only meta‐analyses with 10 or more studies were considered (P < 0.001 with paired test), while it lost the significance for meta‐analyses with fewer than 10 studies (P = 0.111 with paired test).
DISCUSSION
This study explored the potential confounding role of biases in VBM studies by assessing whether the number of reported brain abnormalities was positively related to the sample size of the studies, as it would be statistically expected given that studies with larger sample sizes have more power to detect abnormalities. Overall, we found a weak correlation between sample size and number of reported loci, corresponding to an increase of only 2% per 10 additional patients. This is far less than what would be expected based on power considerations. Thus, it suggests that reporting biases may be inflating the number of discovered reported loci in small studies. Evaluation of a large number of moderator variables suggested similar findings in a wide array of study, disease, technical and other characteristics, although there were hints that the statistical threshold employed and publication year had a modulating effect. Finally, we found that for whole‐brain voxel‐based meta‐analyses including less than 10 studies, there was no association between sample size and number of loci, which is again suggestive of potential reporting biases. This pattern was not seen in meta‐analyses with more than 10 studies, which generally reported few loci (median = 3). The number of loci reported in meta‐analyses, especially large ones, was significantly smaller than the number of loci reported in single studies, also corroborating that the literature of single studies may often present inflated numbers of discoveries.
Overall, the strength of the evidence that we found for reporting biases in VBM studies may be weaker than previous findings in non‐VBM (i.e., ROI) structural neuroimaging studies, where an excess significance bias was more clearly detected [Ioannidis, 2011]. However, the ROI assessment evaluated the number of observed versus expected significant results in each study and in multiple studies, while this was not possible to do for VBM studies given the nature of the data. Second, automated methods such as VBM tend to be less biased by the researcher's influence; in contrast, a researcher could perform several exploratory ROI analyses and report results for only those ROIs that yielded significant results [Ioannidis, 2011; Radua and Mataix‐Cols, 2012]. Third, the manual tracing of ROIs, as compared with VBM methods, can introduce significant heterogeneity in the anatomical definition of the brain areas investigated across studies and thus affect the significance of the results reported, hampering publication biases. Fourth, we found that the median sample size of the individual VBM studies retrieved was of 47, which is larger than the typical sample size of previously analyzed ROI studies [Ioannidis, 2011]. Some authors have even proposed optimal sample sizes for individual VBM studies of 16–32 subjects per group [Friston, 2012], suggesting that between‐subjects comparison studies of n < 32 are too small even by liberal estimates. Still the fact that the number of loci reported in single VBM studies is smaller than what eventually gets validated in large meta‐analyses suggests that reporting or other biases may sometimes be substantial in some VBM studies.
We explored several potential factors that may be influencing and modulating reporting biases in VBM literature such as publication year, type of condition investigated, statistical threshold employed and other methodological characteristics of the analysis method. A similar pattern of weak or null correlations was seen in several analyses according to different moderator variables although we found some hints that statistical threshold employed and publication year had some modulating effect. There was no difference in the relationship between identified foci and sample size according to type of clinical conditions. Similarly, no differences in the relationship between number of foci and sample size were detected when VBM psychiatric literature was compared with the VBM neurological literature. Factors other than publication biases may account for the lack of clinical applications of psychiatric neuroimaging (e.g., heterogeneity of psychiatric diagnoses or differences in the psychopathological characteristics across samples) [Borgwardt et al., 2012]. Sample size, magnet field, slices thickness, type of analysis package, type of smoothing kernel, use of SVC did not affect the results.
Conversely, the foci‐sample relationship was positive and statistically significant in studies employing an FWE correction, negative and non‐significant in studies applying an FDR correction, even if the increase of foci related to sample size should be higher in studies applying such correction (Fig. 1). Furthermore, there was a statistically significant difference between subgroups. The reasons for the existence of potential bias in studies using an FDR are again speculative. It should be noted that sample size range appeared to be smaller for VBM studies which employed FDR correction compared with those which employed FWE correction (see Fig. 6); it is therefore possible that the absence of a significant relationship for studies which used FDR but not for those which used few correction could simply be explained by differences in power. Alternatively, the absence of a relationship between sample size and foci in studies applying an FDR correction could be related to some mis‐use of FDR in neuroimaging [Chumbley and Friston, 2009].
In addition, found an effect of the number of authors, with significant correlation between sample size and number of foci for VBM studies with more than six authors and no correlation for studies with up to six authors (statistically significant between‐subgroups differences, Fig. 5). Strikingly, we replicated the similar relationship previously reported by Sayo et al. (2011), who found that studies with less coauthors reported larger ventricular‐brain ratio abnormalities in patients with schizophrenia. They suggested that larger research groups may be more conservative or exacting in their research methodology. Similarly, we also found a differential effect for publication year, with significant correlation between sample size and number of foci for VBM studies published up to 2008 and no correlation for studies published after 2008 (statistically significant between‐subgroups differences). The reasons for this observation are highly speculative and it could be a chance finding, given the number of modulator variables assessed. It could be, for instance, that as far as the structural abnormalities in many disorders have been more or less established in previous studies, only studies finding such abnormalities are published. Alternatively, newer studies use advanced VBM algorithms (i.e., DARTEL [Ashburner, 2007b], introduced shortly before 2008) [Ashburner, 2007a] which could enable them to detect most of the abnormalities with even relatively small sample sizes. However, this seems unlikely to be the case given that the number of foci reported in these studies is indeed lower than in older studies (9–74% decrease depending on the sample size). The causes for this observation are highly speculative. On the one hand, in recent years investigators may have conservatively thresholded the analyses when the results appeared in brain regions that were unexpected based on the results of previous studies. On the other hand, some of the new VBM algorithms that have been introduced based on theoretical grounds lack formal empirical validations and may have had a detrimental impact on the sensitivity of the analyses. A third possibility is that these new VBM algorithms have resulted in fewer false‐positives compared to standard VBM, for instance by improving the spatial registration of the images or minimizing the impact of non‐normality [Salmond et al., 2002; Viviani et al., 2007]. Because the causes for the lower number of significant foci after 2008 are speculative, the implications of this observation for the minimal appropriate N per group are also unclear.
Finally, we tested the sample size/number of foci correlation hypothesis at meta‐analytical level (Fig. 7). We found that the relationship was absent when meta‐analyses with less than 10 studies were included in a Poisson regression. Small meta‐analyses report more foci than larger ones. This finding may be useful to guide editors, reviewers and authors to improve the reliability of voxel‐based meta‐analyses by either setting the bar for the number of required studies included in meta‐analyses at k ≥ 10 or ensuring that high‐quality null findings in meta‐analyses of conditions with k < 10 available published singleton studies are available after systemic literature review, and ideally, also access to registries of data, since it is notoriously difficult to unearth unpublished unregistered data. The fact that meta‐analyses with many studies validate few foci (median = 3) is also suggestive that the larger numbers of foci reported in small studies and small meta‐analyses may be inflated by several false‐positives.
Some caveats should be discussed about our study. First, we cannot rule out the possibility that in some cases large studies and even large meta‐analyses may suffer from reporting and/or other biases that inflate the number of discovered loci. Conversely, some small studies may be more meticulous and thus optimize the yield of discoveries, despite their limited sample size. However, it is unlikely that there would be a systematic error in favor of small studies being better than larger studies in this regard. Our analysis focuses on the large picture including many hundreds of studies. Second, the total number of genuine loci to be discovered in each disease and condition is unknown and power calculations require making assumptions about how many of such abnormalities would be detected. Most likely, the number and magnitude of abnormalities differs substantially across different diseases and conditions. Thus, again, our approach offers an aggregate view of the big picture and inferences may not be possible to extrapolate to each of the topics that we analyzed. Even if reporting biases are present in the field‐at‐large, this does not mean that all sub‐fields and each topic are equally affected. Third, there is preliminary evidence that VBM studies with a smaller sample size may be more susceptible to false positive rates than those with a larger sample size; this is due to the impact of non‐normality of the data [Salmond et al., 2002; Viviani et al., 2007] which is critically dependent on sample size [Scarpazza et al., in press]. Thus we cannot exclude the possibility that our results reflect differences in false positive rates as a function of sample size rather than reporting biases.
CONCLUSIONS
Acknowledging these caveats our analysis offers some evidence about the relationship between sample size and number of discovered loci that can be used in designing the future research agenda for VBM studies and in interpreting the results of single studies and meta‐analyses thereof in this discipline.
Supporting information
Supplementary Information
REFERENCES
- Ashburner J (2007a): A fast diffemorphic image registration algorithm. Neuroimage 38:95–113. [DOI] [PubMed] [Google Scholar]
- Ashburner J (2007b): A fast diffeomorphic image registration algorithm. Neuroimage 38:95–113. [DOI] [PubMed] [Google Scholar]
- Ashburner J, Friston KJ (2000): Voxel‐based morphometry‐the methods. Neuroimage 11:805–821. [DOI] [PubMed] [Google Scholar]
- Belsley DA, Kuh K, Welsch RE (1980): Regression diagnostics: Identifying influential data and sources of collinearity. New York: John Wiley & Sons. [Google Scholar]
- Borgwardt S, Fusar‐Poli P (2012): Third‐generation neuroimaging in early schizophrenia: Translating research evidence into clinical utility. Br J Psychiatry 200:270–272. [DOI] [PubMed] [Google Scholar]
- Borgwardt S, Radua J, Mechelli A, Fusar‐Poli P (2012): Why are psychiatric imaging methods clinically unreliable? Conclusions and practical guidelines for authors, editors and reviewers. Behav Brain Funct 8:46. [DOI] [PMC free article] [PubMed] [Google Scholar]
- Chumbley JR, Friston KJ (2009): False discovery rate revisited: FDR and topological inference using Gaussian random fields. Neuroimage 44:62–70. [DOI] [PubMed] [Google Scholar]
- David SP, Ware JJ, Chu IM, Loftus PD, Fusar‐Poli P, Radua J, Munafò MR, Ioannidis JP (2013): Potential reporting bias in FMRI studies of the brain. PLoS One 8:e70104. doi: 10.1371/journal.pone.0070104. [DOI] [PMC free article] [PubMed] [Google Scholar]
- Friston K (2012): Ten ironic rules for non‐statistical reviewers. Neuroimage 61:1300–1310. [DOI] [PubMed] [Google Scholar]
- Ioannidis JP (2011): Excess significance bias in the literature on brain volume abnormalities. Arch Gen Psychiatry 68:773–780. [DOI] [PubMed] [Google Scholar]
- Laird AR, Fox PM, Price CJ, Glahn DC, Uecker AM, Lancaster JL, Turkeltaub PE, Kochunov P, Fox PT (2005): ALE meta‐analysis: Controlling the false discovery rate and performing statistical contrasts. Hum Brain Mapp 25:155–164. [DOI] [PMC free article] [PubMed] [Google Scholar]
- Liberati A, Altman DG, Tetzlaff J, Mulrow C, Gotzsche PC, Ioannidis JP, Clarke M, Devereaux PJ, Kleijnen J, Moher D (2009): The PRISMA statement for reporting systematic reviews and meta‐analyses of studies that evaluate health care interventions: Explanation and elaboration. PLoS Med 6:e1000100. [DOI] [PMC free article] [PubMed] [Google Scholar]
- Peters BD, Szeszko PR, Radua J, Ikuta T, Gruner P, Derosse P, Zhang JP, Giorgio A, Qiu D, Tapert SF, Brauer J, Asato MR, Khong PL, James AC, Gallego JA, Malhotra AK (2012): White matter development in adolescence: Diffusion tensor imaging and meta‐analytic results. Schizophr Bull, Nov 38(6):1308–17. doi: 10.1093/schbul/sbs054. Epub 2012 Apr 12. [DOI] [PMC free article] [PubMed] [Google Scholar]
- R_Development_Core_Team (2011): R: A language and environment for statistical computing. In: Computing RFfS, editor. Vienna: R_Development_Core_Team.
- Radua J, Mataix‐Cols D (2009): Voxel‐wise meta‐analysis of grey matter changes in obsessive‐compulsive disorder. Br J Psychiatry 195:393–402. [DOI] [PubMed] [Google Scholar]
- Radua J, Mataix‐Cols D (2012): Meta‐analytic methods for neuroimaging data explained. Biol Mood Anxiety Disord 2:6. [DOI] [PMC free article] [PubMed] [Google Scholar]
- Radua J, van den Heuvel OA, Surguladze S, Mataix‐Cols D (2010a): Meta‐analytical comparison of voxel‐based morphometry studies in obsessive‐compulsive disorder vs other anxiety disorders. Arch Gen Psychiatry 67:701–711. [DOI] [PubMed] [Google Scholar]
- Radua J, Via E, Catani M, Mataix‐Cols D (2010b): Voxel‐based meta‐analysis of regional white matter volume differences in Autism Spectrum Disorder vs. healthy controls. Psychol Med 41:1539–1550. [DOI] [PubMed] [Google Scholar]
- Radua J, Mataix‐Cols D, Phillips ML, El‐Hage W, Kronhaus DM, Cardoner N, Surguladze S (2012a): A new meta‐analytic method for neuroimaging studies that combines reported peak coordinates and statistical parametric maps. Eur Psychiatry 27:605–611. [DOI] [PubMed] [Google Scholar]
- Radua J, Borgwardt S, Crescini A, Mataix‐Cols D, Meyer‐Lindenberg A, McGuire PK, Fusar‐Poli P (2012b): Multimodal meta‐analysis of structural and functional brain changes in first episode psychosis and the effects of antipsychotic medication. Neurosci Biobehav Rev 36:2325–2333. [DOI] [PubMed] [Google Scholar]
- Radua J, Canales‐Rodriguez EJ, Pomarol‐Clotet E, Salvador R (2013): Validity of modulation and optimal settings for advanced voxel‐based morphometry. Neuroimage, in Press. doi: 10.1016/j.neuroimage.2013.07.084. [DOI] [PubMed] [Google Scholar]
- Rothstein HR, Sutton A, Borenstein M (2005): Publication Bias in Meta‐Analysis: Prevention, Assessment and Adjustment. Chichester, UK: Wiley. [Google Scholar]
- Salmond CH, Ashburner J, Vargha‐Khadem F, Connelly A, Gadian DG, Friston KJ (2002): Distributional assumptions in voxel‐based morphometry. Neuroimage 17:1027–1030. [PubMed] [Google Scholar]
- Sayo A, Jennings RG, Van Horn JD (2011): Study factors influencing ventricular enlargement in schizophrenia: A 20 year follow‐up meta‐analysis. Neuroimage 59:154–167. [DOI] [PMC free article] [PubMed] [Google Scholar]
- Scarpazza C, Sartori G, De Simone M, Mechelli A: When the single matters more than the group: Very high false positive rates in single case voxel based morphometry. Neuroimage, 2013 Apr 15;70:175–88. doi: 10.1016/j.neuroimage.2012.12.045. Epub 2013 Jan 2. [DOI] [PubMed] [Google Scholar]
- Simon Jackman (2012). pscl: Classes and Methods for R Developed in the Political Science Computational Laboratory, Stanford University. Department of Political Science, Stanford University. Stanford, California. R package version 1.04.4. http://pscl.stanford.edu/.
- Viviani R, Beschoner P, Ehrhard K, Schmitz B, Thone J (2007): Non‐normality and transformations of random fields, with an application to voxel‐based morphometry. Neuroimage 35:121–130. [DOI] [PubMed] [Google Scholar]
- Zeleis A, Kleiber C, Jackman S (2008): Regression models for count data in R. J Stat Software 27. [Google Scholar]
Associated Data
This section collects any data citations, data availability statements, or supplementary materials included in this article.
Supplementary Materials
Supplementary Information