

Abstract
Brain imaging studies suggest that cortical thickness decreases during childhood and adolescence, in concert with underlying structural and synaptic changes required for cognitive maturation and regional specialization of function. Abnormalities of this protracted developmental process may provide key insights into the cognitive and behavioral deficits that emerge in individuals with fetal alcohol spectrum disorders (FASD). Several studies have demonstrated cortical thickness differences in children and adolescents who were prenatally exposed to alcohol, though all have been cross sectional, limiting conclusions about cortical development with age. In this study, we analyze serially collected T 1‐weighted MRI from 11 children with FASD and 21 controls, scanned twice each ∼2 to 4 years apart. Mixed‐models analysis of cortical thickness measurements revealed age‐by‐group interactions in cortical thinning, with FASD participants undergoing less developmental thinning than controls across many regions of the cortex, particularly in medial frontal and parietal areas. These results provide further longitudinal evidence in humans that prenatal alcohol exposure is associated with altered patterns of brain development that persist during childhood and adolescence. Hum Brain Mapp 35:4892–4903, 2014. © 2014 Wiley Periodicals, Inc.
Keywords: cortical thickness, brain development, fetal alcohol spectrum disorder, FASD, prenatal alcohol exposure, adolescence, longitudinal MRI
INTRODUCTION
Cortical brain maturation is a dynamic process, marked by widespread progressive and regressive change during the course of human development. This process begins prenatally with massive proliferation and migration of neurons countered by ensuing waves of apoptosis, continues both pre‐ and post‐natally with the projection of axons and establishment of new synapses, and culminates in adolescence and thereafter with the subsequent pruning of these synaptic connections to refine neural networks. Cortical thickness, defined as the distance between the pial‐cortical and gray matter‐white matter borders on MRI scans, is a widely studied in vivo measure of cortical morphology reported to undergo an inverted U‐shaped trajectory in childhood, and is presumed to follow in concert with these critical cellular transitions [Raznahan et al., 2011]. Longitudinal studies of healthy development suggest that cortical thinning accelerates during adolescence [Shaw et al., 2008] and correlates with cognitive performance [Shaw et al., 2006a; Sowell et al., 2004], which may reflect regional specialization of cognition during development. Although genetic influence on cortical development has been demonstrated [Raznahan et al., 2012; van Soelen et al., 2012], less is known about the extent to which this pattern of adolescent cortical maturation may be disrupted by specific environmental teratogens, such as prenatal alcohol exposure.
Prenatal alcohol exposure damages the developing fetal brain via numerous mechanisms, including neuronal proliferation and migration errors, transcription factor downregulation, hypoxia, and cell death [Goodlett et al., 2005], which can result in a range of physical, cognitive, and behavioral deficits known as fetal alcohol spectrum disorders (FASD). With an estimated prevalence of 1 in 100, FASD is the leading cause of preventable developmental disability in North America [May and Gossage, 2001; May et al., 2009]. In addition to primary deficits such as impaired learning, memory and executive functioning, individuals with FASD have high rates of secondary deficits (trouble with the law, substance abuse, etc.) [Streissguth et al., 2004], which have detrimental consequences for individuals, families, and society. Longitudinal studies of white matter development [Treit et al., 2013] and cortical volume [Lebel et al., 2012] in children with prenatal alcohol exposure have revealed altered trajectories of maturation during adolescence, further suggesting that key postnatal developmental processes may also be disrupted in alcohol‐exposed children.
Four published cross‐sectional studies have investigated cortical thickness in children with prenatal alcohol exposure, with three finding increased cortical thickness [Fernandez‐Jaen et al., 2011; Sowell et al., 2008; Yang et al., 2012] and one finding reduced cortical thickness [Zhou et al., 2011] relative to typically developing controls. One of these studies found both increased thickness and positive correlations with cognitive scores in the FASD group (whereby thinner cortex related to poorer performance on verbal recall and memory scores) [Sowell et al., 2008], further complicating interpretation of these contrasting results. Moreover, the influence of other postnatal developmental processes (e.g., synaptic pruning, myelination) on the evolution of these observations must be considered, and may partially explain conflicting observations between these cross‐sectional studies.
The purpose of this study is to elucidate the developmental trajectory of cortical thinning in children and adolescents with FASD in order to further characterize patterns of brain development during this critical period.
MATERIALS AND METHODS
Participants
Eleven children with FASD (four females and seven males, scanned at ages ranging from 6.1 to 15.4 years of age) and 21 controls (10 females and 11 males, ranging from 5.7 to 14.4 years) underwent two MRI scans each, 2–4 years apart, for a total of 64 scans (Table 1). Participants with FASD were recruited from a hospital FASD diagnostic clinic, had confirmed prenatal alcohol exposure, and were previously medically diagnosed with an alcohol related disorder falling under the FASD umbrella using the 4‐digit code [Astley, 2004] in accordance with the Canadian Guidelines for diagnosis of FASD [Chudley et al., 2005]. Assessments were conducted by a multidisciplinary team (psychologist, speech language pathologist, occupational therapist, social worker, and pediatrician), who carefully reviewed evidence from standardized testing, clinical interview, medical chart review, physical exam, etc. in order to assess each child in four major domains: growth deficiency, facial dysmorphology, central nervous system dysfunction, and alcohol exposure, with careful consideration of pre‐ and post‐natal factors in the differential diagnosis of an FASD. One subject had a diagnosis of fetal alcohol syndrome (FAS), three had partial FAS, two had static encephalopathy alcohol exposed, four had neurobehavioral disorder alcohol exposed, and one had FASD that was not further specified. Given the small number of subjects, all sub‐diagnoses were collapsed to form one “FASD” group for statistical analysis. Control subjects were screened for psychiatric and neurological impairments, as well as contraindications to MRI. All FASD subjects and 19/21 control subjects were included in our previous longitudinal diffusion tensor imaging (DTI) study [Treit et al., 2013]; though note that fewer subjects are included here due to MPRAGE image quality issues. Nine of 11 FASD subjects had scan one data that was included in both Lebel et al. [2008] and Zhou et al. [2011], two FASD subjects had scan 1 data included in Zhou et al. [2011] but not Lebel et al. [2008], and all control participant scans were from Lebel and Beaulieu's previous study of healthy longitudinal white matter development [Lebel and Beaulieu, 2011]. Written informed consent was obtained from each participant's parent/legal guardian, and written assent was collected from all participants before study procedures. This study was approved by the Health Research Ethics Board at the University of Alberta.
Table 1.
Participant characteristics, demographic information, and cognitive scores
| Participant characteristics | FASD (n = 11) | Control (n = 21) | ||
|---|---|---|---|---|
| Age in years: mean ± SD (range) | Scan 1 | 8.9 ± 1.8 (6.1–11.8) | 8.1 ± 1.3 (5.7–10.7) | |
| Scan 2 | 12.0 ± 2.2 (9.1–15.4) | 11.8 ± 1.6 (7.4–14.4) | ||
| Time between scans in years: mean ± SD (range) | 3.1 ± 0.9 (1.6–3.9) | 3.7 ± 0.7 (1.7–4.2) | ||
| N males: n (%) | 7 (64%) | 11 (52%) | ||
| Cognitive testing | ||||
| Woodcock reading mastery test‐revised (n = 11; 18) | Word ID | Scan 1 | 95 ± 9 | 111 ± 14 |
| Scan 2 | 91 ± 13a | 109 ± 12 | ||
| Working memory test battery for children (n = 10) | Digit | Scan 1 | 90 ± 8a | — |
| Scan 2 | 88 ± 13a | — | ||
| Block | Scan 1 | 83 ± 17a | — | |
| Scan 2 | 85 ± 16a | — | ||
| Woodcock Johnson quantitative concepts (n = 10) | 18A&B | Scan 1 | 90 ± 15 | — |
| Scan 2 | 89 ± 12a | — | ||
| Comprehensive receptive and expressive vocabulary test (n = 11) | Receptive | Scan 1 | 90 ± 7a | — |
| Scan 2 | 94 ± 8a | — | ||
| Expressive | Scan 1 | 85 ± 16a | — | |
| Scan 2 | 85 ± 12a | — | ||
| NEPSY I/II (n = 7) | Arrows | Scan 1 | 8.8 ± 2.4 | — |
| Scan 2 | 10.4 ± 3.3 | — | ||
| Auditory attention | Scan 1 | 5.1 ± 4.1a | — | |
| Scan 2 | 7.7 ± 3.7 | — | ||
| Response set | Scan 1 | 7.0 ± 2.5a | — | |
| Scan 2 | 8.8 ± 4.0 | — | ||
| Memory for names | Scan 1 | 8.6 ± 3.8 | — | |
| Scan 2 | 7.0 ± 3.2a | — | ||
| Wide range intelligence test (n = 7) | Composite IQ | Scan 1 | — | — |
| Scan 2 | 94 ± 13 | — | ||
Significantly different from population norm at P < 0.05.
Cognitive Testing and Demographics
Both the FASD and control participants were administered the Woodcock Reading Mastery‐Revised (WRMT‐R) Word ID at both scans. In addition, the FASD group (but not controls) were also administered the Woodcock Johnson Quantitative Concepts (18A&B), Working Memory Test Battery for Children (WMTB‐c) Digit and Block, Comprehensive Receptive and Expressive Vocabulary Test (CREVT), and NEPSY Arrows, Auditory Attention and Response Set and Memory for Names. IQ was also collected in a subset of FASD participants (n = 7) at scan 2 using the Wide Range Intelligence Test [WRIT, Glutting et al., 2000]. One sample t‐tests were used to determine if standard score were different from population norms (test‐value of 100 for all tests except NEPSY; test value 10). Demographic data were collected via questionnaire completed by parents/caregivers at scan two for the FASD participants, and retrospectively by phone interview for controls (though note only 14 of 21 controls were reached).
Image Acquisition
All data at both time‐points were acquired using identical methods on the same 1.5 T Siemens Sonata MRI scanner. Scans included DTI, T 1‐weighted, T 2‐weighted, fluid‐attenuated inversion recovery (FLAIR), and FLAIR‐DTI imaging for a total scan time of ∼26 min. Head motion was minimized using ear pads. T 1‐weighted images for cortical thickness measurements were acquired using a high resolution (1 × 1 × 1 mm3) MPRAGE sequence with: repetition time = 1,870 ms, echo time = 4.38 ms, inversion time = 1,100 ms, field of view 220 × 220 mm2, flip angle 15°, scan time 4:29 min.
Image Processing and Statistics
Images were manually quality checked for gross abnormalities or image artifacts and then processed using the CIVET 1.1.11 pipeline with normalization to the ICBM‐152 template to obtain cortical thickness, total brain volume, white matter, and gray matter volumes for each scan. Cortical thickness was measured across 40,962 vertices per hemisphere, and smoothed using a kernel of 20‐mm full‐width at half maximum that preserves cortical topology. Cortical surface data were then segmented to 39 areas per hemisphere with an automated anatomical labeling (AAL) template [Tzourio‐Mazoyer et al., 2002], averaging all vertices within each region. AAL regions were used for all statistical analysis in order to reduce multiple comparisons and increase signal‐to‐noise compared with analysis conducted over 80,000 vertices. Statistical analyses were carried out in SurfStat and SPSS 18.0. Change of cortical thickness and volumes with age, by group (FASD versus control), and age‐by‐group interactions were determined for each AAL region using linear mixed‐model: cortical thickness (mm) or volume (cm3) = intercept + a × age + b × group + c × interaction (age × group) + residual, controlling for gender and handedness. Single time‐point group differences in volume and total mean thickness were tested controlling for age, gender, and handedness. Mixed models analysis was chosen for its ability to handle longitudinal data sets with varied spacing between measurements. P‐values of <0.05 were considered significant.
To investigate the relationship between cognitive ability and cortical development, partial correlations were performed between Δcognitive score (raw score scan 2—raw score scan 1) and Δcortical thickness (thickness at scan 2—thickness at scan 1) for each AAL region, controlling for mean age and time between scans. Cognitive scores included WRMT‐R Word ID, WJ Quantitative Concepts, WMTB‐c (digit and block averaged), and CREVT (receptive and expressive scores averaged). NEPSY and WRIT IQ scores were excluded from correlation analysis due to the small number of subjects with scores at two time points (n = 7). Given the large number of correlations performed, P‐values were false‐discovery‐rate (FDR) corrected to correct for multiple comparisons, with significance at q < 0.05.
Sub‐Sample Comparison
To confirm that results do not stem from power differences between groups (n = 11 versus n = 21), analysis of age effects and age‐by‐group interactions were repeated with a subset of 11 controls chosen from the full sample of 21, matched as closely as possible for age, time between scans, and gender (mean age at scan 1: 8.9 ± 1.8 for FASD and 8.4 ± 1.6 for Controls; scan 2: 12.0 ± 2.2 for FASD and 12.0 ± 1.6 for Controls; time between scans 3.1 ± 0.9 years for FASD and 3.6 ± 0.8 years for Controls, 4 females and 7 males in each group). Analysis of this sub‐sample was carried out using identical statistical methods as described above.
RESULTS
Demographics and Cognitive Scores
Control and FASD participants did not differ in median household income ($76–100,000/year) or primary caregiver level of education (over half had some university to graduate degrees), though caregiver status differed between groups with 100% of controls in their biological homes, and 100% of the FASD group in either foster, adoptive, or kinship home placements. Ninety‐three percent of the control sample was Caucasian, whereas 46% of the FASD sample was Caucasian (54% were Aboriginal). IQ was only measured in 7 FASD subjects at scan 2 (none at scan 1 or at either time‐point in the control group), yielding a mean score of 94 ± 13, which was not significantly different from the population norm of 100 (one sample t‐test, P = 0.160) (Table 1), though it should be noted that power to detect a difference from the norm is reduced in only 7 subjects. The WRMT‐R Word ID test yielded significantly lower standard scores in the FASD than control group at both scans (scan one: FASD 94 ± 9, Controls 111 ± 14, P = 0.024; scan two: FASD 91 ± 14, Controls 108 ± 12 P = 0.019), though scores were only significantly different from the population norm (100) at scan 2. Likewise, the FASD group scored significantly below population norms on the WMTB digit and block at both scans, receptive and expressive vocabulary at both scans, WJ Quantitative Concepts (mathematics) at scan 2, NEPSY Auditory Attention and Response Set at scan 1, and NEPSY memory for names at scan 2 (Table 1).
Brain Volume and Cortical Thickness Trajectories
When compared with controls, FASD participants had consistently reduced volumes of total brain (−13%, P < 0.001 scan 1; −13%, P < 0.001 scan 2), white matter (−15%, P < 0.001 scan 1; −18%, P < 0.001 scan 2), and gray matter (−11%, P < 0.001 scan 1; −10%, P < 0.001 scan 2). Raw volumes are not presented here, but comparable values in our larger cohort can be found in our longitudinal DTI paper [Treit et al., 2013]. Longitudinally, mixed‐models analysis in each group revealed decreases of gray matter volume and increases of white matter volume with age in both groups (P < 0.001 for all) and no significant change with age for total brain volume in either group. Mixed‐models analysis with both groups analyzed together did not reveal significant age‐by‐group interactions for any volumes, suggesting similar volume growth rates between groups.
After correcting for gender and handedness, the FASD group had lower total mean cortical thickness than controls at scan one but not scan two (−3%, P = 0.026 scan 1; −0.4%, P = 0.300 scan 2). Mixed‐models analysis performed separately in each group revealed significant age‐related decreases of total mean thickness in the control (P < 0.001) but not FASD group, and repeating the analysis across both groups revealed a significant age‐by‐group interaction for total mean thickness (P = 0.044; Fig. 1). Figure 2 shows example individual cortical thickness maps for one control and one FASD participant, both scanned ∼4 years apart (∼7 years old at scan 1 and ∼11 years old at scan 2). Both maps show similar patterns of cortical thickness, e.g., thicker medial frontal cortex, thinner visual cortex, etc. (Fig. 2A,B,D–E), but the degree of thinning between scans is notably greater in the control subjects (Fig. 2C). The FASD subject maps show fewer regions with reduced cortical thickness between scans, and many regions that show little change or potentially even increases in thickness (Fig. 2F).
Figure 1.
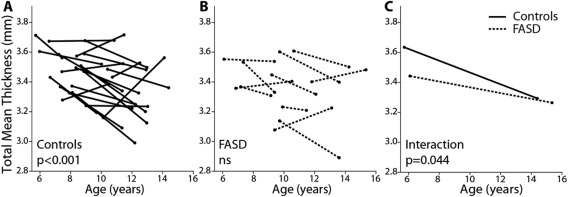
Total mean thickness by group. Leftmost plots (A and B) show thinning trajectories of control subjects (solid lines) and FASD subjects (dotted lines) by age. A significant effect of age is found in the controls (P < 0.001) but not the FASD group (ns). A significant age‐by‐group interaction (C) (P = 0.044) indicates a difference in the rate of thinning between groups, with controls undergoing steeper rates of age related thinning than FASD participants.
Figure 2.
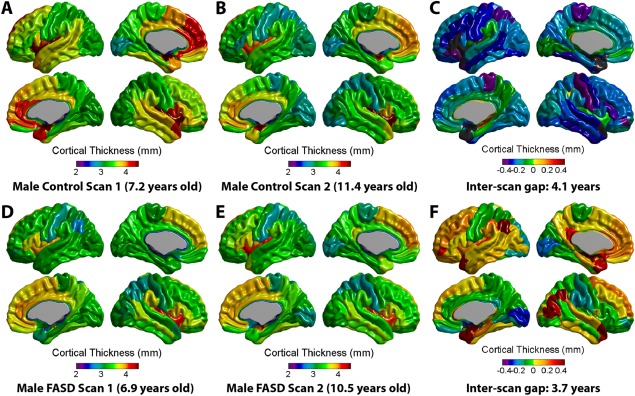
Examples of individual subject cortical thickness maps. Top panel (A–C) displays cortical thickness maps at scan 1 (7.2 years) and scan 2 (11.4 years) as well as the difference map (scan 2—scan 1, gap = 4.1 years) for a male control participant. Below (D–F) is an example of a male FASD participant aged 6.9 years at first scan and 10.5 years at second scan (inter‐scan gap = 3.7 years). Although general patterns of cortical morphology are similar between these two individuals, the control participant has a thicker cortex in many areas at both scans, and undergoes more thinning (areas in blue, purple, or green on far right) between scans. Of note, several areas in the FASD subject appear to lack cortical thinning, but rather show little change or even increases in thickness between scans. [Color figure can be viewed in the online issue, which is available at http://wileyonlinelibrary.com.]
When the cortex was subdivided according to AAL regions within the entire sample, significant age‐related thinning was found extensively in 65 of 78 (83%) cortical sub‐regions in the control group, but only in 9 of 78 regions (12%) in the FASD group (Fig. 3). Of the regions with significant age‐related thinning in the FASD group, most were in the right temporal and parietal lobes. No regions significantly increased in thickness from scan 1 to scan 2 in either the FASD or control group. Significant age‐by‐group interactions were found in 16/78 regions (21%), indicating a steeper slope of thinning in controls than in the FASD group (Table 2, Figs. 3 and 4). The majority of age‐by‐group interactions were found in medial frontal and parietal regions. As seen in Figure 4, in addition to steeper decreases in the control group, a greater amount of inter‐subject variability can be seen in the FASD group; e.g., in the left medial superior frontal gyrus (Fig. 4B), where it appears that ∼15/21 (71%) of control participants undergo decreases in thickness between scans, 5/21 (24%) stay about the same, and 1/21 (5%) show increases in thickness, whereas in the FASD group only about 5/11 (45%) decrease and the remaining show no change (2/11, 18%) or increases in thickness between scans (4/11, 36%) in this region.
Figure 3.
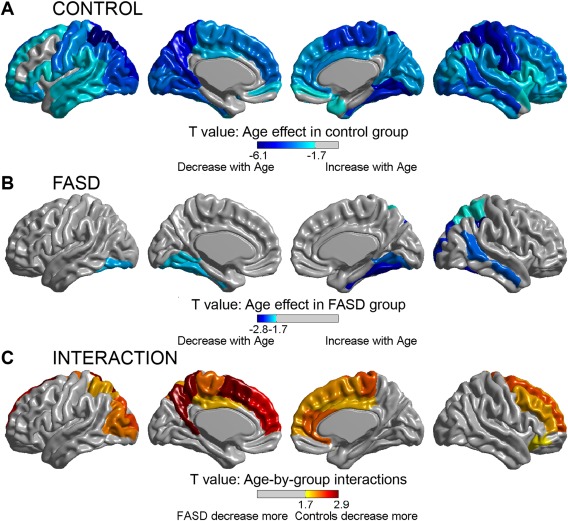
Regional age effects and age‐by‐group interactions on cortical thinning. The top two panels display AAL regions with significant effects of cortical thickness with age in the control (A) and FASD (B) groups. Significant effects of age (decreasing thickness with increasing age) are seen across most of the cortical mantle in the control group (A), but are limited to discrete temporal, parietal, and occipital regions, mostly right hemisphere, in the FASD group (B). Likewise, several regions with significant age‐by‐group interactions are found (C), indicating regional differences in the rate of change with age, with the FASD group undergoing less thinning than controls between scans. [Color figure can be viewed in the online issue, which is available at http://wileyonlinelibrary.com.]
Table 2.
AAL regions with significant age‐by‐group interactions of cortical thickness between controls and FASD
| Age‐by‐group interaction P‐values | Slope (mm/year) | |||
|---|---|---|---|---|
| Controls | FASD | |||
| Total mean thickness | 0.044 | −0.04 | −0.02 | |
| Frontal | Right superior frontal gyrus dorsolateral | 0.014 | −0.06 | −0.01 |
| Left superior frontal gyrus medial | 0.008 | −0.06 | 0.01 | |
| Right superior frontal gyrus medial | 0.026 | −0.06 | 0.00 | |
| Right middle frontal gyrus | 0.026 | −0.04 | −0.02 | |
| Left supplementary motor area | 0.004 | −0.04 | −0.01 | |
| Right supplementary motor area | 0.024 | −0.05 | −0.03 | |
| Right inferior frontal gyrus orbital part | 0.038 | −0.06 | −0.01 | |
| Parietal | Left superior parietal gyrus | 0.027 | −0.05 | −0.04 |
| Left precuneus | 0.003 | −0.04 | −0.02 | |
| Left paracentral lobule | 0.017 | −0.06 | −0.04 | |
| Right paracentral lobule | 0.015 | −0.07 | −0.05 | |
| Occipital | Left middle occipital gyrus | 0.019 | −0.05 | −0.02 |
| Left superior occipital gyrus | 0.013 | −0.05 | −0.03 | |
| Limbic | Right anterior cingulate and paracingulate gyri | 0.016 | −0.05 | −0.02 |
| Left median cingulate and paracingulate gyri | 0.029 | −0.02 | −0.00 | |
| Right medial cingulate and paracingulate gyri | 0.029 | −0.03 | −0.02 | |
Figure 4.
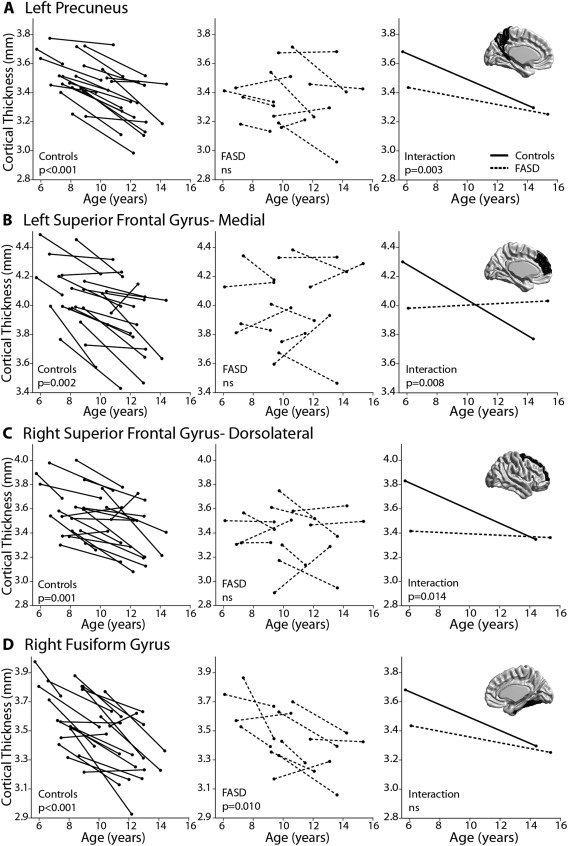
Examples of significant regional age‐by‐group interactions (A–C) and a contrasting example showing significant thinning in both groups with no significant interaction (D). Age‐effects are shown in the first column for controls (solid lines) and second column for FASD participants (dotted lines), followed by age‐by‐group interactions in the third column. Regions include the left precuneus (A), left superior frontal gyrus medial (B), right superior frontal gyrus dorsolateral (C), and right fusiform gyrus (D). In addition to significant thinning that is found in the control but not FASD group for (A–C), individual subject data also provides a visual of the increased variability found in the FASD group relative to the robust cortical thinning between scans seen in controls.
Sub‐Sample Comparison
Sub‐sample analysis (11 vs. 11) yielded similar findings to Figure 3, with near whole brain cortical thinning between scans in controls, and similar patterns of significant age‐by‐group interactions that spanned 13 of 78 (17%) cortical regions (data not shown).
Relationships Between Cortical Thickness and Cognition
There were no significant correlations between change in cognitive score and change in cortical thickness in either group after FDR correction.
DISCUSSION
This longitudinal study demonstrates an altered trajectory of brain development in individuals diagnosed with an FASD, who are shown here to undergo less developmental cortical thinning than healthy controls in several brain regions during childhood and adolescence. Cortical thinning is an essential developmental process that begins in early childhood and continues into adulthood at varying rates and magnitudes across the cortical mantle [Raznahan et al., 2011; Shaw et al., 2008; Sowell et al., 2004]. This process is thought to be primarily driven by synaptic pruning and myelination of underlying white matter, mechanisms that contribute to the refinement of neural networks and specialization of cognitive functions within the cerebral cortices. Abnormal cortical thinning during critical periods of childhood and adolescence may underlie deficits in behavior and cognition that are commonly observed in those prenatally exposed to alcohol.
Age‐by‐group interactions indicate that the FASD group underwent less cortical thinning than controls, primarily in frontal, parietal, and limbic regions. These areas undergo protracted thinning trajectories in healthy development [Tamnes et al., 2010] and are commonly associated with higher level aspects of cognition such as emotional regulation and executive functioning. Previous structural MRI studies have uncovered various frontal and limbic abnormalities in FASD [Lebel et al., 2011], including abnormal cortical thickness [Sowell et al., 2008; Yang et al., 2012], though longitudinal thinning trajectories have not been previously demonstrated in FASD. Slower rates of thinning measured longitudinally in frontal and cingulate gyri have been shown to account for normal variation in Attention Deficit Hyperactivity Disorder (ADHD) symptomatology within typically developing children [Shaw et al., 2011] and may relate to ADHD co‐morbidity frequently observed in FASD (note that 10 of 11 FASD subjects here had ADHD). A recent longitudinal study of cortical volume development in FASD demonstrated that change in volume of the left posterior cingulate gyrus, parahippocampal gyrus, and insula negatively correlated with number of drinks per week during pregnancy, varying by trimester of exposure [Lebel et al., 2012]. These findings highlight the impact of quantity and timing of gestational exposure on subsequent development in childhood, which may contribute to contrasting results in previous cross‐sectional studies that have included varied clinical severities under the FASD umbrella. Although mean age has been similar across previous cross‐sectional cortical thickness studies [Fernandez‐Jaen et al., 2011; Sowell et al., 2008; Yang et al., 2012; Zhou et al., 2011], other differences, such as the proportion of participants with full FAS (ranging from ∼10% [Zhou et al., 2011] to 100% [Fernandez‐Jaen et al., 2011]), presence of co‐morbid ADHD (ranging from ∼30% [Yang et al., 2012; Zhou et al., 2011] to 100% [Fernandez‐Jaen et al., 2011]) and mean IQ, (65 in [Yang et al., 2012], not reported in others) may also contribute to inconsistent findings.
Age‐by‐group interactions emphasize the value of longitudinal data in uncovering trajectories that may have been masked in previous cross‐sectional studies. Given the interaction of thinning trajectories shown here, further measurements of this sample at older ages may again be expected to diverge, with FASD subjects having thicker cortices than controls in agreement with previous cross‐sectional findings by other groups [Fernandez‐Jaen et al., 2011; Sowell et al., 2008; Yang et al., 2012]. Thus, both longitudinal and cross‐sectional findings may reflect impaired cortical thinning. Rates of cortical thinning, rather than absolute thickness values, have been shown to correlate with intellectual ability in healthy development [Shaw et al., 2006a] and have also been valuable for differentiating numerous disorders including ADHD [Shaw et al., 2007] and the emergence of psychopathology [Wood et al., 2008]. Together with longitudinal volume findings [Lebel et al., 2012], our results suggest that reduced cortical change during childhood may be a marker of pathology in alcohol‐exposed children.
In our recent longitudinal DTI study (which includes the sample presented here), the FASD group underwent larger decreases of mean diffusivity (MD) between scans than the control group; changes that we attributed to delayed development [Treit et al., 2013]. Although cortical thinning and DTI parameters are driven in part by convergent mechanisms (e.g., myelination), they follow distinct trajectories during development [Tamnes et al., 2010]. DTI studies have demonstrated nonlinear decreases of MD throughout healthy childhood, with an eventual plateau in early adulthood and subsequent increases thereafter [Bava et al., 2010; Lebel and Beaulieu, 2011]; whereas cortical thickness is typically shown to plateau or decrease slightly during childhood [Raznahan et al., 2012] and then subsequently undergo accelerated thinning during adolescence [Shaw et al., 2008]. In keeping with the model of delayed development proposed in our DTI study, here we find relatively less cortical thinning during adolescence (patterns typical of early childhood), which we may expect to accelerate during late adolescence/early adulthood after the majority of developmental cortical thinning is complete in the control sample if we were to continue following this FASD group. Age‐by‐group interactions found here were mostly in medial parietal and frontal regions in proximity to the white matter tracts implicated in our DTI paper (namely, the superior longitudinal fasciculus and the superior and inferior fronto‐occipital fasciculus). Thus, although the direction of age‐by‐group interactions are opposite between these two imaging parameters, we predict that they are in fact complimentary and both reflect underlying delays of cellular brain development. Moreover, the slowed thinning in medial aspects of the cortex fit with many previous reports of midline abnormalities associated with prenatal alcohol exposure [Bookstein et al., 2002], which are thought to reflect disrupted cellular proliferation and migration patterns during development and may underlie relationships between midline brain abnormalities and facial dysmorphology in FASD [Yang et al., 2012].
Animal models of prenatal ethanol exposure have demonstrated numerous cortical abnormalities that may underlie the thickness reductions observed in cross sectional human studies [Zhou et al., 2011], including decreased cell proliferation rates [Miller, 1989; Miller and Nowakowski, 1991], delayed neuroblast migration [Aronne et al., 2008], apoptosis [Farber et al., 2010; Ikonomidou et al., 2000], altered synaptic architecture [Cui et al., 2010], disruption of laminar organization [Kotkoskie and Norton, 1988], and reductions in overall thickness [Aronne et al., 2008, 2011; Fakoya and Caxton‐Martins, 2006; Norton et al., 1988]. Although informative, most animal models have examined the neonatal or early postnatal periods, with less focus on subsequent cortical development. One recent study of cortical development in a rat model of FASD demonstrated reduced cortical thickness in ethanol exposed rats across developmental periods [Leigland et al., 2013] in support of some human work [Zhou et al., 2011], though imaging was cross sectional and there were no age‐by‐alcohol group interactions. Prenatal ethanol exposure is shown to impair experience‐dependent synaptic plasticity in both the cerebellum [Servais et al., 2007] and hippocampus [Puglia and Valenzuela, 2010; Zucca and Valenzuela, 2010], which results in motor and memory impairments in these models. Similar mechanisms may also disrupt synaptic plasticity in the cortex [Medina, 2011], which could underlie both reduced thinning found longitudinally and increased thickness found in some previous cross‐sectional studies. The transition from synaptogenesis to synaptic pruning in human cortical development is at least partially mediated by modification of glutamatergic receptors [Stoneham et al., 2010] and GABA signaling [Wu et al., 2012], neurotransmitter systems which are disrupted in FASD [Costa et al., 2000; Cuzon et al., 2008] and thus may mediate cortical thinning abnormalities. Direct experimental models are needed to determine the effects of prenatal ethanol exposure on synaptic pruning during development. MRI measurements of cortical thickness rely on T 1‐weighted tissue contrast, which is influenced by numerous cellular factors and may not reflect the cortex per se, as would be measured directly with histological measurement. However, previous work comparing histological and MRI derived measures of cortical thickness suggest that reduced thickness is found in prenatally exposed rats using both methods [Leigland et al., 2013].
Determining a direct relationship between alcohol‐induced prenatal brain damage and subsequent abnormal cortical development during childhood is challenging in humans. Timing and quantity of exposure likely interact with a host of environmental and genetic factors to produce the wide range of phenotypic and neurological outcomes under the FASD umbrella, resulting in considerable heterogeneity within and between FASD samples. Likewise, the influence of ADHD co‐morbidity on cortical development could not be teased apart here, as 10 of 11 FASD participants also had ADHD, in keeping with co‐occurrence estimates >70% in FASD samples [Burd et al., 2003; Fryer et al., 2007]. Cortical thickness studies in idiopathic ADHD (without prenatal alcohol exposure) have yielded somewhat inconsistent findings [Almeida et al., 2010; Duerden et al., 2012; Montes et al., 2013; Narr et al., 2009; Shaw et al., 2006b; 2013], and suggest that this complex relationship may be mediated by age, gender, ADHD subtype [Montes et al., 2013; Shaw et al., 2013], IQ [de Zeeuw et al., 2012], and stimulant use [Shaw et al., 2009], among other variables. Studies of children with both FASD and ADHD suggest that prenatal alcohol exposure exerts a greater influence than ADHD on neurocognitive measures [Glass et al., 2013; Mattson et al., 2013] and cortical thickness [Fernandez‐Jaen et al., 2011]; however, the underlying mechanisms of their co‐occurrence remain elusive. Future large longitudinal studies should endeavor to tease apart the influence of co‐morbid ADHD on cortical development in alcohol exposed children.
Significant adverse life experiences are common to individuals with FASD [Streissguth et al., 2004], and likely compound deficits from alcohol exposure or even alter brain development through independent mechanisms [McCrory et al., 2010]. Indeed, this study is limited by differences in home placement between control and FASD participants, which may reflect confounding environmental factors such as early life adversity. We found no difference in primary caregiver education or annual household income between our FASD and control groups, indicating no gross disparity in present living situation, but were not able to assess previous placements. Thus, prenatal alcohol exposure is a common denominator of subjects with FASD, but an abundance of environmental influences (both positive and negative) must also be considered. Ethnicity was imbalanced between groups, partly resulting from recruiting our FASD sample from a hospital diagnostic clinic that serves both urban and rural areas, whereas our control group came from advertising in the community and schools exclusively within the city. Nonetheless, other studies with more ethnically diverse FASD and control samples [Astley et al., 2009; Lebel et al., 2012], and more ethnically matched samples [Coles et al., 2011] have reported reductions in brain volume between FASD and controls on par with those found in this sample. These groups also differ in gender distribution (Table 1, 64% male FASD, 52% male controls), which may influence brain development during adolescence, and sample size differed between groups with 21 controls but only 11 FASD participants. These limitations were addressed with the analysis of 11 FASD versus 11 (of the 21) age and gender matched controls (4 females and 7 males in each group), which yielded similar findings to Figure 3 with near whole brain cortical thinning between scans in controls, and similar patterns of significant age‐by‐group interactions in 13 of 78 regions in the mixed models analysis (data not shown). Thus, the gender inequality and sample size (power) differences between groups are not a factor in our results. Here, we chose to analyze cortical thickness in AAL regions in order to increase signal‐to‐noise and reduce multiple comparisons rather than applying FDR correction across 80,000 vertices, which can also be too stringent in small sample sizes. However, if we FDR correct our AAL results, age‐effects in the FASD group and age‐by‐group interactions are no longer significant, whereas age effects in both our total control group (n = 21) and our post hoc reduced control sample (n = 11) remain significant (with the exception of only 2 regions out of 65), further suggesting robust cortical thinning in the control group which is not observed in the FASD group. Given the relatively small sample size of this study, we were limited to the use of a linear model, despite evidence that cortical development is nonlinear [Nie et al., 2013; Raznahan et al., 2011; Shaw et al., 2008]. Further longitudinal work is needed to model the developmental trajectories of cortical development in larger samples of FASD participants.
Nonetheless, it remains evident here that children with FASD undergo altered brain development, and that prenatal alcohol exposure itself may result in impaired cortical thinning many years later. This longitudinal study overcomes many of the limitations of previous cross‐sectional work by identifying changes within individuals. An understanding of deviations in brain development beyond in utero insult will provide insight into the lifespan progression of neurological impairment from pre‐natal alcohol exposure, and may inform biological and behavioral interventions to improve quality of life and prevent the emergence of secondary deficits in affected individuals.
ACKNOWLEDGMENTS
Alberta Innovates–Health Solutions (C.B.), the Natural Sciences and Engineering Research Council (NSERC) (C.L.), and the Canadian Institutes for Health Research (CIHR) (S.T.) provided salary support. The authors would also like to gratefully acknowledge the contributions of Lauren Baugh for cognitive testing and scoring, Dr. Alan Evans for the use of CIVET/CBRAIN, and all of the participants, parents, and caregivers who donated their time and efforts for this study.
REFERENCES
- Almeida LG, Ricardo‐Garcell J, Prado H, Barajas L, Fernandez‐Bouzas A, Avila D, Martinez RB (2010): Reduced right frontal cortical thickness in children, adolescents and adults with ADHD and its correlation to clinical variables: A cross‐sectional study. J Psychiatr Res 44:1214–1223. [DOI] [PubMed] [Google Scholar]
- Aronne MP, Evrard SG, Mirochnic S, Brusco A (2008): Prenatal ethanol exposure reduces the expression of the transcriptional factor Pax6 in the developing rat brain. Ann N Y Acad Sci 1139:478–498. [DOI] [PubMed] [Google Scholar]
- Aronne MP, Guadagnoli T, Fontanet P, Evrard SG, Brusco A (2011): Effects of prenatal ethanol exposure on rat brain radial glia and neuroblast migration. Exp Neurol 229:364–371. [DOI] [PubMed] [Google Scholar]
- Astley S (2004): Diagnostic Guide for Fetal Alcohol Spectrum Disorders: The 4‐Digit Diagnostic Code. Seattle, USA: Fetal Alcohol Syndrome Diagnostic and Prevention Network, University of Washington. [Google Scholar]
- Astley SJ, Aylward EH, Olson HC, Kerns K, Brooks A, Coggins TE, Davies J, Dorn S, Gendler B, Jirikowic T, Kraegel P, Maravilla K, Richards T (2009): Magnetic resonance imaging outcomes from a comprehensive magnetic resonance study of children with fetal alcohol spectrum disorders. Alcohol: Clin Exp Res 33:1671–1689. [DOI] [PMC free article] [PubMed] [Google Scholar]
- Bava S, Thayer R, Jacobus J, Ward M, Jernigan TL, Tapert SF (2010): Longitudinal characterization of white matter maturation during adolescence. Brain Res 1327:38–46. [DOI] [PMC free article] [PubMed] [Google Scholar]
- Bookstein FL, Sampson PD, Connor PD, Streissguth AP (2002): Midline corpus callosum is a neuroanatomical focus of fetal alcohol damage. Anat Rec 269:162–174. [DOI] [PubMed] [Google Scholar]
- Burd L, Klug MG, Martsolf JT, Kerbeshian J (2003): Fetal alcohol syndrome: Neuropsychiatric phenomics. Neurotoxicol Teratol 25:697–705. [DOI] [PubMed] [Google Scholar]
- Chudley AE, Conry J, Cook LL, Loock C, Rosales T, LeBlanc N (2005): Fetal alcohol spectrum disorder: Canadian guidelines for diagnosis. Can Med Assoc J 172:S1–S21. [DOI] [PMC free article] [PubMed] [Google Scholar]
- Coles CD, Goldstein FC, Lynch ME, Chen XC, Kable JA, Johnson KC, Hu XP (2011): Memory and brain volume in adults prenatally exposed to alcohol. Brain Cognit 75:67–77. [DOI] [PMC free article] [PubMed] [Google Scholar]
- Costa ET, Savage DD, Valenzuela CF (2000): A review of the effects of prenatal or early postnatal ethanol exposure on brain ligand‐gated ion channels. Alcohol: Clin Exp Res 24:706–715. [PubMed] [Google Scholar]
- Cui ZJ, Zhao KB, Zhao HJ, Yu DM, Niu YL, Zhang JS, Deng JB (2010): Prenatal alcohol exposure induces long‐term changes in dendritic spines and synapses in the mouse visual cortex. Alcohol Alcohol 45:312–319. [DOI] [PubMed] [Google Scholar]
- Cuzon VC, Yeh PWL, Yanagawa Y, Obata K, Yeh HH (2008): Ethanol consumption during early pregnancy alters the disposition of tangentially migrating GABAergic interneurons in the fetal cortex. J Neurosci 28:1854–1864. [DOI] [PMC free article] [PubMed] [Google Scholar]
- de Zeeuw P, Schnack HG, van Belle J, Weusten J, van Dijk S, Langen M, Brouwer RM, van Engeland H, Durston S (2012): Differential brain development with low and high IQ in attention‐deficit/hyperactivity disorder. PLoS One 7:e35770. doi: 10.1371/journal.pone.0035770. [DOI] [PMC free article] [PubMed] [Google Scholar]
- Duerden EG, Tannock R, Dockstader C (2012): Altered cortical morphology in sensorimotor processing regions in adolescents and adults with attention‐deficit/hyperactivity disorder. Brain Res 1445:82–91. [DOI] [PubMed] [Google Scholar]
- Fakoya FA, Caxton‐Martins EA (2006): Neocortical neurodegeneration in young adult Wistar rats prenatally exposed to ethanol. Neurotoxicol Teratol 28:229–237. [DOI] [PubMed] [Google Scholar]
- Farber NB, Creeley CE, Olney JW (2010): Alcohol‐induced neuroapoptosis in the fetal macaque brain. Neurobiol Dis 40:200–206. [DOI] [PMC free article] [PubMed] [Google Scholar]
- Fernandez‐Jaen A, Fernandez‐Mayoralas DM, Quinones Tapia D, Calleja‐Perez B, Garcia‐Segura JM, Arribas SL, Munoz Jareno N (2011): Cortical thickness in fetal alcohol syndrome and attention deficit disorder. Pediatr Neurol 45:387–391. [DOI] [PubMed] [Google Scholar]
- Fryer SL, McGee CL, Matt GE, Mattson SN (2007): Evaluation of psychopathological conditions in children with heavy prenatal alcohol exposure. Pediatrics 119:E733–E741. [DOI] [PubMed] [Google Scholar]
- Glass L, Ware AL, Crocker N, Deweese BN, Coles CD, Kable JA, May PA, Kalberg WO, Sowell ER, Jones KL, Riley EP, Mattson SN (2013): Neuropsychological deficits associated with heavy prenatal alcohol exposure are not exacerbated by ADHD. Neuropsychology 27:713–724. [DOI] [PMC free article] [PubMed] [Google Scholar]
- Glutting J, Adams W, Sheslow D (2000): Wide Range Intelligence Test. Wilmington, DE, Wide Range Inc. [Google Scholar]
- Goodlett CR, Horn KH, Zhou FC (2005): Alcohol teratogenesis: Mechanisms of damage and strategies for intervention. Exp Biol Med 230:394–406. [DOI] [PubMed] [Google Scholar]
- Ikonomidou C, Bittigau P, Ishimaru MJ, Wozniak DF, Koch C, Genz K, Price MT, Stefovska V, Horster F, Tenkova T, Dikranian K, Olney JW (2000): Ethanol‐induced apoptotic neurodegeneration and fetal alcohol syndrome. Science 287:1056–1060. [DOI] [PubMed] [Google Scholar]
- Kotkoskie LA, Norton S (1988): Prenatal brain malformations following acute ethanol exposure in the rat. Alcohol: Clin Exp Res 12:831–836. [DOI] [PubMed] [Google Scholar]
- Lebel C, Beaulieu C (2011): Longitudinal development of human brain wiring continues from childhood into adulthood. J Neurosci 31:10937–10947. [DOI] [PMC free article] [PubMed] [Google Scholar]
- Lebel C, Rasmussen C, Wyper K, Walker L, Andrew G, Yager J, Beaulieu C (2008): Brain diffusion abnormalities in children with fetal alcohol spectrum disorder. Alcohol: Clin Exp Res 32:1732–1740. [DOI] [PubMed] [Google Scholar]
- Lebel C, Roussotte F, Sowell ER (2011): Imaging the impact of prenatal alcohol exposure on the structure of the developing human brain. Neuropsychol Rev 21:102–118. [DOI] [PMC free article] [PubMed] [Google Scholar]
- Lebel C, Mattson SN, Riley EP, Jones KL, Adnams CM, May PA, Bookheimer SY, O'Connor MJ, Narr KL, Kan E, Abaryan Z, Sowell ER (2012): A longitudinal study of the long‐term consequences of drinking during pregnancy: Heavy in utero alcohol exposure disrupts the normal processes of brain development. J Neurosci 32:15243–15251. [DOI] [PMC free article] [PubMed] [Google Scholar]
- Leigland LA, Ford MM, Lerch JP, Kroenke CD (2013): The influence of fetal ethanol exposure on subsequent development of the cerebral cortex as revealed by magnetic resonance imaging. Alcohol: Clin Exp Res 37:924–932. [DOI] [PMC free article] [PubMed] [Google Scholar]
- Mattson SN, Roesch SC, Glass L, Deweese BN, Coles CD, Kable JA, May PA, Kalberg WO, Sowell ER, Adnams CM, Jones KL, Riley EP; CIFASD (2013): Further development of a neurobehavioral profile of fetal alcohol spectrum disorders. Alcohol: Clin Exp Res 37:517–528. [DOI] [PMC free article] [PubMed] [Google Scholar]
- May PA, Gossage JP (2001): Estimating the prevalence of fetal alcohol syndrome—A summary. Alcohol Res Health 25:159–167. [PMC free article] [PubMed] [Google Scholar]
- May PA, Gossage JP, Kalberg WO, Robinson LK, Buckley D, Manning M, Hoyme HE (2009): Prevalence and epidemiologic characteristics of FASD from various research methods with an emphasis on recent in‐school studies. Dev Disabil Res Rev 15:176–192. [DOI] [PubMed] [Google Scholar]
- McCrory E, De Brito SA, Viding E (2010): Research review: The neurobiology and genetics of maltreatment and adversity. J Child Psychol Psychiatry 51:1079–1095. [DOI] [PubMed] [Google Scholar]
- Medina AE (2011): Fetal alcohol spectrum disorders and abnormal neuronal plasticity. Neuroscientist 17:274–287. [DOI] [PMC free article] [PubMed] [Google Scholar]
- Miller MW (1989): Effects of prenatal exposure to ethanol on neocortical development: II. Cell proliferation in the ventricular and subventricular zones of the rat. J Comp Neurol 287:326–338. [DOI] [PubMed] [Google Scholar]
- Miller MW, Nowakowski RS (1991): Effect of prenatal exposure to ethanol on the cell cycle kinetics and growth fraction in the proliferative zones of fetal rat cerebral cortex. Alcohol: Clin Exp Res 15:229–232. [DOI] [PubMed] [Google Scholar]
- Montes LGA, Alcantara HP, Garcia RBM, De La Torre LB, Acosta DA, Duarte MG (2013): Brain cortical thickness in ADHD: Age, sex, and clinical correlations. J Atten Disord 17:641–654. [DOI] [PubMed] [Google Scholar]
- Narr KL, Woods RP, Lin J, Kim J, Phillips OR, Del'Homme M, Caplan R, Toga AW, McCracken JT, Levitt JG (2009): Widespread cortical thinning is a robust anatomical marker for attention‐deficit/hyperactivity disorder. J Am Acad Child Adolesc Psychiatry 48:1014–1022. [DOI] [PMC free article] [PubMed] [Google Scholar]
- Nie JX, Li G, Shen DG (2013): Development of cortical anatomical properties from early childhood to early adulthood. Neuroimage 76:216–224. [DOI] [PMC free article] [PubMed] [Google Scholar]
- Norton S, Terranova P, Na JY, Sanchotello M (1988): Early motor development and cerebral cortical morphology in rats exposed perinatally to alcohol. Alcohol: Clin Exp Res 12:130–136. [DOI] [PubMed] [Google Scholar]
- Puglia MP, Valenzuela CF (2010): Repeated third trimester‐equivalent ethanol exposure inhibits long‐term potentiation in the hippocampal CA1 region of neonatal rats. Alcohol 44:283–290. [DOI] [PMC free article] [PubMed] [Google Scholar]
- Raznahan A, Shaw P, Lalonde F, Stockman M, Wallace GL, Greenstein D, Clasen L, Gogtay N, Giedd JN (2011): How does your cortex grow? J Neurosci 31:7174–7177. [DOI] [PMC free article] [PubMed] [Google Scholar]
- Raznahan A, Greenstein D, Lee NR, Clasen LS, Giedd JN (2012): Prenatal growth in humans and postnatal brain maturation into late adolescence. Proc Natl Acad Sci USA 109:11366–11371. [DOI] [PMC free article] [PubMed] [Google Scholar]
- Servais L, Hourez R, Bearzatto B, Gall D, Schiffmann SN, Cheron G (2007): Purkinje cell dysfunction and alteration of long‐term synaptic plasticity in fetal alcohol syndrome. Proc Natl Acad Sci USA 104:9858–9863. [DOI] [PMC free article] [PubMed] [Google Scholar]
- Shaw P, Greenstein D, Lerch J, Clasen L, Lenroot R, Gogtay N, Evans A, Rapoport J, Giedd J (2006a): Intellectual ability and cortical development in children and adolescents. Nature 440:676–679. [DOI] [PubMed] [Google Scholar]
- Shaw P, Lerch J, Greenstein D, Sharp W, Clasen L, Evans A, Giedd J, Castellanos FX, Rapoport J (2006b): Longitudinal mapping of cortical thickness and clinical outcome in children and adolescents with attention‐deficit/hyperactivity disorder. Arch Gen Psychiatry 63:540–549. [DOI] [PubMed] [Google Scholar]
- Shaw P, Eckstrand K, Sharp W, Blumenthal J, Lerch JP, Greenstein D, Clasen L, Evans A, Giedd J, Rapoport JL (2007): Attention‐deficit/hyperactivity disorder is characterized by a delay in cortical maturation. Proc Natl Acad Sci USA 104:19649–19654. [DOI] [PMC free article] [PubMed] [Google Scholar]
- Shaw P, Kabani NJ, Lerch JP, Eckstrand K, Lenroot R, Gogtay N, Greenstein D, Clasen L, Evans A, Rapoport JL, Giedd JN, Wise SP (2008): Neurodevelopmental trajectories of the human cerebral cortex. J Neurosci 28:3586–3594. [DOI] [PMC free article] [PubMed] [Google Scholar]
- Shaw P, Sharp WS, Morrison M, Eckstrand K, Greenstein DK, Clasen LS, Evans AC, Rapoport JL (2009): Psychostimulant treatment and the developing cortex in attention deficit hyperactivity disorder. Am J Psychiatry 166:58–63. [DOI] [PMC free article] [PubMed] [Google Scholar]
- Shaw P, Gilliam M, Liverpool M, Weddle C, Malek M, Sharp W, Greenstein D, Evans A, Rapoport J, Giedd J (2011): Cortical development in typically developing children with symptoms of hyperactivity and impulsivity: Support for a dimensional view of attention deficit hyperactivity disorder. Am J Psychiatry 168:143–151. [DOI] [PMC free article] [PubMed] [Google Scholar]
- Shaw P, Malek M, Watson B, Greenstein D, de Rossi P, Sharp W (2013): Trajectories of cerebral cortical development in childhood and adolescence and adult attention‐deficit/hyperactivity disorder. Biol Psychiatry 74:599–606. [DOI] [PMC free article] [PubMed] [Google Scholar]
- Sowell ER, Thompson PM, Leonard CM, Welcome SE, Kan E, Toga AW (2004): Longitudinal mapping of cortical thickness and brain growth in normal children. J Neurosci 24:8223–8231. [DOI] [PMC free article] [PubMed] [Google Scholar]
- Sowell ER, Mattson SN, Kan E, Thompson PM, Riley EP, Toga AW (2008): Abnormal cortical thickness and brain‐behavior correlation patterns in individuals with heavy prenatal alcohol exposure. Cereb Cortex 18:136–144. [DOI] [PMC free article] [PubMed] [Google Scholar]
- Stoneham ET, Sanders EM, Sanyal M, Dumas TC (2010): Rules of engagement: Factors that regulate activity‐dependent synaptic plasticity during neural network development. Biol Bull 219:81–99. [DOI] [PubMed] [Google Scholar]
- Streissguth AP, Bookstein FL, Barr HM, Sampson PD, O'Malley K, Young JK (2004): Risk factors for adverse life outcomes in fetal alcohol syndrome and fetal alcohol effects. J Dev Behav Pediatr 25:228–238. [DOI] [PubMed] [Google Scholar]
- Tamnes CK, Ostby Y, Fjell AM, Westlye LT, Due‐Tonnessen P, Walhovd KB (2010): Brain maturation in adolescence and young adulthood: Regional age‐related changes in cortical thickness and white matter volume and microstructure. Cereb Cortex 20:534–548. [DOI] [PubMed] [Google Scholar]
- Treit S, Lebel C, Baugh L, Rasmussen C, Andrew G, Beaulieu C (2013): Longitudinal MRI reveals altered trajectory of brain development during childhood and adolescence in fetal alcohol spectrum disorders. J Neurosci 33:10098–10109. [DOI] [PMC free article] [PubMed] [Google Scholar]
- Tzourio‐Mazoyer N, Landeau B, Papathanassiou D, Crivello F, Etard O, Delcroix N, Mazoyer B, Joliot M (2002): Automated anatomical labeling of activations in SPM using a macroscopic anatomical parcellation of the MNI MRI single‐subject brain. Neuroimage 15:273–289. [DOI] [PubMed] [Google Scholar]
- van Soelen ILC, Brouwer RM, van Baal GCM, Schnack HG, Peper JS, Collins DL, Evans AC, Kahn RS, Boomsma DI, Pol HEH (2012): Genetic influences on thinning of the cerebral cortex during development. Neuroimage 59:3871–3880. [DOI] [PubMed] [Google Scholar]
- Wood SJ, Pantelis C, Velakoulis D, Yuecel M, Fornito A, McGorry PD (2008): Progressive changes in the development toward schizophrenia: Studies in subjects at increased symptomatic risk. Schizophr Bull 34:322–329. [DOI] [PMC free article] [PubMed] [Google Scholar]
- Wu XY, Fu Y, Knott G, Lu JT, Di Cristo G, Huang ZJ (2012): GABA signaling promotes synapse elimination and axon pruning in developing cortical inhibitory interneurons. J Neurosci 32:331–343. [DOI] [PMC free article] [PubMed] [Google Scholar]
- Yang Y, Roussotte F, Kan E, Sulik KK, Mattson SN, Riley EP, Jones KL, Adnams CM, May PA, O'Connor MJ, Narr KL, Sowell ER (2012): Abnormal cortical thickness alterations in fetal alcohol spectrum disorders and their relationships with facial dysmorphology. Cereb Cortex 22:1170–1179. [DOI] [PMC free article] [PubMed] [Google Scholar]
- Zhou D, Lebel C, Lepage C, Rasmussen C, Evans A, Wyper K, Pei J, Andrew G, Massey A, Massey D, Beaulieu C (2011): Developmental cortical thinning in fetal alcohol spectrum disorders. Neuroimage 58:16–25. [DOI] [PubMed] [Google Scholar]
- Zucca S, Valenzuela CF (2010): Low concentrations of alcohol inhibit BDNF‐dependent GABAergic plasticity via L‐type Ca(2+) channel inhibition in developing CA3 hippocampal pyramidal neurons. J Neurosci 30:6776–6781. [DOI] [PMC free article] [PubMed] [Google Scholar]