

Abstract
Frontotemporal dementia is a degenerative brain condition characterized by focal atrophy affecting the frontal and temporal lobes predominantly. Changes in white matter with disease progression and their relationship to grey matter atrophy remain unknown in FTD. This study aimed to establish longitudinal white matter changes and compare these changes to regional grey matter atrophy in the main FTD subtypes. Diffusion and T 1‐weighted images were collected from behavioral‐variant FTD (bvFTD: 12), progressive non‐fluent aphasia (PNFA: 10), semantic dementia (SD: 11), and 15 controls at baseline and 12 months apart. Changes in white matter integrity were established by fractional anisotropy, mean, axial and radial diffusivity measurements using tract‐based spatial statistics. Patterns of cortical grey matter atrophy were measured using voxel‐based morphometry. At baseline, bvFTD showed severe cross‐sectional changes in orbitofrontal and anterior temporal tracts, which progressed to involve posterior temporal and occipital white matter over the 12‐month. In PNFA, cross‐sectional changes occurred bilaterally in frontotemporal white matter (left > right), with longitudinal changes more prominent on the right. Initial white matter changes in SD were circumscribed to the left temporal lobe, with longitudinal changes extending to bilateral frontotemporal tracts. In contrast, progression of grey matter change over time was less pronounced in all FTD subtypes. Mean diffusivity was most sensitive in detecting baseline changes while fractional anisotropy and radial diffusivity revealed greatest changes over time, possibly reflecting different underlying pathological processes with disease progression. Our results indicate that investigations of white matter changes reveal important differences across FTD syndromes with disease progression. Hum Brain Mapp 35:3547–3557, 2014. © 2013 Wiley Periodicals, Inc.
Keywords: frontotemporal dementia, longitudinal white matter changes, diffusion tensor imaging, tract‐based spatial statistic, voxel‐based morphometry
INTRODUCTION
Frontotemporal dementia (FTD) is a progressive neurodegenerative brain disease, affecting the frontal and temporal lobes predominantly. It is characterized by three main clinical phenotypes (Gorno‐Tempini et al., 2011; Neary et al., 1998; Rascovsky et al., 2011). The behavioral‐variant FTD (bvFTD) is the most common clinical phenotype and is typified by early changes in personal, social, interpersonal conduct and loss of insight (Piguet et al., 2011). On magnetic resonance imaging (MRI), bvFTD is associated with bilateral frontal and anterior temporal grey matter atrophy (Boccardi et al., 2005; Rosen et al., 2002; Seeley et al., 2008). The remaining patients present with predominant language deficits, which can be either fluent (semantic dementia; SD) or non‐fluent (progressive non‐fluent aphasia; PNFA). SD is characterized by a progressive loss of semantic or world knowledge. The language output remains fluent with intact grammar and phonology but empty with a reduction of expressive vocabulary (Gorno‐Tempini et al., 2004; Hodges et al., 1992). Brain imaging is characteristic with profound asymmetric anterior temporal lobe atrophy, generally more pronounced on the left (Hodges and Patterson, 2007; Kipps et al., 2007). Patients with PNFA present with hesitant distorted speech and/or agrammatism (Gorno‐Tempini et al., 2004; Grossman et al., 1996). This presentation is associated with atrophy of the left posterior fronto‐insular region (Gorno‐Tempini et al., 2004). As the disease progresses, clinical features tend to merge across clinical phenotypes and brain atrophy becomes more extensive with bilateral involvement (Rosen et al., 2002; Whitwell et al., 2004).
Advances in diffusion tensor imaging (DTI) techniques in recent years have led to a number of investigations on white matter integrity in FTD subtypes (Acosta‐Cabronero et al., 2011; Agosta et al., 2010, 2011; Borroni et al., 2007; Galantucci et al., 2011; Mahoney et al., 2013; Matsuo et al., 2008; Schwindt et al., 2013; Whitwell et al., 2010; Zhang et al., 2009,2013). Importantly, significant differences in regional severity occur depending on the DTI metrics used. Further, cross‐sectional studies show that the extent of white matter damage cannot be predicted by the degree of associated grey matter atrophy (Agosta et al., 2011; Mahoney et al., 2013; Schwindt et al., 2013). The question of whether there is a tight coupling of the white and grey matter damage over time and with disease stage or type remains unknown. This study aimed to establish the regional pattern and severity of white matter damage in each of the main FTD syndromes over 12 months, and compare the progression of white matter change to grey matter changes over the same time period.
MATERIALS AND METHODS
Participant Recruitment
Thirty‐three individuals diagnosed with FTD (bvFTD = 12; PNFA = 10; SD = 11) were recruited from the Frontier research clinic at Neuroscience Research Australia (NeuRA), Sydney, Australia into this study. All patients were seen by the same experienced neurologist (JRH) and met current clinical diagnostic criteria for FTD (Gorno‐Tempini et al., 2011; Neary et al., 1998; Rascovsky et al., 2011). Pathological confirmation of frontotemporal lobar degeneration was subsequently obtained for two patients. Postmortem investigations revealed one bvFTD patient to have TDP‐43 protein inclusions while another patient, diagnosed with PNFA, showed tau positive inclusions, the distribution of which was consistent with a pathological diagnosis of progressive supranuclear palsy. Patients with logopenic progressive aphasia were excluded from this study. In addition, 15 age‐ and sex‐matched healthy controls were recruited from the NeuRA brain donor program and from local community clubs. Healthy controls scored 0 on the Clinical Dementia Rating (Morris, 1993) and above 88/100 on the Addenbrooke's Cognitive Examination‐Revised (ACE‐R) (Mioshi et al., 2006). Exclusion criteria included prior history of mental illness, significant head injury, movement disorders, cerebrovascular disease, alcohol and other drug abuse, use of psychotropic medication, and limited English proficiency. Because MRI uses high‐field magnets in a confined environment, individuals with ferromagnetic implants or a prior history of claustrophobia were also excluded.
Ethical approval for this study was obtained from the Southern Eastern Sydney and Illawarra Area Health Service and the University of New South Wales ethics committees. All participants, or their person responsible, provided informed consent in accordance with the Declaration of Helsinki.
Image Acquisition
Whole‐brain diffusion‐weighted and T 1 images were obtained from a 3‐T scanner (Philips Achieva 3.0T TX) with a standard eight‐channel head coil. For the diffusion‐weighted sequence, two sets of whole‐brain echo‐planar images were acquired with 32 non‐collinear gradient directions (repetition time /echo time /inversion time: 8400/68/90 ms; b‐value = 1000s/mm2; 55 slices, horizontal slice thickness 2.5 mm, end resolution: 2.5 × 2.5 × 2.5 mm3; field of view: 240 × 240 mm, 96 × 96 matrix). Two sets of 3D T 1‐weighted images were also acquired in the coronal plane (echo time/ repetition time: 2.6/5.8 ms, 200 slices, slice thickness 1 mm, in‐plane resolution: 1 × 1 mm2, in‐plane matrix: 256 × 256). All images were visually inspected for quality and images with a large degree of head movement or with obvious white matter hyperintensities were excluded. One PNFA subject was excluded for VBM analysis due to issues with the acquired T 1 image, but was included in the DTI analysis, as detailed below.
Tract‐based Spatial Statistics
DTI data were processed with Tract‐based spatial statistics (TBSS v 1.1; Smith et al., 2006), part of the Functional MRI of the Brain Software Library (FSL v 4.1.9; Smith et al., 2004). Image pre‐processing involved the following steps. First, the two DTI sequences were averaged to improve signal‐to‐noise ratio before being corrected for eddy current distortions and head movements using affine registration to the non‐diffusion volumes (b 0). Then, the Brain Extraction Tool was applied to both the b0 images and the diffusion‐weighted images (Smith, 2002). Each brain was visually checked to ensure the accurate removal of all non‐brain tissues during the skull‐stripping process. Finally, a tensor model was fitted into the diffusion images using FMRIB Diffusion Toolbox, and the primary, secondary, and tertiary tensor eigenvalues (λ1, λ2, and λ3) were generated (Smith et al., 2004). The four DTI metrics obtained included axial diffusivity (AxialD), which is the diffusion coefficient along the main axis; radial diffusivity (RadialD), the averaged diffusion coefficient along the perpendicular axes; mean diffusivity (MD), the averaged diffusion coefficient along all axes; and fractional anisotropy (FA), which is the ratio of the above metrics, generating a value between 0 to 1 to show the overall magnitude and orientation of water diffusion in tissue.
Then, imaging data were processed using the following methodology, which can be summarized in four steps. First, each individual FA map (baseline FTD and control) was transformed to the FMRIB58 fractional anisotropy template obtained from the FSL software using nonlinear registration. All aligned FA images were affine‐registered into the Montreal Neurological Institute standard space (MNI‐152; Andersson et al., 2007a, 2007b). Second, the averaged FA data were thinned to create a skeleton of white matter that signified the centers of all white matter tracts (lines of maximum FA) common to the group. Third, each individual FA data point was projected on the mean FA skeleton to correct residual misalignment and to line up the centers of individual tracts. The mean FA skeleton was thresholded at 0.2 to minimize partial volume effects and inter‐subject variability. Finally, AxialD, RadialD, and MD data were also mapped onto the skeleton using projection vectors from the FA‐to‐skeleton transformation for each individual (Smith et al., 2006). The longitudinal imaging data was conducted in a separate analysis. FA maps from baseline and follow‐up scans within each FTD subtype were registered non‐linearly to the FMRIB58 fractional anisotropy standard template. The mean FA skeleton was derived from baseline and follow‐up FA maps within each FTD subtype. Other processing steps were identical to the procedure described above. This method has been used previously in other longitudinal studies (Acosta‐Cabronero et al., 2012; Barrick et al., 2010; Teipel et al., 2010; Weaver et al., 2009).
Voxel‐Based Morphometry
Voxel‐based morphometry (VBM) from the FSL suite was used to perform grey matter analysis (Ashburner and Friston, 2000; Good et al., 2001). T 1‐weighted images underwent the Brain Extraction Tool to remove any non‐brain matter (Smith, 2002) and the brain was segmented into grey, white matter and cerebrospinal fluid using FMRIB's Automatic Segmentation Tool (Zhang et al., 2001). The images were then registered into the MNI‐152 standard space using non‐linear registration (Andersson et al., 2007a, 2007b). The space‐transformed images were averaged and flipped along the x‐axis to produce a symmetric, study‐specific grey matter template. All native T1 scans were non‐linearly registered to the study‐specific template for modulation (to correct for local expansion or contraction due to non‐linear component of the spatial transformation). The resulting images were averaged and flipped along the x‐axis to produce a left‐right symmetric, study‐specific grey matter template and were smoothed with an isotropic Gaussian kernel with a sigma of 3 mm (full width half maximum = 8 mm).
Voxelwise Statistical Analysis
In TBSS, a voxelwise general linear model was applied and clusters were generated from a permutation‐based (5000 permutations performed), non‐parametric test with the threshold‐free cluster enhancement option. Cross‐sectional analyses contrasted baseline DTI data between controls and each FTD group separately. Longitudinal analyses contrasted DTI data acquired at the two time points (baseline and 12‐month acquisition) within each group with a paired t‐test. Masks of white matter tracts were generated for the extraction of DTI metrics. White matter locations of significant clusters were determined by reference to the John Hopkins University white matter atlas and the ICBM‐DTI‐WM atlas labels integrated into FSL view (Mori et al., 2008; Oishi et al., 2008). Grey matter locations of significant clusters were determined by reference to the MNI structural atlas and Harvard–Oxford Cortical Structural Atlas. The statistical threshold was set at P < 0.05 corrected for multiple comparisons (family wise error) for all analyses.
RESULTS
Demographic and clinical characteristics of study participants are presented in Table 1. Groups were well matched for age, years of education, and sex. Not surprisingly, a significant group difference was observed on the ACE‐R, with all FTD groups scoring significantly lower than controls. In addition, SD patients scored significantly lower than the PNFA group on the ACE‐R, reflecting the semantic loading of this instrument. Further, disease duration was significantly longer in SD compared with PNFA patients (Table 1).
Table 1.
Demographic and clinical data of patients and control group
| bvFTD | PNFA | SD | Controls | P | |
|---|---|---|---|---|---|
| Sex (M/F) | 12(8/4) | 10(6/4) | 11(9/2) | 15(8/7) | NS |
| Mean age (years) | 63 ± 8 | 67 ± 11 | 62 ± 6 | 67 ± 6 | NS |
| Education (yrs) | 12 ± 3 | 12 ± 3 | 13 ± 3 | 14 ± 3 | NS |
| ACE‐R (max:100) | 74 ± 12 | 79 ± 11 | 63 ± 12 | 94 ± 4 | 0.01a |
| Disease duration (yrs) | 4.8 ± 2.8 | 3.0 ± 0.58 | 5.4 ± 3.0 | N/A | a |
| Scan interval (yrs) | 0.9 ± 0.2 | 1.0 ± 0.0 | 1.0 ± 0.3 | N/A | NS |
Numerical values are illustrated in mean ± standard deviation.
Significant differences were observed in ACE‐R between all FTD subtypes (bvFTD, PNFA and SD) and controls (P < 0.01).
Significant differences between PNFA and SD.
Abbreviations: M, male; F, female; NS, not significant; ACE‐R, Addenbrooke's Cognitive Examination‐Revised; yrs, years; bvFTD, behavioral‐variant frontotemporal dementia; PNFA, progressive non‐fluent aphasia; SD, semantic dementia.
Patterns of Cross‐sectional White and Grey Matter Changes in FTD Subtypes
Results from the DTI analyses showed the expected patterns of differential white matter changes at baseline in all the FTD subtypes (Supporting Information Fig. S1; Acosta‐Cabronero et al., 2011; Agosta et al., 2011; Mahoney et al., 2013; Schwindt et al., 2013). Differences in the data, however, were observed in the FTD subtypes depending on the DTI metrics.
Behavioral‐variant FTD
All DTI measures revealed significant bilateral changes (reduced FA and increased MD, AxialD and RadialD) in similar locations, most pronounced in frontotemporal regions, early in the bvFTD group compared to controls. The changes occurred in the anterior thalamic radiation, anterior cingulum, superior and inferior longitudinal, inferior frontal‐occipital and uncinate fasciculi, as well as the genu of the corpus callosum. Abnormalities on MD and RadialD appeared the most extensive in this FTD subgroup (Supporting Information Fig. S1).
Progressive non‐fluent aphasia
In this group, early left greater than right white matter changes were observed in the superior and inferior longitudinal fasciculi, as well as in the body and splenium of the corpus callosum. Abnormalities were generally more pronounced in the MD and RadialD DTI measures for this FTD group (Supporting Information Fig. S1).
Semantic dementia
Early white matter changes in SD were identified only in the left hemisphere (Supporting Information Fig. S1). Regional white matter changes included the left cingulum, left superior and inferior longitudinal and uncinate fasciculi. Similarly located abnormalities were detected by all four DTI metrics, with most extensive changes found in MD and AxialD in this FTD subgroup.
Results from the VBM analyses showed the expected patterns of grey matter changes in all the FTD subtypes (Supporting Information Fig. S2; Agosta et al., 2011; Boccardi et al., 2005; Mummery et al., 2000; Pan et al., 2012).
White matter abnormalities were found to extend beyond the locations of grey matter atrophy in two of the three FTD subtypes. This was most pronounced in the PNFA group, where grey matter atrophy occurred in the inferior frontal and insula regions with additional white matter changes found in the parietal regions. In bvFTD, white matter changes extended from frontotemporal into the posterior temporal and occipital regions, compared to the predominant reduction in grey matter of the frontal and anterior temporal lobes bilaterally. In contrast, while grey matter atrophy was present in the anterior temporal regions bilaterally in SD, changes in white matter tracts were observed in the left hemisphere only (Supporting Information Fig. 2).
Patterns of Longitudinal White Matter Changes in FTD Subtypes
Behavioral‐variant FTD
At 12 months, extensive bilateral changes continued in most white matter tracts across all DTI metrics compared to baseline measurements but also including the splenium of the corpus callosum. Longitudinal changes in FA and RadialD were concordant with each other and showed the most extensive changes among all metrics (Supporting Information Table SI) with some tracts spared using other DTI measures (right anterior cingulum and left superior longitudinal fasciculus in MD; bilateral anterior cingulum, superior and inferior longitudinal fasciculi in AxialD) (Fig. 1).
Figure 1.

TBSS results of longitudinal white matter changes in bvFTD. Voxelwise group changes from baseline are shown for FA, MD, AxialD, and RadialD (P < 0.05, corrected for family wise error multiple comparisons). Results are overlaid on sagittal, axial, and coronal sections of the MNI standard brain. L = left; R = right. [Color figure can be viewed in the online issue, which is available at http://wileyonlinelibrary.com.]
Progressive non‐fluent aphasia
After 12 months, additional white matter abnormalities were observed in this group (anterior thalamic radiation, anterior cingulum, uncinate fasciculus, genu of corpus callosum, and the brainstem), with the changes becoming more pronounced in the right compared to the left hemisphere (except for the anterior thalamic radiation which occurred on the left) (Fig. 2; Supporting Information Table SII). Longitudinal DTI changes were observed in FA, MD, and RadialD only. Changes in AxialD were observed in the inferior‐fronto‐occipital fasciculus only when using a more liberal significance threshold (P < 0.001 uncorrected).
Figure 2.

TBSS results of longitudinal white matter changes in PNFA. Voxelwise group changes from baseline are shown for FA, MD, and RadialD (P <0.05, corrected for family wise error multiple comparisons). No significant change was found in AxialD. Results are overlaid on sagittal, axial, and coronal sections of the MNI standard brain. L = left; R = right. [Color figure can be viewed in the online issue, which is available at http://wileyonlinelibrary.com.]
Semantic dementia
In contrast, progressive longitudinal white matter changes in the SD group extended into frontal (inferior‐fronto‐occipital fasciculus) and commissural tracts (splenium of the corpus callosum) at 12 months, with less progression in left temporal regions (no progression in cingulum) (Fig. 3). Longitudinal alterations in FA were most extensive compared to the other metrics in SD, particularly in frontal white matter regions (Supporting Information Table SIII). Longitudinal changes in AxialD were found in the left temporal region only at the P < 0.001 uncorrected for multiple comparisons.
Figure 3.

TBSS results of longitudinal white matter changes in SD. Voxelwise group changes from baseline are shown for FA, MD, and RadialD (P < 0.05, corrected for family wise error multiple comparisons). No significant result was found in AxialD. Results are overlaid on sagittal, axial, and coronal sections of the MNI standard brain. L = left; R = right. [Color figure can be viewed in the online issue, which is available at http://wileyonlinelibrary.com.]
Finally, given the age‐related changes affecting the white matter previously reported (Bartzokis et al., 2003; O'Sullivan et al., 2001; Salat et al., 2005), longitudinal analyses were also carried out in the control group in order to determine the ageing effect over 12 months. No significant changes in MD, AxialD and RadialD were observed between baseline and follow up scans. Small changes in FA were observed predominantly located in the frontal lobe white matter bilaterally (superior and inferior longitudinal fasciculi, inferior‐fronto‐occipital fasciculi and uncinate fasciculi). The magnitude of these changes, however, was about two to threefold less compared to the changes found in FTD groups over the same time period. These analyses confirmed that the white matter changes found in the FTD groups reflected disease, rather than ageing effects.
Overlaying White and Grey Matter Changes in FTD Subtypes After 12 Months
At the 12‐month follow up, the progression of white matter abnormalities appeared more pronounced and widespread than the progression of grey matter atrophy in all FTD subtypes (Fig. 4). In bvFTD, the progression of grey matter atrophy was localized to the right fronto‐temporal region while progressive white matter abnormalities were observed bilaterally. In PNFA, only additional white matter changes were detected in the temporo‐parieto‐occipital regions bilaterally at 12 months. In contrast, no significant grey matter changes were found over the same time period. When using a more liberal significance threshold (P < 0.001 uncorrected for multiple comparisons), grey matter atrophy was observed in the left superior frontal and lateral occipital cortices bilaterally. In SD, while bilateral white matter changes were observed in frontotemporal regions, only circumscribed additional left hippocampal grey matter atrophy occurred over the same 12‐month period (Fig. 4; Supporting Information Table SIV).
Figure 4.
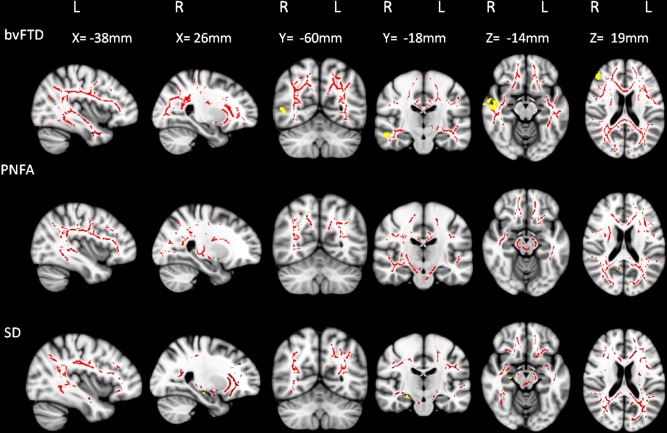
Longitudinal changes in white matter and grey matter in FTD subtypes. Changes in FA (red) and grey matter density (yellow) over a 12‐month period are illustrated for bvFTD, PNFA, and SD. All analyses were corrected for multiple comparisons at P < 0.05 for family wise error. No significant grey matter cluster was observed in PNFA. Results are overlaid on sagittal, axial, and coronal sections of the MNI standard brain. L = left; R = right. [Color figure can be viewed in the online issue, which is available at http://wileyonlinelibrary.com.]
DISCUSSION
This study reports longitudinal white matter changes in FTD subtypes. Our findings demonstrate specific profiles of white matter changes in each FTD subtype over a 12‐month period. Importantly, the location and severity of these changes varied depending on the DTI metrics used, indicating that white matter changes shown with different DTI measures may represent different pathological processes. Further, our investigations demonstrated that, over the course of 12 months, white matter abnormalities showed more extensive progression.
Our investigations revealed that most white matter changes identified at follow up co‐localized with the distribution of white matter abnormalities at baseline in all FTD subtypes. Importantly, however, the tissue abnormalities progressed to involve similar regions in the other hemisphere, giving rise to a bilateral, rather than focal, pattern of white matter change with disease progression. This progression is particularly dramatic in bvFTD where the orbito‐frontal and anterior temporal regions, which were most affected at baseline, continue to progress bilaterally at follow‐up, with additional posterior involvement, such as that of the splenium of the corpus callosum. Notably, this profile of white matter change was observed regardless of the metric used, and indicates a particularly early and rapidly progressive pathological change. The widespread and rapidly progressive white matter changes over time in bvFTD are consistent with the shorter life expectancy (Garcin et al., 2009; Onyike, 2011) and faster cognitive decline (i.e., ACE‐R or frontotemporal dementia rating scale) generally reported in these patients compared to the other FTD subtypes (Kipps et al., 2008; Piguet et al., 2011). In contrast, the longitudinal white matter changes found in PNFA were not as dramatic as those observed in bvFTD. Changes in this group appeared to remain relatively focal, even with progression, with the pattern of change over time involving more distant tracts connected to the primary site of brain atrophy. Of note, while none of the patients displayed clinical features of progressive supranuclear palsy at baseline or at the 12‐month review, significant white matter change was observed in the brainstem over the 1‐year period in this group. In addition, the only PNFA case coming to autopsy showed pathological distribution consistent with progressive supranuclear palsy, highlighting the close relationship between these disorders (Josephs et al., 2005; Rohrer et al., 2010). Our findings suggest that the brainstem may be particularly vulnerable with disease progression in this group, even in the absence of clinical indicators, such as extra pyramidal or oculomotor disturbance. Finally, in SD, longitudinal white matter changes became widespread affecting white matter tracts bilaterally. Temporal regions continued to be affected, with additional frontal lobe involvement as disease progresses.
Our analyses also uncovered that the spatial relations between white and grey matter changes varied over time in all FTD subtypes. At baseline, changes in white matter integrity, as measured by DTI, mapped relatively closely to the reduction in grey matter measured by VBM. At 12 months, however, the rate and location of change in the white and grey matter became uncoupled. Atrophy of the grey matter progressed only minimally over that time period with the damage remaining relatively focal. In contrast, white matter changes became widespread with bilateral alterations in frontotemporal regions and the damage encroaching into the posterior white matter in all FTD subtypes.
Co‐localization of white and grey matter abnormalities in FTD have been reported in some studies (Acosta‐Cabronero et al., 2011; Hornberger et al., 2010) but not others (Agosta et al., 2010, 2011; Mahoney et al., 2013; Schwindt et al., 2013; Zhang et al., 2013). Some studies have suggested that white matter abnormalities are an early marker of FTD as opposed to the volumetric grey matter loss occurring later in the disease (Agosta et al., 2010, 2011; Mahoney et al., 2013; Schwindt et al., 2013; Zhang et al., 2013). Our study confirms the extensive pathological changes in white matter in FTD, changes that tend to extend beyond those observed grey matter atrophy, particularly with disease progression. Our findings reveal different temporal and spatial patterns of white and grey matter pathology over time in FTD. Direct comparisons of the longitudinal changes affecting the white and grey matter need to be approached with caution, given the different imaging modalities used to investigate these two types of tissue. Nevertheless, the magnitude of white matter change observed over 12 months using DTI indicates that this methodology is sensitive and appropriate to measure disease progression in FTD subtypes, regardless of the grey matter changes.
Previous investigations of white matter changes in FTD have generally used FA as a single marker of white matter change. The combination of different DTI metrics (RadialD, AxialD, and MD), which measure different aspects of diffusion behavior in the white matter, appears more sensitive in detecting white matter changes in neurodegenerative conditions rather than the use of a single global diffusion measure such as FA (Acosta‐Cabronero et al., 2010). At baseline, MD and RadialD alterations were most severe in bvFTD and PNFA, while MD and AxialD abnormalities were most prominent in SD. At follow‐up, however, FA and RadialD revealed the most prominent changes in the white matter tracts in all three subtypes of FTD. These findings concord with those reported in Alzheimer's disease, where MD and AxialD were the first metrics to detect white matter alterations, while alterations in FA and RadialD became more pronounced with disease progression (Acosta‐Cabronero et al., 2012). Together, these data support the view that DTI metrics identify different underlying processes specific to the stage of the disease. These findings also likely explain the variable co‐localization between white and grey matter changes reported above, given the single DTI measurement obtained in previous studies.
Animal studies have suggested that a decrease in AxialD correlates with axonal degeneration while an increase in RadialD suggests myelin loss (Song et al., 2003). Our findings indicate that the combination of different DTI metrics across repeated MRIs may provide important biological cues about the underlying changes occurring in the different FTD subtypes over time. Human DTI data, however, require careful interpretation, given the greater structural heterogeneity using this indirect method compared with histopathological observations in animal models. Inclusion of grey matter, crossing fibers and residual misalignment may all cause changes to absolute diffusivities or eigenvalues which may not necessarily reflect underlying pathologies (Zhang et al., 2013). In addition, given the complexity of pathological changes affecting the white matter (altered myelination, neurodegeneration, gliosis, calcification, etc.; Sierra et al., 2011), a single diffusion metric is unlikely to correlate best with a unique pathological process (Acosta‐Cabronero et al., 2010; Mahoney et al., 2013; Pierpaoli et al., 2001). Further, unlike other dementia syndromes, the neuropathology of FTD is complex and remains often unpredictable in life. FTD subtypes share abnormal protein depositions of either tau (in bvFTD and PNFA), tar DNA binding protein 43 (in bvFTD and SD) or, in a small proportion, fused in sarcoma (in bvFTD; Davies et al., 2005; Hodges et al., 2004; Josephs et al., 2006; Knibb et al., 2006; Lee et al., 2012; Mackenzie et al., 2010; Mesulam et al., 2008). The variability in protein deposition within and across FTD subtypes likely contributes to the complexity in interpreting changes identified on diffusion‐weighted images. Postmortem histopathological confirmation of the type of change being detected in vivo with DTI overtime will clarify whether the relationships reported in animal studies hold in humans (Beaulieu, 2002; Song et al., 2003, 2002).
Longitudinal imaging studies in FTD are much less common than cross‐sectional investigations. Undoubtedly, longitudinal investigations present several challenges, not the least of which is to obtain good image quality in patients who are prone to head movements at two (or more) time points. In this study, another challenge was the limitations of TBSS in handling the registration process for longitudinal data, which may have increased the noise in the data. The undeniable advantage of longitudinal designs, however, is that they avoid the issue of inter‐subject variability. As study participants act as their own control, they provide reliable indices of change over time as the disease progresses. Arguably, our results need to be taken with some caution. Whilst all cases underwent systematic clinical and cognitive assessments and met the most recent clinical diagnostic criteria for FTD, pathological confirmation was available for only two cases. Although our sample size may appear small, it is in keeping with similar work investigating brain changes in other neurodegenerative disorders (Acosta‐Cabronero et al., 2011; Agosta et al., 2011; Mahoney et al., 2013; Schwindt et al., 2013).
CONCLUSION
This study investigated longitudinal white matter and grey matter changes concurrently in FTD. The results highlighted differential white matter changes at baseline and over a 12‐month period in the three FTD subtypes. Our data show that the patterns of white matter changes are specific to each subgroup of FTD and longitudinal white matter changes extend beyond those observed in the grey matter during the same time period, indicating that imaging of the brain white matter is particularly sensitive to identifying the progression of pathology in FTD. In addition, the progression of white matter abnormalities differs depending on the DTI metrics used, suggesting that alterations in diffusion metrics may detect different pathological processes occurring at different disease stages, although tissue validation of this concept is now required.
These findings have implication for clinical trials, particularly in bvFTD. The extensive involvement of the white matter pathology and its rapid progression over time, compared to grey matter atrophy, indicates that monitoring of these white matter changes may help to establish the impact of therapeutic treatments in FTD syndromes over a relatively short time period.
ACKNOWLEDGMENTS
We would like to acknowledge the contributions of frontotemporal dementia patients, their carers and control participants that were involved in this project.
Supporting information
Supporting Information
REFERENCES
- Acosta‐Cabronero J, Alley S, Williams GB, Pengas G, Nestor PJ (2012): Diffusion tensor metrics as biomarkers in Alzheimer's disease. PLoS One 7:e49072. [DOI] [PMC free article] [PubMed] [Google Scholar]
- Acosta‐Cabronero J, Patterson K, Fryer TD, Hodges JR, Pengas G, Williams GB, Nestor PJ (2011): Atrophy, hypometabolism and white matter abnormalities in semantic dementia tell a coherent story. Brain 134:2025–2035. [DOI] [PubMed] [Google Scholar]
- Acosta‐Cabronero J, Williams GB, Pengas G, Nestor PJ (2010): Absolute diffusivities define the landscape of white matter degeneration in Alzheimer's disease. Brain 133:529–539. [DOI] [PubMed] [Google Scholar]
- Agosta F, Henry RG, Migliaccio R, Neuhaus J, Miller BL, Dronkers NF, Brambati SM, Filippi M, Ogar JM, Wilson SM, Gorno‐Tempini ML (2010): Language networks in semantic dementia. Brain 133:286–299. [DOI] [PMC free article] [PubMed] [Google Scholar]
- Agosta F, Scola E, Canu E, Marcone A, Magnani G, Sarro L, Copetti M, Caso F, Cerami C, Comi G, Cappa SF, Falini A, Filippi M (2011): White matter damage in frontotemporal lobar degeneration spectrum. Cereb Cortex 22:2705–2014. [DOI] [PubMed] [Google Scholar]
- Andersson J, Jenkinson M, Smith S (2007a): Non‐linear optimisation. FMRIB technical report TR07JA1 from http://www.fmrib.ox.ac.uk/analysis/techrep. [Google Scholar]
- Andersson J, Jenkinson M, Smith S (2007b): Non‐linear registration, aka Spatial normalisation. FMRIB technical report TR07JA2 from http://www.fmrib.ox.ac.uk/analysis/techrep. [Google Scholar]
- Ashburner J, Friston KJ (2000): Voxel‐based morphometry—The mMethods. NeuroImage 11:805–821. [DOI] [PubMed] [Google Scholar]
- Barrick TR, Charlton RA, Clark CA, Markus HS (2010): White matter structural decline in normal ageing: A prospective longitudinal study using tract‐based spatial statistics. NeuroImage 51:565–577. [DOI] [PubMed] [Google Scholar]
- Bartzokis G, Cummings JL, Sultzer D, Henderson VW, Nuechterlein KH, Mintz J (2003): White matter structural integrity in healthy aging adults and patients with alzheimer disease: A magnetic resonance imaging study. Arch Neurol 60:393–398. [DOI] [PubMed] [Google Scholar]
- Beaulieu C (2002): The basis of anisotropic water diffusion in the nervous system: A technical review. NMR Biomed 15:435–455. [DOI] [PubMed] [Google Scholar]
- Boccardi M, Sabattoli F, Laakso MP, Testa C, Rossi R, Beltramello A, Soininen H, Frisoni GB (2005): Frontotemporal dementia as a neural system disease. Neurobiol Aging 26:37–44. [DOI] [PubMed] [Google Scholar]
- Borroni B, Brambati SM, Agosti C, Gipponi S, Bellelli G, Gasparotti R, Garibotto V, Di Luca M, Scifo P, Perani D, Padovani A (2007): Evidence of white matter changes on diffusion tensor imaging in frontotemporal dementia. Arch Neurol 64:246–251. [DOI] [PubMed] [Google Scholar]
- Davies RR, Hodges JR, Kril JJ, Patterson K, Halliday GM, Xuereb JH (2005): The pathological basis of semantic dementia. Brain 128:1984–1995. [DOI] [PubMed] [Google Scholar]
- Galantucci S, Tartaglia MC, Wilson SM, Henry ML, Filippi M, Agosta F, Dronkers NF, Henry RG, Ogar JM, Miller BL, Gorno‐Tempini ML (2011): White matter damage in primary progressive aphasias: A diffusion tensor tractography study. Brain 134:3011–3029. [DOI] [PMC free article] [PubMed] [Google Scholar]
- Garcin B, Lillo P, Hornberger M, Piguet O, Dawson K, Nestor PJ, Hodges JR (2009): Determinants of survival in behavioral variant frontotemporal dementia. Neurology 73:1656–1661. [DOI] [PMC free article] [PubMed] [Google Scholar]
- Good CD, Johnsrude IS, Ashburner J, Henson RNA, Friston KJ, Frackowiak RSJ (2001): A voxel‐based morphometric study of ageing in 465 normal adult human brains. NeuroImage 14:21–36. [DOI] [PubMed] [Google Scholar]
- Gorno‐Tempini ML, Dronkers NF, Rankin KP, Ogar JM, Phengrasamy L, Rosen HJ, Johnson JK, Weiner MW, Miller BL (2004): Cognition and anatomy in three variants of primary progressive aphasia. Ann Neurol 55:335–346. [DOI] [PMC free article] [PubMed] [Google Scholar]
- Gorno‐Tempini ML, Hillis AE, Weintraub S, Kertesz A, Mendez M, Cappa SF, Ogar JM, Rohrer JD, Black S, Boeve BF, Manes F, Dronkers NF, Vandenberghe R, Rascovsky K, Patterson K, Miller BL, Knopman DS, Hodges JR, Mesulam MM, Grossman M (2011): Classification of primary progressive aphasia and its variants. Neurology 76:1006–1014. [DOI] [PMC free article] [PubMed] [Google Scholar]
- Grossman M, Mickanin J, Onishi K, Hughes E, D'Esposito M, Ding X‐S, Alavi A, Reivich M (1996): Progressive nonfluent aphasia: Language, cognitive, and PET measures contrasted with probable Alzheimer's disease. J Cogn Neurosci 8:135–154. [DOI] [PubMed] [Google Scholar]
- Hodges JR, Davies RR, Xuereb JH, Casey B, Broe M, Bak TH, Kril JJ, Halliday GM (2004): Clinicopathological correlates in frontotemporal dementia. Ann Neurol 56:399–406. [DOI] [PubMed] [Google Scholar]
- Hodges JR, Patterson K (2007): Semantic dementia: A unique clinicopathological syndrome. Lancet Neurol 6:1004–1014. [DOI] [PubMed] [Google Scholar]
- Hodges JR, Patterson K, Oxbury S, Funnell E (1992): Semantic dementia: Progressive fluent aphasia with temporal lobe atrophy. Brain 115:1783–1806. [DOI] [PubMed] [Google Scholar]
- Hornberger M, Savage S, Hsieh S, Mioshi E, Piguet O, Hodges JR (2010): Orbitofrontal dysfunction discriminates behavioral variant frontotemporal dementia from Alzheimer's disease. Dement Geriatr Cogn Disord 30:547–552. [DOI] [PubMed] [Google Scholar]
- Josephs KA, Boeve BF, Duffy JR, Smith GE, Knopman DS, Parisi JE, Petersen RC, Dickson DW (2005): Atypical progressive supranuclear palsy underlying progressive apraxia of speech and nonfluent aphasia. Neurocase 11:283–296. [DOI] [PubMed] [Google Scholar]
- Josephs KA, Duffy JR, Strand EA, Whitwell JL, Layton KF, Parisi JE, Hauser MF, Witte RJ, Boeve BF, Knopman DS, Dickson DW, Jack CR Jr, Petersen RC (2006): Clinicopathological and imaging correlates of progressive aphasia and apraxia of speech. Brain 129:1385–1398. [DOI] [PMC free article] [PubMed] [Google Scholar]
- Kipps CM, Davies RR, Mitchell J, Kril JJ, Halliday GM, Hodges JR (2007): Clinical significance of lobar atrophy in frontotemporal dementia: Application of an MRI visual rating scale. Dement Geriatr Cogn Disord 23:334–342. [DOI] [PubMed] [Google Scholar]
- Kipps CM, Nestor PJ, Dawson CE, Mitchell J, Hodges JR (2008): Measuring progression in frontotemporal dementia: Implications for therapeutic interventions. Neurology 70:2046–2052. [DOI] [PubMed] [Google Scholar]
- Knibb JA, Xuereb JH, Patterson K, Hodges JR (2006): Clinical and pathological characterization of progressive aphasia. Ann Neurol 59:156–165. [DOI] [PubMed] [Google Scholar]
- Lee SE, Seeley WW, Poorzand P, Rademakers R, Karydas A, Stanley CM, Miller BL, Rankin KP (2012): Clinical characterization of bvFTD due to FUS neuropathology. Neurocase 18:305–317. [DOI] [PMC free article] [PubMed] [Google Scholar]
- Mackenzie I, Neumann M, Bigio E, Cairns N, Alafuzoff I, Kril J, Kovacs G, Ghetti B, Halliday G, Holm IE, Ince PG, Kamphorst W, Revesz T, Rozemuller AJ, Kumar‐Singh S, Akiyama H, Baborie A, Spina S, Dickson DW, Trojanowski JQ, Mann DM (2010): Nomenclature and nosology for neuropathologic subtypes of frontotemporal lobar degeneration: An update. Acta Neuropathol 119:1–4. [DOI] [PMC free article] [PubMed] [Google Scholar]
- Mahoney CJ, Malone IB, Ridgway GR, Buckley AH, Downey LE, Golden HL, Ryan NS, Ourselin S, Schott JM, Rossor MN, Fox NC, Warren JD (2013): White matter tract signatures of the progressive aphasias. Neurobiol Aging 34:1687–1699. [DOI] [PMC free article] [PubMed] [Google Scholar]
- Matsuo K, Mizuno T, Yamada K, Akazawa K, Kasai T, Kondo M, Mori S, Nishimura T, Nakagawa M (2008): Cerebral white matter damage in frontotemporal dementia assessed by diffusion tensor tractography. Neuroradiology 50:605–611. [DOI] [PubMed] [Google Scholar]
- Mesulam M, Wicklund A, Johnson N, Rogalski E, Léger GC, Rademaker A, Weintraub S, Bigio EH (2008): Alzheimer and frontotemporal pathology in subsets of primary progressive aphasia. Ann Neurol 63:709–719. [DOI] [PMC free article] [PubMed] [Google Scholar]
- Mioshi E, Dawson K, Mitchell J, Arnold R, Hodges JR (2006): The Addenbrooke's cognitive examination revised (ACE‐R): A brief cognitive test battery for dementia screening. Int J Geriatr Psychiatry 21:1078–1085. [DOI] [PubMed] [Google Scholar]
- Mori S, Oishi K, Jiang H, Jiang L, Li X, Akhter K, Hua K, Faria AV, Mahmood A, Woods R, Toga AW, Pike GB, Neto PR, Evans A, Zhang J, Huang H, Miller MI, van Zijl P, Mazziotta J (2008): Stereotaxic white matter atlas based on diffusion tensor imaging in an ICBM template. NeuroImage 40:570–582. [DOI] [PMC free article] [PubMed] [Google Scholar]
- Morris JC (1993): The clinical dementia rating (CDR): Current version and scoring rules. Neurology 43:2412. [DOI] [PubMed] [Google Scholar]
- Mummery CJ, Patterson K, Price CJ, Ashburner J, Frackowiak RSJ, Hodges JR (2000): A voxel‐based morphometry study of semantic dementia: Relationship between temporal lobe atrophy and semantic memory. Ann Neurol 47:36–45. [PubMed] [Google Scholar]
- Neary D, Snowden JS, Gustafson L, Passant U, Stuss D, Black S, Freedman M, Kertesz A, Robert PH, Albert M, Boone K, Miller BL, Cummings J, Benson DF (1998): Frontotemporal lobar degeneration: A consensus on clinical diagnostic criteria. Neurology 51:1546–1554. [DOI] [PubMed] [Google Scholar]
- O'Sullivan M, Jones DK, Summers PE, Morris RG, Williams SCR, Markus HS (2001): Evidence for cortical “disconnection” as a mechanism of age‐related cognitive decline. Neurology 57:632–638. [DOI] [PubMed] [Google Scholar]
- Oishi K, Zilles K, Amunts K, Faria A, Jiang H, Li X, Akhter K, Hua K, Woods R, Toga AW, Pike GB, Rosa‐Neto P, Evans A, Zhang J, Huang H, Miller MI, van Zijl PC, Mazziotta J, Mori S (2008): Human brain white matter atlas: Identification and assignment of common anatomical structures in superficial white matter. NeuroImage 43:447–457. [DOI] [PMC free article] [PubMed] [Google Scholar]
- Onyike CU (2011): What is the life expectancy in frontotemporal lobar degeneration? Neuroepidemiology 37:166–167. [DOI] [PMC free article] [PubMed] [Google Scholar]
- Pan P, Song W, Yang J, Huang R, Chen K, Gong QY, Zhong JG, Shi HC, Shang HF (2012): Gray matter atrophy in behavioral variant frontotemporal dementia: A meta‐analysis of voxel‐based morphometry studies. Dement Geriatr Cogn Disord 33:141–148. [DOI] [PubMed] [Google Scholar]
- Pierpaoli C, Barnett A, Pajevic S, Chen R, Penix L, Virta A, Basser P (2001): Water diffusion changes in Wallerian degeneration and their dependence on white matter architecture. NeuroImage 13:1174–1185. [DOI] [PubMed] [Google Scholar]
- Piguet O, Hornberger M, Mioshi E, Hodges JR (2011): Behavioural‐variant frontotemporal dementia: Diagnosis, clinical staging, and management. Lancet Neurol 10:162–172. [DOI] [PubMed] [Google Scholar]
- Rascovsky K, Hodges JR, Knopman D, Mendez MF, Kramer JH, Neuhaus J, van Swieten JC, Seelaar H, Dopper EGP, Onyike CU, Hillis AE, Josephs KA, Boeve BF, Kertesz A, Seeley WW, Rankin KP, Johnson JK, Gorno‐Tempini ML, Rosen H, Prioleau‐Latham CE, Lee A, Kipps CM, Lillo P, Piguet O, Rohrer JD, Rossor MN, Warren JD, Fox NC, Galasko D, Salmon DP, Black SE, Mesulam M, Weintraub S, Dickerson BC, Diehl‐Schmid J, Pasquier F, Deramecourt V, Lebert F, Pijnenburg Y, Chow TW, Manes F, Grafman J, Cappa SF, Freedman M, Grossman M, Miller BL (2011): Sensitivity of revised diagnostic criteria for the behavioural variant of frontotemporal dementia. Brain 134:2456–2477. [DOI] [PMC free article] [PubMed] [Google Scholar]
- Rohrer JD, Paviour D, Bronstein AM, O'Sullivan SS, Lees A, Warren JD (2010): Progressive supranuclear palsy syndrome presenting as progressive nonfluent aphasia: A neuropsychological and neuroimaging analysis. Mov Disord 25:179–188. [DOI] [PMC free article] [PubMed] [Google Scholar]
- Rosen HJ, Gorno‐Tempini ML, Goldman WP, Perry RJ, Schuff N, Weiner M, Feiwell R, Kramer JH, Miller BL (2002): Patterns of brain atrophy in frontotemporal dementia and semantic dementia. Neurology 58:198–208. [DOI] [PubMed] [Google Scholar]
- Salat DH, Tuch DS, Greve DN, van der Kouwe AJW, Hevelone ND, Zaleta AK, Rosen BR, Fischl B, Corkin S, Rosas HD, Dale AM (2005): Age‐related alterations in white matter microstructure measured by diffusion tensor imaging. Neurobiol Aging 26:1215–1227. [DOI] [PubMed] [Google Scholar]
- Schwindt GC, Graham NL, Rochon E, Tang‐Wai DF, Lobaugh NJ, Chow TW, Black SE (2013): Whole‐brain white matter disruption in semantic and nonfluent variants of primary progressive aphasia. Hum Brain Mapp 34:973–984. [DOI] [PMC free article] [PubMed] [Google Scholar]
- Seeley WW, Crawford R, Rascovsky K, Kramer JH, Weiner M, Miller BL, Gorno‐Tempini ML (2008): Frontal paralimbic network atrophy in very mild behavioral variant frontotemporal dementia. Arch Neurol 65:249–255. [DOI] [PMC free article] [PubMed] [Google Scholar]
- Sierra A, Laitinen T, Lehtimäki K, Rieppo L, Pitkänen A, Gröhn O (2011): Diffusion tensor MRI with tract‐based spatial statistics and histology reveals undiscovered lesioned areas in kainate model of epilepsy in rat. Brain Struct Funct 216:123–135. [DOI] [PubMed] [Google Scholar]
- Smith SM (2002): Fast robust automated brain extraction. Hum Brain Mapp 17:143–155. [DOI] [PMC free article] [PubMed] [Google Scholar]
- Smith SM, Jenkinson M, Johansen‐Berg H, Rueckert D, Nichols TE, Mackay CE, Watkins KE, Ciccarelli O, Cader MZ, Matthews PM, Behrens TE (2006): Tract‐based spatial statistics: Voxelwise analysis of multi‐subject diffusion data. NeuroImage 31:1487–1505. [DOI] [PubMed] [Google Scholar]
- Smith SM, Jenkinson M, Woolrich MW, Beckmann CF, Behrens TEJ, Johansen‐Berg H, Bannister PR, De Luca M, Drobnjak I, Flitney DE, Niazy RK, Saunders J, Vickers J, Zhang Y, De Stefano N, Brady JM, Matthews PM (2004): Advances in functional and structural MR image analysis and implementation as FSL. NeuroImage 23(Suppl 1):S208–S219. [DOI] [PubMed] [Google Scholar]
- Song S‐K, Sun S‐W, Ju W‐K, Lin S‐J, Cross AH, Neufeld AH (2003): Diffusion tensor imaging detects and differentiates axon and myelin degeneration in mouse optic nerve after retinal ischemia. NeuroImage 20:1714–1722. [DOI] [PubMed] [Google Scholar]
- Song S‐K, Sun S‐W, Ramsbottom MJ, Chang C, Russell J, Cross AH (2002): Dysmyelination revealed through MRI as increased radial (but unchanged axial) diffusion of water. NeuroImage 17:1429–1436. [DOI] [PubMed] [Google Scholar]
- Teipel SJ, Meindl T, Wagner M, Stieltjes B, Reuter S, Hauenstein K‐H, Filippi M, Ernemann U, Reiser MF, Hampel H (2010): Longitudinal changes in fiber tract integrity in healthy aging and mild cognitive impairment: A DTI follow‐up study. J Alzheimer's Dis 22:507–522. [DOI] [PubMed] [Google Scholar]
- Weaver KE, Richards TL, Liang O, Laurino MY, Samii A, Aylward EH (2009): Longitudinal diffusion tensor imaging in Huntington's disease. Exp Neurol 216:525–529. [DOI] [PMC free article] [PubMed] [Google Scholar]
- Whitwell JL, Anderson VM, Scahill RI, Rossor MN, Fox NC (2004): Longitudinal patterns of regional change on volumetric MRI in frontotemporal lobar degeneration. Dement Geriatr Cogn Disord 17:307–310. [DOI] [PubMed] [Google Scholar]
- Whitwell JL, Avula R, Senjem ML, Kantarci K, Weigand SD, Samikoglu A, Edmonson HA, Vemuri P, Knopman DS, Boeve BF, Petersen RC, Josephs KA, Jack CR Jr (2010): Gray and white matter water diffusion in the syndromic variants of frontotemporal dementia. Neurology 74:1279–1287. [DOI] [PMC free article] [PubMed] [Google Scholar]
- Zhang Y, Brady M, Smith S (2001): Segmentation of brain MR images through a hidden Markov random field model and the expectation‐maximization algorithm. IEEE Trans Med Imaging 20:45–57. [DOI] [PubMed] [Google Scholar]
- Zhang Y, Schuff N, Du A‐T, Rosen HJ, Kramer JH, Gorno‐Tempini ML, Miller BL, Weiner MW (2009): White matter damage in frontotemporal dementia and Alzheimer's disease measured by diffusion MRI. Brain 132:2579–2592. [DOI] [PMC free article] [PubMed] [Google Scholar]
- Zhang Y, Tartaglia MC, Schuff N, Chiang GC, Ching C, Rosen HJ, Gorno‐Tempini ML, Miller BL, Weiner MW (2013): MRI signatures of brain macrostructural atrophy and microstructural degradation in frontotemporal lobar degeneration subtypes. J Alzheimer's Dis 33:431–444. [DOI] [PMC free article] [PubMed] [Google Scholar]
Associated Data
This section collects any data citations, data availability statements, or supplementary materials included in this article.
Supplementary Materials
Supporting Information