

Abstract
The apolipoprotein E (APOE) ɛ4 allele is a well‐established genetic risk factor for Alzheimer's disease (AD). Recent research has demonstrated an APOE ɛ4‐mediated modulation of intrinsic functional brain networks in cognitively normal individuals. However, it remains largely unknown whether and how APOE ɛ4 affects the brain's functional network architecture in patients with AD. Using resting‐state functional MRI and graph‐theory approaches, we systematically investigated the topological organization of whole‐brain functional networks in 16 APOE ɛ4 carriers and 26 matched noncarriers with AD at three levels: global whole‐brain, intermediate module, and regional node/connection. Neuropsychological analysis showed that the APOE ɛ4 carriers performed worse on delayed memory but better on a late item generation of a verbal fluency task (associated with executive function) than noncarriers. Whole‐brain graph analyses revealed that APOE ɛ4 significantly disrupted whole‐brain topological organization as characterized by (i) reduced parallel information transformation efficiency; (ii) decreased intramodular connectivity within the posterior default mode network (pDMN) and intermodular connectivity of the pDMN and executive control network (ECN) with other neuroanatomical systems; and (iii) impaired functional hubs and their rich‐club connectivities that primarily involve the pDMN, ECN, and sensorimotor systems. Further simulation analysis indicated that these altered connectivity profiles of the pDMN and ECN largely accounted for the abnormal global network topology. Finally, the changes in network topology exhibited significant correlations with the patients' cognitive performances. Together, our findings suggest that the APOE genotype modulates large‐scale brain networks in AD and shed new light on the gene‐connectome interaction in this disease. Hum Brain Mapp 36:1828–1846, 2015. © 2015 Wiley Periodicals, Inc.
Keywords: connectomics, graph theory, functional connectivity, module, default mode, resting‐state fMRI
INTRODUCTION
The human apolipoprotein E (APOE) gene is located on chromosome 19 and has three polymorphic alleles (ɛ2, ɛ3, and ɛ4). Among the three alleles, the ɛ4 allele is a well‐established genetic vulnerability factor for Alzheimer's disease (AD) [Liu et al., 2013a]. APOE ɛ4 carriers are associated with a greater risk of developing AD and have a younger mean age at onset than noncarriers [Corder et al., 1993].
Neuropsychological studies have demonstrated that the APOE genotype significantly modulates multiple cognitive domains in patients with AD. For example, memory function has frequently been reported to be more impaired in APOE ɛ4 carriers [van der Flier et al., 2006], whereas executive function is more impaired in APOE ɛ4 noncarriers [Wolk et al., 2010]. Consistent with the cognitive findings, evidence from neuroimaging studies has demonstrated that APOE ɛ4 carriers exhibited greater medial temporal lobe atrophy [Agosta et al., 2009; Wolk et al., 2010], whereas noncarriers had greater frontal atrophy [Wolk et al., 2010]. Despite these advances, this literature predominantly focuses on APOE genotype‐mediated modulation of local brain morphology in AD, and surprisingly limited work examines how the APOE genotype modulates disease phenotype from an integrative network perspective.
The human brain operates naturally as a complex network to integrate various information inputs across segregated sensory systems. This network can be mapped using various neuroimaging techniques (e.g., functional MRI, structural MRI and diffusion MRI) and further characterized by graph theory. Using these methods, the human brain networks demonstrate several nontrivial topological configurations, such as small‐worldness and highly connected hubs [Bullmore and Sporns, 2009; van den Heuvel and Sporns, 2013]. Intriguingly, disruptions in these configurations have consistently been reported in AD and its preclinical stage [He et al., 2008; Lo et al., 2010; Stam et al., 2007; Wang et al., 2013], which highlights the power of graph‐based analysis in the elucidation of the brain mechanisms that underlie AD [Tijms et al., 2013; Toga and Thompson, 2013]. Regarding APOE ɛ4, one previous study demonstrated that APOE ɛ4 accelerated the age‐related decline in the local interconnectivity of structural brain networks in cognitively intact subjects [Brown et al., 2011]. However, it remains largely unknown whether and how APOE ɛ4 modulates the topological organization of whole‐brain networks in patients with AD. The investigation of this issue will significantly advance our understanding of genetic effects on disease phenotype.
Here, we used resting‐state functional MRI (R‐fMRI) [Biswal et al., 1995] and graph‐theory approaches to systematically investigate APOE ɛ4‐mediated modulation of the topological organization of whole‐brain functional networks in AD. R‐fMRI data were collected from 42 AD patients, including 16 APOE ɛ4 carriers and 26 matched noncarriers. APOE ɛ4‐related effects were explored at three levels of globally whole‐brain topology, intermediately modular architecture and regionally nodal/connectional connectivity strength. We hypothesize that the APOE ɛ4 allele profoundly affects functional brain networks in AD at all three levels studied.
MATERIALS AND METHODS
Participants
Patients with AD were prospectively recruited to establish a case registry at the Dementia Care and Research Center, Peking University Institute of Mental Health. Following enrollment, each participant underwent a thorough clinical examination, a neuropsychological battery test, laboratory tests, and multimodal brain MRI examinations. The participants in the registry were also invited to undergo follow‐up examinations at 6‐month intervals. For the purpose of this study, we selected participants (registered between June 2007–Sept. 2009) who had a baseline diagnosis of AD and had completed an MRI examination prior to the initiation of nootropic medication (n = 74). The patients were all Chinese Han and right‐handed. At baseline, they had a clinical dementia rating (CDR) score of 0.5, 1, or 2 [Morris, 1993]. The clinical diagnosis of AD was made based on the criteria for dementia cited in the International Classification of Diseases, 10th Revision (ICD‐10) [World Health Organization, 1999] and the criteria for probable AD of the National Institute of Neurological and Communicative Disorders and the Stroke/Alzheimer Disease and Related Disorders Association (NINCDS‐ADRDA) [McKhann et al., 1984]. Participants were excluded if they presented with structural abnormalities that could result in dementia, such as cortical infarction, tumor or subdural hematoma, or if they had concurrent illnesses other than dementia that interfered with cognitive function at the time of the MRI examination. The selected AD patients were further screened for the APOE genotype and classified as APOE ɛ4 carriers (ɛ3/ɛ4 or ɛ4/ɛ4) and APOE ɛ4 noncarriers (ɛ3/ɛ3). The subjects who carried the APOE ɛ2 allele were excluded because of its potential protective effect identified in epidemiological surveys [Talbot et al., 1994]. After a final visual inspection of the MR images, 42 subjects were selected for this study, including 16 APOE ɛ4 carriers (13 ɛ3/ɛ4 and 3 ɛ4/ɛ4) and 26 noncarriers. Of the 42 very mild to moderate AD patients, 23 patients had a CDR score of 0.5, 15 patients had a CDR score of 1 and 4 patients had a CDR score of 2. There were no differences in the CDR distribution between the groups (P = 0.831). Informed consent was obtained from each participant, and this study protocol was approved by the institutional review board of the Peking University Institute of Mental Health.
APOE Genotyping
DNA was isolated from 10 ml EDTA with a blood QIAamp® DNA Blood Mini Kit (Qiagen, Hilden, Germany) according to standard procedures. APOE genotyping was performed as previously described [Wenham et al., 1991]. Genotype scorers (XW and HL) were blind to the identity of the samples. Eighteen samples were further evaluated using this sequencing technique, and the results were consistent with the APOE genotyping results obtained using the PCR‐RFLP method, which verified our approach.
Neuropsychological Assessment
Overall cognitive function was evaluated using the Chinese version of the Mini‐Mental State Examination (MMSE) and the Cognitive Abilities Screening Instrument (CASI) [Teng et al., 1994]. All participants were administered the cross‐cultural neuropsychological test battery (CCNB) [Dick, 2002], including the CASI [Teng et al., 1994], the Common Objects Memory Test (COMT) [Kempler et al., 2010], body part naming, the Consortium to Establish a Registry for Alzheimer's disease (CERAD) verbal category fluency, auditory comprehension, read and set time, CERAD drawing [Fillenbaum et al., 2008], digit span (forward and backward), picture completion, and Trail‐Making Test A. Because previous studies have identified greater memory deficits in ɛ4 carriers [Lehtovirta et al., 1996; Smith et al., 1998], whereas more impaired executive functions have been described in ɛ4 noncarriers [Johnson et al., 1999; Lehtovirta et al., 1996], we focused in particular on the t COMT for episodic memory and the CERAD verbal category fluency for animal names, which is considered a measure of language and executive function.
The COMT was developed as a culture fair measure of recent memory specifically for the CCNB [Dick et al., 2002; Kempler et al., 2010]. This test was administered using standardized procedures as previously described [Dick et al., 2002; Kempler et al., 2010]. Briefly, the subject was shown a set of ten 3 × 5″ color photographs of common objects (e.g., button, chair, and clock) across three learning trials; the subjects were required to immediately recall as many objects as possible during each trail. After the third trial, the examinee engaged in a brief distracter task (e.g., CERAD figure drawing) for 3 to 5 min and was subsequently asked again to recall the items. The 5‐min delayed recall was immediately followed by a recognition test in which ten original objects were interspersed with ten distracters. The subject was asked to indicate with a simple “Yes” or “No” whether an item was observed in the original three learning tests. The distracter objects were similar to the original objects regarding the visual complexity and without distinctive details. Long‐term retention of the original objects was assessed after a 30‐min delay using tests of recall and recognition, with a different set of ten distracters. Responses during three learning with immediate free recall trials and the responses during the subsequent two delayed recall and recognition trials were used to assess the performance of recent memory.
The verbal fluency test for animal naming was also used to measure executive function. The examinees were asked to name “all the animals you can think of in one minute.” The examinees received credit for naming general categories, as well as specific examples. Repeated responses were counted only once. Finally, the CDR was used for the global evaluation of dementia [Morris, 1993].
Image Acquisition
All MRI scans were performed on a 3.0 Tesla MR system (Siemens Magnetom Trio Tim system, Germany) using a standard head coil. During the entire scanning procedure, cushions and headphones were used to reduce subject motion and scanner noise. R‐fMRI data were collected using an echo‐planar imaging sequence: 30 axial slices; repetition time (TR) = 2000 ms; echo time (TE) = 30 ms; flip angle (FA) = 90°; slice thickness = 4.0 mm; gap = 0.8 mm; matrix = 64 × 64; and field of view (FOV) = 220 × 220 mm2. During scanning, the participants were instructed to keep their eyes closed, relax their minds, and remain motionless as much as possible but to not fall asleep. The R‐fMRI scan lasted for 420 s. Additionally, individual high‐resolution anatomical images were acquired using a T1‐weighted three‐dimensional volumetric magnetization‐prepared rapidly acquired gradient‐echo sequence: 192 slices; TR = 2530 ms; TE = 3.44 ms; FA = 7°; time inversion = 1100 ms; slice thickness = 1.0 mm; no gap; matrix = 256 × 256; and FOV = 256 × 256 mm2.
Image Preprocessing
The R‐fMRI data preprocessing was performed using the GRETNA toolbox (http://www.nitrc.org/projects/gretna/) based on SPM8 (http://www.fil.ion.ucl.ac.uk/spm/software/spm8/). After removing the first five volumes, the functional images were corrected for intravolume time offsets and intervolume geometrical displacements. None of the participants were excluded based on the criterion of a displacement > 3 mm or an angular rotation > 3 degrees in any direction. The summary scalars of head motion were matched between the APOE ɛ4 carriers and noncarriers (all P > 0.107), including the maximum, root mean square, and mean frame‐wise displacement (FD). All corrected functional data were then normalized to the Montreal Neurological Institute (MNI) space using an optimum 12‐parameter affine transformation and nonlinear deformations and resampled to a 3‐mm isotropic resolution. The resulting images were further temporally band‐pass filtered (0.01–0.1 Hz) to reduce the effects of low‐frequency drift and high‐frequency physiological noise. Linear trends were also removed. Finally, several nuisance signals were regressed out from each voxel's time course, including six head‐motion profiles derived from realignment, mean white matter (WM), and cerebrospinal fluid (CSF) time series within brain masks derived from prior probability maps in SPM8 (threshold = 0.8) and their first derivatives.
Structural data preprocessing was performed using the VBM8 toolbox for SPM8 (http://dbm.neuro.uni-jena.de/software/). Briefly, individual gray matter volume (GMV) maps were obtained through the following steps: (i) segmentation of individual structural images into gray matter (GM), WM, and CSF based on an adaptive Maximum A Posterior technique; (ii) normalization of the resulting GM maps into the MNI space using a high‐dimensional dartel approach; (iii) nonlinear modulation of GM maps to compensate for spatial normalization effects; and (iv) spatial smoothing of GM maps using a 6‐mm full width at half maximum Gaussian kernel.
Network Construction
In this study, functional brain networks were constructed at the macroscale with nodes representing brain regions and edges representing interregional resting‐state functional connectivity (RSFC). To define the network nodes, we divided the brain into 1,024 equally sized regions of interest (ROIs) based on a high resolution, randomly generated brain atlas [Zalesky et al., 2010b]. This random parcelation method ensures higher functional homogeneity within ROIs than anatomically defined atlases [Craddock et al., 2012], and the spatial scale (i.e., 1,024 ROIs) is reasonable for an exploratory study of network properties [Fornito et al., 2010]. Of note, the ROIs were restricted within an intersection between a study specific EPI mask and a GM mask based on the probability map in SPM8 (threshold = 0.2). To measure the RSFC, we calculated pairwise Pearson correlation coefficients and their significance levels (i.e., P‐values) among the 1,024 ROIs in their mean time series. Similar to previous studies [Bassett et al., 2011; Tijms et al., 2014; Wang et al., 2013], a significance level‐based method was applied to individual correlation matrices to de‐noise spurious interregional correlations. Specifically, a threshold of P < 0.05 (Bonferroni corrected) was used to ensure only elements that survived this statistical threshold were retained. This thresholding procedure effectively avoids erroneous evaluations of network topology [Toppi et al., 2012]. Notably, negative correlations were also excluded in this study because of their ambiguous interpretation [Fox et al., 2009; Murphy et al., 2009; Weissenbacher et al., 2009] and detrimental effects on test–retest reliability [Wang et al., 2011]. Finally, a weighted network was obtained for each participant.
Network Metrics
All network measures used in this study, including global efficiency, local efficiency, modularity, rich‐club coefficient and nodal strength, are explained in the context of a weighted network with nodes and edges. For details on the uses and interpretations of these network measures, see [Rubinov and Sporns, 2010].
Network efficiency
Efficiency is a biologically relevant metric to describe brain networks from the perspective of parallel information flow [Achard and Bullmore, 2007; Latora and Marchiori, 2001] and can be described at global and local levels. Mathematically, the global efficiency is defined as:
| (1) |
where is the shortest path length between node and node in and is calculated as the smallest sum of edge lengths throughout all possible paths from node and node . The length of an edge was designated as the reciprocal of the edge weight (i.e., correlation coefficient), which can be interpreted as a functional distance (a high correlation coefficient corresponds to a short functional distance). The global efficiency measures the ability of parallel information transmission over the network. The local efficiency of is measured as:
| (2) |
where is the global efficiency of , the subgraph composed of the neighbors of the node (i.e., nodes linked directly to node ). The local efficiency measures the fault tolerance of the network, which indicates the capability of information exchange for each subgraph when the index node is eliminated.
Modularity
The modularity for a given partition of a weighted network is defined as:
| (3) |
where is the number of modules, is the total weight of the network, is the sum of the connectional weights between all nodes in module and is the sum of the nodal strength (see below for the definition of nodal strength) in module . Therefore, represents the fraction of the total connectional weight for the edges in module divided by the total connectional weight for the edges in the whole network; represents the fraction of the total nodal strength for the nodes in module divided by the total nodal strength for the nodes in the whole network. For a network in which the edges fall between nodes without regard for the modules they belong to, we would expect the fraction of the total connectional weights for the edges that link the nodes in module i to the nodes in module j to be equal to . Therefore, the modularity measures the fraction of within‐module edge weights in an actual network minus the expected value of this fraction in a network with the same community divisions, but the connections are randomly arranged between the nodes [Newman and Girvan, 2004]. The aim of the module identification process is to find a specific partition that yields the largest network modularity. Here, we detected the modular structure using a spectral optimization algorithm [Newman, 2006].
Rich‐club coefficient
Rich‐club coefficient was originally proposed to quantify the connectivity density among a specific set of highly connected nodes (i.e., hubs) in a network [Opsahl et al., 2008; Zhou and Mondragón, 2004]. For a binary network, the rich‐club coefficient is calculated as the ratio of the total number of connections among a specific set of nodes with a degree (degree is defined as the number of edges that directly link to a given node) larger than k divided by the maximum possible number of connections among this set of nodes:
| (4) |
where denotes the number of nodes with a degree larger than k in the network and indicates the total number of connections among the nodes. For a weighted network, the rich‐club coefficient is calculated as the ratio of the sum of weights for the connections among the nodes ( ) divided by the sum of weights for the strongest connections in the whole network:
| (5) |
where is a weight vector for all connections in the network ranked in descending order. In this study, the weighted rich‐club coefficient was separately calculated among the nodes (i) in the whole functional networks to identify the rich‐club structures in the brain; and (ii) in the connected component that exhibited significant APOE ɛ4‐related effects on interregional functional connectivity (see Results). This enables us to examine whether APOE ɛ4‐related effects are mainly manifested in the rich‐club structures of the brain.
Nodal strength
Nodal strength is a simple but test–retest reliable measure to characterize nodal centrality [Cao et al., 2014; Wang et al., 2011] and is calculated as the sum of connectional weights (i.e., correlation coefficients) across all edges that directly link to a given node. A node with a high nodal strength indicates high interconnectivity with other nodes and, therefore, can be categorized as a hub.
Null Model of Random Networks
To determine whether the constructed brain networks were topologically organized into small‐world and modular architectures, the local efficiency, global efficiency, and modularity were normalized by the corresponding mean derived from 100 random networks, which preserved the same number of nodes, edges and degree distributions as the real brain networks [Maslov and Sneppen, 2002; Milo et al., 2002]. Typically, a network is said to be small‐world if it has a normalized local efficiency larger than 1 and a normalized global efficiency approximately equal to 1 [Watts and Strogatz, 1998] and is modular if it has a normalized modularity greater than 1. Of note, there are several other alternative null models [Bialonski et al., 2011; Zalesky et al., 2012].
Statistical Analysis
Between‐group differences in all network attributes were inferred using nonparametric permutation tests. Briefly, for each metric, we initially calculated the between‐group difference in their mean values. An empirical distribution of the difference was then obtained by randomly reallocating all values to two groups and recomputing the mean differences between the two randomized groups (10,000 permutations). The 95th percentile points of the empirical distribution were used as critical values in a one‐tailed test to determine whether the observed real‐group difference occurred by chance. Notably, prior to the permutation tests, multiple linear regressions were applied to remove the effects of age, gender, education level, and CDR‐SB score. Given the residual effects of head motion on connectivity and network metrics demonstrated in recent studies [Power et al., 2012; Satterthwaite et al., 2012; Van Dijk et al., 2012], the maximum, root mean square, and mean frame‐wise head motion were also added as covariates during the permutation procedure.
To localize the specific connections that had different connectivity strengths between the APOE ɛ4 carriers and noncarriers, we used a network‐based‐statistic (NBS) approach [Zalesky et al., 2010a]. In brief, a primary cluster‐defining threshold (P < 0.01) was first used to identify suprathreshold connections based on t‐statistics of two‐sample one‐side independent‐sample t‐tests, which were implemented in an edge‐wise manner and restricted to the connections that existed in at least 80% of the participants. All connected components within the suprathreshold connections were then identified, and their corresponding sizes (i.e., number of edges) were determined. A corrected P‐value was finally calculated for each connected component using the null distribution of maximal connected component size, which was empirically derived using a permutation approach (10,000 permutations). The null distribution was obtained as follows: (i) all participants were reallocated to two random groups (16 participants in one group and 26 participants in the other group); (ii) two‐sample t‐tests were performed between the two random groups on the same sets of connections as above (i.e., connections that were significantly non‐zeros in at least 80% of the participants); (iii) the supra‐threshold connections were determined using the same threshold as above (i.e., P < 0.01); (iv) all connected components formed by these connections were identified; (v) the size of the maximal component (i.e., with maximal number of edges) was recorded; (vi) Steps 1–5 were repeated (10,000 times in this study). Following these procedures, a null distribution of the maximal connected component size was obtained (10,000 × 1 array). Based on this null distribution, the corrected P‐value for a connected component of size M identified in the correctly grouped data was determined by calculating the proportion of the 10,000 permutations for which the maximal connected component was larger than M. Notably, age, gender, education level, CDR‐SB score, and head motion parameters were also controlled for during the NBS procedure.
Simulation Analysis
In this study, we found that the modular and nodal/connectional analyses jointly indicated that the posterior default mode network (pDMN) and executive control network (ECN) exhibited the most salient effects of the APOE genotype (see Results). To determine the extent to which the connectivity differences associated with these two modules contributed to the observed between‐group differences in global network metrics, we performed further simulation analyses using two strategies. Strategy i): we first deleted all nodes (and their connections) associated with the pDMN and ECN modules from each individual network. We then calculated the normalized global efficiency for the resulting networks and compared their differences between the APOE ɛ4 carriers and noncarriers using nonparametric permutation tests. The normalized global efficiency was chosen because it is the only measure that exhibits APOE ɛ4 effects even after controlling for the confounding effects of network density and weight (for details, see Results section). Strategy (ii): we replaced all connections associated with the pDMN and ECN modules in the APOE ɛ4 carriers with the connections extracted from the APOE ɛ4 noncarriers. Briefly, for each APOE ɛ4 carrier, all connections that linked nodes within the pDMN and ECN were reset to zero and then filled with corresponding connectional weights of a randomly selected APOE ɛ4 noncarrier. Thus, 16 simulated networks of APOE ɛ4 carriers were obtained, which were subsequently contrasted with the real networks of the APOE ɛ4 noncarriers with respect to normalized global efficiency. This replacement procedure was performed 100 times to construct an empirical distribution of the differences that enable us to test whether the observed real between‐group differences could be significantly reduced. To test the robustness, five rounds of the entire process of strategy (ii) were implemented, which resulted in 16 × 100 × 5 = 8,000 simulated networks.
Validation Analysis
We performed the following validation analyses by considering the effects of brain morphology, head motion, GM mask, thresholding procedure, and gene dose on our main findings.
i. Morphological GMV. Previous studies have shown that APOE ɛ4 significantly modulates GM morphology in patients with AD [e.g., Agosta et al., 2009; Wolk et al., 2010]. To determine whether and to what extent the potential between‐group differences in GM morphology contribute to functional alterations, we calculated the mean GMV for each ROI and each participant and treated these values as covariates during the between‐group nodal strength comparisons.
ii. Head Motion. In this study, we first used a simple but efficient strategy to correct for residual head motion by treating gross (i.e., maximum and root mean square) and micro (i.e., FD) head motion as covariates for the group‐level comparisons [Fair et al., 2012]. We also used a scrubbing approach to censor “bad” volumes with FD > 0.2 mm [Power et al., 2012] to test the robustness of our findings against different head‐motion correction strategies.
iii. GM Mask. Consistent with our previous study [Wang et al., 2013], we restricted our analyses within a GM mask by applying a liberal threshold (0.2) to the GM probability map provided in SPM. To estimate whether our findings were sensitive to the choices on this probability threshold, we reanalyzed our data using a GM probability weighted method. Specifically, for each participant, the representative time series for each ROI was computed as the weighted average of all voxels' time series in the ROI with the weights representing the GM probability values that corresponded to these voxels. Individual inter‐ROI correlation matrices were subsequently obtained, followed by global and nodal network analyses.
iv. Thresholding Procedure. In this study, we utilized a statistical significance‐based thresholding method to statistically determine individual network densities rather than setting the values a priori. This approach enabled the examination of the absolute intrinsic network organization. However, this method resulted in different network densities and overall weights between the APOE ɛ4 carriers and noncarriers (see Results), which may confound the between‐group comparisons [Ginestet et al., 2011; van Wijk et al., 2010]. Thus, we also assessed the relative network organization as a complementary analysis by ensuring the same level of network density (density = 6, 8.3, 10, and 12%; 8.3% is the minimum network density across the participants based on the significance‐based thresholding method) and connectivity weight (overall mean = 1) for all networks.
v. Gene Dose. The APOE ɛ4 carriers in this study comprised 13 heterozygotes (i.e., ɛ3/ɛ4) and three homozygotes (i.e., ɛ4/ɛ4). To account for potential gene dose‐related effects, we reanalyzed our main results after the exclusion of the three homozygous APOE ɛ4 carriers.
RESULTS
Participant Demographic, Clinical, and Cognitive Data
There were no significant (all Ps > 0.05) differences in age, gender, years of education, duration of illness, or severity of dementia measured using the CDR‐SB between the APOE ɛ4 carriers and noncarriers. After controlling for these factors, the APOE ɛ4 carriers exhibited lower MMSE scores [t(36) = 2.283, P = 0.029], poorer performances on the 5‐min [t(33) = −3.622, P = 0.001] and 30‐min [t(33) = −2.828, P = 0.012] recognition and a trend toward poorer performances on the verbal fluency test during the first 15 s [t(33) = 2.026, P = 0.051] than the noncarriers. In contrast, the carriers performed better than the noncarriers on the verbal fluency test during the 46–60 s time period [t(33) = 3.319, P = 0.002]. All data are summarized in Table 1.
Table 1.
Demographics, clinical, and cognitive characteristics of the participants
| Carriers (n = 16) | Noncarriers (n = 26) | P value | |
|---|---|---|---|
| Age (yrs) | 79.3 (5.1) | 76.5 (5. 3) | 0.104 |
| Sex (M/F) | 4/12 | 9/17 | 0.513 |
| Education (yrs) | 13.6 (2.8) | 13.1 (4.2) | 0.711 |
| Illness duration (yrs)b | 3.5 (1.8) | 2.3 (1.7) | 0.065 |
| CDR‐SB | 5.1 (2. 5) | 4.3 (2.0) | 0.252 |
| MMSE | 19.6 (3.6) | 22.0 (2.9) | 0.029a |
| CASI | 76.9 (11.0) | 79.9 (7.5) | 0.187 |
| COMT | |||
| Immediate object memory‐trial 1c | 3.6 (1.2) | 4.2 (1.5) | 0.827 |
| Immediate object memory‐trial 2c | 5 (1.3) | 5.4 (1. 9) | 0.918 |
| Immediate object memory‐trial 3c | 4.9 (1.2) | 6.0 (1.8) | 0.090 |
| Immediate object memory‐mean | 4.7 (1.1) | 5.2 (1.6) | 0.210 |
| Free delayed recall‐5minc | 2.0 (1.8) | 3.3 (2.6) | 0.108 |
| Recognition‐5 minc | 15.9 (2.2) | 18.3 (1.8) | 0.001a |
| Free delayed recall‐30 minc | 1.6 (1.8) | 3.1 (3.0) | 0.129 |
| Recognition‐30 minc | 16.0 (3.4) | 18.7 (1.5) | 0.012a |
| Body part naming | 10.0 (0) | 10.0 (0) | 0.999 |
| Auditory comprehensionc | 22.9 (2.1) | 23.8 (1.0) | 0.288 |
| Read time | 4.8 (1.6) | 5.0 (1.4) | 0.502 |
| Set time | 5.4 (2.7) | 5.4 (2.41) | 0.814 |
| Verbal fluencyc | 12.9 (2.9) | 11.5 (2.7) | 0.096 |
| Verbal fluency (0–15 s)c | 5.8 (2.7) | 7.5 (2.6) | 0.051 |
| Verbal fluency (16–30 s)c | 3.5 (2.8) | 2.7 (1.9) | 0.255 |
| Verbal fluency (31–45 s)c | 1.7 (1.3) | 1.6 (1.9) | 0.894 |
| Verbal fluency (46–60 s)c | 1.7 (0.8) | 0.8 (0.9) | 0.002a |
| Picture completionc | 6 (2.4) | 5.6 (2.3) | 0.269 |
| Digit spanc | 14 (4.8) | 13.6 (3.3) | 0.701 |
| Digit span‐forwardc | 8.6 (2.4) | 8.2 (2.1) | 0.629 |
| Digit span‐backwardc | 5.4 (2.8) | 5.8 (3.0) | 0.767 |
| CERAD drawing | 9.4 (2.0) | 9.7 (1.8) | 0.162 |
| Trail‐Making Test A‐time (s)c | 139.2 (80.5) | 97.5 (48.1) | 0.091 |
| Trail‐Making Test A‐errorsc | 1.0 (1.6) | 0.5 (0.9) | 0.297 |
Data are presented as mean (SD). P values were obtained with two‐tailed Chi‐square test for sex and two‐tailed two‐sample t tests for the others. CDR‐SB: Clinical Dementia Rating, sum of box; MMSE: mini‐mental state examination; CASI: cognitive ability screening instrument; COMT: common object memory test; CERAD: Consortium to Establish a Registry for Alzheimer's disease.
P < 0.05.
Data were missing for eight patients.
Data were missing for three patients.
Individual Functional Brain Networks
In this study, individual functional brain networks were obtained by calculating pairwise Pearson correlations among 1,024 ROIs. The overall level of intra‐ROI functional homogeneity (i.e., the mean pairwise Pearson correlation among the voxels in each ROI) was high (0.321 ± 0.074, averaged across ROIs and participants). The proportion of significantly (P < 0.05, Bonferroni corrected) negative correlations was extremely small with respect to positive correlations (3.2 ± 4.1%). After excluding the negative correlations, a positive, weighted network was obtained for each participant whose largest connected components covered almost all ROIs (1,022 nodes for 1 participant, 1,023 nodes for 7 participants and 1,024 nodes for 34 participants). Compared with the noncarriers, the APOE ɛ4 carriers had fewer number of connections (P = 0.009, Cohen's d = 0.527) and lower overall connectivity weights (P = 0.011, Cohen's d = 0.521) in their positive, weighted brain networks.
Global Level APOE ɛ4‐related Alterations: Whole‐brain Topology
All individual brain networks exhibited higher local efficiency but approximately equal global efficiency and higher modularity than the matched random networks, which indicates small‐world and modular organizations for both groups (Table 2). Quantitative between‐group comparisons revealed that the APOE ɛ4 carriers exhibited significantly different network organization compared with the noncarriers, as characterized by decreased local efficiency (P = 0.021, Cohen's d = 0.431), global efficiency (P = 0.012, Cohen's d = 0.529) and normalized global efficiency (P = 0.004, Cohen's d = 0.718), increased modularity (P = 0.017, Cohen's d = 0.443), and normalized modularity (P = 0.013, Cohen's d = 0.630; Table 2).
Table 2.
Global network topology in the APOE ε4 carriers and noncarriers
| Network metric | Carriers | Noncarriers | P value |
|---|---|---|---|
| Local efficiency | 0.412 ± 0.036 | 0.435 ± 0.065 | 0.021 |
| Global efficiency | 0.301 ± 0.047 | 0.338 ± 0.087 | 0.012 |
| Modularity | 0.300 ± 0.100 | 0.250 ± 0.126 | 0.017 |
| Normalized local efficiency | 1.115 ± 0.109 | 1.096 ± 0.114 | 0.074 |
| Normalized global efficiency | 0.843 ± 0.040 | 0.877 ± 0.051 | 0.004 |
| Normalized modularity | 5.661 ± 1.075 | 4.750 ± 1.738 | 0.013 |
Functional brain networks of both the APOE ɛ4 carriers and noncarriers had higher local efficiency, lower global efficiency and higher modularity than 100 matched random networks (all Ps < 0.001), indicating small‐worldness and modular organizations. Nevertheless, significant between‐group differences were observed in small‐world parameters and modularity, indicating an evident modulation of APOE ɛ4 allele on global network architecture in AD.
Intermediate Level APOE ɛ4‐related Alterations: Intramodule and Intermodule Integration
Based on the mean connectivity of the APOE ɛ4 noncarriers, we identified six modules (Q = 0.562, P < 0.001): anterior default mode network (aDMN), pDMN, ECN, salience network (SAN), sensorimotor network (SMN), and visual network (VN; Fig. 1A). This modular pattern was highly conserved for the APOE ɛ4 carriers (normalized mutual information = 0.660). On the basis of this modular architecture, we found that the pDMN exhibited decreased intramodule connectivity in the APOE ɛ4 carriers compared with the noncarriers (P < 0.05, False Discovery Rate corrected, Fig. 1B). Moreover, both the pDMN and ECN modules exhibited reduced connectivity with several other modules (P < 0.05, False Discovery Rate corrected, Fig. 1B), which suggests a selective APOE ɛ4‐mediated regulation of both intramodule and intermodule integrations.
Figure 1.
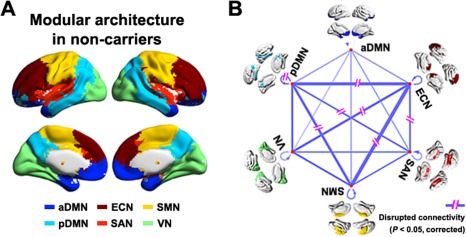
The Effects of APOE ɛ4 on intermediate modular structure. Six modules were identified for the group‐level mean network of APOE ɛ4 noncarriers (A) including the aDMN, pDMN, VN, SMN, SAN, and ECN. Further statistical analysis revealed significantly (P < 0.05, False Discovery Rate corrected) disrupted intramodule and intermodule functional connectivity in the APOE ɛ4 carriers versus noncarriers (B). The line width indicates between‐group differences (all carriers < noncarriers). The results represented on the brain surface were mapped using the BrainNet viewer [Xia et al., 2013]. [Color figure can be viewed in the online issue, which is available at http://wileyonlinelibrary.com.]
Local Level APOE ɛ4‐related Alterations: Nodal and Connectional Strength
To localize the regional nodes and connections with APOE ɛ4 effects, we contrasted the nodal strength and connectivity strength (i.e., correlation coefficient) for each node and connection between the two groups. The mean nodal strength (MNS) was heterogeneously distributed over the brain with the most highly connected regions in the prefrontal cortex and posterior parietal and occipital cortices, a common pattern to both groups (Fig. 2A and B). Nevertheless, 438 ROIs exhibited decreased nodal strength in the APOE ɛ4 carriers (P < 0.05, False Discovery Rate corrected, Fig. 2C) with medium to large effect sizes (Cohen's d = 0.556 ± 0.124, Fig. 2D). These ROIs predominately encompassed the medial prefrontal cortex, posterior cingulate gyrus and adjacent precuneus (PCC/PCu), lateral prefrontal cortex, lateral temporal and parietal cortices, medial temporal lobe, supplemental motor area, insula and thalamus, bilaterally. When superimposed on the modular architecture of the APOE ɛ4 noncarriers (Fig. 1A), these decreased nodes were primarily categorized into the ECN (152/438, 34.7%), pDMN (120/438, 27.4%) and SMN (70/438, 16.0%). Interestingly, we noted that these nodes were associated with higher connectivity than the other nodes in the brain with respect to MNS across the APOE ɛ4 noncarriers (Fig. 2E). Further analysis of the group difference map revealed a significant spatial negative correlation with the MNS map in the APOE ɛ4 noncarriers (r = −0.403, P < 10−40, Fig. 2F). These findings suggest a preferential genetic vulnerability of functional hubs of brain networks to the APOE ɛ4 allele in AD.
Figure 2.
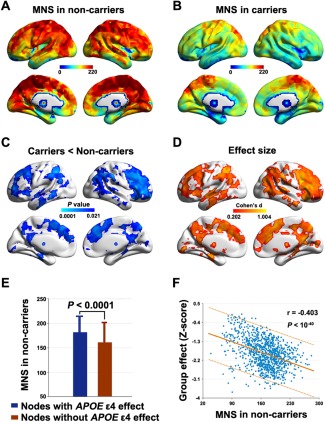
The effects of APOE ɛ4 on local nodal strength. Although similar patterns were found between the APOE ɛ4 noncarriers (A) and carriers (B), significantly (P < 0.05, False Discovery Rate corrected) decreased nodal strength was detected in the APOE ɛ4 carriers (C) with medium to large effect sizes (D). Interestingly, the regions showing decreased nodal strength in the APOE ɛ4 carriers versus noncarriers were associated with higher connectivity than the other regions in the brain (E). Further analysis revealed that the between‐group difference map (P‐values were transformed to Z‐scores) exhibited a significant spatial negative correlation with the MNS map in APOE ɛ4 noncarriers (F). MNS, mean nodal strength. The results represented on the brain surface were mapped using the BrainNet viewer [Xia et al., 2013].
Using the nonparametric NBS approach [Zalesky et al., 2010a], we identified a single connected component (cluster defining threshold of P < 0.01) that exhibited decreased functional connectivity in the APOE ɛ4 carriers versus noncarriers (P = 0.005, corrected, Fig. 3A). The component comprised 420 connections that linked 255 ROIs, which overlapped largely with the nodes with decreased nodal MNS strength previously detected. In the framework of the modular structure of the APOE ɛ4 noncarriers (Fig. 1A), the identified component comprised predominantly intramodule connections (380/420, 90.5%) that primarily encompassed regions within the SMN (nodes: 114/255, 44.7%; edges: 170/420, 40.5%), pDMN (nodes: 72/255, 28.2%; edges: 136/420, 32.4%) and ECN (nodes: 54/255, 21.2%; edges: 65/420, 15.5%). Interestingly, we observed that the nodes within the component were associated with higher connectivity (P < 0.0001) and were more densely interconnected (P < 0.0005) than the nodes outside the component in terms of the mean connectivity network across the APOE ɛ4 noncarriers (Fig. 3B), a typical feature of the so‐called rich club. To test this speculation, we compared the rich‐club coefficient among the nodes in the identified component (rich‐club coefficient = 0.852) to those derived from (i) the same set of nodes in random networks that preserved the same nodes, edge and degree distribution as the mean connectivity network across the APOE ɛ4 noncarriers and (ii) random components in the mean connectivity network across the APOE ɛ4 noncarriers that had the same size as the identified component. Both analytical strategies confirmed the preferential impairments of APOE ɛ4 on rich‐club structures (P < 0.001, Fig. 3C and D), a robust finding against different cluster defining thresholds for the NBS (Table 3). To further consolidate the finding, we identified the rich‐club structures of the APOE ɛ4 noncarriers and noted a remarkably larger overlap between them and the identified NBS component compared with randomly generated NBS components (Fig. 4). Collectively, our nodal and connectional analyses jointly suggest that the APOE genotype selectively disrupts rich‐club nodes and connections of specific systems of the SMN, pDMN, and ECN.
Figure 3.
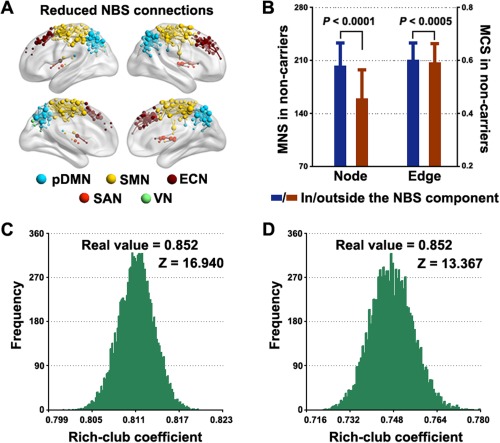
The effects of APOE ɛ4 on local connectional strength. A connected component of decreased functional connectivity was detected in APOE ɛ4 carriers compared with noncarriers that primarily involved the pDMN, ECN, and SMN (A). Within the component, nodes were associated with higher connectivity and edges were more highly weighted (B) than those outside the component, indicating a rich‐club structure of the component. Further analysis revealed that the rich‐club coefficient of the component was far larger than those derived from random networks (C) and random components (D). See Materials and Methods section for details. Error bars denote standard deviations. MNS, mean nodal strength; MCS, mean connectional strength. The results represented on the brain surface were mapped using the BrainNet viewer [Xia et al., 2013]. [Color figure can be viewed in the online issue, which is available at http://wileyonlinelibrary.com.]
Table 3.
Decreased NBS connectivity in the APOE ε4 carriers versus noncarriers over different cluster defining thresholds
| (PN/PE, %) | |||||||||
|---|---|---|---|---|---|---|---|---|---|
| NBS threshold | Size (N, E) | Node (in vs. out) | Edge (in vs. out) | SMN | pDMN | ECN | SAN | VN | aDMN |
| P = 0.005 | (182, 253) | <0.001 | 0.0068 | 44.0/38.7 | 31.9/36.8 | 22.0/17.4 | 1.7/0.8 | 0.6/0 | 0/0 |
| P = 0.01 | (255, 420) | <0.001 | 0.0005 | 44.7/40.5 | 28.2/32.4 | 21.2/15.5 | 4.3/2.1 | 1.6/0 | 0/0 |
| P = 0.05 | (542, 1359) | <0.001 | 0.0003 | 29.7/34.1 | 22.5/26.9 | 22.9/16.6 | 5.7/2.5 | 19.2/9.6 | 0/0 |
(N, E) represents the number of nodes and edges in the identified NBS components; (in vs. out): comparisons of nodal/connectional strength for nodes/edges inside vs. outside the NBS components; (PN, PE, %) represents the proportions of nodes/edges within the NBS components that belong to each module. SMN, sensorimotor network; pDMN, posterior default mode network; ECN, executive control network; SAN, salience network; VN, visual network; aDMN, anterior default mode network.
Figure 4.
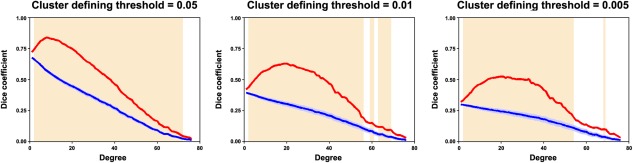
Overlap between the NBS component and the rich‐club structure. The shaded area denotes the threshold range where (i) the rich‐club significantly exists in the APOE ɛ4 noncarriers (P < 0.05, Bonferroni corrected across 76 degree thresholds) and (ii) the overlaps (dice coefficient) between the real NBS component and the rich‐club structures (red lines) were significantly larger than those between randomly generated components and rich‐club structures (blue lines). [Color figure can be viewed in the online issue, which is available at http://wileyonlinelibrary.com.]
Simulation Results
The previously described modular and nodal/connectional analyses jointly indicated that the pDMN and ECN exhibited the most salient effects of the APOE genotype. To test the degree to which the observed alterations associated with these two modules contributed to global network abnormalities, we performed further simulation analyses using two strategies. The results demonstrated that both strategies markedly reduced the between‐group differences in the global network measures of real brain networks (Fig. 5), which indicates the vital roles of the pDMN and ECN modules in the APOE ɛ4‐mediated modulation of the global organization of the brain networks.
Figure 5.
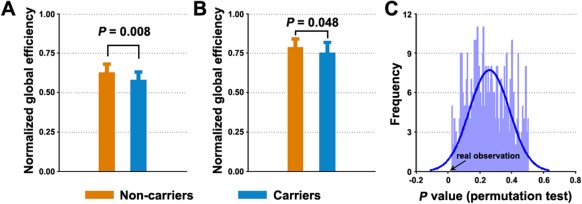
Simulation analysis showing the effects of ECN and pDMN on global network organization. A significant decrease in normalized global efficiency of functional brain networks was detected in the APOE ɛ4 carriers versus noncarriers (A). The decrease was greatly ameliorated after deleting the ECN and pDMN modules from individual brain networks (B) or after using a replacement approach (C). Error bars denote standard deviations. [Color figure can be viewed in the online issue, which is available at http://wileyonlinelibrary.com.]
Brain‐Behavior Relationship
With all participants in one group, significant correlations were observed between the global network measures (normalized local efficiency, normalized global efficiency, and modularity) and cognitive profiles (recognition and verbal fluency) after controlling for APOE ɛ4 status (Fig. 6). No relationships were found between nodal centrality and any clinical variable (P > 0.05, False Discovery Rate corrected).
Figure 6.
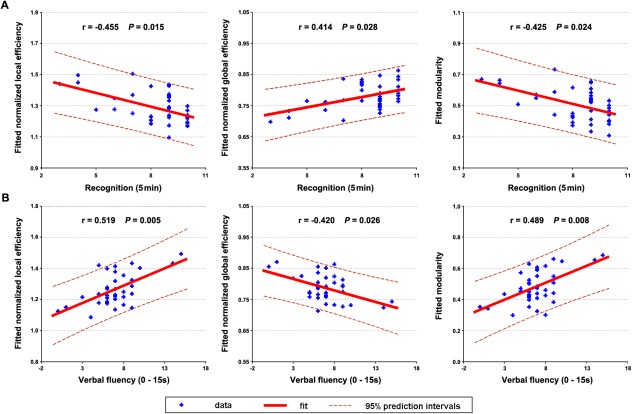
The relationship between network measures and behavioral variables. Significant correlations of network measures were observed with recognition (A) and verbal fluency (B) for all participants after controlling for APOE ɛ4 status. [Color figure can be viewed in the online issue, which is available at http://wileyonlinelibrary.com.]
Validation and Reproducibility
In general, both the global and nodal results reported in the main text were largely reproducible when: (i) controlling for regional GMV (Fig. 7A), (ii) using a scrubbing approach to censor “bad” volumes (Table 4 and Fig. 7B), (iii) using a GM probability weighted method (Table 4, Fig. 7C and Supporting Information Fig. I), and (iv) excluding the three homozygous APOE ɛ4 carriers (Table 4 and Fig. 7D). With respect to the relative network organization after the normalization of individual networks to the same level of network density and connectivity weight, only the normalized global efficiency significantly decreased in the APOE ɛ4 carriers compared with the noncarriers (Table 4). For nodal strength, no regions exhibited significant APOE ɛ4‐related effects (P > 0.05, FDR corrected). When a liberal threshold (P < 0.05, uncorrected) was used, similar findings were observed regardless of the network densities (Supporting Information Fig. II).
Figure 7.
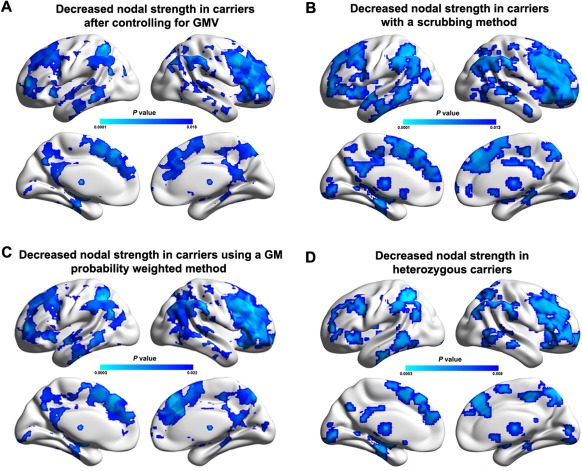
Reproducibility of APOE ɛ4‐related effects on nodal strength. Between‐group differences in nodal strength were largely reproducible when controlling for regional GMV (A), using a scrubbing approach to censor “bad” volumes (B), using a GM probability weighted method (C), and excluding homozygous APOE ɛ4 carriers (D). The results represented on the brain surface were mapped using the BrainNet viewer [Xia et al., 2013]. [Color figure can be viewed in the online issue, which is available at http://wileyonlinelibrary.com.]
Table 4.
Significance levels (P values) of APOE ε4‐related differences in global network measures during the validation analyses
| Factors | Main results | Head motion | GM Mask | Thresholding procedure (S) | Gene dose | |||
|---|---|---|---|---|---|---|---|---|
| 6% | 8.3% | 10% | 12% | |||||
| Local efficiency | 0.021 (↓) | 0.022 (↓) | 0.020 (↓) | 0.315 (n.s.) | 0.298 (n.s.) | 0.236 (n.s.) | 0.233 (n.s.) | 0.024 (↓) |
| Global efficiency | 0.012 (↓) | 0.018 (↓) | 0.013 (↓) | 0.273 (n.s.) | 0.219 (n.s.) | 0.185 (n.s.) | 0.150 (n.s.) | 0.019 (↓) |
| Modularity | 0.017 (↑) | 0.034 (↑) | 0.020 (↑) | 0.123 (n.s.) | 0.124 (n.s.) | 0.093 (n.s.) | 0.088 (n.s.) | 0.012 (↑) |
| Normalized local efficiency | 0.074 (n.s.) | 0.276 (n.s.) | 0.067 (n.s.) | 0.326 (n.s.) | 0.345 (n.s.) | 0.344 (n.s.) | 0.363 (n.s.) | 0.035 (↑) |
| Normalized global efficiency | 0.004 (↓) | 0.008 (↓) | 0.004 (↓) | 0.011 (↓) | 0.008 (↓) | 0.007 (↓) | 0.004 (↓) | 0.007 (↓) |
| Normalized modularity | 0.013 (↑) | 0.009 (↑) | 0.014 (↑) | 0.073 (n.s.) | 0.373 (n.s.) | 0.361 (n.s.) | 0.081 (n.s.) | 0.009 (↑) |
↓, carriers < noncarriers; ↑, carriers > noncarriers, S, network density; n.s., nonsignificant.
DISCUSSION
This study demonstrated the profound effects of APOE ɛ4 on both cognitive performance and intrinsic functional brain networks in patients with AD, which can be summarized as follows: (i) APOE ɛ4 impaired the delayed memory ability but promoted executive functioning; (ii) APOE ɛ4 reduced the information transfer efficiency over whole‐brain functional networks; (iii) APOE ɛ4 selectively disrupted intramodule and intermodule integration related to the pDMN and ECN; and (iv) APOE ɛ4 preferentially weakened the connectivity of rich‐club regions and connections that predominantly resided in the pDMN and ECN. These findings deepen our understanding of how the entire assembly of the brain network reorganizes in response to APOE variants in AD.
APOE ɛ4 Regulates Cognitive Performance
We found that the APOE ɛ4 carriers exhibited greater memory deficits than the noncarriers in the AD patients, which is consistent with previous studies [van der Flier et al., 2006; Wolk et al., 2010]. Specifically, the APOE ɛ4 carriers performed worse in recognition rather than recall. Compared with recall, recognition relies less on strategic memory and produces lower search demands [Walhovd et al., 2010]. Moreover, the APOE genotype was reported to only be related to recognition in patients with AD [Walhovd et al., 2010], which thus provides important support for our finding. With regard to nonmemory performance, the APOE ɛ4 noncarriers exhibited a trend toward greater impairment of executive function (the total output of the animal names in the verbal fluency tasks). In particular, they performed worse during the late period (46–60 s) of the verbal fluency tasks. This finding was compatible with one recent study [Wolk et al., 2010]. Notably, a trend toward improved performance in the early item‐generation time period (0–15 s) of the verbal fluency tasks was observed in the APOE ɛ4 noncarriers, which presumably occurred as a consequence of degraded semantic store in the APOE ɛ4 carriers caused by memory impairments [Fagundo et al., 2008].
APOE ɛ4 Reduces Global Network Efficiency
The human brain is a highly optimized wiring system that facilitates both specialized and distributed processing, which can be quantified by graphic metrics, such as efficiency and modularity. Using these measures, we found that the APOE ɛ4 reduced efficiency and increased modularity of the intrinsic functional networks in AD. After controlling for network density and overall connectivity weight, decreased global efficiency remained in the APOE ɛ4 carriers, which suggests this finding is a robust APOE ɛ4‐mediated modulation of disease phenotype at the system‐level network organization. Global efficiency measures the ability of parallel information propagation within a network. High global efficiency ensures effective integrity and rapid information propagation between and across remote brain regions that are believed to constitute the basis of cognitive processing [Sporns and Zwi, 2004]. In AD, decreased global efficiency has previously been reported in both structural [He et al., 2008; Lo et al., 2010] and functional [Liu et al., 2013b; Stam et al., 2007] brain networks. Here, we demonstrated a more severe disruption of global information transfer in AD patients that carried the APOE ɛ4 allele, which is consistent with the notion of APOE ɛ4 as a risk factor for AD. The decreased global efficiency may reflect disrupted neuronal integration among distributed regions as demonstrated by numerous disruptions in intermodule connectivity, which play a critical role in coordinating neural activity over the entire brain. Moreover, the global efficiency was significantly correlated with memory‐related performances in all patients, suggesting a neurocognitive significance of the measure in capturing network behaviors associated with the disease. Notably, a previous exploratory study did not found APOE ɛ4 effects on the global network topology of functional brain networks in AD [Zhao et al., 2012]. Different network analytical strategies (e.g., low‐resolution anatomical parcelation versus high‐resolution random parcelation for node definition) may explain this discrepancy.
APOE ɛ4 Selectively Disrupts The Functional Connectivity of Specific Networks
In addition to the global level, we also identified APOE ɛ4‐mediated effects on the functional connectivity at the intermediate modular and local nodal/connectional levels. We demonstrated that the APOE ɛ4 allele selectively modulated the pDMN and ECN, whose changes were largely responsible for the observed global differences. The DMN is involved in a diverse array of functions, such as episodic memory, monitoring the external environment, and self‐relevant mental processing [Buckner et al., 2008]. Although typically regarded as a homogenous network, the DMN is functionally heterogeneous, such as strikingly different connectivity patterns between the aDMN and pDMN [Uddin et al., 2009]. Here, we observed that the APOE ɛ4 modulated the pDMN. The pDMN primarily comprises the posterior parietal and lateral temporal cortices, which are commonly associated with episodic memory [Greicius et al., 2003; Lou et al., 2004; Wagner et al., 2005]. Using a seed‐based method, decreased functional connectivity in the pDMN has been demonstrated in APOE ɛ4 carriers versus noncarriers in elderly individuals [Machulda et al., 2011], even without preclinical fibrillar amyloid deposition [Sheline et al., 2010]. Thus, we speculated that decreased pDMN functional connectivity may underlie the poorer memory performance of APOE ɛ4 carriers. Notably, using independent component analysis, an increased synchronization of the (posterior) DMN was reported in healthy APOE ɛ4 carriers [Filippini et al., 2009; Westlye et al., 2011]. Presumably, these discrepancies could be attributable to different criteria for sample recruitment, connectivity definitions, and analytical approaches. The ECN is critical for sustained attention, working memory, and judgment and decision making. One previous study has reported that compared with noncarriers, APOE ɛ4 carriers exhibited divided‐attention deficits on the operation span task in elderly individuals [Rosen et al., 2002]. Using R‐fMRI, reduced functional connectivity of the ECN was also observed in healthy middle‐aged APOE ɛ4 carriers versus noncarriers [Goveas et al., 2013]. Therefore, our results are consistent with previous studies.
In addition to the pDMN and ECN, the SMN module also exhibited decreased connectivity in the APOE ɛ4 carriers. To date, few reports have focused on APOE ɛ4‐mediated modulation of sensorimotor functioning in AD, which restricts further speculation on this finding. Nevertheless, we noticed a previous study showing that compared with noncarriers, APOE ɛ4 carriers had an area of increased functional connectivity in the SMN module localized to the right medial postcentral gyrus in young healthy subjects [Filippini et al., 2009] (Of note, this finding is in contrast to our finding of decreased nodal strength in the SMN, which could be the result of different methods used to define functional connectivity: ROI‐based functional connectivity in this study versus voxelwise independent component analysis in Filippini et al.). Moreover, evidence from behavioral studies in large population cohorts indicates that APOE ɛ4 is strongly associated with poor mobility performances in older individuals [Melzer et al., 2005] and accelerates motor declines primarily because of the association between the APOE ɛ4 allele and changes in muscle strength [Buchman et al., 2009]. In addition, in other pathological conditions of traumatic brain injury [Ariza et al., 2006] and spinal cord injury [Sun et al., 2011], APOE ɛ4 has been associated with worse performances on motor speed and fine motor coordination and less motor recovery during rehabilitation, respectively. These findings jointly suggest that APOE ɛ4 might modulate somatosensory function. Thus, our findings have implications for understanding the neural mechanism that underlies the modulation although additional studies are necessary to validate these findings.
APOE ɛ4 Preferentially Weakens Functional Hubs
We demonstrated that the foci that exhibited decreased nodal strength in the APOE ɛ4 carriers tended to be highly connected and densely interconnected in the brain, which suggests a rich‐club structure formed by these regions. In other words, the APOE ɛ4 allele preferentially modulated hubs in the brain. Hub configuration is a relatively stable property of the brain, wherein the PCC/PCu, lateral temporal, lateral parietal, and medial/lateral prefrontal cortices are highly connected [Buckner et al., 2009; van den Heuvel and Sporns, 2013]. Interestingly, the spatial distribution of hubs strikingly overlapped with Aβ deposition in AD patients, implying a preferential vulnerability of hubs to AD [Buckner et al., 2009]. Here, we demonstrated that the APOE ɛ4 influenced intrinsic brain networks also via preferential damage to the connectivity of hubs. The primary biologic effect of APOE ɛ4 appears to increase the Aβ accumulation [Polvikoski et al., 1995] possibly via an influence on soluble Aβ metabolism [Verghese et al., 2013]. This increase is spatially specific and primarily manifests in the PCC/PCu, prefrontal, lateral temporal and parietal cortices [Drzezga et al., 2009; Reiman et al., 2009], which largely overlaps with these putative hub regions [Tomasi and Volkow, 2010; Zuo et al., 2012]. The increased amyloid burden has been further demonstrated to disrupt functioning of these corresponding regions [Drzezga et al., 2011; Hedden et al., 2009; Sperling et al., 2009]. Additionally, APOE ɛ4 also lowers cerebral metabolism in most of the aforementioned hub regions [Reiman et al., 2004; Small et al., 2000], which is important for the high connectivity of hubs [Liang et al., 2013; Tomasi et al., 2013]. Based on these findings, we speculate that APOE ɛ4 increases Aβ deposition in specific hubs, which then causes synaptic loss in these regions [Talantova et al., 2013]. The synaptic loss leads to a further decrease in regional metabolism and, therefore, insufficient energy to construct or retain anatomic projections and eventually disrupted functional connectivity. Notably, the pathological effects of the APOE genotype on interregional functional integration have been demonstrated to be independent of Aβ plaque toxicity [Sheline et al., 2010]. Therefore, the observed changes here may represent mixed outcomes of Aβ plaques and the APOE genotype. Future studies are warranted to determine the complicated relationships between these factors in the same cohort of participants.
Limitations and Future Considerations
First, the sample size is relatively small in this study, which limits efforts in the exploration of dose‐related effects. Additional studies are warranted in the future to determine the exact relationships between large‐scale brain network organization and APOE ɛ4 gene dose by recruiting a large cohort of participants. Second, this study investigated the effects of the APOE ɛ4 allele on functional networks. Recent studies have documented a tight relation between the structural and functional connectivity networks in healthy populations [Hermundstad et al., 2013; Honey et al., 2009]. Thus, the investigation of APOE ɛ4 effects on the structure‐function relationship is an interesting topic for the future. Third, we exclusively focused on a genetic risk factor of the APOE genotype for AD. Future studies are required to test the effects of other risk factors on the brain networks that are independent of the APOE ɛ4 allele, such as a family history of AD [Wang et al., 2012]. Finally, this study specifically investigated APOE ɛ4‐related effects on topological organization of functional brain networks in patients with AD. Future studies are required to determine how APOE ɛ4 affects large‐scale network organization in cognitively normal participants and more importantly, whether the interactions of this effect between APOE ɛ4 status (i.e., carriers vs. noncarriers) and disease states (i.e., healthy vs. AD) exist.
Supporting information
Supplementary Information
ACKNOWLEDGMENTS
The authors declare no competing financial interests. We thank the patients and volunteers for participating in this study. We thank Dr. Andrew Zalesky, the University of Melbourne and Melbourne Health, Australia, for kindly providing codes to generate high‐resolution parcelation atlas.
REFERENCES
- Achard S, Bullmore E (2007): Efficiency and Cost of Economical Brain Functional Networks. PloS Comput Biol 3:e17. [DOI] [PMC free article] [PubMed] [Google Scholar]
- Agosta F, Vossel KA, Miller BL, Migliaccio R, Bonasera SJ, Filippi M, Boxer AL, Karydas A, Possin KL, Gorno‐Tempini ML (2009): Apolipoprotein E epsilon4 is associated with disease‐specific effects on brain atrophy in Alzheimer's disease and frontotemporal dementia. Proc Natl Acad Sci USA 106:2018–2022. [DOI] [PMC free article] [PubMed] [Google Scholar]
- Ariza M, Pueyo R, Matarin Mdel M, Junque C, Mataro M, Clemente I, Moral P, Poca MA, Garnacho A, Sahuquillo J (2006): Influence of APOE polymorphism on cognitive and behavioural outcome in moderate and severe traumatic brain injury. J Neurol Neurosurg Psychiatry 77:1191–1193. [DOI] [PMC free article] [PubMed] [Google Scholar]
- Bassett DS, Wymbs NF, Porter MA, Mucha PJ, Carlson JM, Grafton ST. (2011): Dynamic reconfiguration of human brain networks during learning. Proc Natl Acad Sci USA 108:7641–766. [DOI] [PMC free article] [PubMed] [Google Scholar]
- Bialonski S, Wendler M, Lehnertz K (2011): Unraveling spurious properties of interaction networks with tailored random networks. PLoS One 6:e22826. [DOI] [PMC free article] [PubMed] [Google Scholar]
- Biswal B, Yetkin FZ, Haughton VM, Hyde JS (1995): Functional connectivity in the motor cortex of resting human brain using echo‐planar MRI. Magn Reson Med 34:537–541. [DOI] [PubMed] [Google Scholar]
- Brown JA, Terashima KH, Burggren AC, Ercoli LM, Miller KJ, Small GW, Bookheimer SY (2011): Brain network local interconnectivity loss in aging APOE‐4 allele carriers. Proc Natl Acad Sci USA 108:20760–20765. [DOI] [PMC free article] [PubMed] [Google Scholar]
- Buchman AS, Boyle PA, Wilson RS, Beck TL, Kelly JF, Bennett DA (2009): Apolipoprotein E e4 allele is associated with more rapid motor decline in older persons. Alzheimer Dis Assoc Disord 23:63–69. [DOI] [PMC free article] [PubMed] [Google Scholar]
- Buckner RL, Andrews‐Hanna JR, Schacter DL (2008): The brain's default network: Anatomy, function, and relevance to disease. Ann N Y Acad Sci 1124:1–38. [DOI] [PubMed] [Google Scholar]
- Buckner RL, Sepulcre J, Talukdar T, Krienen FM, Liu H, Hedden T, Andrews‐Hanna JR, Sperling RA, Johnson KA (2009): Cortical hubs revealed by intrinsic functional connectivity: Mapping, assessment of stability, and relation to Alzheimer's disease. J Neurosci 29:1860–1873. [DOI] [PMC free article] [PubMed] [Google Scholar]
- Bullmore E, Sporns O (2009): Complex brain networks: Graph theoretical analysis of structural and functional systems. Nat Rev Neurosci 10:186–198. [DOI] [PubMed] [Google Scholar]
- Cao H, Plichta MM, Schafer A, Haddad L, Grimm O, Schneider M, Esslinger C, Kirsch P, Meyer‐Lindenberg A, Tost H (2014): Test‐retest reliability of fMRI‐based graph theoretical properties during working memory, emotion processing, and resting state. Neuroimage 84:888–900. [DOI] [PubMed] [Google Scholar]
- Corder EH, Saunders AM, Strittmatter WJ, Schmechel DE, Gaskell PC, Small GW, Roses AD, Haines JL, Pericak‐Vance MA (1993): Gene dose of apolipoprotein E type 4 allele and the risk of Alzheimer's disease in late onset families. Science 261:921–923. [DOI] [PubMed] [Google Scholar]
- Craddock RC, James GA, Holtzheimer PE 3rd, Hu XP, Mayberg HS (2012): A whole brain fMRI atlas generated via spatially constrained spectral clustering. Hum Brain Mapp 33:1914–1928. [DOI] [PMC free article] [PubMed] [Google Scholar]
- Dick MB, Teng EL, Kempler D, Davis DS, Taussig IM (2002): The cross‐cultural neuropsychological test battery (CCNB): Effects of age, education, ethnicity, and cognitive status on performance In: Ferraro FR, editor. Minority and Cross‐Cultural Aspects of Neuropsychological Assessment. Lisse: Swets & Zeitlinger B.V; pp 17–41. [Google Scholar]
- Drzezga A, Grimmer T, Henriksen G, Muhlau M, Perneczky R, Miederer I, Praus C, Sorg C, Wohlschlager A, Riemenschneider M, Wester HJ, Foerstl H, Schwaiger M, Kurz A (2009): Effect of APOE genotype on amyloid plaque load and gray matter volume in Alzheimer disease. Neurology 72:1487–1494. [DOI] [PubMed] [Google Scholar]
- Drzezga A, Becker JA, Van Dijk KR, Sreenivasan A, Talukdar T, Sullivan C, Schultz AP, Sepulcre J, Putcha D, Greve D, Johnson KA, Sperling RA (2011): Neuronal dysfunction and disconnection of cortical hubs in non‐demented subjects with elevated amyloid burden. Brain 134(Pt 6):1635–1646. [DOI] [PMC free article] [PubMed] [Google Scholar]
- Fagundo AB, Lopez S, Romero M, Guarch J, Marcos T, Salamero M (2008): Clustering and switching in semantic fluency: Predictors of the development of Alzheimer's disease. Int J Geriatr Psychiatry 23:1007–1013. [DOI] [PubMed] [Google Scholar]
- Fair DA, Nigg JT, Iyer S, Bathula D, Mills KL, Dosenbach NU, Schlaggar BL, Mennes M, Gutman D, Bangaru S, Buitelaar JK, Dickstein DP, Di Martino A, Kennedy DN, Kelly C, Luna B, Schweitzer JB, Velanova K, Wang YF, Mostofsky S, Castellanos FX, Milham MP (2012): Distinct neural signatures detected for ADHD subtypes after controlling for micro‐movements in resting state functional connectivity MRI data. Front Syst Neurosci 6:80. [DOI] [PMC free article] [PubMed] [Google Scholar]
- Filippini N, MacIntosh BJ, Hough MG, Goodwin GM, Frisoni GB, Smith SM, Matthews PM, Beckmann CF, Mackay CE. (2009): Distinct patterns of brain activity in young carriers of the APOE‐epsilon4 allele. Proc Natl Acad Sci USA 106:7209–7214. [DOI] [PMC free article] [PubMed] [Google Scholar]
- Fillenbaum GG, van Belle G, Morris JC, Mohs RC, Mirra SS, Davis PC, Tariot PN, Silverman JM, Clark CM, Welsh‐Bohmer KA, Heyman A (2008): Consortium to Establish a Registry for Alzheimer's Disease (CERAD): The first twenty years. Alzheimers Dement 4:96–109. [DOI] [PMC free article] [PubMed] [Google Scholar]
- Fornito A, Zalesky A, Bullmore ET (2010): Network scaling effects in graph analytic studies of human resting‐state FMRI data. Front Syst Neurosci 4:22. [DOI] [PMC free article] [PubMed] [Google Scholar]
- Fox MD, Zhang D, Snyder AZ, Raichle ME (2009): The global signal and observed anticorrelated resting state brain networks. J Neurophysiol 101:3270–3283. [DOI] [PMC free article] [PubMed] [Google Scholar]
- Ginestet CE, Nichols TE, Bullmore ET, Simmons A (2011): Brain network analysis: Separating cost from topology using cost‐integration. PLoS One 6:e21570. [DOI] [PMC free article] [PubMed] [Google Scholar]
- Goveas JS, Xie C, Chen G, Li W, Ward BD, Franczak MB, Jones JL, Antuono PG, Li SJ (2013): Functional network endophenotypes unravel the effects of apolipoprotein E epsilon 4 in middle‐aged adults. PLoS One 8:e55902. [DOI] [PMC free article] [PubMed] [Google Scholar]
- Greicius MD, Krasnow B, Reiss AL, Menon V (2003): Functional connectivity in the resting brain: A network analysis of the default mode hypothesis. Proc Natl Acad Sci USA 100:253–258. [DOI] [PMC free article] [PubMed] [Google Scholar]
- He Y, Chen Z, Evans A (2008): Structural insights into aberrant topological patterns of large‐scale cortical networks in Alzheimer's disease. J Neurosci 28:4756–4766. [DOI] [PMC free article] [PubMed] [Google Scholar]
- Hedden T, Van Dijk KR, Becker JA, Mehta A, Sperling RA, Johnson KA, Buckner RL (2009): Disruption of functional connectivity in clinically normal older adults harboring amyloid burden. J Neurosci 29:12686–12694. [DOI] [PMC free article] [PubMed] [Google Scholar]
- Hermundstad AM, Bassett DS, Brown KS, Aminoff EM, Clewett D, Freeman S, Frithsen A, Johnson A, Tipper CM, Miller MB, Grafton ST, Carlson JM (2013): Structural foundations of resting‐state and task‐based functional connectivity in the human brain. Proc Natl Acad Sci USA 110:6169–6174. [DOI] [PMC free article] [PubMed] [Google Scholar]
- Honey CJ, Sporns O, Cammoun L, Gigandet X, Thiran JP, Meuli R, Hagmann P (2009): Predicting human resting‐state functional connectivity from structural connectivity. Proc Natl Acad Sci USA 106:2035–2040. [DOI] [PMC free article] [PubMed] [Google Scholar]
- Johnson JK, Head E, Kim R, Starr A, Cotman CW (1999): Clinical and pathological evidence for a frontal variant of Alzheimer disease. Arch Neurol 56:1233–1239. [DOI] [PubMed] [Google Scholar]
- Kempler D, Teng EL, Taussig M, Dick MB (2010): The common objects memory test (COMT): A simple test with cross‐cultural applicability. J Int Neuropsychol Soc 16:537–545. [DOI] [PubMed] [Google Scholar]
- Latora V, Marchiori M (2001): Efficient behavior of small‐world networks. Phys Rev Lett 87:198701. [DOI] [PubMed] [Google Scholar]
- Lehtovirta M, Soininen H, Helisalmi S, Mannermaa A, Helkala EL, Hartikainen P, Hanninen T, Ryynanen M, Riekkinen PJ (1996): Clinical and neuropsychological characteristics in familial and sporadic Alzheimer's disease: Relation to apolipoprotein E polymorphism. Neurology 46:413–419. [DOI] [PubMed] [Google Scholar]
- Liang X, Zou Q, He Y, Yang Y (2013): Coupling of functional connectivity and regional cerebral blood flow reveals a physiological basis for network hubs of the human brain. Proc Natl Acad Sci USA 110:1929–1934. [DOI] [PMC free article] [PubMed] [Google Scholar]
- Liu CC, Kanekiyo T, Xu H, Bu G (2013a): Apolipoprotein E and Alzheimer disease: Risk, mechanisms and therapy. Nat Rev Neurol 9:106–118. [DOI] [PMC free article] [PubMed] [Google Scholar]
- Liu Y, Yu C, Zhang X, Liu J, Duan Y, Alexander‐Bloch AF, Liu B, Jiang T, Bullmore E (2013b): Impaired long distance functional connectivity and weighted network architecture in Alzheimer's Disease. Cereb Cortex 24:1422–1435. [DOI] [PMC free article] [PubMed] [Google Scholar]
- Lo CY, Wang PN, Chou KH, Wang J, He Y, Lin CP (2010): Diffusion tensor tractography reveals abnormal topological organization in structural cortical networks in Alzheimer's disease. J Neurosci 30:16876–16885. [DOI] [PMC free article] [PubMed] [Google Scholar]
- Lou HC, Luber B, Crupain M, Keenan JP, Nowak M, Kjaer TW, Sackeim HA, Lisanby SH (2004): Parietal cortex and representation of the mental Self. Proc Natl Acad Sci USA 101:6827–6832. [DOI] [PMC free article] [PubMed] [Google Scholar]
- Machulda MM, Jones DT, Vemuri P, McDade E, Avula R, Przybelski S, Boeve BF, Knopman DS, Petersen RC, Jack CR Jr (2011): Effect of APOE epsilon4 status on intrinsic network connectivity in cognitively normal elderly subjects. Arch Neurol 68:1131–1136. [DOI] [PMC free article] [PubMed] [Google Scholar]
- Maslov S, Sneppen K (2002): Specificity and stability in topology of protein networks. Science 296:910–913. [DOI] [PubMed] [Google Scholar]
- McKhann G, Drachman D, Folstein M, Katzman R, Price D, Stadlan EM (1984): Clinical diagnosis of Alzheimer's disease: Report of the NINCDS‐ADRDA Work Group under the auspices of Department of Health and Human Services Task Force on Alzheimer's Disease. Neurology 34:939–944. [DOI] [PubMed] [Google Scholar]
- Melzer D, Dik MG, van Kamp GJ, Jonker C, Deeg DJ (2005): The apolipoprotein E e4 polymorphism is strongly associated with poor mobility performance test results but not self‐reported limitation in older people. J Gerontol A Biol Sci Med Sci 60:1319–1323. [DOI] [PMC free article] [PubMed] [Google Scholar]
- Milo R, Shen‐Orr S, Itzkovitz S, Kashtan N, Chklovskii D, Alon U (2002): Network motifs: Simple building blocks of complex networks. Science 298:824–827. [DOI] [PubMed] [Google Scholar]
- Morris JC (1993): The Clinical Dementia Rating (CDR): Current version and scoring rules. Neurology 43:2412–2414. [DOI] [PubMed] [Google Scholar]
- Murphy K, Birn RM, Handwerker DA, Jones TB, Bandettini PA (2009): The impact of global signal regression on resting state correlations: Are anti‐correlated networks introduced? Neuroimage 44:893–905. [DOI] [PMC free article] [PubMed] [Google Scholar]
- Newman MEJ (2006): Finding community structure in networks using the eigenvectors of matrices. Phys Rev E 74:036104. [DOI] [PubMed] [Google Scholar]
- Newman ME, Girvan M (2004): Finding and evaluating community structure in networks. Phys Rev E Stat Nonlin Soft Matter Phys 69(Pt 2):026113. [DOI] [PubMed] [Google Scholar]
- Opsahl T, Colizza V, Panzarasa P, Ramasco JJ (2008): Prominence and control: The weighted rich‐club effect. Phys Rev Lett 101:168702. [DOI] [PubMed] [Google Scholar]
- Polvikoski T, Sulkava R, Haltia M, Kainulainen K, Vuorio A, Verkkoniemi A, Niinisto L, Halonen P, Kontula K (1995): Apolipoprotein E, dementia, and cortical deposition of beta‐amyloid protein. N Engl J Med 333:1242–1247. [DOI] [PubMed] [Google Scholar]
- Power JD, Barnes KA, Snyder AZ, Schlaggar BL, Petersen SE (2012): Spurious but systematic correlations in functional connectivity MRI networks arise from subject motion. Neuroimage 59:2142–2154. [DOI] [PMC free article] [PubMed] [Google Scholar]
- Reiman EM, Chen K, Alexander GE, Caselli RJ, Bandy D, Osborne D, Saunders AM, Hardy J (2004): Functional brain abnormalities in young adults at genetic risk for late‐onset Alzheimer's dementia. Proc Natl Acad Sci USA 101:284–289. [DOI] [PMC free article] [PubMed] [Google Scholar]
- Reiman EM, Chen K, Liu X, Bandy D, Yu M, Lee W, Ayutyanont N, Keppler J, Reeder SA, Langbaum JB, Alexander GE, Klunk WE, Mathis CA, Price JC, Aizenstein HJ, DeKosky ST, Caselli RJ (2009): Fibrillar amyloid‐beta burden in cognitively normal people at 3 levels of genetic risk for Alzheimer's disease. Proc Natl Acad Sci USA 106:6820–6825. [DOI] [PMC free article] [PubMed] [Google Scholar]
- Rosen VM, Bergeson JL, Putnam K, Harwell A, Sunderland T (2002): Working memory and apolipoprotein E: What's the connection? Neuropsychologia 40:2226–2233. [DOI] [PubMed] [Google Scholar]
- Rubinov M, Sporns O (2010): Complex network measures of brain connectivity: Uses and interpretations. Neuroimage 52:1059–1069. [DOI] [PubMed] [Google Scholar]
- Satterthwaite TD, Wolf DH, Loughead J, Ruparel K, Elliott MA, Hakonarson H, Gur RC, Gur RE (2012): Impact of in‐scanner head motion on multiple measures of functional connectivity: Relevance for studies of neurodevelopment in youth. Neuroimage 60:623–632. [DOI] [PMC free article] [PubMed] [Google Scholar]
- Sheline YI, Morris JC, Snyder AZ, Price JL, Yan Z, D'Angelo G, Liu C, Dixit S, Benzinger T, Fagan A, Goate A, Mintun MA (2010): APOE4 allele disrupts resting state fMRI connectivity in the absence of amyloid plaques or decreased CSF Abeta42. J Neurosci 30:17035–17040. [DOI] [PMC free article] [PubMed] [Google Scholar]
- Small GW, Ercoli LM, Silverman DH, Huang SC, Komo S, Bookheimer SY, Lavretsky H, Miller K, Siddarth P, Rasgon NL, Mazziotta JC, Saxena S, Wu HM, Mega MS, Cummings JL, Saunders AM, Pericak‐Vance MA, Roses AD, Barrio JR, Phelps ME (2000): Cerebral metabolic and cognitive decline in persons at genetic risk for Alzheimer's disease. Proc Natl Acad Sci USA 97:6037–6042. [DOI] [PMC free article] [PubMed] [Google Scholar]
- Smith GE, Bohac DL, Waring SC, Kokmen E, Tangalos EG, Ivnik RJ, Petersen RC (1998): Apolipoprotein E genotype influences cognitive 'phenotype' in patients with Alzheimer's disease but not in healthy control subjects. Neurology 50:355–362. [DOI] [PubMed] [Google Scholar]
- Sperling RA, Laviolette PS, O'Keefe K, O'Brien J, Rentz DM, Pihlajamaki M, Marshall G, Hyman BT, Selkoe DJ, Hedden T, Buckner RL, Becker JA, Johnson KA (2009): Amyloid deposition is associated with impaired default network function in older persons without dementia. Neuron 63:178–188. [DOI] [PMC free article] [PubMed] [Google Scholar]
- Sporns O, Zwi JD (2004): The small world of the cerebral cortex. Neuroinformatics 2:145–162. [DOI] [PubMed] [Google Scholar]
- Stam CJ, Jones BF, Nolte G, Breakspear M, Scheltens P (2007): Small‐world networks and functional connectivity in Alzheimer's disease. Cereb Cortex 17:92–99. [DOI] [PubMed] [Google Scholar]
- Sun C, Ji G, Liu Q, Yao M (2011): Apolipoprotein E epsilon 4 allele and outcomes of traumatic spinal cord injury in a Chinese Han population. Mol Biol Rep 38:4793–4796. [DOI] [PubMed] [Google Scholar]
- Talantova M, Sanz‐Blasco S, Zhang X, Xia P, Akhtar MW, Okamoto S, Dziewczapolski G, Nakamura T, Cao G, Pratt AE, Kang YJ, Tu S, Molokanova E, McKercher SR, Hires SA, Sason H, Stouffer DG, Buczynski MW, Solomon JP, Michael S, Powers ET, Kelly JW, Roberts A, Tong G, Fang‐Newmeyer T, Parker J, Holland EA, Zhang D, Nakanishi N, Chen HS, Wolosker H, Wang Y, Parsons LH, Ambasudhan R, Masliah E, Heinemann SF, Piña‐Crespo JC, Lipton SA. (2013): Abeta induces astrocytic glutamate release, extrasynaptic NMDA receptor activation, and synaptic loss. Proc Natl Acad Sci USA 110:E2518–E2527. [DOI] [PMC free article] [PubMed] [Google Scholar]
- Talbot C, Lendon C, Craddock N, Shears S, Morris JC, Goate A (1994): Protection against Alzheimer's disease with apoE epsilon 2. Lancet 343:1432–1433. [DOI] [PubMed] [Google Scholar]
- Teng EL, Hasegawa K, Homma A, Imai Y, Larson E, Graves A, Sugimoto K, Yamaguchi T, Sasaki H, Chiu D, White LR. (1994): The Cognitive Abilities Screening Instrument (CASI): A practical test for cross‐cultural epidemiological studies of dementia. Int Psychogeriatr 6:45–58; discussion 62. [DOI] [PubMed] [Google Scholar]
- Tijms BM, Wink AM, de Haan W, van der Flier WM, Stam CJ, Scheltens P, Barkhof F (2013): Alzheimer's disease: Connecting findings from graph theoretical studies of brain networks. Neurobiol Aging 34:2023–2036. [DOI] [PubMed] [Google Scholar]
- Tijms BM, Yeung HM, Sikkes SA, Moller C, Smits LL, Stam CJ, Scheltens P, van der Flier WM, Barkhof F (2014): Single‐subject gray matter graph properties and their relationship with cognitive impairment in early‐ and late‐onset Alzheimer's disease. Brain Connect 4:337–346. [DOI] [PubMed] [Google Scholar]
- Toga AW, Thompson PM. (2013): Connectomics sheds new light on Alzheimer's disease. Biol Psychiatry 73:390–392. [DOI] [PMC free article] [PubMed] [Google Scholar]
- Tomasi D, Volkow ND (2010): Functional connectivity density mapping. Proc Natl Acad Sci USA 107:9885–9890. [DOI] [PMC free article] [PubMed] [Google Scholar]
- Tomasi D, Wang GJ, Volkow ND (2013): Energetic cost of brain functional connectivity. Proc Natl Acad Sci USA 110:13642–13647. [DOI] [PMC free article] [PubMed] [Google Scholar]
- Toppi J, De Vico Fallani F, Vecchiato G, Maglione AG, Cincotti F, Mattia D, Salinari S, Babiloni F, Astolfi L (2012): How the statistical validation of functional connectivity patterns can prevent erroneous definition of small‐world properties of a brain connectivity network. Comput Math Methods Med 2012:130985. [DOI] [PMC free article] [PubMed] [Google Scholar]
- Uddin LQ, Kelly AM, Biswal BB, Castellanos FX, Milham MP (2009): Functional connectivity of default mode network components: Correlation, anticorrelation, and causality. Hum Brain Mapp 30:625–637. [DOI] [PMC free article] [PubMed] [Google Scholar]
- van den Heuvel MP, Sporns O (2013): Network hubs in the human brain. Trends Cogn Sci 17:683–696. [DOI] [PubMed] [Google Scholar]
- van der Flier WM, Schoonenboom SN, Pijnenburg YA, Fox NC, Scheltens P (2006): The effect of APOE genotype on clinical phenotype in Alzheimer disease. Neurology 67:526–527. [DOI] [PubMed] [Google Scholar]
- Van Dijk KR, Sabuncu MR, Buckner RL (2012): The influence of head motion on intrinsic functional connectivity MRI. Neuroimage 59:431–438. [DOI] [PMC free article] [PubMed] [Google Scholar]
- van Wijk BCM, Stam CJ, Daffertshofer A (2010): Comparing brain networks of different size and connectivity density using graph theory. PLoS ONE 5:e13701. [DOI] [PMC free article] [PubMed] [Google Scholar]
- Verghese PB, Castellano JM, Garai K, Wang Y, Jiang H, Shah A, Bu G, Frieden C, Holtzman DM (2013): ApoE influences amyloid‐beta (Abeta) clearance despite minimal apoE/Abeta association in physiological conditions. Proc Natl Acad Sci USA 110:E1807–E1816. [DOI] [PMC free article] [PubMed] [Google Scholar]
- Wagner AD, Shannon BJ, Kahn I, Buckner RL (2005): Parietal lobe contributions to episodic memory retrieval. Trends Cogn Sci 9:445–453. [DOI] [PubMed] [Google Scholar]
- Walhovd KB, Fjell AM, Dale AM, McEvoy LK, Brewer J, Karow DS, Salmon DP, Fennema‐Notestine C, Alzheimer's Disease Neuroimaging I (2010): Multi‐modal imaging predicts memory performance in normal aging and cognitive decline. Neurobiol Aging 31:1107–1121. [DOI] [PMC free article] [PubMed] [Google Scholar]
- Wang J, Zuo X, Dai Z, Xia M, Zhao Z, Zhao X, Jia J, Han Y, He Y (2013): Disrupted functional brain connectome in individuals at risk for Alzheimer's disease. Biol Psychiatry 73:472–481. [DOI] [PubMed] [Google Scholar]
- Wang JH, Zuo XN, Gohel S, Milham MP, Biswal BB, He Y (2011): Graph theoretical analysis of functional brain networks: Test‐retest evaluation on short‐ and long‐term resting‐state functional MRI data. PLoS One 6:e21976. [DOI] [PMC free article] [PubMed] [Google Scholar]
- Wang L, Roe CM, Snyder AZ, Brier MR, Thomas JB, Xiong C, Benzinger TL, Morris JC, Ances BM (2012): Alzheimer disease family history impacts resting state functional connectivity. Ann Neurol 72:571–577. [DOI] [PMC free article] [PubMed] [Google Scholar]
- Watts DJ, Strogatz SH (1998): Collective dynamics of 'small‐world' networks. Nature 393:440–442. [DOI] [PubMed] [Google Scholar]
- Weissenbacher A, Kasess C, Gerstl F, Lanzenberger R, Moser E, Windischberger C (2009): Correlations and anticorrelations in resting‐state functional connectivity MRI: A quantitative comparison of preprocessing strategies. Neuroimage 47:1408–1416. [DOI] [PubMed] [Google Scholar]
- Wenham PR, Price WH, Blandell G (1991): Apolipoprotein E genotyping by one‐stage PCR. Lancet 337:1158–1159. [DOI] [PubMed] [Google Scholar]
- Westlye ET, Lundervold A, Rootwelt H, Lundervold AJ, Westlye LT (2011): Increased hippocampal default mode synchronization during rest in middle‐aged and elderly APOE epsilon4 carriers: Relationships with memory performance. J Neurosci 31:7775–7783. [DOI] [PMC free article] [PubMed] [Google Scholar]
- World Health Organization (1999): International Classification of Diseases, 10th Revision (ICD‐10). Geneva: World Health Organization.
- Wolk DA, Dickerson BC, Alzheimer's Disease Neuroimaging I (2010): Apolipoprotein E (APOE) genotype has dissociable effects on memory and attentional‐executive network function in Alzheimer's disease. Proc Natl Acad Sci USA 107:10256–10261. [DOI] [PMC free article] [PubMed] [Google Scholar]
- Xia M, Wang J, He Y (2013): BrainNet Viewer: A network visualization tool for human brain connectomics. PLoS One 8:e68910. [DOI] [PMC free article] [PubMed] [Google Scholar]
- Zalesky A, Fornito A, Bullmore E (2012): On the use of correlation as a measure of network connectivity. Neuroimage 60:2096–2106. [DOI] [PubMed] [Google Scholar]
- Zalesky A, Fornito A, Bullmore ET (2010a): Network‐based statistic: Identifying differences in brain networks. Neuroimage 53:1197–1207. [DOI] [PubMed] [Google Scholar]
- Zalesky A, Fornito A, Harding IH, Cocchi L, Yucel M, Pantelis C, Bullmore ET (2010b): Whole‐brain anatomical networks: Does the choice of nodes matter? Neuroimage 50:970–983. [DOI] [PubMed] [Google Scholar]
- Zhao X, Liu Y, Wang X, Liu B, Xi Q, Guo Q, Jiang H, Jiang T, Wang P (2012): Disrupted small‐world brain networks in moderate Alzheimer's disease: A resting‐state FMRI study. PLoS One 7:e33540. [DOI] [PMC free article] [PubMed] [Google Scholar]
- Zhou S, Mondragón RJ (2004): The rich‐club phenomenon in the Internet topology. IEEE Commun Lett 8:180–182. [Google Scholar]
- Zuo XN, Ehmke R, Mennes M, Imperati D, Castellanos FX, Sporns O, Milham MP (2012): Network centrality in the human functional connectome. Cereb Cortex 22:1862–1875. [DOI] [PubMed] [Google Scholar]
Associated Data
This section collects any data citations, data availability statements, or supplementary materials included in this article.
Supplementary Materials
Supplementary Information