

Abstract
Neuroimaging studies investigating the voluntary (top‐down) control of attention largely agree that this process recruits several frontal and parietal brain regions. Since most studies used attention tasks requiring several higher‐order cognitive functions (e.g. working memory, semantic processing, temporal integration, spatial orienting) as well as different attentional mechanisms (attention shifting, distractor filtering), it is unclear what exactly the observed frontoparietal activations reflect. The present functional magnetic resonance imaging study investigated, within the same participants, signal changes in (1) a “Simple Attention” task in which participants attended to a single melody, (2) a “Selective Attention” task in which they simultaneously ignored another melody, and (3) a “Beep Monitoring” task in which participants listened in silence for a faint beep. Compared to resting conditions with identical stimulation, all tasks produced robust activation increases in auditory cortex, cross‐modal inhibition in visual and somatosensory cortex, and decreases in the default mode network, indicating that participants were indeed focusing their attention on the auditory domain. However, signal increases in frontal and parietal brain areas were only observed for tasks 1 and 2, but completely absent for task 3. These results lead to the following conclusions: under most conditions, frontoparietal activations are crucial for attention since they subserve higher‐order cognitive functions inherently related to attention. However, under circumstances that minimize other demands, nonspatial auditory attention in the absence of stimulation can be maintained without concurrent frontal or parietal activations. Hum Brain Mapp 35:2233–2252, 2014. © 2013 Wiley Periodicals, Inc.
Keywords: attention, auditory perception, fMRI, baseline shift, default mode network
INTRODUCTION
When humans are presented with two different auditory stimuli in their left and right ears while attending to one of them, they can report details about the stimuli in the attended, but not in the unattended, ear (Cherry, 1953; Moray, 1959). The mechanism enabling us to voluntarily dedicate processing resources to one stimulus, generally at the expense of another, is often referred to as selective attention and considered a “top‐down” process (as opposed to “bottom‐up” attention, which is attracted in a stimulus‐driven fashion). Two key classical findings illuminating the neuronal underpinnings of top‐down auditory attention are (1) the observation that certain units in cat auditory cortex only respond to auditory stimuli when the animal attends to the stimuli (Hubel et al., 1959), and (2) that event‐related potentials evoked by an auditory stimulus in humans are enhanced by attention (e.g. Alho et al., 1994; Hillyard et al., 1973). Thus, it is clear that attention leads to an increase of neuronal activity in sensory areas corresponding to the attended modality.
The advent of functional neuroimaging enabled researchers to further investigate the neuronal mechanisms of top‐down attention by identifying additional brain regions in which neuronal activity (or its correlates) increases when participants perform a task demanding attention. Numerous such studies have been performed in the visual domain (for reviews see Corbetta & Shulman, 2002; Kastner & Ungerleider, 2000), and the number of studies investigating top‐down attention in the auditory domain, albeit smaller, is still large (for a recent review see Fritz et al., 2007). It would be beyond the scope of the present manuscript to attempt a comprehensive review of these studies, especially since a direct comparison of their results is complicated by the fact that the studies use vastly different experimental designs, tasks, and control conditions. In addition, different studies investigate different aspects of attentional control (e.g. attention shifting from one stimulus, feature, or location to another; attentional set boosting the activation of neuronal populations encoding the to‐be‐attended stimulus even before it is presented; preferential processing of the attended stimulus; and distractor filtering). Despite this, a common observation across studies of visual attention is the involvement of several frontal and parietal brain regions (c.f. the seminal review by Corbetta & Shulman, 2002).
There is increasing evidence that this result may generalize from the visual to the auditory domain (Downar et al., 2001; Hein et al., 2007; Smith et al., 2009), although the exact locations (Bushara et al., 1999) and relative strengths (Salmi et al., 2007) of frontoparietal activations specific to attention may differ in the visual and auditory modalities. Similar posterior parietal and dorsal prefrontal areas are transiently activated during attention shifting, regardless of whether the shift happens in the visual (Yantis et al., 2002) or the auditory domain (Brunetti et al., 2008; Mayer et al., 2006; Shomstein & Yantis, 2006; Salmi et al., 2009), or between sensory domains (Shomstein & Yantis, 2004). Frontal and parietal involvement has also been observed in imaging studies using auditory attention tasks that do not require attention switching, but rather maintenance of attention on a given stimulus (e.g. Alho et al., 1999; Hashimoto et al., 2000; Hill & Miller, 2010; Hugdahl et al., 1999, 2000; Lipschutz et al., 2002; Pugh et al., 1996; Sevostianov et al., 2002; Tzourio et al., 1997; Weeks et al., 1999; Westerhausen et al., 2010; Zatorre et al., 1999).
Many of the above studies employed audiospatial tasks and/or dichotic listening paradigms in which subjects selectively attended to the auditory stimuli presented to one ear while ignoring stimuli presented to the other ear. The spatial processing required in such tasks might be responsible for at least some of the observed “nonauditory” activations. Consistent with this assumption, when an audiospatial task is contrasted with a nonspatial attention task of comparable difficulty, the same frontal and parietal areas are identified as in the above attention studies (Smith et al., 2009), indicating that these areas are at least as much involved with spatial processing as with attention per se. Moreover, some studies investigating nonspatial sustained auditory attention have found activation in frontal, but not parietal areas (Benedict et al., 1998, 2002), and another study (Degerman et al., 2006) revealed weaker activation in the inferior parietal lobule (IPL, see also Weeks et al., 1999) and prefrontal Brodmann areas (BA) 6 and 10 during attention to pitch than for an audiospatial task. Thus, it is still unclear how much of the frontal and parietal activation observed in many studies of visual and some of auditory attention are actually due to sustained attention, and how much of it is due to spatial processing or attention shifting between stimuli.
Moreover, as Corbetta and Shulman (2002) point out, “it is important to distinguish control signals for the generation and maintenance of an attentional set from the top‐down effects of that set on the neural activity evoked by the target stimulus”. In the visual domain, several imaging studies have achieved this separation of top‐down attentional control and target processing by investigating activation increases that occur after an attention cue and prior to target onset (e.g. Corbetta et al., 2000; Hopfinger et al., 2000; Kastner et al., 1999). In the auditory domain, a similar approach was applied by Smith et al. (2009) and Voisin et al. (2006), who cued participants to listen for sound either in the left or right ear. Frontal and parietal activation were observed during the “listening in silence” period prior to sound onset; however, these activations could also be due to the fact that attending to a certain location requires spatial processing. In a recent study (Hill & Miller, 2010), frontal and parietal activations were observed when participants prepared to select one of three simultaneously presented speech streams by pitch (i.e. in a nonspatial task). However, the fact that these activations showed the same left‐dominance that is commonly observed in language processing (Damasio & Geschwind, 1984; DeWitt & Rauschecker, 2012; Kell et al., 2010) suggests that they might reflect pre‐activation of speech processing areas rather than attention effects, which tend to be stronger in the right hemisphere (e.g. Heilman & Van Den Abell, 1980; Petit et al., 2007; Sturm et al., 1999).
The present study asked whether frontoparietal activations would be observed in auditory attention tasks that required neither attention shifting, nor spatial processing, nor speech stimuli; and in particular, whether these activations would still be present when no stimulus processing was required at all. Thus, we used simple pure‐tone stimuli (and, in one condition, no stimuli at all) and required participants to maintain attention on a particular frequency rather than a particular location. There is ample evidence from psychophysical studies indicating that attention to a certain frequency leads to improved behavioral performance specifically near the attended frequency (e.g. Greenberg & Larkin, 1968; Scharf et al., 1987; Schlauch & Hafter, 1991); we were interested in the neural activations behind this performance increase. Second, we wondered whether some of the frontal and parietal activations commonly observed in imaging studies of attention were differentially involved in different aspects of attentional control (specifically, attentional set, preferential processing, and distractor filtering, as outlined above), and thus used tasks of which we expected that they would differ with regards to the demands placed on these different aspects of attentional control.
To shed light on these questions, we compared, in the same participants, blood‐oxygen level dependent (BOLD) signal changes resulting from three different tasks: (1) a “Simple Attention” task in which participants counted rising tone triplets in a short melody consisting of rising and falling triplets, (2) a “Selective Attention” task in which they counted rising tone triplets in one melody while ignoring another melody played simultaneously, and (3) a “Beep Monitoring” task in which participants monitored a silent interval to detect a faint beep that only occurred on a small subset of trials. All tasks were contrasted with passive baseline conditions with identical stimulation as in the attention task, and at the beginning of each task trial, participants received a visual cue telling them whether to direct attention to high or low frequencies. The Selective Attention task was designed to activate as many “auditory attention task related” brain areas as possible. It required a top‐down attentional bias (attentional set), preferential processing of the attended auditory stream, and distractor filtering. Like most attention tasks, it involved additional higher‐order cognitive functions (e.g. temporal integration, counting). The Simple Attention task made lower demands on distractor filtering, but was otherwise similar to the Selective Attention task, so that a comparison of the two should identify brain areas involved in distractor filtering. Finally, the Beep Monitoring task required neither distractor filtering, nor stimulus processing, nor temporal integration or counting; it should thus activate only brain areas that either receive or help maintain a top‐down frequency‐selective attention bias in the absence of stimulation.
Importantly, performing all tasks required sustained auditory attention over a period of more than seven seconds, and imaging data were acquired only at the end of each 10 s trial. For this reason, they should not reveal transient activations related to attention shifting at trial start. In order to minimize the influence of movement preparation and execution during the attention phase, responses were solicited in separate “response trials” following the “stimulation trials”, and the response mapping (i.e. which button to press for which answer) was only revealed at the beginning of each response trial (see Fig. 1). This delayed response required participants to hold their answer in memory, but since this answer was binary (0 vs. 1 beeps, odd vs. even number of rising tone triplets), memory load was minimal.
Figure 1.

Time course of a stimulation and response trial pair. Illustrated is an “attend high” Selective Attention trial. The visual cue “H” at the beginning of the trial informs the participant to count rising tone triplets in the high‐frequency melody (depicted in white) while ignoring the low‐frequency melody (black). The gray ellipses highlight the rising triplets in the to‐be‐attended stream and indicate that the correct count in this trial would be 4. Which response button is associated with this count is only revealed after the next volume acquisition, so that the BOLD images acquired after the end of the stimulation period should not reflect preparation of a specific motor response. In the present example, even numbers are mapped onto the left response button, so that the correct response would be with the left hand. The time course of stimulation trials in the Simple Attention, Beep Monitoring, and Passive Listening conditions was identical to the one depicted here. In Passive Listening blocks, one stimulation trial followed the next, without a response trial in between.
MATERIALS AND METHODS
Participants
Fourteen neurologically normal volunteers (11 female, age range 20–32 years) participated after providing written informed consent as approved by Georgetown University's Institutional Review Board. The experimental procedures were in compliance with the Declaration of Helsinki. All participants reported normal hearing and received financial compensation for their time. Data from two female participants were excluded from further analyses after preliminary screening showed excessive head motion in one case and no significant changes in the BOLD functional magnetic resonance imaging (fMRI) signal to a basic sound‐over‐silence contrast in the other case.
Experimental Design
To avoid compromising auditory stimulus clarity by the noise associated with MR image acquisition and to ensure that even the extremely faint beep stimuli could be heard, we used a sparse‐sampling paradigm (Hall et al., 1999) with a slow event‐related design in which acquisitions of single whole‐brain image volumes occurred intermittently (every 10 s) rather than continuously, resulting in a silent interval of several seconds during which auditory stimuli were presented. This method has the additional benefit that BOLD responses generated by the scanner noise have time to return to baseline before the next image acquisition occurs (Hall et al., 2000) and thus have a much lower negative impact on the signal‐to‐noise ratio.
Each participant completed five functional runs of 12.5 minutes each. Within each run, four task blocks (Passive Listening, Simple Attention, Selective Attention, and Beep Monitoring) were presented in random order, each preceded by an instruction screen. A blocked design was used to avoid confusing participants by requiring them to switch tasks on a trial‐by‐trial basis. A 60‐minute training session prior to scanning ensured that participants were familiar with the stimuli and timing of the experiment, including intermittent scanner noise, which was simulated during training.
Passive Listening blocks consisted of 16 stimulation trials, 4 with melodies at each of 3 center frequencies (see section “Stimuli”), and 4 during which there was no auditory stimulus (silent baseline). The instruction screen preceding resting blocks indicated that participants should relax and ignore the auditory stimuli. Each trial started with data acquisition to capture the BOLD response evoked by the previous trial. Simultaneously, a visual cue instructed participants to rest (cue “R”).
Simple Attention blocks were comprised of four stimulation trials with melodies around a high center frequency and four stimulation trials with melodies around a low center frequency, in random order. At the beginning of the block, participants were instructed to count the number of rising tone triplets in the melody. Each stimulation trial started with the presentation of a visual cue (“L” for low or “H” for high) indicating the frequency band at which the stimuli would be played. A response trial followed each stimulation trial and began with data acquisition for the previous trial, followed 5.5 seconds later by a prompt for a motor response. Participants were instructed to press the button in their left or right hand, depending on how many rising triplets they had counted during the previous stimulation trial (see Fig. 1). Since there were six triplets per trial and the direction of each was determined randomly with the constraint that there had to be at least 1, there could be between 1 and 6 triplets. To minimize the number of buttons, participants were instructed to press one button for even numbers of triplets and the other button for odd numbers. Which of the buttons was assigned for odd/even responses was determined randomly on each trial and only revealed after stimulation so that subjects could not pre‐plan a specific motor response during the stimulation period.
Selective Attention blocks were identical to Simple Attention blocks, except that melodies at the low and the high center frequency were played simultaneously during the stimulation period. Participants were instructed to count rising sequences in the frequency range indicated by the cue at trial start while ignoring the other melody. Figure 1 illustrates the timing and stimuli within a stimulation and response trial pair in a Selective Attention block.
Beep Monitoring blocks followed the same scheme, but here, the participants' task was to determine whether a faint beep was played during the silent interval following the visual cue. To ensure that participants attended throughout the trial, they were told that the beep could occur at any time during the silent period and that they were likely to miss it unless they maintained highly focused attention on the correct frequency range (a claim supported by a number of studies on auditory signal detection, e.g. Greenberg & Larkin, 1968; Scharf et al., 1987; Schlauch & Hafter, 1991). Participants knew that beeps would only occur rarely, but they were not informed about the exact likelihood, which was 50% during training but only 10% during the scan to minimize the number of non‐silent Beep Monitoring trials. In the response trial following each stimulation trial, participants indicated by button press whether they did or did not hear a beep. For all tasks, the response mapping was randomly chosen on each trial. There were four high‐ and four low‐frequency beep monitoring trials per block, presented in random order.
Stimuli
The experiment was run using Presentation® software (Version 12.0). Visual stimuli were presented on a black background, and a white fixation point was always present at screen center. Instructions were rendered in white, and visual cues (letters R, L, or H) were presented in bright green directly above fixation. Auditory stimuli consisted of pure tones and were presented binaurally around three different center frequencies: “low” (587.3 Hz, D5 on the piano keyboard), “mid” (1480.0 Hz, F#6), and “high” (3520.0 Hz, A7). These frequencies were chosen to span the human speech range while not sharing the same chroma and so that the simultaneous presentation of low and high frequency melodies was perceived as harmonic.
Prior to scanning, we determined the participant's pure‐tone thresholds for each of the center frequencies using a modified staircase procedure by playing sequences of three identical 200 ms beeps separated by 100 ms, followed by a 600 ms silent interval during which participants pressed a button if they had heard the stimuli. Threshold assessments were performed while the participant was already in the scanner and wore the same headphones as used during the scan (STAX SR‐003 In‐The‐Earspeaker, mounted in Bilsom Thunder T1 ear defenders that tightly sealed around the participants' ears to attenuate scanner noise). The initial volume of the beeps was approximately 0 dB HL. If no button press occurred, the volume increased by 2.5 dB and the beeps repeated. After a button press, the volume was reduced randomly by 7.5, 10, 12.5, 15, or 17.5 dB, and then increased by 2.5 dB each trial until the next button press. This procedure was repeated until the participant pressed the button at the same volume at least three consecutive times for each of the frequencies. Instead of playing stimuli at a constant dB level above the participant's hearing threshold for each frequency, we aimed to hold subjective loudness constant. To this effect, we used the difference between the hearing threshold contour and the equal loudness contour for the desired loudness (in phon) according to international standard ISO 226:2003 to determine how many dB above the participant's hearing threshold to play the stimuli at each frequency. Participants confirmed that the stimuli were perceived as equally loud.
For the Beep Monitoring task, a single 300 ms beep at the center frequency was played at about 15 phon at a random time during the stimulation period. The stimuli used in the Passive Listening, Simple Attention, and Selective Attention conditions consisted of six triplets of pure tones, played at 50 phon. The middle tone of each triplet was at the center frequency, and the surrounding two were one whole step above and below it, generating either a rising triplet (e.g. C5, D5, E5) or a falling triplet (e.g. E5, D5, C5). Each of the tones was 300 ms in duration, and they were played in succession. During each stimulation period, six triplets were played, each followed by a 300 ms gap, generating a melody of 7200 ms duration. The direction (rising or falling) of each triplet was chosen randomly, with the constraint that there had to be at least one rising triplet per trial. For the Selective Attention condition, melodies at the high and low frequency were played simultaneously, as illustrated in Figure 1.
MRI Protocol
All images were acquired on a 3.0‐Tesla Siemens Trio scanner using a 12‐channel head coil. High‐resolution anatomical images covering the entire cerebral cortex were obtained with a T1‐weighted sequence [repetition time (TR) = 2530 ms, echo time = 3.5 ms, field of view = 256 mm, voxel size = 1.0 mm3]. Functional data were collected using a sparse sampling paradigm in which acquisitions of echo‐planar images (EPIs, 50 slices covering the entire brain, voxel size = 3 × 3 × 3 mm) were separated by a period of silence (acquisition time TA = 2310 ms, effective TR = 10 s).
MRI Data Analysis
Preprocessing
Data analysis was performed using BrainVoyager QX (Brain Innovation). Anatomical images were corrected for inhomogeneity and transformed into Talairach space (Talairach & Tournoux, 1988). Functional images were corrected for motion in six directions using the first volume of the fourth run as the alignment target. Linear trends as well as low‐frequency signal changes, which can be caused by scanner drift and physiological noise, were removed using a general linear model (GLM) with a constant predictor, a linear trend predictor, and two sine/cosine predictors to capture low‐frequency signal changes. The functional data were then co‐registered with the native‐space anatomical data using header‐based information for initial alignment, followed by intensity‐driven nine‐parameter affine alignment between the first EPI slice of the volume and the anatomical image as implemented in BrainVoyager. The results of this automatic alignment procedure were inspected carefully and manual adjustments were made as appropriate. The functional data were then transformed into Talairach space using the same parameters as for the anatomical images. For the group analyses, the functional data were spatially smoothed with a three‐dimensional Gaussian kernel at 6 mm FWHM.
General linear model predictors
Preprocessed functional data were analyzed using a mixed‐effects (random effect of participants and fixed effects of experimental conditions) GLM. Table 1 lists the predictors used to model the functional data, along with the stimuli and attention instructions associated with each of the conditions. The first predictor (silent baseline) was not modeled explicitly, but used as a constant term estimating the intercept of the regression model, i.e. the baseline signal level relative to which BOLD signal changes in all other conditions are modeled. The last three predictors (resp_x, L_beep, and H_beep) were modeled as predictors of no interest because they did not occur in each run. An alternative analysis was performed in which error trials were modeled as separate predictors of no interest, but since this did not appreciably alter the results, we only report the results obtained using the simpler model described above. Because our sparse sampling design allowed for the acquisition of only a single volume per trial, and because our stimulation period was sufficiently long to expect that the BOLD response was approximately at plateau, we did not convolve our predictors with a model of the hemodynamic response function but instead used boxcar predictors.
Table 1.
Predictors
| Name | Visual stimulus | Auditory stimulus | Attention focus |
|---|---|---|---|
| silent_baseline | Initially, cue “R”; fixation spot | ||
| L_pass | Initially, cue “R”; fixation spot | L melody | |
| M_pass | Initially, cue “R”; fixation spot | M melody | |
| H_pass | Initially, cue “R”; fixation spot | H melody | |
| (L+H)_pass | Initially, cue “R”; fixation spot | (L+H) melody | |
| L_ais | Initially, cue “L”; fixation spot | L | |
| H_ais | Initially, cue “H”; fixation spot | H | |
| L_att | Initially, cue “L”; fixation spot | L melody | L |
| H_att | Initially, cue “H”; fixation spot | H melody | H |
| L_sel | Initially, cue “L”; fixation spot | (L+H) melody | L |
| H_sel | Initially, cue “H”; fixation spot | (L+H) melody | H |
| Instr | Instruction screen | reading | |
| resp_l | Response mapping | reading | |
| resp_r | Response mapping | reading | |
| resp_x | Response mapping | reading | |
| L_beep | Initially, cue “L”; fixation spot | L beep | L |
| H_beep | Initially, cue “H”; fixation spot | H beep | H |
L, low center frequency; M, mid center frequency; H, high center frequency; pass, passive listening (no task); ais, attend in silence (beep monitoring task); att, attend to a melody (simple attention task); sel, selectively attend to one of two simultaneous melodies (selective attention task); instr, read instructions; resp, read response mapping and press a button (l, left; r, right; x, no button was pressed).
The GLM was used to estimate standardized regression coefficients (beta values) indicating how well each of the predictors predicted the BOLD time course of each voxel in the brain, separately for each subject. For group‐level analyses, the resulting beta values were then assigned different weights to test their significance and compare them with each other (see section “Contrasts” for a description of the contrasts used). This approach allows us to explicitly model inter‐subject variability and thus has the advantage that the results may be generalized beyond the present sample (albeit with caution, since the sample was small and likely not a good representation of the general population, but rather of college students).
Contrasts
To test the beta values (and thus the BOLD signal changes) associated with each predictor for significance and to compare them with each other, we defined a number of contrasts (Table 2) using the predictors listed in Table 1. Contrast sound > silence assigned a weight of 1 to predictor M_pass, and thus provided an estimate of how strongly each voxel's BOLD signal was influenced by auditory stimulation at a “medium” frequency. It was used to identify voxels responsive to sound stimulation in the absence of an attention task with a stimulus that never occurred during the attention tasks. Since preliminary analyses revealed no fundamental differences between conditions with low‐ and high‐frequency stimulation, corresponding predictors for low‐ and high‐frequency conditions were combined. To get an estimate of how strongly each voxel's signal was influenced simply by listening for a sound, we defined contrast AiS, which assigned weights of 1 to predictors L_ais and H_ais. Similarly, contrast pass assigned weights of 1 to predictors L_pass and H_pass, thus capturing the BOLD signal changes associated with passive listening to low‐ and high‐frequency melodies. Contrast att assigned weights of 1 to predictors L_att and H_att, thus capturing the signal change for attentive listening to low‐ and high‐frequency melodies; and contrast sel, which assigned weights of 1 to predictors L_sel and H_sel, captured the signal change for the two selective attention conditions. Lastly, contrast (L+H) assigned a weight of 1 to predictor (L+H) and thus describes the signal change associated with passive listening to simultaneously played low‐ and high‐frequency melodies.
Table 2.
Contrasts
| Name | Description in terms of predictors contrasted | Used to measure signal changes due to | Recruited brain areas |
|---|---|---|---|
| sound > silence | M_pass – silent_baseline | Auditory stimulation in general | Primary and nonprimary ACx alike |
| pass | (L_pass+H_pass) – silent_baseline | Stimulation with single melodies at L or H | Primary and nonprimary ACx alike |
| (L+H) | L+H_pass – silent_baseline | Simultaneous stimulation with melodies at L and H | Primary and nonprimary ACx alike |
| att | (L_att+H_att) – silent_baseline | Stimulation with and attention to single melodies at L or H | ACx, nonprimary more than primary, FPN |
| sel | (L_sel+H_sel) – silent_baseline | Stimulation with and selective attention to one of two simultaneously played melodies at L and H | ACx, nonprimary more than primary, FPN |
| AiS | (L_ais+H_ais) – silent_baseline | Auditory attention in the absence of stimulation | Primary and nonprimary ACx alike, but not FPN |
| ATT | (L_att – L_pass) + (H_att – H_pass) | Attention to a single melody at L or H | ACx, nonprimary more than primary, FPN |
| SEL | (L_sel – (L+H)_pass) + (H_sel – (L+H)_pass) | Selective attention to one of two simultaneously played melodies at L and H | ACx, nonprimary more than primary, FPN |
L, low center frequency; M, mid center frequency; H, high center frequency; ACx, auditory cortex; FPN, fronto‐parietal network. Note that lower case contrasts compare the condition(s) of interest to the silent baseline, whereas upper case contrasts compare the condition(s) of interest to a passive listening condition with identical stimulation.
We were particularly interested in how the various attention conditions modulated the BOLD response in the absence of changes in stimulation. Contrast AiS, as defined above, addresses this question for attention in silence, but contrasts att and sel capture changes in stimulation as well as changes in attention. Therefore, we defined two additional contrasts. Contrast ATT, defined as (L_att–L_pass)+(H_att–H_pass), i.e. assigning weights of 1 to predictors L_att and H_att and weights of –1 to predictors L_pass and H_pass, assessed where the BOLD response differed depending on whether participants did or did not attend to a single melody. Contrast SEL, defined as (L_sel–(L+H)_pass)+(H_sel–(L+H)_pass), revealed areas in which the BOLD response was modulated by whether or not participants selectively attended to one of two simultaneously played melodies. In this latter contrast, the passive listening predictor (L+H)_pass was given a weight of –2 so as to achieve a fair comparison with the two attention conditions, which were each given a weight of 1. An overview of all contrasts (including a definition of the use of upper and lower case) is given in Table 2.
Statistical tests and thresholds
Each contrast was subjected to a t‐test with 11 degrees of freedom to identify voxels in which the contrast result differed significantly from zero. To choose single‐voxel map thresholds for the whole‐brain analyses, we first determined, for each statistical map, the threshold at which the proportion of false significant voxels in the map was less than q < 0.05 (false discovery rate, FDR; Benjamini & Hochberg, 1995). Since we wanted to show all maps at comparable single‐voxel thresholds, we then chose the most conservative single‐voxel threshold of all the maps included in planned comparisons (P < 0.004) and applied it to all maps. This way, all maps shown are thresholded at q < 0.05 (FDR‐corrected for multiple comparisons) or stricter.
For regions of interest (ROI) analyses (see below), beta values for each predictor were averaged across all voxels within the ROI, and these average beta values (one per subject, predictor, and ROI) were then subjected to t‐tests using the same contrasts described above. For consistency between the statistical maps illustrating the whole‐brain analysis and the ROI analyses, our ROI analyses used the same statistical threshold that was applied to the whole‐brain analyses (P < 0.004). The correlation analyses reported in section “Correlation of behavioral performance with BOLD response modulation” and illustrated in Figure 7 were performed using these same average beta values and each subject's error rates in the three different tasks.
Figure 7.

Correlations between the percentage of errors made in the selective attention task and the BOLD signal increases relative to silent baseline in the selective attention task (gray) and the simple attention task (black).
Regions of interest (ROIs)
In order to directly compare BOLD signal changes associated with the different attention conditions within the same brain regions, we performed several ROI analyses. ROIs corresponding to primary and nonprimary auditory cortex on mid superior temporal gyrus (mid‐STG) were defined based on average brain anatomy and the sound > silence contrast described above. One ROI drawn bilaterally along medial Heschl's gyrus (mHG) captured mostly primary auditory areas, and one placed more laterally on planum temporale (latPT) sampled nonprimary auditory areas. We then excluded all voxels from the ROIs that did not reach significance for a sound > silence contrast. ROI details can be found in Figure 3.
Figure 3.

BOLD signal increases in medial and lateral regions of auditory cortex. (A) Illustration of the manually drawn anatomical ROIs on mHG (thought to encompass primary auditory cortex, shown in yellow) and lateral planum temporale (latPT, thought to include nonprimary auditory belt and parabelt areas, shown in dark red). The numbers next to the image are the Talairach coordinates of the crosshairs intersection, the numbers below indicate the coordinates of the geometrical center and the size of the ROI. (B) BOLD signal changes associated with the different contrasts for the medial and lateral ROIs (left and right hemispheres combined). Identically colored bars represent conditions with identical stimulation (blue, silence; green, single melody; orange, two simultaneous melodies). In conditions AiS, att, and sel, participants performed an attention task, in conditions pass and (L+H), as well as for the silent baseline, they rested. Error bars represent ± 1 standard error (SE) around the group mean. Note that each bar, with the exception of the one for (L+H), is based on the sum of two conditions (one with stimulation/attention at low and one with stimulation/attention at high frequencies). To balance the comparison, condition (L+H) thus received a weight of 2. All conditions evoked significant BOLD signal increases compared to silent baseline in both ROIs, as did the attention‐related difference between resting and listening in silence (contrast AiS). In contrast, the difference between passive and attentive listening to auditory stimuli (contrasts ATT and SEL) only reached significance in latPT, but not mHG when applying the same threshold as used for the whole‐brain analyses (P < 0.004, corresponding to FDR‐corrected q < 0.05 or stricter). However, at an uncorrected threshold of P < 0.05, both contrasts ATT and SEL would be deemed significant in both ROIs. Thus, while attentional modulation of sound‐evoked activation in primary auditory cortex may not be completely absent, it is clearly weaker than in nonprimary, more lateral belt/parabelt regions of auditory cortex, whereas attention in silence affected both primary and nonprimary auditory cortex alike (see also Fig. 6).
In addition to these mid‐STG ROIs, we defined several functional ROIs based on the activation maps for contrasts SEL and ATT, thresholded at P < 0.004 (i.e. FDR‐corrected q < 0.05 or stricter). Wherever both contrasts ATT and SEL led to significant signal increases in partially overlapping clusters of voxels, we combined the activation foci into one larger ROI. ROI details can be found in Figure 5.
Figure 5.

Average BOLD signal changes in all ROIs outside mid‐STG (for those, see Fig. 3). Conventions are as in Figure 3. Triangles indicate those contrasts whose significance at an FDR‐corrected threshold of q < 0.05 in a whole‐brain analysis contributed voxels to the ROI (for a more detailed description on how the ROIs were identified, see section “Regions of interest”). Note that each bar, with the exception of the one for (L+H), is based on the sum of two conditions (one with stimulation/attention at low and one with stimulation/attention at high frequencies). To balance the comparison, condition (L+H) thus received a weight of 2. Beneath the name of each ROI, the Talairach coordinates of the ROI's activation peak for contrast SEL and the size of the ROI are given.
RESULTS
Behavioral Performance
As can be seen in Table 3, of the three tasks, participants had most difficulty with the Selective Attention task, where there were large performance differences between individuals (the percentage of errors ranged from 0 – perfect performance – to 55 – not significantly better than chance). Fewest errors were made in the Simple Attention task. All errors in Beep Monitoring were false positives. There was no significant difference in performance between high‐ and low‐frequency stimuli (all P's ≥ 0.72). The results also did not change noticeably when the analyses were performed while excluding the data of two participants who performed at chance level in the selective attention task. Thus, only analyses including all subjects are reported here.
Table 3.
Behavioral performance
| Task | % errors (mean ± SE) |
|---|---|
| L Beep Monitoring | 7.9 ± 3.9 |
| H Beep Monitoring | 7.5 ± 2.9 |
| L Simple Attention | 3.5 ± 1.4 |
| H Simple Attention | 3.0 ± 1.3 |
| L Selective Attention | 25.7 ± 5.7 |
| H Selective Attention | 27.1 ± 5.8 |
L, low center frequency; H, high center frequency; SE, standard error.
fMRI Results
BOLD responses in mid‐STG
A whole‐brain analysis revealed that when participants directed their attention to the auditory domain, the BOLD response in mid‐STG was significantly higher than when participants relaxed under the same stimulation conditions. This attentional boost was observed even in the absence of stimulation (i.e. when participants listened for a beep but none was actually presented) and occurred in mid‐STG regions that were also activated by passive listening to sound (Fig. 2A).
Figure 2.
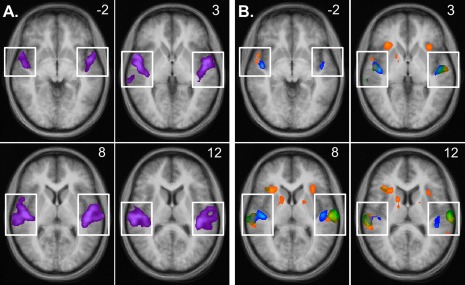
BOLD signal increases in mid‐STG. (A) Signal increases associated with passive listening to stimulation at a middle frequency (located between the low and high frequencies used in the attention tasks) compared to silent baseline, superimposed on an averaged anatomical image. (B) Signal increases associated with attention in silence (contrast AiS, shown in blue), attention to a single melody (contrast ATT, green), and selective attention to one of two melodies (contrast SEL, orange), compared to conditions in which participants passively listened to the same stimuli. While attending to auditory stimuli (contrasts ATT and SEL) increased the BOLD response predominantly in lateral STG, attention in silence (contrast AiS) additionally led to significant increases of the BOLD response in medial HG. Individual data (not shown) showed the same general pattern. Note: Activations outside superior temporal cortex (not contained within the white boxes) will be discussed in Figure 4. The numbers in the upper right corner of each image indicate the z‐coordinate of the depicted horizontal slice in Talairach space. All maps are thresholded at t > 3.62, P < 0.004 (the strictest single‐voxel threshold corresponding to q < 0.05 when FDR‐correction for multiple comparisons was applied to the maps).
However, as can be seen in Figure 2B, the spatial distribution of the observed attentional modulation differed depending on whether or not auditory stimulation was present. BOLD signal increases associated with auditory attention in the presence of auditory stimulation (contrasts ATT and SEL, shown in green and orange, respectively) were strong and significant in lateral STG and planum temporale (PT), but weaker and not significant at FDR‐corrected q < 0.05 along mHG. In contrast, attention in silence (contrast AiS, shown in blue) also increased the BOLD response significantly along mHG, an area thought to contain human primary auditory cortex (Liegeois‐Chauvel et al., 1991; Morosan et al., 2001; Penhune et al., 1996). The same pattern was evident when looking at the data of individual participants (not shown).
To look at BOLD signal changes in auditory cortex in more detail, we extracted BOLD signal changes compared to silent baseline for anatomically defined ROIs roughly corresponding to primary (mHG) and nonprimary (latPT) auditory cortex (see section “Regions of interest”). The borders of the mHG ROI (marked in yellow in Fig. 3A) roughly correspond to the Talairach coordinates given for primary auditory cortex by Rademacher et al. (2001). Our latPT ROI (marked in red in Fig. 3A) roughly corresponds to the lateral portion (x > 47, x < –47) of the PT as mapped by Westbury et al. (1999). Figure 3B illustrates BOLD signal changes in the different conditions for the two ROIs in comparison. While there were significant increases in the BOLD response compared to silent baseline in all conditions for both ROIs, the difference between passive and attentive listening to sounds (contrasts ATT and SEL) only reached significance for the latPT ROI, whereas the difference between passive and attentive listening in silence was significant for both ROIs. Note, however, that we are using the same significance threshold (P < 0.004, corresponding to FDR‐corrected q < 0.05) as in the whole‐brain analyses, which may be considered strict for an ROI analysis. Thus, before claiming the absence of an effect for any given contrast, we decided to also test at a lenient uncorrected threshold of P < 0.05. At this threshold, attention‐related signal increases were significant for all conditions in both latPT and mHG.
BOLD response outside mid‐STG
Whereas attending in silence (contrast AiS) did not produce significant BOLD response increases in any brain region except mid‐STG, we did observe BOLD signal increases for attention to sound (contrast SEL and/or ATT) in several additional brain areas. Two of these, right anterior STG (Fig. 4A) and the left temporo‐parietal junction (TPJ, see Fig. 4B), showed significant BOLD increases at the whole‐brain FDR‐corrected threshold of q < 0.05 only for selective attention (SEL), but increases associated with contrasts ATT and AiS were observed in the same regions at an uncorrected threshold of P < 0.05 (see also Figs 5 and 6). At this lenient threshold, both antSTG and TPJ also showed significant BOLD increases during passive listening, which was not observed for any other ROIs except mHG and latPT and indicates that at least some of the voxels in these ROIs can be considered “auditory‐sensory”.
Figure 4.
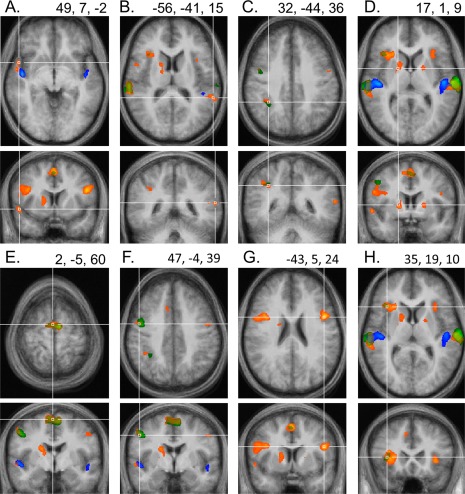
Attention‐related BOLD signal increases outside mid‐STG, superimposed on averaged transverse and coronal views of the brain. The numbers in the upper right corner of each panel indicate the coordinates of the crosshairs intersection in Talairach space. All maps are thresholded at t > 3.62, P < 0.004 (corresponding to or stricter than FDR‐corrected q < 0.05). In addition to the effects observed in mid‐STG (shown in Fig. 2), significant BOLD response increases for attention to auditory stimulation (contrast ATT, shown in green, and contrast SEL, shown in orange) were also present in right anterior STG (A), at the left TPJ (B), right IPL (C), bilaterally in the putamen, with activation spreading into the caudate in the right hemisphere (D), in SMA and pre‐SMA (E), bilaterally on the precentral gyrus (F), along posterior IFG (BA44, see G), and at the intersection of IFG/antIns (H). Notably, none of these areas displayed an increased BOLD response for attention in silence (contrast AiS, blue). For this condition, BOLD response increases were confined to STG. The same pattern was evident in individual data (not shown).
Figure 6.

Direct comparison of the average BOLD signal changes associated with the three attention tasks, for all ROIs. Conventions as in Figure 5.
In frontal cortex, both contrasts investigating attention to auditory stimuli (ATT and SEL) revealed significant activation increases at the FDR‐corrected threshold of q < 0.05 in an area on the posterior‐dorsal section of the superior frontal gyrus in medial BA 6, also known as the supplementary motor area (SMA, Fig. 4E), as well as in the slightly more anterior pre‐SMA, in lateral regions of the precentral gyri (preCG, Fig. 4F), along the opercular part of the IFG (BA 44) (posterior IFG, Fig. 4G), and at the confluence of the inferior frontal gyrus and the anterior insula (IFG/antIns, Fig. 4H). Only a single parietal region, namely the right IPL, BA 40, (Fig. 4C), showed significant BOLD signal increases when participants attended to auditory stimulation. In addition, BOLD response increases for contrast SEL alone were also observed bilaterally in the putamen (Fig. 4D) and in the right caudate.
Figure 5 illustrates the average signal changes in all conditions compared to silent baseline for all clusters of voxels displaying significant signal increases for at least one of the attention contrasts. As can be seen in Figure 4, the clusters for contrast SEL were generally larger and thus included those for contrast ATT. In those cases where there was only partial overlap, we combined both clusters into one ROI. (Example: both contrasts led to significant BOLD signal increases in the right IPL. However, as shown in Figure 4C, the activations only partly overlapped. Our IPL‐ROI includes voxels in the right IPL that show a significant BOLD signal change either for ATT, or SEL, or both.) With the exception of right antSTG and left TPJ, none of these ROIs was activated significantly during passive listening [pass and (L+H)], nor did they show signal increases during attention in silence (AiS), even at a lenient uncorrected threshold of P < 0.05. Attention‐related activation increases were generally stronger for selective (contrast SEL) than for “simple” attention (contrast ATT).
It is possible that the absence of frontal and parietal activations in the Beep Monitoring task, as seen in the averaged group data, resulted from the fact that individual activations were confined to small, non‐corresponding locations in different participants. We thus inspected individual maps and found that they showed the same pattern as the averaged group data: Frontal and parietal activations were clearly evident for contrasts ATT and SEL, but did not occur for contrast AiS, even at strongly reduced thresholds (data not shown).
Comparison of attention‐related BOLD response modulations
Figure 6 provides a direct comparison of the BOLD signal changes associated with the three attention contrasts for all ROIs. It shows that BOLD signal increases were significantly stronger for contrast AiS than for contrasts SEL and ATT in mHG. None of the other ROIs along STG (latPT, antSTG), showed significant differences between the three contrasts.
For all remaining ROIs, signal increases associated with contrast SEL were significantly stronger than signal increases associated with contrast AiS, passing the threshold of P < 0.004 (corresponding to the whole‐brain FDR‐corrected threshold of q < 0.05) in SMA, pre‐SMA, posterior IFG, right IPL, and in left preCG and antIns, and an uncorrected threshold of P < 0.05 in right preCG and antIns as well as left TPJ, left putamen, and right caudate. The same tendency was evident for the comparison of ATT and AiS, although it reached significance at P < 0.004 only in SMA, pre‐SMA, and left preCG and failed to pass even the uncorrected threshold in the IFG/antIns ROIs and the TPJ. Signal increases associated with contrast SEL exceeded those associated with contrast ATT bilaterally in IFG/antIns, posterior IFG, and in the preSMA, although only the differences in right posterior IFG and left anterior insula passed P < 0.004.
Correlation of behavioral performance with BOLD response modulation
Because behavioral performance in the Selective Attention task varied widely between individuals, we also investigated the relationship between attention‐related BOLD signal changes and behavioral performance (measured as percent error) in the associated attention task, separately for each ROI. There were no significant (r > 0.58) correlations between Selective Attention task performance and BOLD signal changes associated with contrasts AiS, ATT, or SEL, nor were there correlations between performance in the Beep Monitoring or the Simple Attention task and contrasts att or sel (refer to Table 2 for contrast definitions and the distinction between upper and lower case). However, substantial correlations existed between error rates in the Selective Attention task and the BOLD increases associated with this task (compared to silent baseline – contrast sel) in preSMA, IFG/antIns, and the basal ganglia, indicating that these areas were activated more when participants had difficulty performing the task (Fig. 7, gray markers).
These same areas also displayed substantial correlations between error rates in the Selective Attention task and the BOLD increases associated with the Simple Attention task (compared to silent baseline – contrast att), i.e. across tasks (Fig. 7, black markers). This may seem surprising since one would instead have expected correlations between contrast att and performance in the Simple Attention task, i.e. the task that gave rise to the contrast. However, it is likely that for participants who struggled with the Selective Attention task, the Simple Attention task was also harder (leading to stronger activation increases). This would not necessarily be reflected in their error rate in this task, which was so low for all participants that the lack of variation would have made it difficult to observe significant correlations. Taken together, this suggests that the higher activations during the Selective Attention task likely reflect task difficulty, rather than error‐related processes.
Attention‐related BOLD response decreases
Aside from the above‐mentioned increases, we also observed strong and widespread reductions of the BOLD response for all attention contrasts (AiS, ATT, and SEL). These BOLD signal decreases were particularly strong in medial parietal areas (especially the precuneus), in posterior cingulate, occipital lobe, and along the occipitotemporal gyri, but decreases were also observed in medial prefrontal cortex including ventromedial and anterior cingulate areas, as well as in the postcentral gyri.
DISCUSSION
Summary and General Findings Replicating Previous Results
This study compared BOLD signal changes associated with three different auditory attention tasks: (1) a “Simple Attention” task in which participants counted rising tone triplets in a single melody, (2) a “Selective Attention” task in which they performed the same counting task while ignoring another, simultaneously presented melody, and (3) a “Beep Monitoring” task in which participants listened in silence for a faint beep that only occurred on few trials (which were excluded from the analysis). While the first two tasks are discrimination tasks in which participants had to differentiate target (rising) from non‐target (falling) tone triplets and respond accordingly, the third task is a detection task requiring neither stimulus processing, nor distractor filtering, nor counting. The only commonality between the tasks is that all of them required auditory attention to a certain frequency range.
As expected, all tasks led to an increase in auditory cortex activation compared to resting conditions with identical stimulation. This replicates findings of numerous studies demonstrating an “attentional boost” of activation in sensory cortex associated with processing an attended stimulus or feature using methods as diverse as animal electrophysiology (Hubel et al., 1959; Reynolds, et al., 2000; Treue & Martinez Trujillo, 1999), EEG (Hillyard & Anllo‐Vento, 1998; Hillyard et al., 1973), MEG (Rif et al., 1991; Sokolov et al., 1999; Woldorff et al., 1993), PET (Alho et al., 1999; Corbetta et al., 1990; O'Leary et al., 1996; Tzourio et al., 1997), and fMRI (e.g. Brefczynski & DeYoe, 1999; Grady et al., 1997; Jäncke et al., 1999; Mayer et al., 2009; Paltoglou et al., 2009; Rinne et al., 2005; Wojciulik et al., 1998). That we observed such increases even in the absence of stimulation conforms with the results of other attention studies, both in the visual (Kastner et al., 1999) and in the auditory domain (Smith et al., 2009; Voisin et al., 2006), as well as studies of auditory imagery (Bunzeck et al., 2005; Kraemer et al., 2005), which can be conceived of as equivalent to auditory attention in silence (Driver & Frith, 2000).
All tasks also led to BOLD signal decreases in visual and somatosensory areas (occipital cortex and the postcentral gyri), which most likely reflect cross‐modal inhibition, i.e. a deactivation in sensory cortical areas responsible for processing stimuli in non‐attended modalities when attention is directed toward another sensory modality (e.g. Ciaramitaro et al., 2007; Hairston et al., 2008; Haxby et al., 1994; Hein et al., 2007; Johnson & Zatorre, 2005, 2006; Mozolic et al., 2008; Shomstein & Yantis, 2004; Woodruff et al., 1996). BOLD signal decreases also occurred in several areas of the so‐called “default mode network” (DMN, Raichle et al., 2001), whose activity has previously been shown to decrease during a variety of cognitive tasks requiring attention to external stimuli regardless of the stimuli used (Binder et al., 1999; Gusnard & Raichle, 2001; Mazoyer et al., 2001; McKiernan et al., 2003; Shulman et al., 1997).
For both discrimination tasks, we also observed BOLD signal increases in several frontal and parietal areas previously identified in imaging studies investigating the neural basis of auditory attention (e.g. Hill & Miller, 2010; Mayer et al., 2006; Pugh et al., 1996; Salmi et al., 2009; Sevostianov et al., 2002; Shomstein & Yantis, 2006; Westerhausen et al., 2010; Wu et al., 2007; Zatorre et al., 1999), as well as bilaterally in the putamen. The latter finding is consistent with previous evidence for a role of putamen and caudate in auditory attention (Voisin et al., 2006; Wu et al., 2007), discrimination learning (Seger & Cincotta, 2005), and in sequence learning and monitoring (including non‐motor, auditory sequences; Leaver et al., 2009; Schubotz & von Cramon, 2001; Vakil et al., 2000).
Simple Versus Selective Attention
Our two discrimination tasks differed regarding distractor filtering demands and task difficulty, which were lower in the Simple Attention task than in the Selective Attention task. Thus, it is not surprising that BOLD signal changes were weaker in the Simple Attention task for all frontal ROIs, and significantly so in posterior IFG (BA44) and at the intersection of IFG/antIns. This finding is consistent with the known role of prefrontal and anterior insular regions in cognitive control and inhibition in general (Aron et al., 2004; Bunge et al., 2001; Cole & Schneider, 2007; Knight et al., 1999) and distractor interference suppression in particular (Bunge et al., 2002). However, the observed correlations between task difficulty (error rates) and task‐related signal increases in IFG/antIns and the pre‐SMA (as well as basal ganglia) also suggest an influence of task difficulty, in line with previous research (Barch et al., 1997). Considering the absence of such correlations in posterior IFG, we suspect that the activation differences in this area are mostly due to higher distractor filtering demands in the Selective Attention task, whereas those in IFG/antIns likely reflect a mixture of task difficulty and distractor filtering demands.
Attention in the Presence Versus Absence of Stimulation
Differences in auditory cortex
In good agreement with previous studies, attentional modulation for both discrimination tasks involving auditory stimulation was more pronounced in lateral (nonprimary) compared to medial (primary) auditory cortex (e.g. Grady et al., 1997; Hill & Miller, 2010; Petkov et al., 2004; Woods et al., 2009). By contrast, auditory attention in silence (i.e. in the Beep Monitoring task) increased the BOLD signal in both primary and nonprimary areas alike. While significant attentional modulation in primary auditory cortex has been reported before (Grady et al., 1997; Jäncke et al., 1999; Paltoglou et al., 2009), the differential activation patterns for the discrimination tasks on one hand and the Beep Monitoring task on the other hand are surprising. Since in addition to auditory attention the discrimination tasks also required temporal integration, pattern recognition, and auditory stream segregation, one might have expected stronger signal increases for these tasks. Instead, activations for the Beep Monitoring task were just as strong in nonprimary, and stronger in primary auditory cortex.
We suspect that this puzzling finding can be explained as follows. First, our Beep Monitoring task was uniquely suited for revealing attention effects in primary auditory cortex because it did not include auditory stimulation. It is known (and also evident from Fig. 3) that even passive exposure to auditory stimuli strongly activates primary auditory cortex, and it is possible that compared to this strong baseline activation any increase brought about by top‐down attention is negligible. Thus, auditory attention effects in primary auditory cortex would be more evident in comparison to a baseline condition that does not involve auditory stimulation. Second, the reason that activation increases in our Beep Monitoring task were not stronger in nonprimary compared to primary auditory cortex may be that it involved the simple pure‐tone stimuli preferred by primary auditory cortex (Rauschecker et al., 1995; Wessinger et al., 2001), whereas the other two tasks involved more complex stimuli, as preferred by nonprimary areas (Chevillet et al., 2011; Rauschecker, 1998). In line with this interpretation, previous studies reporting attention‐related signal increases predominantly in primary auditory cortex (Fujiwara et al., 1998; Paltoglou et al., 2009; Poghosyan & Ioannides, 2008) also used pure tone stimuli. Third, while auditory stream segregation is known to involve nonprimary auditory cortex (Gutschalk et al., 2005), it is also known to happen automatically (Sussman et al., 1999). Thus, any activations related to auditory stream segregation would have affected the multi‐stream passive listening conditions as well and would thus not show up in the attention contrasts. This may explain why, at least in auditory cortex, the Selective Attention task did not elicit stronger responses than the other two tasks.
Differences in frontal and parietal areas
The central finding of our study is that while auditory attention in the presence of stimulation evoked activation in frontal and parietal areas, these activations were completely absent during our Beep Monitoring (Attention in Silence) task. As mentioned in the Introduction, most attention tasks involve much more than just attention, and our Simple and Selective attention tasks were no exception. While they did not require spatial or language processing, they required several other higher‐order cognitive functions that by themselves have been shown to lead to activation increases in frontal and parietal brain areas, such as sequence processing over time (Hasson et al., 2008; Leaver et al., 2009; Lerner et al., 2011), working memory (Alain et al., 2008, 2010; D'Esposito et al., 1995; LaBar et al., 1999; Marshuetz et al., 2000), and number processing (Chochon et al., 1999; Santens et al., 2010). Thus, the fact that they activated the frontoparietal network is not surprising, and we will dedicate the remainder of the Discussion to the puzzling absence of frontoparietal activations in the Beep Monitoring task.
One might argue that this null result is due to lack of statistical power for detecting a small effect, but the ROI analyses revealed that the effect tended to be negative and thus would not have reached significance in a one‐tailed test even with infinite power. One might also argue that participants did not actually attend. However, the fact that they detected the rare beeps, along with BOLD signal increases in auditory cortex and BOLD decreases in the DMN, suggests that auditory attention was engaged even in the absence of stimulation. One might also argue that the crucial difference between the tasks was not the presence or absence of stimulation, but that the Beep Monitoring Task was a detection task, whereas the other two were discrimination tasks. However, frontoparietal activation increases have been shown during other auditory detection tasks (e.g. Voisin et al., 2006). Lastly, one might argue that frontoparietal activations did not occur in the Beep Monitoring task because it was too easy. While we agree that task difficulty likely has an influence on frontoparietal activations (see section “Simple versus selective attention”), we do not think that low task difficulty can account for the complete absence of frontoparietal activations in the Beep Monitoring task. First, judging from the error rates, the Simple Attention task was easier than the Beep Monitoring task, yet led to notable frontoparietal activation increases. Second, differences due to a continuous variable such as task difficulty should be quantitative (i.e. weaker activation in easier tasks, as observed for the Simple compared to the Selective Attention task), whereas the complete absence of frontoparietal activations in the Beep Monitoring task suggests fundamental qualitative rather than slight quantitative differences in task‐related neural activity.
Having ruled out these alternative explanations for the stark absence of frontoparietal activations in the Beep Monitoring task, we conclude that, at least under the specific circumstances tested here, frontoparietal activations are not required for maintaining auditory attention in the absence of stimulation. This result is at odds with the commonly held tenet of attention research that the frontoparietal activations are the source of attention‐related top‐down signals biasing sensory cortex activation (Corbetta & Shulman, 2002; Kastner et al., 1999; Hill & Miller, 2010). It is also at odds with the experimental data supporting the above tenet, i.e. numerous studies of both visual and auditory attention (including our two attention‐to‐sound tasks) that consistently show frontal and parietal activations during various attention tasks.
We believe that this contrast arises because previous studies of auditory attention used tasks and stimuli that required more than simply maintaining auditory attention, for example language processing, distractor filtering, and working memory. Of the few studies investigating auditory attention in the absence of stimulation, most required attention to a certain spatial location (Smith et al., 2009; Voisin et al., 2006; Wu et al., 2007). Since the auditory “where” stream involves several parietal and dorsolateral prefrontal areas (Rauschecker & Tian, 2000), it is not surprising that these studies, too, observed frontoparietal activations. In the one study that observed frontoparietal activations during nonspatial attention in the absence of stimulation (Hill & Miller, 2010), participants prepared to listen to speech stimuli, which can naturally be expected to activate frontoparietal areas involved in speech processing (Rauschecker & Scott, 2009). In contrast to these studies, our Beep Monitoring task is the “cleanest” task to date for probing auditory attention, since it involves neither complex stimuli, nor spatial processing, nor distractor filtering, and minimizes working memory demands.
Another important consideration is that data acquisition in our sparse sampling paradigm was timed such that it would capture the BOLD response related to the period of sustained attention in the middle of the trial, while avoiding transient BOLD signal changes associated with cue‐related attention shifts at trial start (10 s prior to data acquisition). The success of this manipulation is confirmed by the absence of attention‐related activations – even for attention in the presence of stimulation – in superior and medial parietal areas, which are associated with shifts of attention (Greenberg et al., 2010). Considering that frontoparietal activations are reliably observed not only for spatial but also nonspatial attention shifting (Shomstein & Yantis, 2006), it seems likely that such activations were present even in our Beep Monitoring task shortly after the cue, but had returned to baseline by the time of data acquisition.
CONCLUSIONS
In most cases, frontoparietal activations are crucial for attention since they are required for multiple aspects of attention (e.g. attention shifting, distractor filtering) as well as for cognitive processes inherently tied to attention (e.g. working memory, semantic stimulus processing). However, the present study demonstrates that the mere maintenance of nonspatial auditory attention in the absence of stimulation does not hinge on concomitant frontoparietal activations. Future studies will determine whether this novel finding can be generalized from the auditory domain to other sensory modalities.
ACKNOWLEDGMENTS
This research was supported by the National Institutes of Health (NIDCD RC1DC010720 to JR), the National Science Foundation (PIRE‐OISE‐0730255), and the Alexander von Humboldt Foundation (Feodor Lynen Research Fellowship for Postdoctoral Researchers to AS). Many thanks to Amber Leaver for helpful discussions and comments on the manuscript!
REFERENCES
- Alain C, Shen D, He Y, Grady C (2010): Dissociable memory‐ and response‐related activity in parietal cortex during auditory spatial working memory. Front. Psychology 1:202. doi: 10.3389/fpsyg.2010.00202 [DOI] [PMC free article] [PubMed] [Google Scholar]
- Alain C, He Y, Grady C (2008): The contribution of the interior parietal lobe to auditory spatial working memory. J Cogn Neurosci 20:285–295. [DOI] [PubMed] [Google Scholar]
- Alho K, Medvedev SV, Pakhomov SV, Roudas MS, Tervaniemi M, Reinkainen K, Zeffiro T, Näätänen R (1999): Selective tuning of the left and right auditory cortices during spatially directed attention. Cogn Brain Res 7:335–341. [DOI] [PubMed] [Google Scholar]
- Alho K, Teder W, Lavikainen J, Näätänen R (1994): Strongly focused attention and auditory event‐related potentials. Biol Psychol 38:73–90. [DOI] [PubMed] [Google Scholar]
- Aron RA, Robbins TW, Poldrack RA (2004): Inhibition and the right inferior frontal cortex. Trends Cogn Sci 8:170–177. [DOI] [PubMed] [Google Scholar]
- Barch DM, Braver TS, Nystrom LE, Forman SD, Noll DC, Cohen JD (1997): Dissociating working memory from task difficulty in human prefrontal cortex. Neuropsychologia 35:1373–1380. [DOI] [PubMed] [Google Scholar]
- Benedict RHB, Lockwood AH, Shucard DW, Shucard JL, Wack D, Murphy B (1998): Functional neuroimaging of sustained and selective attention in the auditory modality. NeuroReport 9:121–126. [DOI] [PubMed] [Google Scholar]
- Benedict RHB, Shucard DW, Santa Maria MP, Shucard JL, Abara JP, Coad ML, Wack D, Sawusch J, Lockwood A (2002): Covert auditory attention generates activation in rostral/dorsal anterior cingulate cortex. J Cogn Neurosci 14:637–645. [DOI] [PubMed] [Google Scholar]
- Benjamini Y, Hochberg Y (1995): Controlling the false discovery rate: A practical and powerful approach to multiple testing. J R Stat Soc Series B 57:289–300. [Google Scholar]
- Binder JR, Frost JA, Hammeke TA, Bellgowan PSF, Rao SM, Cox RW (1999): Conceptual processing during the conscious resting state: A functional MRI study. J Cogn Neurosci 11:80–93. [DOI] [PubMed] [Google Scholar]
- Brefczynski JA, DeYoe EA (1999): A physiological correlate of the ‘spotlight’ of visual attention. Nat Neurosci 2:370–374. [DOI] [PubMed] [Google Scholar]
- Brunetti M, Della Penna S, Ferretti A, Del Gratta C, Cianflone F, Belardinelli P, Caulo M, Pizzella V, Belardinelli MO, Romani GL (2008): A frontoparietal network for spatial attention reorienting in the auditory domain: A human fMRI/MEG study of functional and temporal dynamics. Cereb Cortex 18:1139–1147. [DOI] [PubMed] [Google Scholar]
- Bunge SA, Dudukovic NM, Thomason ME, Vaidya CJ, Gabrieli JDE (2002): Immature frontal lobe contributions to cognitive control in children: Evidence from fMRI. Neuron 33:301–311. [DOI] [PMC free article] [PubMed] [Google Scholar]
- Bunge SA, Ochsner KN, Desmond JE, Glover GH, Gabrieli JDE (2001): Prefrontal regions involved in keeping information in and out of mind. Brain 124:2074–2086. [DOI] [PubMed] [Google Scholar]
- Bunzeck N, Wuestenberg T, Lutz K, Heinze H‐J, Jäncke L (2005): Scanning silence: Mental imagery of complex sounds. Neuroimage 26:1119–1127. [DOI] [PubMed] [Google Scholar]
- Bushara KO, Weeks RA, Ishii K, Catalan M‐J, Tian B, Rauschecker JP, Hallett M (1999): Modality‐specific frontal and parietal areas for auditory and visual spatial localization in humans. Nat Neurosci 2:759–766. [DOI] [PubMed] [Google Scholar]
- Cherry EC (1953): Some experiments on the recognition of speech, with one and with two ears. J Acoust Soc Am 25:975–979. [Google Scholar]
- Chevillet M, Riesenhuber M, Rauschecker JP (2011): Functional correlates of the anterolateral processing hierarchy in human auditory cortex. J Neurosci 31:9345–9352. [DOI] [PMC free article] [PubMed] [Google Scholar]
- Chochon F, Cohen L, van de Moortele PF, Dehaene S (1999): Differential contributions of the left and right inferior parietal lobules to number processing. J Cogn Neurosci 11:617–630. [DOI] [PubMed] [Google Scholar]
- Ciaramitaro VM, Buracas GT, Boynton GM (2007): Spatial and cross‐modal attention alter responses to unattended sensory information in early visual and auditory human cortex. J Neurophysiol 98:2399–2413. [DOI] [PubMed] [Google Scholar]
- Cole MW, Schneider W (2007): The cognitive control network: Integrated cortical regions with dissociable functions. NeuroImage 37:343–360. [DOI] [PubMed] [Google Scholar]
- Corbetta M, Kincade JM, Ollinger JM, McAvoy MP, Shulman GL (2000): Voluntary attention is dissociated from target detection in human posterior parietal cortex. Nat Neurosci 3:292–297. [DOI] [PubMed] [Google Scholar]
- Corbetta M, Miezin FM, Dobmeyer S, Shulman GL, Petersen SE (1990): Attentional modulation of neural processing of shape, color, and velocity in humans. Science 22:1556–1559. [DOI] [PubMed] [Google Scholar]
- Corbetta M, Shulman GL (2002): Control of goal‐directed and stimulus‐driven attention in the brain. Nat Rev Neurosci 3:201–215. [DOI] [PubMed] [Google Scholar]
- Damasio AR, Geschwind N (1984): The neural basis of language. Ann Rev Neurosci 7:127–147. [DOI] [PubMed] [Google Scholar]
- Degerman A, Rinne T, Salmi J, Salonen O, Alho K (2006): Selective attention to sound location or pitch studied with fMRI. Brain Res 1077:123–134. [DOI] [PubMed] [Google Scholar]
- D'Esposito M, Detre JA, Alsop DC, Shin RK, Atlas S, Grossman M (1995): The neural basis of the central executive system of working memory. Nature 378:279–281. [DOI] [PubMed] [Google Scholar]
- DeWitt I, Rauschecker JP (2012): Phoneme and word recognition in the auditory ventral stream. Proc Natl Acad Sci USA. Epub ahead of print: doi: 10.1073/pnas.1113427109 [DOI] [PMC free article] [PubMed] [Google Scholar]
- Downar J, Crawley AP, Mikulis DJ, Davis KD (2001): The effect of task relevance on the cortical response to changes in visual and auditory stimuli: An event‐related fMRI study. NeuroImage 14:1256–1267. [DOI] [PubMed] [Google Scholar]
- Driver J, Frith C (2000): Shifting baselines in attention research. Nat Rev Neurosci 1:147–148. [DOI] [PubMed] [Google Scholar]
- Fritz JB, Elhilali M, David SV, Shamma SA (2007): Auditory attention – Focusing the searchlight on sound. Curr Opin Neurobiol 17:437–455. [DOI] [PubMed] [Google Scholar]
- Fujiwara N, Nagamine T, Imai M, Tanaka T, Shibasaki H (1998): Role of the primary auditory cortex in auditory selective attention studied by whole‐head neuromagnetometer. Cogn Brain Res 7:99–109. [DOI] [PubMed] [Google Scholar]
- Grady CL, Van Meter JW, Maisog JM, Pietrini P, Krasuski J, Rauschecker JP (1997): Attention‐related modulation of activity in primary and secondary auditory cortex. NeuroReport 8:2511–2516. [DOI] [PubMed] [Google Scholar]
- Greenberg AS, Esterman M, Wilson D, Serences JT, Yantis S (2010): Control of spatial and feature‐based attention in frontoparietal cortex. J Neurosci 30:14330–14339. [DOI] [PMC free article] [PubMed] [Google Scholar]
- Greenberg GZ, Larkin WD (1968): Frequency‐response characteristics of auditory observers detecting signals of a single frequency in noise: The probe‐signal method. J Acoust Soc Am 44:1513–1523. [DOI] [PubMed] [Google Scholar]
- Gusnard DA, Raichle ME (2001): Searching for a baseline: Functional imaging and the resting human brain. Nat Rev Neurosci 2:685–694. [DOI] [PubMed] [Google Scholar]
- Gutschalk A, Micheyl C, Melcher JR, Rupp A, Scherg M, Oxenham AJ (2005) Neuromagnetic correlates of streaming in human auditory cortex. J Neurosci 25:5382–5388. [DOI] [PMC free article] [PubMed] [Google Scholar]
- Hairston WD, Hodges DA, Casanova R, Hayasaka S, Kraft R, Maldjian JA, Burdette JH (2008): Closing the mind's eye: Deactivation of visual cortex related to auditory task difficulty. Neuroreport 19:151–154. [DOI] [PubMed] [Google Scholar]
- Hall DA, Haggard MP, Akeroyd MA, Palmer AR, Summerfield AQ, Elliott MR, Gurney EM, Bowtell RW (1999): “Sparse” temporal sampling in auditory fMRI. Hum Brain Mapp 7:213–223. [DOI] [PMC free article] [PubMed] [Google Scholar]
- Hall DA, Summerfield AQ, Gonçalvés MS, Foster JR, Palmer AR, Bowtell RW (2000): Time‐course of the auditory BOLD response to scanner noise. Magn Reson Med 43:601–606. [DOI] [PubMed] [Google Scholar]
- Hashimoto R, Homae F, Nakajima K, Miyashita Y, Sakai KL (2000): Functional differentiation in the human auditory and language areas revealed by a dichotic listening task. NeuroImage 12:147–158. [DOI] [PubMed] [Google Scholar]
- Hasson U, Yang E, Vallines I, Heeger DJ, Rubin N (2008): A hierarchy of temporal receptive windows in human cortex. J Neurosci 28:2539–2550. [DOI] [PMC free article] [PubMed] [Google Scholar]
- Haxby JV, Horwitz B, Ungerleider LG, Maisog JM, Pietrini P, Grady CL (1994): The functional organization of human extrastriate cortex: A PET‐rCBF study of selective attention to faces and locations. J Neurosci 14:6336–6353. [DOI] [PMC free article] [PubMed] [Google Scholar]
- Heilman KM, Van Den Abell T (1980): Right hemisphere dominance for attention. Neurology 30:327. [DOI] [PubMed] [Google Scholar]
- Hein G, Alink A, Kleinschmidt A, Müller NG (2007): Competing neural responses for auditory and visual decisions. PLoS ONE 2(3): e320. doi:10.1371/journal.pone. 0000320. [DOI] [PMC free article] [PubMed] [Google Scholar]
- Hill KT, Miller LM (2010): Auditory attentional control and selection during cocktail party listening. Cereb Cortex 20:583–590. [DOI] [PMC free article] [PubMed] [Google Scholar]
- Hillyard SA, Anllo‐Vento L (1998): Event‐related brain potentials in the study of visual selective attention. PNAS 95:781–787. [DOI] [PMC free article] [PubMed] [Google Scholar]
- Hillyard SA, Hink RF, Schwent VL, Picton TW (1973): Electrical signs of selective attention in the human brain. Science 182:177–179. [DOI] [PubMed] [Google Scholar]
- Hopfinger JB, Buonocore MH, Mangun GR (2000): The neural mechanisms of top‐down attentional control. Nat Neurosci 3:284–291. [DOI] [PubMed] [Google Scholar]
- Hubel DH, Henson CO, Rupert A, Galambos R (1959): “Attention” units in the auditory cortex. Science 129:1279–1280. [DOI] [PubMed] [Google Scholar]
- Hugdahl K, Brønnick K, Kyllinsbæk S, Law I, Gade A, Paulson OB (1999): Brain activation during dichotic presentation of consonant‐vowel and musical instrument stimuli: A 15O‐PET study. Neuropsychologia 38:431–440. [DOI] [PubMed] [Google Scholar]
- Hugdahl K, Law I, Kyllinsbæk S, Brønnick K, Gade A, Paulson OB (2000): Effects of attention on dichotic listening: An 15O‐PET study. Hum Brain Mapp 10:87–97. [DOI] [PMC free article] [PubMed] [Google Scholar]
- Jäncke L, Mirzazade S, Shah NJ (1999): Attention modulates activity in the primary and the secondary auditory cortex: A functional magnetic resonance imaging study in human subjects. Neurosci Letters 266:125–128. [DOI] [PubMed] [Google Scholar]
- Johnson JA, Zatorre RJ (2005): Attention to simultaneous unrelated auditory and visual events: Behavioral and neural correlates. Cereb Cortex 15:1609–1620. [DOI] [PubMed] [Google Scholar]
- Johnson JA, Zatorre RJ (2006): Neural substrates for dividing and focusing attention between simultaneous auditory and visual events. Neuroimage 31:1673–1681. [DOI] [PubMed] [Google Scholar]
- Kastner S, Pinsk MA, De Weerd P, Desimone R, Ungerleider LG (1999): Increased activity in human visual cortex during directed attention in the absence of visual stimulation. Neuron 22:751–761. [DOI] [PubMed] [Google Scholar]
- Kastner S, Ungerleider LG (2000): Mechanisms of visual attention in the human cortex. Annu Rev Neurosci 23:315–341. [DOI] [PubMed] [Google Scholar]
- Kell CA, Morillon B, Kouneiher F, Giraud A‐L (2010): Lateralization of speech production starts in sensory cortices – A possible sensory origin of cerebral left dominance for speech. Cereb Cortex 21:932–937. [DOI] [PubMed] [Google Scholar]
- Knight RT, Staines WR, Swick D, Chao LL (1999): Prefrontal cortex regulates inhibition and excitation in distributed neural networks. Acta Psychol 101:159–178. [DOI] [PubMed] [Google Scholar]
- Kraemer DJM, Macrae CN, Green AE, Kelley WM (2005): Musical imagery: Sounds of silence activates auditory cortex. Nature 434:158. [DOI] [PubMed] [Google Scholar]
- LaBar KS, Gitelman DR, Parrish TB, Mesulam M‐M (1999): Neuroanatomic overlap of working memory and spatial attention networks: A functional MRI comparison within subjects. NeuroImage 10:695–704. [DOI] [PubMed] [Google Scholar]
- Leaver AM, Van Lare J, Zielinski B, Halpern AR, Rauschecker JP (2009): Brain activation during anticipation of sound sequences. J Neurosci 29:2477–2485. [DOI] [PMC free article] [PubMed] [Google Scholar]
- Lerner Y, Honey CJ, Silbert LJ, Hasson U (2011): Topographic mapping of a hierarchy of temporal receptive windows using a narrated story. J Neurosci 31:2906–2915. [DOI] [PMC free article] [PubMed] [Google Scholar]
- Liegeois‐Chauvel C, Musolino A, Chauvel P (1991): Localization of the primary auditory area in man. Brain 114:139–153. [PubMed] [Google Scholar]
- Lipschutz B, Kolinsky R, Damhaut P, Wikler D, Goldman S (2002): Attention‐dependent changes of activation and connectivity in dichotic listening. NeuroImage 17:643–656. [PubMed] [Google Scholar]
- Marshuetz C, Smith EE, Jonides J, DeGutis J, Chenevert TL (2000): Order information in working memory: fMRI evidence for parietal and prefrontal mechanisms. J Cogn Neurosci 12:130–144. [DOI] [PubMed] [Google Scholar]
- Mayer AR, Franco AR, Canive J, Harrington DL (2009): The effects of stimulus modality and frequency of stimulus presentation on cross‐modal distraction. Cereb Cortex 19:993–1007. [DOI] [PubMed] [Google Scholar]
- Mayer AR, Harrington D, Adair JC, Lee R (2006): The neural networks underlying endogenous auditory covert orienting and reorienting. NeuroImage 30:938–949. [DOI] [PubMed] [Google Scholar]
- Mazoyer B, Zago L, Mellet E, Bricogne S, Etard O, Houdé O, Crivello F, Joliot M, Petit L, Tzourio‐Mazoyer N (2001): Cortical networks for working memory and executive functions sustain the conscious resting state in man. Brain Res Bull 54:287–298. [DOI] [PubMed] [Google Scholar]
- McKiernan KA, Kaufman JN, Kucera‐Thompson J, Binder JR (2003): A parametric manipulation of factors affecting task‐induced deactivation in functional neuroimaging. J Cogn Neurosci 15:394–408. [DOI] [PubMed] [Google Scholar]
- Moray N (1959): Attention in dichotic listening: Affective cues and the influence of instructions. Q J Exp Psychol 11:56–60. [Google Scholar]
- Morosan P, Rademacher J, Schleicher A, Amunts K, Schormann T, Zilles K (2001): Human primary auditory cortex: Cytoarchitectonic subdivisions and mapping into a spatial reference system. Neuroimage 13:684–701. [DOI] [PubMed] [Google Scholar]
- Mozolic JL, Joyner D, Hugenschmidt CE, Peiffer AM, Kraft RA, Maldjian JA, Laurienti PJ (2008): Cross‐modal deactivations during modality‐specific selective attention. BMC Neurol 8:35 doi:10.1186/1471–2377–8–35. [DOI] [PMC free article] [PubMed] [Google Scholar]
- O'Leary DS, Andreasen NC, Hurtig RR, Hichwa RD, Watkins GL, Ponto LLB, Rogers M, Kirchner P (1996): A positron emission tomography study of binaurally and dichotically presented stimuli: Effects of level of language and directed attention. Brain Lang 53:20–39. [DOI] [PubMed] [Google Scholar]
- Paltoglou AE, Sumner C, Hall DA (2009): Examining the role of frequency specificity in the enhancement and suppression of human cortical activity by auditory selective attention. Hear Res 257:106–118. [DOI] [PubMed] [Google Scholar]
- Penhune VB, Zatorre RJ, MacDonald JD, Evans AC (1996): Interhemispheric anatomical differences in human primary auditory cortex: Probabilistic mapping and volume measurement from magnetic resonance scans. Cereb Cortex 6:661–672. [DOI] [PubMed] [Google Scholar]
- Petit L, Simon G, Joliot M, Andersson F, Bertin T, Zago L, Mellet E, Tzourio‐Mazoyer N (2007): Right hemisphere dominance for auditory attention and its modulation by eye position: An event related fMRI study. Restor Neurol Neurosci 25:211–225. [PubMed] [Google Scholar]
- Petkov CI, Kang X, Alho K, Bertrand O, Yund EW, Woods DL (2004): Attentional modulation of human auditory cortex. Nat Neurosci 7:658–663. [DOI] [PubMed] [Google Scholar]
- Poghosyan V, Ioannides, AA (2008): Attention modulates earliest responses in the primary auditory and visual cortices. Neuron 58:802–813. [DOI] [PubMed] [Google Scholar]
- Pugh KR, Shaywitz BA, Shawitz SE, Fulbright RK, Byrd D, Skudlarski P, Shankweiler DP, Katz L, Constable RT, Fletcher J, Lacadie C, Marchione K, Gore JC (1996): Auditory selective attention: An fMRI investigation. Neuroimage 4:159–173. [DOI] [PubMed] [Google Scholar]
- Rademacher J, Morosan P, Schormann T, Schleicher KA, Werner C, Freund HJ, Zilles K (2001): Probabilistic mapping and volume measurement of human primary auditory cortex. Neuroimage 13:669–683. [DOI] [PubMed] [Google Scholar]
- Raichle ME, MacLeod AM, Snyder AZ, Powers WJ, Gusnard DA, Shulman GL (2001): A default mode of brain function. PNAS 98:676–682. [DOI] [PMC free article] [PubMed] [Google Scholar]
- Rauschecker JP (1998): Cortical processing of complex sounds. Curr Opin Neurobiol 8:516–521. [DOI] [PubMed] [Google Scholar]
- Rauschecker JP, Scott S (2009): Maps and streams in the auditory cortex: Nonhuman primates illuminate human speech processing. Nat Neurosci 12:718–724. [DOI] [PMC free article] [PubMed] [Google Scholar]
- Rauschecker JP, Tian B (2000): Mechanisms and streams for processing of “what” and “where” in auditory cortex. Proc Natl Acad Sci U S A 97:11800–11806. [DOI] [PMC free article] [PubMed] [Google Scholar]
- Rauschecker JP, Tian B, Hauser M (1995): Processing of complex sounds in the macaque nonprimary auditory‐cortex. Science 268:111–114. [DOI] [PubMed] [Google Scholar]
- Reynolds JH, Pasternak T, Desimone R (2000): Attention increases sensitivity of V4 neurons. Neuron 26:703–714. [DOI] [PubMed] [Google Scholar]
- Rif J, Hari R, Hämäläinen MS, Sams M (1991): Auditory attention affects two different areas in the human supratemporal cortex. Electroencephalogr Clin Neurophysiol 79:464–472. [DOI] [PubMed] [Google Scholar]
- Rinne T, Pekkola J, Degerman A, Autti T, Jääskeläinen IP, Sams M, Alho K (2005): Modulation of auditory cortex activation by sound presentation rate and attention. Hum Brain Mapp 26:94–99. [DOI] [PMC free article] [PubMed] [Google Scholar]
- Salmi J, Rinne T, Degerman A, Salonen O, Alho K (2007): Orienting and maintenance of spatial attention in audition and vision: Multimodal and modality‐specific brain activations. Brain Struct Funct 212:181–194. [DOI] [PubMed] [Google Scholar]
- Salmi J, Rinne T, Koistinen S, Salonen O, Alho K (2009): Brain networks of bottom‐up triggered and top‐down controlled shifting of auditory attention. Brain Res 1285:155–164. [DOI] [PubMed] [Google Scholar]
- Santens S, Roggeman C, Fias W, Verguts T (2010): Number processing pathways in human parietal cortex. Cereb Cortex 20:77–88. [DOI] [PMC free article] [PubMed] [Google Scholar]
- Scharf B, Quigley S, Aoki C, Peachey N, Reeves A (1987): Focused auditory attention and frequency selectivity. Percept Psychophys 42:215–223. [DOI] [PubMed] [Google Scholar]
- Schlauch RS, Hafter ER (1991): Listening bandwidths and frequency uncertainty in pure‐tone signal detection. J Acoust Soc Am 90:1332–1339. [DOI] [PubMed] [Google Scholar]
- Schubotz RI, von Cramon DY (2001): Interval and ordinal properties of sequences are associated with distinct premotor areas. Cereb Cortex 11:210–222. [DOI] [PubMed] [Google Scholar]
- Seger CA, Cincotta CM (2005) The roles of the caudate nucleus in human classification learning. J Neurosci 25:2941–2951. [DOI] [PMC free article] [PubMed] [Google Scholar]
- Sevostianov A, Fromm S, Nechaev V, Horwitz B, Braun A (2002): Effect of attention on central auditory processing: An fMRI study. Int J Neurosci 112:587–606. [DOI] [PubMed] [Google Scholar]
- Shomstein S, Yantis S (2004): Control of attention shifts between vision and audition in human cortex. J Neurosci 24:10702–10706. [DOI] [PMC free article] [PubMed] [Google Scholar]
- Shomstein S, Yantis S (2006): Parietal cortex mediates voluntary control of spatial and nonspatial auditory attention. J Neurosci 26:435–439. [DOI] [PMC free article] [PubMed] [Google Scholar]
- Shulman GL, Fiez JA, Corbetta M, Buckner RL, Miezin FM, Raichle ME, Petersen SE (1997): Common blood flow changes across visual tasks: II. Decreases in cerebral cortex. J Cogn Neurosci 9:648–663. [DOI] [PubMed] [Google Scholar]
- Smith DV, Davis B, Niu K, Healy EW, Bonilha L, Fridriksson J, Morgan PS, Rorden C (2009): Spatial attention evokes similar activation patterns for visual and auditory stimuli. J Cogn Neurosci 22:347–361. [DOI] [PMC free article] [PubMed] [Google Scholar]
- Sokolov A, Lutzenberger W, Pavlova M, Preissl H, Braun C, Birbaumer N (1999): Gamma‐band MEG activity to coherent motion depends on task‐driven attention. Cogn Neurosci 10:1997–2000. [DOI] [PubMed] [Google Scholar]
- Sturm W, de Simone A, Krause BJ, Specht K, Hesselmann V, Radermacher I, Herzog H, Tellmann L, Müller‐Gärtner HW, Willmes K (1999): Functional anatomy of intrinsic alertness: Evidence for a fronto‐parietal‐thalamic‐brainstem network in the right hemisphere. Neuropsychology 37:797–805. [DOI] [PubMed] [Google Scholar]
- Sussman E, Ritter W, Vaughan HG Jr (1999) An investigation of the auditory streaming effect using event‐related brain potentials. Psychophysiology 36:22–34. [DOI] [PubMed] [Google Scholar]
- Talairach J, Tournoux P (1988): Co‐planar Stereotaxic Atlas of the Human Brain. Stuttgart: Thieme. [Google Scholar]
- Treue S, Martínez Trujillo JC (1999): Feature‐based attention influences motion processing gain in macaque visual cortex. Nature 399:575–579. [DOI] [PubMed] [Google Scholar]
- Tzourio N, El Massioui F, Crivello F, Joliot M, Renault B, Mazoyer B (1997): Functional anatomy of human auditory attention studied with PET. NeuroImage 5:63–77. [DOI] [PubMed] [Google Scholar]
- Vakil E, Kahan S, Huberman M, Osimani A (2000): Motor and non‐motor sequence learning in patients with basal ganglia lesions: The case of serial reaction time (SRT). Neuropsychologia 38:1–10. [DOI] [PubMed] [Google Scholar]
- Voisin J, Bidet‐Caulet A, Bertrand O, Fonlupt P (2006): Listening in silence activates auditory areas: A functional magnetic resonance imaging study. J Neurosci 26:273–278. [DOI] [PMC free article] [PubMed] [Google Scholar]
- Weeks RA, Aziz‐Sultan A, Bushara KO, Tian B, Wessinger CM, Dang N, Rauschecker JP, Hallett M (1999): A PET study of human auditory spatial processing. Neuroscience Letters 262:155–158. [DOI] [PubMed] [Google Scholar]
- Wessinger CM, VanMeter J, Tian B, Van Lare J, Pekar J, Rauschecker JP (2001): Hierarchical organization of the human auditory cortex revealed by functional magnetic resonance imaging. J Cogn Neurosci 13:1–7. [DOI] [PubMed] [Google Scholar]
- Westbury CF, Zatorre RJ, Evans AC (1999): Quantifying variability in the planum temporale: A probability map. Cereb Cortex 9:392–405. [DOI] [PubMed] [Google Scholar]
- Westerhausen R, Moosmann M, Alho K, Belsby S‐O, Hämäläinen H, Medvedev S, Specht K, Hugdahl K (2010): Identification of attention and cognitive control networks in a parametric auditory fMRI study. Neuropsychologia 28:2075–2081. [DOI] [PubMed] [Google Scholar]
- Wojciulik E, Kanwisher N, Driver J (1998): Covert visual attention modulates face‐specific activity in the human fusiform gyrus: fMRI study. J Neurophysiol 79:1574–1578. [DOI] [PubMed] [Google Scholar]
- Woldorff MG, Gallen CG, Hampson SA, Hillyard SA, Pantev C, Sobel D, Bloom FE (1993): Modulation of early sensory processing in human auditory cortex during auditory selective attention. PNAS 90:8722–8726. [DOI] [PMC free article] [PubMed] [Google Scholar]
- Woodruff PWR, Benson RR, Bandettini PA, Kwong KK, Howard RJ, Talavage T, Belliveau J, Rosen BR (1996): Modulation of auditory and visual cortex by selective attention is modality‐dependent. Neuroreport 7:1909–1913. [DOI] [PubMed] [Google Scholar]
- Woods DL, Stecker GC, Rinne T, Herron TJ, Cate AD, Yund EW, Liao I, Kang X (2009): Functional maps of human auditory cortex: Effects of acoustic features and attention. PLoS ONE 4(4): e5183. doi: 10.1371/journal.pone.005183. [DOI] [PMC free article] [PubMed] [Google Scholar]
- Wu C‐T, Weissman DH, Roberts KC, Woldorff MG (2007): The neural circuitry underlying the executive control of auditory spatial attention. Brain Res 1134:187–198. [DOI] [PMC free article] [PubMed] [Google Scholar]
- Yantis S, Schwarzbach J, Serences JT, Carlson RL, Steinmetz MA, Pekar JJ, Courtney SM (2002): Transient neural activity in human parietal cortex during spatial attention shifts. Nat Neurosci 5:995–1002. [DOI] [PubMed] [Google Scholar]
- Zatorre RJ, Mondor TA, Evans AC (1999): Auditory attention to space and frequency activates similar cerebral systems. Neuroimage 10:544–554. [DOI] [PubMed] [Google Scholar]