

Abstract
The brain is a network and our intelligence depends in part on the efficiency of this network. The network of adolescents differs from that of adults suggesting developmental changes. However, whether the network changes over time at the individual level and, if so, how this relates to intelligence, is unresolved in adolescence. In addition, the influence of genetic factors in the developing network is not known. Therefore, in a longitudinal study of 162 healthy adolescent twins and their siblings (mean age at baseline 9.9 [range 9.0–15.0] years), we mapped local and global structural network efficiency of cerebral fiber pathways (weighted with mean FA and streamline count) and assessed intelligence over a three‐year interval. We find that the efficiency of the brain's structural network is highly heritable (locally up to 74%). FA‐based local and global efficiency increases during early adolescence. Streamline count based local efficiency both increases and decreases, and global efficiency reorganizes to a net decrease. Local FA‐based efficiency was correlated to IQ. Moreover, increases in FA‐based network efficiency (global and local) and decreases in streamline count based local efficiency are related to increases in intellectual functioning. Individual changes in intelligence and local FA‐based efficiency appear to go hand in hand in frontal and temporal areas. More widespread local decreases in streamline count based efficiency (frontal cingulate and occipital) are correlated with increases in intelligence. We conclude that the teenage brain is a network in progress in which individual differences in maturation relate to level of intellectual functioning. Hum Brain Mapp 36:4938–4953, 2015. © 2015 Wiley Periodicals, Inc.
Keywords: adolescence, development, DTI, network, intelligence, heritability, longitudinal, brain, graph theory
INTRODUCTION
The brain is a network [Achard and Bullmore, 2007; Bullmore and Sporns, 2009; van den Heuvel and Hulshoff Pol, 2010]. This network is highly significant in health and disease [Bassett and Bullmore, 2009]. Structural and functional properties of the network have been related to intelligence in healthy subjects [Bassett et al., 2009; van den Heuvel et al., 2009; Li et al., 2009; Wen et al., 2011; Langer et al., 2012; Park and Friston, 2013]. Structural and functional abnormalities in the network are found in neuropsychiatric illness such as schizophrenia [Fornito et al., 2012; van den Heuvel et al., 2010, 2013b; Hulshoff Pol and Bullmore 2013]. There are indications that developmental changes occur in the brain's network: Individual resting state network maturation [Lee et al., 2013; Smyser et al., 2010] and anatomical development [Fan et al., 2011; Nie et al., 2014] has been reported in newborns, early childhood and in early adolescence [Sherman et al., 2014]. Moreover, cross‐sectional studies have shown that the functional network of adolescents differs from that of adults [Fair et al., 2008] and that structural network efficiency is dependent of age [Gong et al., 2009; Hagmann et al., 2010; Wen et al., 2011]. A recent study describes that structural white matter development during late adolescence influences the whole network, but especially connections between hub regions [Baker et al., 2015]. However, much remains unknown about this network in early adolescence.
Whether, and if so how, the structural brain network changes over time at the individual level in adolescence is not known. This is relevant since adolescence is a time characterized by rapid changes in the brain [Brouwer et al., 2012; Giedd et al., 1999; Paus, 2010; Schnack et al., 2015; Toga et al., 2006; van Soelen et al., 2012a, 2013 van Soelen et al., 2013] as well as in intelligence [Deary, 2012; Deary et al., 2012; Plomin, 2012; Waber et al., 2012] and their interactions [Burgaleta et al., 2014a; Ramsden et al., 2011; Shaw et al., 2006]. Genetic factors may play a role in development: Brain size [Peper et al., 2007; Posthuma et al., 2002; Stein et al., 2012; Thompson et al., 2001], white matter integrity [Brouwer et al., 2010; Jahanshad et al., 2013], intelligence [Bouchard and McGue, 2003; Davies et al., 2015; Plomin and Deary, 2015; van Soelen et al., 2011] and their interactions [Brouwer et al., 2013; Chiang et al., 2009, 2011, 2012; Posthuma et al., 2002] are influenced by (common) genes. This begs the questions to what extent the developing brain's network is influenced by genes and to what extent intelligence is related to the white matter network in early adolescence.
There are several ways to describe topological properties of the brain network. A structural brain network consists of anatomical locations in the gray matter (nodes) and white matter fibers connecting the nodes (edges). Mathematical representations of the structural connectivity of the human brain network have revealed that the brain is organized according to a highly efficient small‐world topology combining a high level of segregation (local efficiency) with a high level of integration (global efficiency) [Achard and Bullmore, 2007]. Global efficiency is a network attribute that quantifies how easy information can be exchanged over the network, providing information on the communication efficiency of a network as a whole. Local efficiency reflects how well information can travel in the direct neighborhood of a node, and is often interpreted as a metric of the local information processing capacity of a network [Bullmore and Sporns, 2012; van den Heuvel and Hulshoff Pol, 2010; Latora and Marchiori, 2001].
We mapped global and local efficiency of structural brain networks of healthy adolescents in a longitudinal, extended, twin design. Structural brain networks were based on fractional anisotropy (FA) and streamline counts from diffusion tensor imaging scans. Using structural equation modeling [Boker et al., 2011] and network connectivity analyses [Rubinov and Sporns, 2010], we estimated the heritability and development of the brain network in adolescence at a three‐year interval. Associations between structural brain network topology and intelligence were investigated.
MATERIALS AND METHODS
Participants
A total of 120 twins [57 monozygotic (MZ) subjects (28 boys, 29 girls), 63 dizygotic (DZ) subjects (34 boys, 29 girls)] and 42 of their older siblings (17 boys, 25 girls) were included from the BrainSCALE cohort [van Soelen et al., 2012b]. Zygosity of the twins was confirmed by genome‐wide SNP data. At the first measurement, mean (SD) age was 9.9 (1.4) years, at the second measurement 12.9 (1.4) years, resulting in a narrow spread in age range over the interval of mean (SD) 2.92 (0.23) years. The sample was recruited from the Netherlands Twin Register [van Beijsterveldt et al., 2013]. Written informed consents were obtained from all subjects and their parents. The Dutch Central Committee on Research involving Human Subjects (CCMO) approved the study.
Cognition
Level of intelligence was estimated based on the intelligence quotient (IQ) as measured with the Wechsler Intelligence Scale for Children III (WISC‐III, Dutch version). At the first measurement, all subtasks of the WISC were included. At the second measurement, six subtasks of the WISC‐III were administered: four verbal subtests (similarities, arithmetic, vocabulary, and digit span), and two non‐verbal subtests (picture completion and block design). Scores on individual subtests from the WISC‐III were standardized against age‐specific norms, together providing a total IQ score. For two subjects, IQ values were excluded from the analyses based on a very large (absolute value > 30) change in IQ points over time. Post‐hoc analyses showed that these two individuals showed no exceptional changes on the network measures (all within one standard deviation of the mean).
The shortened version of the WISC‐III provided a reliable estimate of full scale IQ: at the first measurement, full scale IQ correlated highly with the IQ measurement based on the six subtasks (r = 0.93 [0.90–0.95]). Mean (SD) IQ was 103 (14) at the first measurement [IQ based on six subtasks was 104 (15)], and 102 (16) at the second measurement. There was no significant mean change (−1.15 IQ points) over time, but considerable individual spread in IQ change (SD =10.4 IQ points change) across participants. The correlation between IQ of measurement 1 (based on 6 subtasks) and measurement 2 was 0.78 [0.70–0.84]. Changes in IQ were based on IQ using the six subtasks.
MRI Acquisition
All MRI brain scans were acquired at the University Medical Center Utrecht on a 1.5 Tesla Philips Achieva scanner (Philips, Best, The Netherlands) using the same protocol at both measurements [Brouwer et al., 2012]. For anatomy, a three‐dimensional T1‐weighted scan (Spoiled Gradient Echo; TE = 4.6 ms; TR = 30 ms; flip angle 30°; 160–180 contiguous coronal slices of 1.2 mm; in‐plane resolution 1 × 1 mm2; acquisition matrix 256 × 256) of the whole head was made of each individual. For white matter fiber tracking, Diffusion Tensor Images were acquired. Two Single Shot Echo Planar Imaging (SS‐EPI) DWI scans were acquired (32 diffusion‐weighted volumes with diffusion weighting b = 1000 s/mm2 and 32 noncollinear diffusion gradient directions; 8 diffusion‐unweighted (b = 0 s/mm2) scans; TE = 88 ms; TR = 9822 ms; parallel imaging SENSE factor 2.5; flip angle 90°; 60 transverse slices of 2.5 mm, no gap, FOV 240 mm; 128 × 128 reconstruction matrix; 96 × 96 acquisition matrix, no cardiac gating) for optimal signal‐to‐noise ratio.
MRI Processing
White matter pathways, referred to as fibers or tracts, were reconstructed using streamline tractography. First, the 2 DWI scans were combined and corrected for possible gradient‐induced distortions [Andersson and Skare, 2002]. Next, the diffusion pattern in each voxel was fitted to a tensor matrix using a robust M‐estimator [Chang et al., 2005], providing three eigenvectors (representing the three principal directions of diffusion) and corresponding eigenvalues. FA values were calculated in each voxel as a measure of microstructural directionality from the eigenvalues [Basser and Pierpaoli, 1996]. Then, the b0 scan was registered to the T1‐weighted scan using a rigid transformation (no scaling), based on optimization of a mutual information metric [Maes et al., 1997], and the T1‐weighted images were nonlinearly warped into model space up to a scale of 1 mm [Collins et al., 1995], based upon which the model brain was created. All possible fiber tracts between two regions were reconstructed in individual space using the diffusion tensor images with an in‐house implementation of the fiber assignment by continuous tracking (FACT) algorithm [Mori and Van Zijl, 2002] with 8 seed points per voxel, FA threshold of 0.1 and maximal angle of 45°. The fiber tracts were warped into model space, using the concatenation of the transformations between the b0 scan and T1 scan, and between the T1 scan and model space. For network construction, the AAL template [Tzourio‐Mazoyer et al., 2002] was warped onto the model brain, segmenting the cortex in a parcellation map consisting of 90 regions.
Construction of Structural Brain Networks
A network consists of a set of nodes and connections (edges) that can be mathematically expressed as a graph with a collection of nodes and a collection of edges between the nodes [Bullmore and Basset, 2011]. Whole brain networks were created based on the 90 AAL brain regions. Two structural weighted brain networks were created for each individual, one for each measurement, by combining the collection of reconstructed fiber tracts with the individual parcellation maps [van den Heuvel et al., 2010, 2013b]. Because of the longitudinal nature of our data, we decided to use a stringent threshold to ensure data quality, that is, only those connections that were reconstructed at both ages for an individual were included in the network of that individual. Thus, network nodes i and j were defined as structurally connected by an edge when from the total collection of reconstructed streamlines at least one fiber interconnected them at both measurements. As a result, the individual topology of the networks was kept the same for both measurements. For each edge, weight wij was defined by the mean FA value of the traced fibers between region i and j. We also investigated networks with streamline counts as weights to allow for a more direct comparison with studies investigating the structural network based on streamline count.
Graph Analysis
To measure changes in efficiency, we computed global and local efficiency [Latora and Marchiori, 2001] for each individual at each measurement using the Brain Connectivity Toolbox [Rubinov and Sporns, 2010, http://www.brain-connectivity-toolbox.net]. Global efficiency Ew and local efficiency were mathematically defined as:
Global efficiency:
Local efficiency of node i:
with N the set of all nodes in the network, and n the number of nodes; ki the number of edges connected to node i; the shortest weighted path length between i and j; and djh(Ni) the length of the shortest path between j and h, in the network Ni that contains only the neighbors of i. The symmetrical weights (wij = wji) were either average FA of the connection between i and j (0 ≤ wij ≤ 1), or the number of streamlines between i and j (wij ≥ 1).
Subsequently, because of the longitudinal nature of this study, we wanted to control for the expected changes in the weights over time, while keeping the topology the same. We normalized each individual matrix by the total sum of the matrix, thereby correcting for the overall change in average FA/streamline count that could by itself already introduce a change in efficiency. The resulting matrices shed light on the redistribution of the weights over time relative to the total change of weight. For these matrices we recomputed the network measures. In addition, to compare the normalized results with the golden standard used in the literature, we also compared our networks metrics to the networks metrics of 500 random graphs that were created from each individual FA or streamline‐weighted matrix. Random networks were made by randomly re‐distributing the edges of the original individual network, while keeping the degree distribution the same as the original network. We reran our analyses using the metrics Eloc/Elocrandom and Eglob/Eglobrandom. These metrics reflect how the original network is related to a network in which the weights are randomly distributed. As a result, when we look at change over time, they provide information on the redistribution of the weights relative to the each other.
Figures were created with the BrainNet Viewer [Xia et al., 2013].
Twin Modeling
Relative influences of genetic and environmental factors were examined in an extended twin design by comparing within‐pair correlations between MZ and DZ twins/twin sibling pairs. Differences between these correlations may arise because MZ twins share (almost) 100% of their genetic makeup and twin‐sibling pairs, like DZ pairs, share on average 50% of the segregating genes [Posthuma et al., 2003]. When an MZ correlation is twice as high as a DZ correlation, this indicates that a variable is largely influenced by genetic factors. In addition to genetic factors, resemblance between twins can arise from common environment, which comprises those environmental factors that induce similarity in children growing up in the same family. The presence of common environmental factors is suggested when correlations in DZ twins are larger than half the MZ correlation. When the MZ correlations are more than twice the DZ correlations, there is a suggestion for non‐additive genetic influences (epistasis or dominance). Unique environmental influences are not shared with other family members and also contain the measurement error.
The same rationale as described for the univariate case can be applied to a bivariate case. If a correlation exists between two variables, the cross‐trait cross‐twin/sibling correlations give information whether the same genes, or environment are responsible for the association.
Genetic Analyses
The proportion of the total variance that can be attributed to genetic or environmental factors gives estimates of (univariate) heritability (h 2), unique environmental influence, and common environmental influence (c 2) or nonadditive genetic influences (d 2). In the latter case, we present estimates of broad heritability (h 2 + d 2). A genetic correlation rg was computed as the genetic covariance between two traits, divided by the square roots of the part of variances that can be attributed to genetic factors for each trait [for details see Koenis et al., 2013].
To test for longitudinal changes, individual differences over time were entered in a saturated model, in which we tested whether the mean could be constrained to zero. Based on the MZ and DZ/twin‐sibling correlations, a bivariate model including additive, nonadditive genetic and environmental effects was fit to the network data, incorporating age‐corrected longitudinal measurements with two time points in one model. Since we had found earlier that both genes and shared environment contribute to variation in IQ in this cohort [van Soelen et al., 2011], associations between IQ (change) and (changes in) network measures were investigated in a model that allowed possible shared environmental influences on (changes in) IQ, and possible nonadditive influences on (change in) network measures. All analyses were performed using structural equation modeling in OpenMx [Boker et al., 2011].
RESULTS
Efficiency of the FA‐Weighted Brain Network Increases During Early Adolescence
Increases in both global (P < 0.0001) and average local network efficiency (P < 0.0001) were found after the three‐year interval (Fig. 1; Table 1). Increases in individual network efficiency occurred in a large majority (75%) of subjects and across most regions (significant after Bonferroni correction for multiple comparisons, see Figure 1 and Supporting Information Table S1).
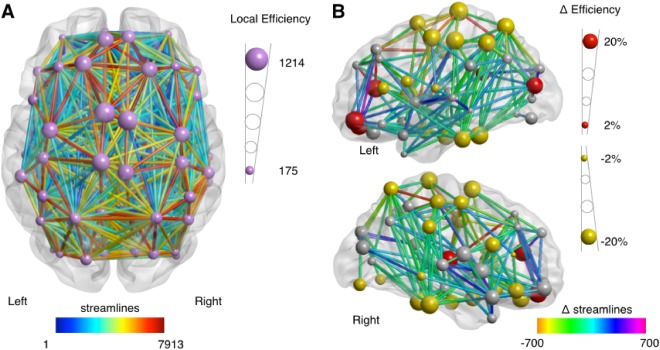
Figure 1.
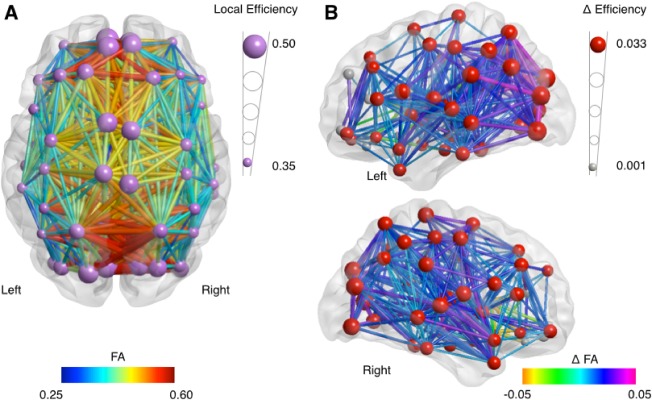
Development of FA‐based network efficiency. A: Efficiency of the structural brain network at age 10. Larger nodes represent a higher level of efficiency. Edges in the network are colored by FA (a measure for white matter integrity); higher values in red, lower values in blue. For details on local efficiency at measurement 1 and measurement 2, see Supporting Information Table S1. B: Development of the structural brain network over a three‐year interval with significant change Δ in local network efficiency shown in red nodes (P < 0.05/90; larger nodes represent a larger increase), and significant change in edges colored for FA change (for visualization purposes only edges with a significant change at P < 0.005 are shown). See Supporting Information Table S1 for details.
Table 1.
Longitudinal changes in FA‐weighted global and local network efficiency measures
| Measurement 1 | Measurement 2 | Change | %Change | |
|---|---|---|---|---|
| Age | 9.9 (1.4) | 12.9 (1.4) | 2.92 (0.23) | |
| IQ | 103 (14) | 102 (16) | −1.15 (10.4)a | −1.2% |
| FA | 0.450 (0.023) | 0.466 (0.022) | 0.017 (0.024) b | 3.8% |
| Global Efficiency | 0.276 (0.014) | 0.286 (0.014) | 0.010 (0.014) b | 3.6% |
| Local Efficiencyc | 0.410 (0.020) | 0.425 (0.020) | 0.016 (0.022) b | 3.9% |
| Eglob normalized | 3.163 (0.10) (×10−4) | 3.161 (0.11) (×10−4) | −0.001 (0.010) (×10−4) | 0.0% |
| Eloc normalized | 4.711 (0.24) (×10−4) | 4.717 (0.24) (×10−4) | 0.006 (0.009) (×10−4) b | 0.1% |
| Eglob/Eglobrandom | 0.922 (0.009) | 0.923 (0.009) | 0.000 (0.004) | 0.1% |
| Eloc/Elocrandom | 1.125 (0.022) | 1.126 (0.022) | 0.001 (0.002) b | 0.1% |
Means (standard deviations) and percentage change (%); FA represents the average FA of the structural brain network.
When looking at the change scores based on 6 subtests at both assessments, IQ decreased with 1.71 points.
Significant changes (P < 0.05) is indicated in bold.
Local efficiency as averaged over the entire brain.
Following correction for overall FA changes that occur with age—by dividing the connectivity matrix by the sum of the matrix—there was no increase in normalized global efficiency, but the increase in average normalized local efficiency remained significant (Table 1). Global network efficiency of the randomized networks showed a similar increase in network efficiency over time as the individual brain networks. The increase in average local efficiency was larger in the individual brain networks than in the randomized networks (Table 1). Thus, while changes of FA and changes in network measures are partly overlapping, a change in FA distribution adds uniquely to (changes in) network efficiency.
Genetic Influences on FA‐Weighted Network Characteristics
Because of the observed age effect, in the following analyses, all network data were corrected for age. At the age of 10 years, there were significant influences of genes on global (32% [95% CI = 7–59]) and local (up to 74%; average local efficiency over the entire brain 37% [0.05–0.68]) network efficiency (Fig. 2; Supporting Information Table S1). MZ correlations were 0.34 [‐0.21–0.65] for global efficiency and 0.50 [−0.13–0.74] for average local efficiency. DZ/twin‐sib correlations were 0.04 [−0.13–0.24] for global efficiency and 0.02 [−0.14–0.20] for average local efficiency.
Figure 2.
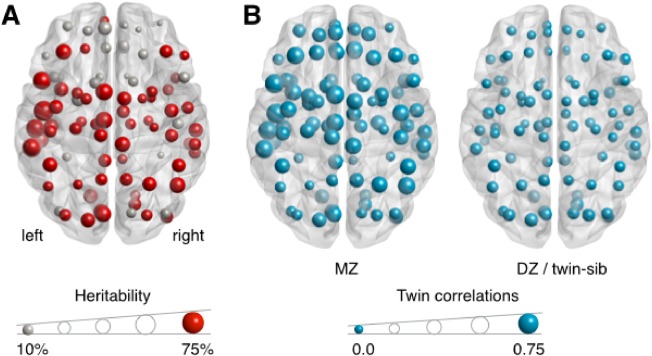
A: Significant heritability (up to 74%) of local efficiency at age 10. Size of the nodes represents the heritability of local efficiency. See Supporting Information Table S1 for a complete overview of the heritability of local efficiency at first and second measurement. B: Estimated correlations between members of a twin pair for local efficiency for MZ twin (left) and DZ twin/twin‐sibling pairs (right), with MZ correlations ranging up to 0.75. [Color figure can be viewed in the online issue, which is available at http://wileyonlinelibrary.com.]
At second measurement, at the age of 13 years, heritability estimates were 48% [0.20–0.67] for global and up to 75% for local efficiency (average local efficiency 40% [14–60]). MZ correlations were 0.43 [0.09–0.66] for global efficiency and 0.35 [0.03–0.59] for average local efficiency. DZ/twin‐sib correlations were 0.15 [−0.08–0.38] for global efficiency and 0.08 [−0.13–0.30] for average local efficiency. Over time, a stable genetic factor influenced global (genetic correlation r g = 1.00 [0.63–1.00]) and average local (r g = 1.00 [0.53–1.00]) efficiency.
(Genetic) Associations of FA‐Weighted Network Efficiency with Intelligence
A higher average local efficiency was associated with a higher level of intellectual functioning, significantly at age 13 (first measurement M1: r = 0.13 [−0.04–0.29]; P = 0.12; second measurement M2: r = 0.16 [0.01–0.32]; P = 0.047). This association appeared to be driven by performance IQ (M1: r = 0.17; P = 0.047; M2: r = 0.19; P = 0.039) rather than verbal IQ (M1: r = 0.07; P = 0.39; M2: r = 0.09; P = 0.29). At age 13, the association between average local efficiency and IQ was caused by shared genes influencing by both phenotypes (genetic correlation r g = 1.00 [0.13–1.00]; P = 0.016). There were no associations between global efficiency and intelligence.
At a nodal level, at both measurements, the association between local efficiency and IQ was particularly prominent in frontal and temporal areas; for example, in the inferior frontal cortex, insula, superior temporal pole, superior and middle temporal gyri, Heschl's gyrus, angular gyrus, bilaterally although most prominently on the right side (Fig. 3; Table 2). These associations could for a large part be explained by genetic factors influencing both intelligence and network efficiency (Fig. 3; Table 2).
Figure 3.
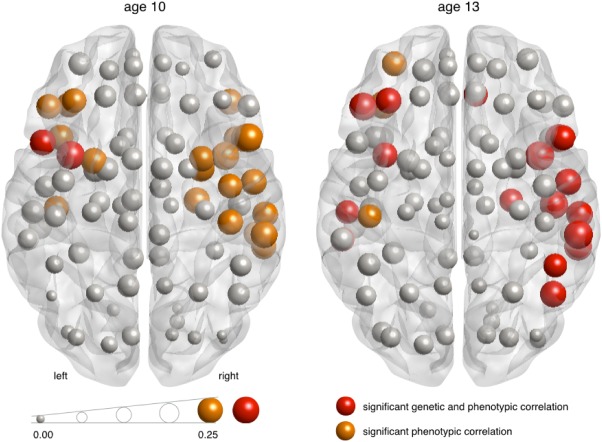
Associations between FA‐based local efficiency and IQ. Local correlations between IQ and network efficiency range up to 0.25. Red spheres represent significant correlations between network efficiency and IQ that can be attributed to a shared genetic component. Orange spheres represent significant correlations between network efficiency and IQ for which the contributions of genes and environment could not be disentangled. The size of the spheres represents the size of the correlation. See Table II for a complete overview of regional correlations between FA‐based local efficiency and IQ.
Table 2.
Correlations between FA‐weighted local efficiency and IQ at measurement 1 (M1) and 2 (M2), and between change in local efficiency and change in IQ
| Left | Right | |||||
|---|---|---|---|---|---|---|
| Region | M 1 | M 2 | Change | M 1 | M 2 | Change |
| Precentral | 0.16 | 0.13 | 0.18 | 0.18 | 0.16a | 0.17 |
| Frontal_Sup | 0.15 | 0.12 | 0.21 | 0.11 | 0.13 | 0.18 |
| Frontal_Sup_Orb | 0.11 | 0.16a | 0.22 | 0.02 | 0.12a | 0.17 |
| Frontal_Mid | 0.18 | 0.20 a | 0.20 | 0.09 | 0.10 | 0.11 |
| Frontal_Mid_Orb | 0.15 | 0.18 | 0.21 | 0.07 | 0.14a | 0.10 |
| Frontal_Inf_Oper | 0.20 a | 0.16 | 0.18 | 0.25 | 0.19 a | 0.18 |
| Frontal_Inf_Tri | 0.18 | 0.23 a | 0.20 | 0.15 | 0.14 | 0.12 |
| Frontal_Inf_Orb | 0.19 | 0.23 | 0.24 | 0.20 | 0.16a | 0.14 |
| Rolandic_Oper | 0.14 | 0.12 | 0.18 | 0.20 | 0.21 a | 0.15 |
| Supp_Motor_Area | 0.15 | 0.05 | 0.17 | 0.15 | 0.09 | 0.15 |
| Olfactory | 0.11 | 0.13a | 0.15 | 0.08 | 0.15 | 0.18 |
| Frontal_Sup_Medial | 0.11 | 0.10 | 0.20 | 0.08 | 0.10 | 0.16 |
| Frontal_Med_Orb | 0.05 | 0.06 | 0.19 | 0.02 | 0.05 | 0.19 |
| Rectus | 0.06 | 0.12a | 0.12 | 0.08a | 0.17 a | 0.18 |
| Insula | 0.24 a | 0.19 a | 0.22 | 0.23 | 0.25 a | 0.19 |
| Cingulum_Ant | 0.15 | 0.14a | 0.22 | 0.06 | 0.12a | 0.20 |
| Cingulum_Mid | 0.14 | 0.04 | 0.10 | 0.14a | 0.06 | 0.13 |
| Cingulum_Post | 0.14 | 0.12a | 0.05 | 0.12 | 0.12 | 0.08 |
| Hippocampus | 0.11 | 0.07 | 0.08 | 0.11 | 0.12a | 0.11 |
| ParaHippocampal | 0.13 | 0.10 | 0.20 | 0.21 | 0.17 a | 0.16 |
| Amygdala | 0.16 | 0.11 | 0.14 | 0.23 | 0.14 | 0.16 |
| Calcarine | 0.01 | 0.05 | 0.03 | 0.04 | 0.07 | 0.08 |
| Cuneus | 0.10 | 0.09 | 0.06 | 0.00 | 0.10 | 0.08 |
| Lingual | 0.01 | 0.07 | 0.04 | −0.02 | 0.00 | 0.10 |
| Occipital_Sup | 0.06 | 0.11 | 0.02 | 0.02 | 0.11 | 0.08 |
| Occipital_Mid | 0.07 | 0.12a | 0.03 | −0.05 | 0.00 | 0.10 |
| Occipital_Inf | 0.02 | 0.13 | 0.00 | −0.07 | 0.05 | 0.12 |
| Fusiform | 0.13 | 0.15a | −0.03 | 0.09 | 0.08 | 0.10 |
| Postcentral | 0.14 | 0.17 | 0.13 | 0.20 | 0.11 | 0.14 |
| Parietal_Sup | 0.08 | 0.11 | 0.01 | 0.10 | 0.13 | 0.11 |
| Parietal_Inf | 0.08 | 0.16a | 0.06 | 0.14 | 0.17 a | 0.19 |
| SupraMarginal | 0.09 | 0.14 | 0.09 | 0.22 | 0.24 a | 0.17 |
| Angular | −0.03 | 0.11 | 0.02 | 0.14 | 0.21 a | 0.15 |
| Precuneus | 0.15 | 0.09 | 0.04 | 0.06 | 0.04 | 0.10 |
| Paracentral_Lobule | 0.10 | 0.04 | 0.12 | 0.13 | −0.04 | −0.03 |
| Caudate | 0.12 | 0.10 | 0.19 | 0.12 | 0.10a | 0.18 |
| Putamen | 0.20 | 0.16a | 0.19 | 0.20 | 0.14a | 0.20 |
| Pallidum | 0.16 | 0.11a | 0.17 | 0.11 | 0.12 | 0.17 |
| Thalamus | 0.08 | 0.05 | 0.19 | 0.05 | 0.09 | 0.20 |
| Heschl | 0.18 | 0.14a | 0.16 | 0.16 | 0.24 a | 0.15 |
| Temporal_Sup | 0.16 | 0.17 a | 0.18 | 0.20 | 0.21 a | 0.17 |
| Temporal_Pole_Sup | 0.19 | 0.15a | 0.21 | 0.22 | 0.23 a | 0.21 |
| Temporal_Mid | 0.13 | 0.17 a | 0.20 | 0.19 | 0.23 a | 0.13 |
| Temporal_Pole_Mid | 0.11 | 0.15a | 0.18 | 0.18 | 0.16a | 0.18 |
| Temporal_Inf | 0.16 | 0.14 | 0.12 | 0.18 | 0.12a | 0.13 |
Bold: significant phenotypic correlations (P < 0.05).
Observed correlation explained by a significant genetic association.
Changes in FA‐Weighted Network Efficiency Are Related to Changes in Intelligence
When assessing changes in network efficiency and changes in intelligence within individuals over time, adolescents who showed the most prominent increase in efficiency of the structural brain network were the ones who gained (most) in intelligence. In contrast, individuals showing a reduction—or no change—in global network efficiency, displayed a decrease in IQ (r = 0.17, P = 0.030) and performance IQ (r = 0.18, P = 0.023) but not in verbal IQ (r = 0.05, P = 0.53). Average local efficiency change correlated with change in total IQ (r = 0.17, P = 0.034) and performance IQ (r = 0.16, P = 0.045), but not with change in verbal IQ (r = 0.07, P = 0.38). We could not disentangle whether these associations were driven by genetic and/or environmental factors.
Changes in local efficiency and concomitant change in intelligence were most evident in frontal and temporal areas (Fig. 4; Table 2). Specifically, change in local network efficiency in the left inferior orbitofrontal cortex and left anterior cingulum explained over 6% of individual change in intelligence. The association between change in intelligence and that in local efficiency was also present in other (including right‐sided) frontal areas, as well as in the superior temporal poles, insula, thalamus, putamen, pallidum, and caudate nucleus.
Figure 4.
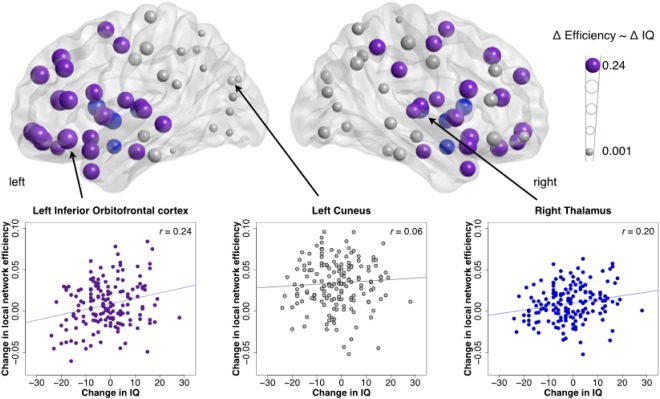
Development of network efficiency and intelligence in adolescence. Correlations between the change in local efficiency and change in IQ [nodes with a significant correlation are colored in purple (cortical) and blue (subcortical)]; with examples of scatterplots of correlation of local efficiency change in left orbitofrontal cortex (significant; left panel), left cuneus (non‐significant [but has one of the largest increases in local efficiency]; middle panel), and right thalamus (significant; right panel) with change in IQ. See Table II for a complete overview of regional correlations between changes FA‐based local efficiency and changes IQ. [Color figure can be viewed in the online issue, which is available at http://wileyonlinelibrary.com.]
Post‐hoc analyses revealed no significant differences between boys and girls in (change of) global FA‐weighted and local FA‐weighted network measures, or interactions between IQ and network measures at baseline, at follow up, and over time.
Analyses on Networks Weighted with Streamline Count
Streamline count based network efficiency was higher in boys at both measurements (see Supporting Information Table SII). Because of this sex effect in the network characteristics when weighing the network with streamline count, the analyses on streamline count weighted networks were corrected for sex beforehand. This did not change the results on change over time, associations with intelligence or the genetic modeling results.
Efficiency of the Streamline Count Weighted Brain Network Increases and Decreases During Early Adolescence
Both global (P < 0.001) and average local (P = 0.012) efficiency decreased in the three year follow up period. Locally, efficiency increased in frontal and occipital areas, and decreased in subcortical, temporal, and parietal regions (Fig. 5; Supporting Information Table S2).
Figure 5.
Development of streamline count based network efficiency. A: Efficiency of the structural brain network at age 10. Larger nodes represent a higher level of efficiency. Edges in the network are colored by number of streamlines; higher values in red, lower values in blue. For details on local efficiency at measurement 1 and measurement 2, see Supporting Information Table SII. B: Development of the structural brain network over a three‐year interval with significant (P < 0.05/90) increase in local network efficiency shown in red nodes and significant decreases are shown in yellow nodes; larger nodes represent a larger absolute change. Edges are colored by significant changes in streamline counts. For visualization purposes, only edges with a significant at P < 0.005 change are shown. See Supporting Information Table SII for details.
Compared with random networks, average local efficiency slightly decreased (P = 0.045) but global efficiency did not change. When we normalized the matrices, global efficiency decreased (P = 0.009) but normalized average local efficiency did not change.
Genetic Influences on Streamline Count Weighted Network Characteristics
Because of the observed age and sex effects, in the following analyses, all data were corrected for age and sex beforehand.
Local and global efficiency of streamline count weighted networks were also highly heritable at both measurements with heritability for local efficiency up to 64% (Supporting Information Table SIII). Heritability estimates were: Average local efficiency 37% [12–65], global efficiency 60% [27–78] for M1; average local efficiency 24% [6–47]), global efficiency 24% [6–45] for M2. Over time, a stable genetic factor influenced global (r g = 0.87 [0.37–1.00]) and average local (r g = 0.96 [0.19–1.00]) efficiency. In addition, a number of regions showed genetic influences on the change in local efficiency (Supporting Information Table SIII).
Changes in Streamline Count Weighted Network Efficiency Are Related to Changes in Intelligence
We did not find a relation between network efficiency and IQ scores at age 10 or 13. Nevertheless, a change in efficiency was correlated to a change in IQ: individuals who gained in IQ scores showed a decrease in average local efficiency (r = −0.16, P = 0.043), which was driven by performance IQ (r = −0.22, P = 0.005) rather than verbal IQ (r = 0.02, P = 0.79). Genetic and/or environmental correlations were not significant. A similar pattern was found for global efficiency, but only the association with performance IQ reached significance (r = −0.20, P = 0.010). Again, influences of genetic and environmental correlations could not be disentangled. Local regions with largest relations were left inferior orbitofrontal cortex and left caudate, followed by bilateral anterior cingulum and left middle occipital gyrus (Supporting Information Table SIV).
DISCUSSION
Here we show in a longitudinal study in 162 young adolescent twins and their siblings, that FA‐based efficiency of the brain's structural network increases during early adolescence. We are one of the first studies to measure structural network development in adolescence using a longitudinal approach. Both increases in white matter integrity (FA) and reorganization of the network contribute to an increase in FA‐based global and local efficiency. At the same time, local increases and decreases in streamline count and a reorganization of the network both contribute to a net decrease in streamline count‐based network global efficiency. Moreover, these changes in network efficiency are related to intelligence; changes in intelligence and in the structural brain network efficiency appear to go hand in hand. This effect seemed stronger in FA based efficiency, which showed a clear pattern of frontal and temporal increases of local efficiency that were related to an increase IQ. To a smaller extent, streamline count based local efficiency was negatively related to changes in IQ in a more widespread pattern in frontal, cingulate, and occipital regions.
We report moderate to high heritability for efficiency of the brain's structural network (locally up to 74% for FA‐based networks; up to 64% for streamline count based networks) in early adolescence. For both average local and global efficiency, the genetic factor influencing the efficiency measure remained stable during development in adolescence. Besides, the relation between IQ and FA‐based local network efficiency was completely explained by genes shared by both phenotypes. Our findings extend those from cross‐sectional studies in adults that report genetic effects on structural network topology [Bohlken et al., 2014; Jahanshad et al., 2012] and on functional network topology in adults [Fornito et al., 2011] and in this cohort [van den Heuvel et al., 2013a]. This might imply that over time the genetic influence on local structural network organization remains stable.
A higher intelligence was accompanied by a more local efficient fiber integrity (FA) based network, but not related to streamline‐based local or global efficiency. These associations (up to 0.25) are of comparable magnitude as the (genetic) association between intelligence and whole brain volume in adults [Posthuma et al., 2002]. The positive associations between IQ and FA‐based local efficiency were particularly prominent in frontal and temporal nodes, emphasizing the relevance of frontal and temporal regions for intelligence [Haier et al., 1988, 2004], in accordance with the P‐FIT regions (parieto‐frontal integration theory of intelligence) regions [Jung and Haier, 2007]. Moreover, it emphasizes that how these regions are connected with the rest of the brain is important. This extends prior reports on positive associations between intelligence and global and local structural network efficiency in adults [Li et al., 2009; Wen et al., 2011] by showing that the two are genetically related, already in childhood. This result relates to previous findings that local efficiency of the functional network in frontal, parietal and temporal regions is related to IQ in children and adolescents [Wu et al., 2013] and in adults [van den Heuvel et al., 2009; Langer et al., 2012; Santarnecchi et al., 2014]. Indeed, gray matter regions associated with intelligence based on volumetric measures were more densely connected than on average, which underlines the importance of connectivity between cortical regions implicated in intelligence [Bohlken et al., under review]. In addition, other studies have reported that the strength of functional connectivity between the prefrontal cortex and the rest of the brain is related to IQ [Cole et al., 2012; Song et al., 2008], and suggested that enlargement of the rostral putamen is related to IQ through its functional relation with the inferior parietal cortex and insula [Burgaleta et al., 2014b]. However, despite the visual overlap of our results (Fig. 3) with previous mentioned regions that are involved in intellectual functioning, we did not find direct evidence for P‐FIT regions to be overly represented in our findings: 6 or 8 significant regions out of 24 P‐FIT regions versus 17 or 12 significant regions out of 66 non‐P‐FIT regions (chi square tests P = 0.94 and P = 0.21 at measurement 1 and 2, respectively). Nonetheless, as the participants in this study were rather young, it could be that at an older age, correlations with IQ become more crystalized in the brain. To date there are only two studies that describe a correlation between DTI network efficiency (global and local) and IQ; one study in young adults between 17 and 33 years [Li et al., 2009] and one in older people between 72 and 90 years [Wen et al., 2011]. In addition, it is likely that the structural brain associations with IQ are not stable throughout life; for instance, cortical thickness develops differently depending on IQ [Brans et al., 2010; Brouwer et al., 2013; Karama et al., 2009; Schnack et al., 2015; Shaw et al., 2006]. Thus, possibly, the association between local efficiency and IQ grows with network maturation when also the relation between global efficiency and IQ becomes evident.
Importantly, the subjects with most prominent maturational changes in brain wiring via FA or streamline count also showed a positive change in IQ. Although intelligence was stable over the three‐year follow‐up in the majority of individuals in our cohort, one in six adolescents showed a substantial change in their IQ score (> 15 points). Such considerable changes in IQ scores have been reported in other adolescent cohorts, implicating that an individual's intellectual capacity relative to their peers can decrease or increase during adolescence [Burgaleta et al., 2014a; Ramsden et al., 2011; Waber et al., 2012]. Our findings support the existence of individual variations in long‐term modification of the structural network for functional demands [Park and Friston, 2013]. A relationship between change in intelligence and change in brain structure during adolescence has been shown earlier, where increases in IQ scores have been related to local increases in gray matter density [Ramsden et al., 2011] and rate of cortical thinning [Burgaleta et al., 2014a], suggesting, as we do, that individual development of intellectual capacity goes hand in hand with changes in anatomically distant brain regions. Our finding suggests that during this time of rapid intellectual development, plasticity of the brain's network is an important contributing, if not necessary, factor to maintain and possibly gain in intellectual capacity.
Over the three‐year interval, we find an increase in FA and FA‐based efficiency in almost all brain areas. This longitudinal finding coincides with cross‐sectional studies reporting maturation of white matter integrity [Baker et al., 2015; Kochunov et al., 2012; Lebel and Beaulieu, 2011; Schmithorst and Yuan, 2010], although local decreases in FA have also been found [Baker et al., 2015]. Overall increases in FA cannot solely explain our network findings, since local efficiency also increases when we correct for overall increase in FA, suggesting a redistribution of the weights in the structural network during development. In addition, we know from previous work in adults that different genetic factors independently influence FA and network topology [Bohlken et al., 2014], which suggests that network topology provides supplementary information to FA. When we repeated our analyses using streamline count weighted networks, we find a net decrease in global efficiency, with local decreases in subcortical, temporal, and parietal areas, and increases in frontal and occipital areas. This is consistent with a recent longitudinal study that found increases and decreases in streamline density in late adolescence [Baker et al., 2015]. Our findings extend reports that both increases and decreases in local efficiency occur between 12 and 30 years [Dennis et al., 2013], and in adulthood [Gong et al., 2009]. Other studies found an increase in global efficiency over the ages 2–18 [Hagmann et al., 2010] and a decrease in local and global efficiency between the ages 4 and 40 [Lim et al., 2015]. Thus, considerable developmental changes take place during childhood and adolescence, not only over a broad age range, but as the current study shows also within the small age range of 3 years. Indeed, the longitudinal aspect provided statistical power to detect processes that take place during a period of rapid changes in the brain and intelligence.
When comparing the results of FA weighted with streamline count weighted networks in our cohort, the results clearly show that these measures capture different aspects of brain development. Indeed, our findings seem to imply that during development of the structural brain network, local information processing capacity improves via an increased speed of information transfer along the axons, while certain fiber bundles become more compact in volume, as was measured with net decrease in streamline count. This finding was also reflected by the differential relation between efficiency and IQ in FA versus streamline‐weighted networks. FA‐weighted but not streamline‐weighted local efficiency correlated locally with IQ, although a change in both local streamline‐weighted efficiency and local and global FA‐weighted efficiency was correlated to change in IQ. That different aspects of white matter bundles (FA, T1, MTR) can independently associate with IQ has been shown [Bohlken et al., in preparation; Penke et al., 2012], supporting our findings. In addition, in a recent longitudinal study in late adolescence it was shown that with development both streamline and FA weights show local increases and decreases throughout brain, but there seems to be a bias towards FA‐increase in hub‐to‐hub connections whereas streamline count shows both increases and decreases in these connections [Baker et al., 2015]. Two other studies in adults performed streamline and FA based analyses and found comparable results for associations with age [Stadlbauer et al., 2012] and IQ [Li et al., 2009], thus contrasting our findings. However, possibly, the relation between FA and streamline count—and their associations with IQ—changes with brain maturation.
Because our focus was on the longitudinal aspect of our data, we used a very stringent edge selection: only those edges that could be measured twice (once at each measurement) within an individual were included in the final individual network. Using this approach, individual networks were sparser than when all traced bundles would have been included. However, we ensured a higher signal to noise ratio. When applying a mask that includes bundles present in 60% of the participants at both measurements 1 and 2 [de Reus and van den Heuvel, 2013] we find similar results, although the associations between network measures and IQ become somewhat stronger. This indicates that our stringent edge‐selection did not drive our findings.
In the streamline based networks there was some discrepancy between the normalized and randomized results with regard to the correlation between change in IQ and change in local and global efficiency. This may be explained by the longitudinal setup of our study. For FA, there was an almost brain‐wide increase, which we wanted to take into account. For streamline count, at a regional level both increases and decreases were found. A correction for overall change in streamline count thus includes both positive and negative changes, and that will influence the whole brain network independently of the strong local differences in maturation pattern. Comparing the individual streamline‐based networks to randomized networks provides in this case a better approach because networks are compared to their own null‐model with the same weight distribution.
Several studies found sex related differences in brain characteristics in children and adolescents [Ingalhalikar et al., 2014; Lebel and Beaulieu, 2011; Schmithorst and Yuan, 2010; Wu et al., 2013] and adults [Lebel et al., 2012; Tang et al., 2010; Yan et al., 2011]. We found that streamline‐weighted network efficiency was significantly higher in boys at baseline and follow‐up, but boys and girls did not differ on change measures. In contrast, we found no sex differences in FA‐weighted network measures. Since the participants in the current study are still young (mean age at baseline 9.9 years), sex differences in structural network properties could develop at a later age. There are suggestions that males and females may also have differential regional associations with intelligence [e.g., Haier et al., 2004; Tang et al., 2010; see also review by Deary et al., 2010]. Although we cannot exclude that insufficient statistical power disguised differences between boys and girls, our data did not show (regional) sex‐dependent longitudinal network changes or correlations between local structural efficiency and IQ at this age.
In conclusion, in this longitudinal study, we show that the FA‐based topological properties of the young and healthy teenage brain become more efficient with age. The streamline‐based network is reorganized to a topology with decreased global efficiency via increases and decreases in local efficiency. This indicates that FA and streamline count cover different aspects of the developing brain and that maturation is not always accompanied by increases in local information processing. Moreover, the increase in FA‐based local and global efficiency is related to increases in IQ, whereas in streamline‐based networks, local decreases in efficiency were related to increases in IQ. This suggests that a decrease in local information processing capabilities is not per se undesirable. We also found that variation in the topology of both FA and streamline‐based networks of young adolescents is partly due to genetic variation, and that genes shaping FA‐based connectivity organization also benefit intelligence. Clearly, the teenage brain is a network in progress in which individual differences in network maturation relate to the level of intellectual functioning.
Supporting information
Supporting Information
REFERENCES
- Achard S, Bullmore E (2007): Efficiency and cost of economical brain functional networks. PLoS Comput Biol 3:174–183. [DOI] [PMC free article] [PubMed] [Google Scholar]
- Andersson JLR, Skare S (2002): A model‐based method for retrospective correction of geometric distortions in diffusion‐weighted EPI. Neuroimage 16:177–199. [DOI] [PubMed] [Google Scholar]
- Baker ST, Lubman DI, Yücel M, Allen NB, Whittle S, Fulcher BD, Zalesky A, Fornito A (2015): Developmental Changes in Brain Network Hub Connectivity in Late Adolescence. J Neurosci 35:9078–9087. [DOI] [PMC free article] [PubMed] [Google Scholar]
- Basser PJ, Pierpaoli C (1996): Microstructural and physiological features of tissues elucidated by quantitative‐diffusion‐tensor MRI. J Magn Reson B 111:209–219. [DOI] [PubMed] [Google Scholar]
- Bassett DS, Bullmore ET (2009): Human brain networks in health and disease. Curr Opin Neurol 22:340–347. [DOI] [PMC free article] [PubMed] [Google Scholar]
- Bassett DS, Bullmore ET, Meyer‐Lindenberg A, Apud JA, Weinberger DR, Coppola R (2009): Cognitive fitness of cost‐efficient brain functional networks. Proc Natl Acad Sci U S A 106:11747–11752. [DOI] [PMC free article] [PubMed] [Google Scholar]
- Boker S, Neale M, Maes H, Wilde M, Spiegel M, Brick T, Spies J, Estabrook R, Kenny S, Bates T, Mehta P, Fox J (2011): OpenMx: An open source extended structural equation modeling framework. Psychometrika 76:306–317. [DOI] [PMC free article] [PubMed] [Google Scholar]
- Bohlken MM, Mandl RC, Brouwer RM, van den Heuvel MP, Hedman AM, Kahn RS, Hulshoff Pol HE (2014): Heritability of structural brain network topology: A DTI study of 156 twins. Hum Brain Mapp 35:5295–5305. [DOI] [PMC free article] [PubMed] [Google Scholar]
- Bohlken MM, Brouwer RM, Mandl RC, Hedman AM, van den Heuvel MP, van Haren NEM, Kahn RS, Hulshoff Pol HE: Topology of Genetic Associations between Regional Grey Matter Volume and Intellectual Ability: Evidence for a High Capacity Network (under review). [DOI] [PubMed] [Google Scholar]
- Bouchard TJ, McGue M (2003): Genetic and environmental influences on human psychological differences. J Neurobiol 54:4–45. [DOI] [PubMed] [Google Scholar]
- Brans RG, Kahn RS, Schnack HG, van Baal GC, Posthuma D, van Haren NE, Lepage C, Lerch JP, Collins DL, Evans AC, Boomsma DI, Hulshoff Pol HE (2010): Brain plasticity and intellectual ability are influenced by shared genes. J Neurosci 30:5519–5524. [DOI] [PMC free article] [PubMed] [Google Scholar]
- Brouwer RM, Mandl RC, Peper JS, van Baal GC, Kahn RS, Boomsma DI, Hulshoff Pol HE (2010): Heritability of DTI and MTR in nine‐year‐old children. Neuroimage 53:1085–1092. [DOI] [PubMed] [Google Scholar]
- Brouwer RM, Mandl RC, Schnack HG, van Soelen IL, van Baal GC, Peper JS, Kahn RS, Boomsma DI, Hulshoff Pol HE (2012): White Matter Development in Early Puberty: A Longitudinal Volumetric and Diffusion Tensor Imaging Twin Study. PLoS One 7:e32316 [DOI] [PMC free article] [PubMed] [Google Scholar]
- Brouwer RM, van Soelen IL, Swagerman SC, Schnack HG, Ehli EA, Kahn RS, Hulshoff Pol HE, Boomsma DI (2013): Genetic associations between intelligence and cortical thickness emerge at the start of puberty. Hum Brain Mapp 35:3760–3773. [DOI] [PMC free article] [PubMed] [Google Scholar]
- Bullmore ET, Bassett DS (2011): Brain graphs: Graphical models of the human brain connectome. Annu Rev Clin Psychol 7:113–140. [DOI] [PubMed] [Google Scholar]
- Bullmore ET, Sporns O (2009): Complex brain networks: Graph theoretical analysis of structural and functional systems. Nat Rev Neurosci 10:186–198. [DOI] [PubMed] [Google Scholar]
- Bullmore ET, Sporns O (2012): The economy of brain network organization. Nat Rev Neurosci 13:336–349. [DOI] [PubMed] [Google Scholar]
- Burgaleta M, Johnson W, Waber DP, Colom R, Karama S (2014a): Cognitive ability changes and dynamics of cortical thickness development in healthy children and adolescents. Neuroimage 84:810–819. [DOI] [PMC free article] [PubMed] [Google Scholar]
- Burgaleta M, MacDonald PA, Martínez K, Román FJ, Álvarez‐Linera J, Ramos González A, Karama S, Colom R (2014b): Subcortical regional morphology correlates with fluid and spatial intelligence. Hum Brain Mapp 35:1957–1968. [DOI] [PMC free article] [PubMed] [Google Scholar]
- Chang LC, Jones DK, Pierpaoli C (2005): RESTORE: Robust estimation of tensors by outlier rejection. Magn Reson Med 53:1088–1095. [DOI] [PubMed] [Google Scholar]
- Chiang MC, Barysheva M, Shattuck DW, Lee AD, Madsen SK, Avedissian C, Klunder AD, Toga AW, McMahon KL, de Zubicaray GI, Wright MJ, Srivastava A, Balov N, Thompson PM (2009): Genetics of brain fiber architecture and intellectual performance. J Neurosci 29:2212–2224. [DOI] [PMC free article] [PubMed] [Google Scholar]
- Chiang MC, McMahon KL, de Zubicaray GI, Martin NG, Hickie I, Toga AW, Wright MJ, Thompson PM (2011): Genetics of white matter development: A DTI study of 705 twins and their siblings aged 12 to 29. Neuroimage 54:2308–2317. [DOI] [PMC free article] [PubMed] [Google Scholar]
- Chiang MC, Barysheva M, McMahon KL, de Zubicaray GI, Johnson K, Montgomery GW, Martin NG, Toga AW, Wright MJ, Shapshak P, Thompson PM (2012): Gene network effects on brain microstructure and intellectual performance identified in 472 twins. J Neurosci 32:8732–8745. [DOI] [PMC free article] [PubMed] [Google Scholar]
- Cole MW, Yarkoni T, Repovs G, Anticevic A, Braver TS (2012): Global connectivity of prefrontal cortex predicts cognitive control and intelligence. J Neurosci 32:8988–8999. [DOI] [PMC free article] [PubMed] [Google Scholar]
- Collins DL, Holmes CJ, Peters TM, Evans AC (1995): Automatic 3‐D model‐based neuroanatomical segmentation. Hum Brain Mapp 3:190–208. [Google Scholar]
- Davies G, Armstrong N, Bis JC, Bressler J, Chouraki V, Giddaluru S, Hofer E, Ibrahim‐Verbaas CA, Kirin M, Lahti J, van der Lee SJ, Le Hellard S, Liu T, Marioni RE, Oldmeadow C, Postmus I, Smith AV, Smith JA, Thalamuthu A, Thomson R, Vitart V, Wang J, Yu L, Zgaga L, Zhao W, Boxall R, Harris SE, Hill WD, Liewald DC, Luciano M, Adams H, Ames D, Amin N, Amouyel P, Assareh AA, Au R, Becker JT, Beiser A, Berr C, Bertram L, Boerwinkle E, Buckley BM, Campbell H, Corley J, De Jager PL, Dufouil C, Eriksson JG, Espeseth T, Faul JD, Ford I; Generation Scotland, Gottesman RF, Griswold ME, Gudnason V, Harris TB, Heiss G, Hofman A, Holliday EG, Huffman J, Kardia SL, Kochan N, Knopman DS, Kwok JB, Lambert JC, Lee T, Li G, Li SC, Loitfelder M, Lopez OL, Lundervold AJ, Lundqvist A, Mather KA, Mirza SS, Nyberg L, Oostra BA, Palotie A, Papenberg G, Pattie A, Petrovic K, Polasek O, Psaty BM, Redmond P, Reppermund S, Rotter JI, Schmidt H, Schuur M, Schofield PW, Scott RJ, Steen VM, Stott DJ, van Swieten JC, Taylor KD, Trollor J, Trompet S, Uitterlinden AG, Weinstein G, Widen E, Windham BG, Jukema JW, Wright AF, Wright MJ, Yang Q, Amieva H, Attia JR, Bennett DA, Brodaty H, de Craen AJ, Hayward C, Ikram MA, Lindenberger U, Nilsson LG, Porteous DJ, Räikkönen K, Reinvang I, Rudan I, Sachdev PS, Schmidt R, Schofield PR, Srikanth V, Starr JM, Turner ST, Weir DR, Wilson JF, van Duijn C, Launer L, Fitzpatrick AL, Seshadri S, Mosley TH Jr, Deary IJ. (2015): Genetic contributions to variation in general cognitive function: A meta‐analysis of genome‐wide association studies in the CHARGE consortium (N=53949). Mol Psychiatry. 20:183–192. [DOI] [PMC free article] [PubMed] [Google Scholar]
- Deary IJ (2012): Intelligence. Annu Rev Psychol 63:453–482. [DOI] [PubMed] [Google Scholar]
- Deary IJ, Penke L, Johnson W (2010): The neuroscience of human intelligence differences. Nat Rev Neurosci 11:201–211. [DOI] [PubMed] [Google Scholar]
- Deary IJ, Yang J, Davies G, Harris SE, Tenesa A, Liewald D, Luciano M, Lopez LM, Gow AJ, Corley J, Redmond P, Fox HC, Rowe SJ, Haggarty P, McNeill G, Goddard ME, Porteous DJ, Whalley LJ, Starr JM, Visscher PM (2012): Genetic contributions to stability and change in intelligence from childhood to old age. Nature 482:212–215. [DOI] [PubMed] [Google Scholar]
- Dennis EL, Jahanshad N, McMahon KL, de Zubicaray GI, Martin NG, Hickie IB, Toga AW, Wright MJ, Thompson PM (2013): Development of brain structural connectivity between ages 12 and 30: A 4‐Tesla diffusion imaging study in 439 adolescents and adults. Neuroimage 64:671–684. [DOI] [PMC free article] [PubMed] [Google Scholar]
- de Reus MA, van den Heuvel MP (2013): Estimating false positives and negatives in brain networks. Neuroimage 70:402–409. [DOI] [PubMed] [Google Scholar]
- Fair DA, Cohen AL, Dosenbach NU, Church JA, Miezin FM, Barch DM, Raichle ME, Petersen SE, Schlaggar BL (2008): The maturing architecture of the brain's default network. Proc Natl Acad Sci U S A. 11:4028–4032. [DOI] [PMC free article] [PubMed] [Google Scholar]
- Fan Y, Shi F, Smith JK, Lin W, Gilmore JH, Shen D (2011): Brain anatomical networks in early human brain development. Neuroimage 54:1862–1871. [DOI] [PMC free article] [PubMed] [Google Scholar]
- Fornito A, Zalesky A, Bassett DS, Meunier D, Ellison‐Wright I, Yücel M, Wood SJ, Shaw K, O'Connor J, Nertney D, Mowry BJ, Pantelis C, Bullmore ET (2011): Genetic influences on cost‐efficient organization of human cortical functional networks. J Neurosci 31:3261–3270. [DOI] [PMC free article] [PubMed] [Google Scholar]
- Fornito A, Zalesky A, Pantelis C, Bullmore ET (2012): Schizophrenia, neuroimaging and connectomics. Neuroimage 62:2296–2314. [DOI] [PubMed] [Google Scholar]
- Giedd J, Blumenthal J, Jeffries NO, Castellanos FX, Liu H, Zijdenbos A, Paus T, Evans AC, Rapoport JL (1999): Brain development during childhood and adolescence: A longitudinal MRI study. Nat Neurosci 2:861–863. [DOI] [PubMed] [Google Scholar]
- Gong G, Rosa‐Neto P, Carbonell F, Chen ZJ, He Y, Evans AC (2009): Age‐ and gender‐related differences in the cortical anatomical network. J Neurosci 29:15684–15693. [DOI] [PMC free article] [PubMed] [Google Scholar]
- Hagmann P, Sporns O, Madan N, Cammoun L, Pienaar R, Wedeen VJ, Meuli R, Thiran JP, Grant PE (2010): White matter maturation reshapes structural connectivity in the late developing human brain. Proc Natl Acad Sci U S A. 107:19067–19072. [DOI] [PMC free article] [PubMed] [Google Scholar]
- Haier RJ, Siegel BV, Nuechterlein KH, Hazlett E, Wu JC, Paek J, Browlning HL, Buchsbaum MS (1988): Cortical glucose metabolic rate correlates of abstract reasoning and attention studied with positron emission tomography. Intelligence 12:199–217. [Google Scholar]
- Haier RJ, Jung RE, Yeo RA, Head K, Alkire MT (2004): Structural brain variation and general intelligence. Neuroimage 23:425–433. [DOI] [PubMed] [Google Scholar]
- Hulshoff Pol HE, Bullmore ET (2013): Neural networks in Psychiatry. Eur J Neuropsychopharm 14:322‐336. [DOI] [PubMed] [Google Scholar]
- Ingalhalikar M, Smith A, Parker D, Satterthwaite TD, Elliott MA, Ruparel K, Hakonarson H, Gur RE, Gur RC, Verma R (2014): Sex differences in the structural connectome of the human brain. Proc Natl Acad Sci U S A 111:823–828. [DOI] [PMC free article] [PubMed] [Google Scholar]
- Jahanshad N, Prasad G, Toga AW, McMahon KL, de Zubicaray GI, Martin NG, Wright MJ, Thompson PM (2012): Genetics of Path Lengths in Brain Connectivity Networks: HARDI‐Based Maps in 457 Adults. Multimodal Brain Image Anal 7509:29–40. [DOI] [PMC free article] [PubMed] [Google Scholar]
- Jahanshad N, Kochunov PV, Sprooten E, Mandl RC, Nichols TE, Almasy L, Blangero J, Brouwer RM, Curran JE, de Zubicaray GI, Duggirala R, Fox PT, Hong LE, Landman BA, Martin NG, McMahon KL, Medland SE, Mitchell BD, Olvera RL, Peterson CP, Starr JM, Sussmann JE, Toga AW, Wardlaw JM, Wright MJ, Hulshoff Pol HE, Bastin ME, McIntosh AM, Deary IJ, Thompson PM, Glahn DC. (2013): Multi‐site genetic analysis of diffusion images and voxelwise heritability analysis: A pilot project of the ENIGMA–DTI working group. Neuroimage 81:455–469. [DOI] [PMC free article] [PubMed] [Google Scholar]
- Jung RE, Haier RJ (2007): The Parieto‐Frontal Integration Theory (P‐FIT) of intelligence: converging neuroimaging evidence. Behav Brain Sci 30:135–154. [DOI] [PubMed] [Google Scholar]
- Karama S, Ad‐Dab'bagh Y, Haier RJ, Deary IJ, Lyttelton OC, Lepage C, Evans AC (2009): Brain Development Cooperative Group. Positive association between cognitive ability and cortical thickness in a representative US sample of healthy 6 to 18 year‐olds. Intelligence 37:145–155. [DOI] [PMC free article] [PubMed] [Google Scholar]
- Kochunov P, Williamson DE, Lancaster J, Fox P, Cornell J, Blangero J, Glahn DC (2012): Fractional anisotropy of water diffusion in cerebral white matter across the lifespan. Neurobiol Aging 33:9–20. [DOI] [PMC free article] [PubMed] [Google Scholar]
- Koenis MMG, Brouwer RM, van Baal GC, van Soelen IL, Peper JS, van Leeuwen M, Delemarre‐van de Waal HA, Boomsma DI, Hulshoff Pol HE (2013): Longitudinal study of hormonal and physical development in young twins. J Clin Endocrinol Metab 98:E518–E527. [DOI] [PubMed] [Google Scholar]
- Langer N, Pedroni A, Gianotti LR, Hänggi J, Knoch D, Jäncke L (2012): Functional brain network efficiency predicts intelligence. Hum Brain Mapp 33:1393–1406. [DOI] [PMC free article] [PubMed] [Google Scholar]
- Latora V, Marchiori M (2001): Efficient behavior of small‐world networks. Phys Rev Lett 87:198701 [DOI] [PubMed] [Google Scholar]
- Lee W, Morgan BR, Shroff MM, Sled JG, Taylor MJ (2013): The development of regional functional connectivity in preterm infants into early childhood. Neuroradiology. 55:S105–S111. [DOI] [PubMed] [Google Scholar]
- Lebel C, Beaulieu C (2011): Longitudinal development of human brain wiring continues from childhood into adulthood. J Neurosci 31:10937–10947. [DOI] [PMC free article] [PubMed] [Google Scholar]
- Lebel C, Gee M, Camicioli R, Wieler M, Martin W, Beaulieu C (2012): Diffusion tensor imaging of white matter tract evolution over the lifespan. Neuroimage 60:340–352. [DOI] [PubMed] [Google Scholar]
- Li Y, Liu Y, Li J, Qin W, Li K, Yu C, Jiang T (2009): Brain anatomical network and intelligence. Plos Comput Biol 5:e1000395 [DOI] [PMC free article] [PubMed] [Google Scholar]
- Lim S, Han CE, Uhlhaas PJ, Kaiser M (2015): Preferential Detachment During Human Brain Development: Age‐ and Sex‐Specific Structural Connectivity in Diffusion Tensor Imaging (DTI) Data. Cereb Cortex 25:1477 [DOI] [PMC free article] [PubMed] [Google Scholar]
- Maes F, Collignon A, Vandermeulen D, Marchal G, Suetens P (1997): Multimodality image registration by maximization of mutual information. IEEE Trans Med Imaging 16:187–198. [DOI] [PubMed] [Google Scholar]
- Mori S, van Zijl PCM (2002): Fiber tracking: Principles and strategies ‐ a technical review. NMR Biomed 15:468–480. [DOI] [PubMed] [Google Scholar]
- Nie J, Li G, Wang L, Shi F, Lin W, Gilmore JH, Shen D (2014): Longitudinal development of cortical thickness, folding, and fiber density networks in the first 2 years of life. Hum Brain Mapp 35:3726–3737. [DOI] [PMC free article] [PubMed] [Google Scholar]
- Park H, Friston K (2013): Structural and functional brain networks: From connections to cognition. Science 342:1238411 [DOI] [PubMed] [Google Scholar]
- Paus T (2010): Growth of white matter in the adolescent brain: myelin or axon? Brain Cogn 72:26–35. [DOI] [PubMed] [Google Scholar]
- Penke L, Maniega SM, Bastin ME, Valdés Hernández MC, Murray C, Royle NA, Starr JM, Wardlaw JM, Deary IJ (2012): Brain white matter tract integrity as a neural foundation for general intelligence. Mol Psychiatry 17:1026–1030. [DOI] [PubMed] [Google Scholar]
- Peper JS, Brouwer RM, Boomsma DI, Kahn RS, Hulshoff Pol HE (2007): Genetic influences on human brain structure: A review of brain imaging studies in twins. Hum Brain Mapp 28:464–473. [DOI] [PMC free article] [PubMed] [Google Scholar]
- Plomin R (2012): Genetics: How intelligence changes with age. Nature 484:165–166. [DOI] [PubMed] [Google Scholar]
- Plomin R, Deary IJ (2015): Genetics and intelligence differences: Five special findings. Mol Psychiatry 20:98–108. [DOI] [PMC free article] [PubMed] [Google Scholar]
- Posthuma D, De Geus EJ, Baaré WF, Hulshoff Pol HE, Kahn RS, Boomsma DI (2002): The association between brain volume and intelligence is of genetic origin. Nat Neurosci 5:83–84. [DOI] [PubMed] [Google Scholar]
- Posthuma D, Beem AL, de Geus EJ, van Baal GC, von Hjelmborg JB, Iachine I, Boomsma DI (2003): Theory and practice in quantitative genetics. Twin Res 6:361–376. [DOI] [PubMed] [Google Scholar]
- Ramsden S, Richardson FM, Josse G, Thomas MS, Ellis C, Shakeshaft C, Seghier ML, Price CJ (2011): Verbal and non‐verbal intelligence changes in the teenage brain. Nature 479:113–116. [DOI] [PMC free article] [PubMed] [Google Scholar]
- Rubinov M, Sporns O (2010): Complex network measures of brain connectivity: Uses and interpretations. Neuroimage 52:1059–1069. [DOI] [PubMed] [Google Scholar]
- Santarnecchi E, Galli G, Polizzotto NR, Rossi A, Rossi S (2014): Efficiency of weak brain connections support general cognitive functioning. Hum Brain Mapp 35:4566–4582. [DOI] [PMC free article] [PubMed] [Google Scholar]
- Schmithorst VJ, Yuan W (2010): White matter development during adolescence as shown by diffusion MRI. Brain Cogn 72:16–25. [DOI] [PubMed] [Google Scholar]
- Schnack HG, van Haren NE, Brouwer RM, Evans A, Durston S, Boomsma DI, Kahn RS, Hulshoff Pol HE (2015): Changes in thickness and surface area of the human cortex and their relationship with intelligence. Cereb Cortex 25:1608–1617. [DOI] [PubMed] [Google Scholar]
- Shaw P, Greenstein D, Lerch J, Clasen L, Lenroot R, Gogtay N, Evans A, Rapoport J, Giedd J (2006): Intellectual ability and cortical development in children and adolescents. Nature 440:676–679. [DOI] [PubMed] [Google Scholar]
- Sherman LE, Rudie JD, Pfeifer JH, Masten CL, McNealy K, Dapretto M (2014): Development of the Default Mode and Central Executive Networks across early adolescence: A longitudinal study. Dev Cogn Neurosci. 10:148–159. [DOI] [PMC free article] [PubMed] [Google Scholar]
- Smyser CD, Inder TE, Shimony JS, Hill JE, Degnan AJ, Snyder AZ, Neil JJ (2010): Longitudinal analysis of neural network development in preterm infants. Cereb Cortex 20:2852–2862. [DOI] [PMC free article] [PubMed] [Google Scholar]
- Song M, Zhou Y, Li J, Liu Y, Tian L, Yu C, Jiang T (2008): Brain spontaneous functional connectivity and intelligence. Neuroimage 41:1168–1176. [DOI] [PubMed] [Google Scholar]
- Stadlbauer A, Ganslandt O, Salomonowitz E, Buchfelder M, Hammen T, Bachmair J, Eberhardt K (2012): Magnetic resonance fiber density mapping of age‐related white matter changes. Eur J Radiol 81:4005 [DOI] [PubMed] [Google Scholar]
- Stein JL, Medland SE, Vasquez AA, Hibar DP, Senstad RE, Winkler AM, Toro R, Appel K, Bartecek R, Bergmann Ø, Bernard M, Brown AA, Cannon DM, Chakravarty MM, Christoforou A, Domin M, Grimm O, Hollinshead M, Holmes AJ, Homuth G, Hottenga JJ, Langan C, Lopez LM, Hansell NK, Hwang KS, Kim S, Laje G, Lee PH, Liu X, Loth E, Lourdusamy A, Mattingsdal M, Mohnke S, Maniega SM, Nho K, Nugent AC, O'Brien C, Papmeyer M, Pütz B, Ramasamy A, Rasmussen J, Rijpkema M, Risacher SL, Roddey JC, Rose EJ, Ryten M, Shen L, Sprooten E, Strengman E, Teumer A, Trabzuni D, Turner J, van Eijk K, van Erp TG, van Tol MJ, Wittfeld K, Wolf C, Woudstra S, Aleman A, Alhusaini S, Almasy L, Binder EB, Brohawn DG, Cantor RM, Carless MA, Corvin A, Czisch M, Curran JE, Davies G, de Almeida MA, Delanty N, Depondt C, Duggirala R, Dyer TD, Erk S, Fagerness J, Fox PT, Freimer NB, Gill M, Göring HH, Hagler DJ, Hoehn D, Holsboer F, Hoogman M, Hosten N, Jahanshad N, Johnson MP, Kasperaviciute D, Kent JW Jr, Kochunov P, Lancaster JL, Lawrie SM, Liewald DC, Mandl R, Matarin M, Mattheisen M, Meisenzahl E, Melle I, Moses EK, Mühleisen TW, Nauck M, Nöthen MM, Olvera RL, Pandolfo M, Pike GB, Puls R, Reinvang I, Rentería ME, Rietschel M, Roffman JL, Royle NA, Rujescu D, Savitz J, Schnack HG, Schnell K, Seiferth N, Smith C, Steen VM, Valdés Hernández MC, Van den Heuvel M, van der Wee NJ, Van Haren NE, Veltman JA, Völzke H, Walker R, Westlye LT, Whelan CD, Agartz I, Boomsma DI, Cavalleri GL, Dale AM, Djurovic S, Drevets WC, Hagoort P, Hall J, Heinz A, Jack CR Jr, Foroud TM, Le Hellard S, Macciardi F, Montgomery GW, Poline JB, Porteous DJ, Sisodiya SM, Starr JM, Sussmann J, Toga AW, Veltman DJ, Walter H, Weiner MW; Alzheimer's Disease Neuroimaging Initiative; EPIGEN Consortium; IMAGEN Consortium; Saguenay Youth Study Group , Bis JC, Ikram MA, Smith AV, Gudnason V, Tzourio C, Vernooij MW, Launer LJ, DeCarli C, Seshadri S; Cohorts for Heart and Aging Research in Genomic Epidemiology Consortium , Andreassen OA, Apostolova LG, Bastin ME, Blangero J, Brunner HG, Buckner RL, Cichon S, Coppola G, de Zubicaray GI, Deary IJ, Donohoe G, de Geus EJ, Espeseth T, Fernández G, Glahn DC, Grabe HJ, Hardy J, Hulshoff Pol HE, Jenkinson M, Kahn RS, McDonald C, McIntosh AM, McMahon FJ, McMahon KL, Meyer‐Lindenberg A, Morris DW, Müller‐Myhsok B, Nichols TE, Ophoff RA, Paus T, Pausova Z, Penninx BW, Potkin SG, Sämann PG, Saykin AJ, Schumann G, Smoller JW, Wardlaw JM, Weale ME, Martin NG, Franke B, Wright MJ, Thompson PM; Enhancing Neuro Imaging Genetics through Meta‐Analysis Consortium (2012): Identification of common variants associated with human hippocampal and intracranial volumes. Nat Genet 44:552–561. [DOI] [PMC free article] [PubMed] [Google Scholar]
- Tang CY, Eaves EL, Ng JC, Carpenter DM, Mai X, Schroeder DH, Condon CA, Colom R, Haier RJ (2010): Brain networks for working memory and factors of intelligence assessed in males and females with fMRI and DTI. Intelligence 38:293–303. [Google Scholar]
- Thompson PM, Cannon TD, Narr KL, van Erp T, Poutanen VP, Huttunen M, Lönnqvist J, Standertskjöld‐Nordenstam CG, Kaprio J, Khaledy M, Dail R, Zoumalan CI, Toga AW (2001): Genetic influences on brain structure. Nat Neurosci 4:1253–1258. [DOI] [PubMed] [Google Scholar]
- Toga AW, Thompson PM, Sowell ER (2006): Mapping brain maturation. Trends Neurosci 29:148–159. [DOI] [PMC free article] [PubMed] [Google Scholar]
- Tzourio‐Mazoyer N, Landeau B, Papathanassiou D, Crivello F, Etard O, Delcroix N, Mazoyer B, Joliot M (2002): Automated anatomical labeling of activations in SPM using a macroscopic anatomical parcellation of the MNI MRI single‐subject brain. Neuroimage 15:273–289. [DOI] [PubMed] [Google Scholar]
- van Beijsterveldt CE, Groen‐Blokhuis M, Hottenga JJ, Franić S, Hudziak JJ, Lamb D, Huppertz C, de Zeeuw E, Nivard M, Schutte N, Swagerman S, Glasner T, van Fulpen M, Brouwer C, Stroet T, Nowotny D, Ehli EA, Davies GE, Scheet P, Orlebeke JF, Kan KJ, Smit D, Dolan CV, Middeldorp CM, de Geus EJ, Bartels M, Boomsma DI. (2013): The Young Netherlands Twin Register (YNTR): Longitudinal twin and family studies in over 70,000 children. Twin Res Hum Genet 16:252–267. [DOI] [PubMed] [Google Scholar]
- van den Heuvel MP, Stam CJ, Kahn RS, Hulshoff Pol HE (2009): Efficiency of functional brain networks and intellectual performance. J Neurosci 29:7619–7624. [DOI] [PMC free article] [PubMed] [Google Scholar]
- van den Heuvel MP, Hulshoff Pol HE (2010): Exploring the brain network: A review on resting‐state fMRI functional connectivity. Eur Neuropsychopharmacol 20:519–534. [DOI] [PubMed] [Google Scholar]
- van den Heuvel MP, Mandl RC, Stam CJ, Kahn RS, Hulshoff Pol HE (2010): Aberrant frontal and temporal complex network structure in schizophrenia: A graph theoretical analysis. J Neurosci 30:15915–15926. [DOI] [PMC free article] [PubMed] [Google Scholar]
- van den Heuvel MP, van Soelen IL, Stam CJ, Kahn RS, Boomsma DI, Hulshoff Pol HE (2013a): Genetic control of functional brain network efficiency in children. Eur Neuropsychopharmacol 23:19–23. [DOI] [PubMed] [Google Scholar]
- van den Heuvel MP, Sporns O, Collin G, Scheewe T, Mandl RC, Cahn W, Goñi J, Hulshoff Pol HE, Kahn RS (2013b): Abnormal rich club organization and functional brain dynamics in schizophrenia. JAMA Psychiatry 70:783–792. [DOI] [PubMed] [Google Scholar]
- van Soelen ILC, Brouwer RM, van Leeuwen M, Kahn RS, Hulshoff Pol HE, Boomsma DI (2011): Heritability of verbal and performance intelligence in a pediatric longitudinal sample. Twin Res Hum Genet 14:119–128. [DOI] [PubMed] [Google Scholar]
- van Soelen ILC, Brouwer RM, van Baal GC, Schnack HG, Peper JS, Collins DL, Evans AC, Kahn RS, Boomsma DI, Hulshoff Pol HE (2012a): Genetic influences on thinning of the cerebral cortex during development. Neuroimage 59:3871–3880. [DOI] [PubMed] [Google Scholar]
- van Soelen ILC, Brouwer RM, Peper JS, van Leeuwen M, Koenis MMG, van Beijsterveldt TC, Swagerman SC, Kahn RS, Hulshoff Pol HE, Boomsma DI (2012b): Brain SCALE: Brain structure and cognition: An adolescent longitudinal twin study into the genetic etiology of individual differences. Twin Res Hum Gen 15:453–467. [DOI] [PubMed] [Google Scholar]
- van Soelen ILC, Brouwer RM, van Baal GC, Schnack HG, Peper JS, Chen L, Kahn RS, Boomsma DI, Hulshoff Pol HE (2013): Heritability of volumetric brain changes and height in children entering puberty. Hum Brain Mapp 34:713–725. [DOI] [PMC free article] [PubMed] [Google Scholar]
- Waber DP, Forbes PW, Almli CR Blood EA, Brain Development Cooperative Group (2012): Four‐year longitudinal performance of a population‐based sample of healthy children on a neuropsychological battery: The NIH MRI study of normal brain development. J Int Neuropsychol Soc 18:179–190. [DOI] [PMC free article] [PubMed] [Google Scholar]
- Wen W, Zhu W, He Y, Kochan NA, Reppermund S, Slavin MJ, Brodaty H, Crawford J, Xia A, Sachdev P (2011): Discrete neuroanatomical networks are associated with specific cognitive abilities in old age. J Neurosci 31:1204–1212. [DOI] [PMC free article] [PubMed] [Google Scholar]
- Wu K, Taki Y, Sato K, Hashizume H, Sassa Y, Takeuchi H, Thyreau B, He Y, Evans AC, Li X, Kawashima R, Fukuda H (2013): Topological organization of functional brain networks in healthy children: differences in relation to age, sex, and intelligence. PLoS One 8:e55347 [DOI] [PMC free article] [PubMed] [Google Scholar]
- Xia M, Wang J, He Y (2013): BrainNet viewer: A network visualization tool for human brain connectomics. Plos One 8:e68910 [DOI] [PMC free article] [PubMed] [Google Scholar]
- Yan C, Gong G, Wang J, Wang D, Liu D, Zhu C, Chen ZJ, Evans A, Zang Y, He Y (2011): Sex‐ and brain size‐related small‐world structural cortical networks in young adults: A DTI tractography study. Cereb Cortex 21:449–458. [DOI] [PubMed] [Google Scholar]
Associated Data
This section collects any data citations, data availability statements, or supplementary materials included in this article.
Supplementary Materials
Supporting Information