

Abstract
An increasing amount of studies apply repetetive transcranial magnetic stimulation (rTMS) to treat chronic tinnitus, yet the neurophysiological impacts have remained largely obscure. Several studies show that endogenous brain rhythms may be enhanced via diverse brain stimulation techniques applying rhythmic stimulation. Here, we investigated in normal hearing participants whether application of rTMS (left auditory cortex) with an individualized alpha frequency was capable of increasing alpha activity in stimulated auditory regions in a sustained manner. Behavioral intensity discrimination performance worsened for the rTMS group as compared to Sham. Electroencephalography (EEG) data, however, clearly show that this functional inhibition is not accompanied by increases of auditory cortical alpha. Even though more pronounced power reductions for the rTMS group were observed at slower frequencies (delta to theta range) at stimulated and other sites of the left hemisphere, they were unrelated to behavioral changes. Our results also strongly suggest that the amount of power modulations at these slower frequencies is strongly dependent on pre‐rTMS power, thus supporting current state‐dependency notions. Strong relationships to behavioral changes were in particular observed for anterior cingulate cortex (ACC) beta power and posterior cingulate cortex (PCC) beta connectivity. Moreover, these beta band measures were strongly inter‐related and when viewed together specifically sensitive to behavioral changes in the rTMS group. We conclude that currently alpha frequency rTMS is not a promising avenue for the treatment of chronic tinnitus and that beneficial effects could be mediated via nonauditory systems. Our study argues for the value of combined EEG‐TMS studies when investigating the impacts of rTMS. Hum Brain Mapp 35:14–29, 2014. © 2012 Wiley Periodicals, Inc.
Keywords: EEG, entrainment, beamforming, node degree, state‐dependency
INTRODUCTION
Tinnitus is a widespread audiological symptom affecting ∼10% of the general population [Eggermont and Roberts, 2004]. It can be characterized by the continuous conscious percept of a sound (e.g., pure tone or narrow band noise) without an objectively identifiable sound source and can have severely debilitating effects on everyday life. Despite the absence of an exact understanding of the neurophysiological processes, most neuroscientists agree that in most cases the sensation is related to altered features of ongoing brain activity that have been triggered by a hearing damage, usually a cochlear lesion [Weisz et al., 2006]. Following experimental treatments putatively inducing tinnitus sensations in animals, several studies have indeed disclosed drastic changes in spontaneous activity in multiple auditory brain regions such as the primary and secondary auditory cortex [e.g., Noreña and Eggermont, 2003], the dorsal cochlear nucleus [Kaltenbach et al., 2004], or the inferior colliculus [Basta and Ernst, 2004]. The majority of these studies employ firing rate as critical dependent variable; however, some studies have also added evidence for synchronized firing [e.g., Noreña and Eggermont, 2003]. In most neuroscientific frameworks, the main underlying mechanism for the changes in spontaneous activity is assumed to be an excitatory–inhibitory imbalance in circumscribed auditory regions [for a review see Eggermont and Roberts, 2004]. Neuroscientifically based interventions normally aim at reestablishing normal patterns of ongoing brain activity, e.g., by sound‐based therapies [Okamoto et al., 2010], neurofeedback [Dohrmann et al., 2007], or by invasive or noninvasive brain stimulation techniques [De Ridder et al., 2008; Langguth et al., 2007]. However, so far most studies are usually capable of only reporting moderate overall levels of symptom reduction that is sometimes overshadowed by an extreme interindividual variability to respond to the therapeutic interventions [for reviews see Langguth et al., 2008; Plewnia, 2010]. It is thus likely that tinnitus is either a far more complex phenomenon than currently assumed by neuroscientists [for a review see Eggermont and Roberts, 2004] or that current clinical measures are not sufficiently reliable (on a single patient basis) in interfering with tinnitus‐relevant neuronal processes.
Based on our own work [Weisz et al., 2011; Weisz et al., 2007a] and current notions on alpha activity in cognitive neuroscience [see Jensen and Mazaheri, 2010], we assume that in humans and at a macroscopic level one relevant process contributing to tinnitus may be a reduction of ongoing alpha activity in auditory cortex. In general, based on multiple strands of evidence, the old notion of alpha activity constituting an “idling rhythm” [e.g., Pfurtscheller et al., 1996] is giving way for the notion that it represents the excitatory–inhibitory balance at least in sensory and motor brain regions: reduced levels of alpha activity appear to represent “excitatory” states, whereas high levels may constitute “inhibited” states of the respective cortical regions [see Weisz, 2007b for a review on alpha in audition]. For example, spatial attention in the visual [Thut et al., 2006; Worden et al., 2000], the somatosensory [Bauer et al., 2006] and the auditory [Müller and Weisz, 2012] modality appear to modulate pretarget alpha activity in a spatially very selective manner. Furthermore, pre‐TMS alpha have been shown to be strongly inversely correlated with relevant behavioral outputs such as Motor Evoked Potentials [Sauseng et al., 2009] or the perception of phosphenes [Romei et al., 2007]. Recently in an exciting study, Haegens et al. 2011 were capable of directly demonstrating the relationship between alpha power as well as phase in somatosensory, motor, and premotor regions of a monkey and firing rate. In previous works, we were able to show significant reductions of alpha activity in putatively auditory cortical regions of chronic tinnitus patients [Weisz et al., 2005] and also gave first evidence that by normalizing ongoing spontaneous activity via neurofeedback significantly reduces tinnitus symptoms [Dohrmann et al., 2007; Weisz, 2007b].
From a clinical point of view, the selective as well as sustained enhancement of alpha power in affected auditory cortical regions thus appears to be a promising pathway to pursue in finding effective treatments for tinnitus. This leaves us however with the practical problem how this can be reliably achieved. One promising possibility that needs to be further developed is electroencephalography/magnetoencephalography (EEG/MEG) neurofeedback using a high spatial coverage of electrodes/sensors [see Hartmann et al., 2011; Weisz, 2007b]. By applying advanced inverse methods, alpha activity can be fed back to the patient with an improved spatial specificity. However several pragmatic arguments make neurofeedback an unfavorable option in practice, e.g., the application of a high amount of electrodes, the treatment of online recorded artifacts as well as the difficulty of the task itself. Using repetetive transcranial magnetic stimulation (rTMS) applied to the auditory cortex [for an example, application of rTMS in tinnitus to nonauditory areas see Kleinjung et al., 2008] constitutes an alternative. The large majority of previous studies mainly used the low frequency (1 Hz) variant and has shown that this method is indeed capable of inducing statistically significant reductions of tinnitus symptoms [see Plewnia, 2010 for an overview]. Reductions of tinnitus symptoms (operationalized differently across different studies) show a strong study‐to‐study variability ranging between 8 and 50% (∼20% on average; figures taken from the recent review by Plewnia, 2010). Overall, from a clinical viewpoint the effects are moderate at best [see Langguth et al., 2008], complex (e.g., showing usually an inverse relationship with tinnitus duration), and in particular it is hardly known how rTMS applied to the auditory cortex affects brain activity. Recently, cognitive neuroscientific studies have demonstrated that application of electric or magnetic stimulation in a rhythmic manner at distinct frequencies is capable of inducing behavioral effects conform with current notions on the functional relevance of naturally occurring rhythms [e.g., Thut and Miniussi, 2009]. A well known study in this context using time‐varied transcranial direct current stimulation (tDCS) was performed by Marshall et al. 2006 showing that application of anodal slow oscillation stimulation (0.75 Hz) during slow wave sleep significantly increases declarative memories. This study suggests that an external force may be used to entrain an endogenous oscillator thereby enhancing its effect a notion that finds direct support in a study by Ozen et al. 2010. The authors were able to demonstrate that transcranial electrical stimulation (TES) applied at slow frequencies entrains neuronal activity in wide‐spread cortical regions of mice being most potent during sleep. Unfortunately, for alpha frequency stimulation we are not aware of equivalent invasive works, nevertheless sensory entrainment [e.g., Mathewson et al., 2010] as well as entrainment via brain stimulation sometimes combined with EEG are highly suggestive that alpha entrainment is possible in the visual modality [e.g., Thut et al., 2011]. However, in these studies effects are short‐lived and bound to the period of stimulation [e.g., Thut et al., 2011; see however Zaehle et al., 2010 using transcranial alternating current stimulation (tACS)]. Also, it has to be remarked that the great majority of alpha entrainment works have been conducted in the visual system also generally using very brief pulse sequences which cannot be directly compared to the paradigms usually employed in clinical settings. Furthermore, more conventional use of alpha (“high frequency”) rTMS in the motor system [Pascual‐Leone et al., 1994] shows sustained decreases of motor evoked potentials (MEPs), which is indicative of an increase of excitability. Naturally, the latter finding does not fit with the assumption that alpha rTMS would be associated with sustained increases of alpha activity. To summarize, the findings with regards to alpha rTMS paradigms is mixed (e.g., depending on the approach), however with some existing evidence that its application may indeed increase alpha activity transiently, even though data supporting sustained increases is missing [see however Veniero et al., 2011 for application of 1, 5, and 20 Hz rTMS to the motor system]. Even though far less common than the low frequency variant, some reports exist describing the results of alpha rTMS in tinnitus. A single session study by Plewnia et al. 2010 showed transient symptom reductions, whereas the only study applying alpha rTMS repeatedly (10 sessions) by Khedr et al. 2008 could even show reductions after several months. However, especially the latter study showed that there was no selective advantage of alpha frequency rTMS over other stimulation forms. This opens up the questions: Whether the classical division in excitatory and inhibitory stimulation forms is a valid one with regards to tinnitus and whether clinical improvements using rTMS are achieved via nonspecific (i.e., stimulation independent) effects on auditory cortical activity or alternatively via unknown influences on nonauditory areas. Less than its efficacy in treating tinnitus in its current form, for the current work it is of greater importance to understand how the application of alpha rTMS modifies auditory cortical activity, which is crucial in estimating its potential use in a clinical setting.
The latter mentioned point was exactly the motivation of the current work. In this study, we concretely seek to investigate the effects of rTMS with an individualized alpha frequency (IAF) in modulating electrophysiological brain activity as well as behavior. We are able to show that while worsening of behavioral performance was evident following IAF rTMS (i.e., suggestive of a functional inhibition), this effect is unlikely mediated directly via auditory cortical activational changes.
MATERIAL AND METHODS
Participants
The experiment was completed by 30 healthy participants (age: M = 27.66 years, SE = 1.95; 20 females) recruited mainly via flyers posted at the University of Konstanz. They were assigned pseudorandomly into two experimental groups rTMS and Sham according to an ABAB‐design (see below). Before the experiment, all participants were screened in detail for factors excluding a participation in the experiment (e.g., metallic implants, history of epilepsy, or other neurological/psychiatric disorder, pregnancy, etc). Participants reporting tinnitus were also not included into this study. After introducing the participant to the laboratory and explaining in detail the procedures of the experiment, written informed consent was given by the participant. The procedures were approved by the Ethical Committee of the University of Konstanz. For their participation in the ∼2 h experiment the participant received 20 荤.
Procedure and Behavioral Task
All experimental data were collected at the EEG/TMS laboratory of the Clinical Psychology group of the University of Konstanz. Each experimental session was divided into three phases, one before the experimental intervention (pre‐TMS in Fig. 1), one after the experimental intervention (post‐TMS in Fig. 1), and the experimental intervention itself (either rTMS or Sham; see below). The sequence within the pre‐ and post‐TMS phase was kept identical, starting with a resting EEG measurement of 5 min duration. During this period, participants were instructed to relax while keeping their eyes open. This measurement was followed by an intensity discrimination task, in which two sounds were presented subsequently and the task of the participant was to decide which of the presented tones was louder. On each trial, tones were presented monoaurally (separated by blocks counterbalanced over participants) consisting of a reference tone (50 ms, 1,000 Hz) and another tone that differed in intensity between 0 and 10 dB (in 1 dB steps). Tones were separated by 500 ms and the sequence of intensities was randomized. Each intensity difference was repeated 10 times, resulting in overall 110 trials per ear. Before the task the reference tone was matched for each ear separately to be 40 dB above sensation level using in‐house software (http://pytunesounds.sf.net). While participants performed the psychoacoustical task in the pre‐TMS phase, the investigators ran prewritten Matlab scripts to derive the IAF in a region of interest (ROI) of each participant (see below for details). This IAF was then used to adjust the stimulation frequency in the phase of the experimental intervention (see next section).
Figure 1.
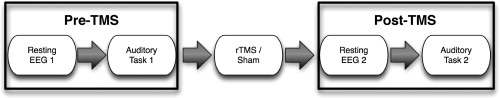
Depiction of experimental phases. Before the experimental intervention (rTMS/Sham) resting EEG and behavioural performance data (intensity discrimination tasks) were assessed. During the experimental intervention, stimulation frequency was individually adapted to the IAF derived from the first resting EEG recording.
rTMS and Sham Stimulation
Pulses of biphasic TMS were delivered via a 70‐mm figure‐of‐eight coil (Magstim Air Film Coil) using a Magstim Rapid2 device. The position of the coil was determined using a recognized “rule‐of‐thumb” published by Langguth et al. 2006: According to this procedure, the approximate location of the left auditory cortex (validated by Langguth et al. using neuronavigation) is determined using the international 10–20 system. First, a point 2.5 cm above T3 on a line connecting C3 and Cz is determined and finally shifted 1.5 cm posterior to this line. During real rTMS, the handle is pointing upwards approximately 90° to the Sylvian fissure. We chose this procedure due to its common application in the tinnitus literature. For the Sham condition, the exactly identical procedure was chosen with the exception that the coil was tilted by 45°. During the experimental intervention, we applied 20 × 50 biphasic TMS pulses at 50% of the maximum stimulator output. Each pulse sequence was separated by a 25 s pause. Within each pulse sequence the stimulation frequency was adjusted according to the IAF (9.6 and 9.63 Hz on average in the Sham and rTMS group respectively; see also next section).
EEG Recording and Data Analysis
EEG activity was continuously recorded from 128 electrodes sampled at 2,048 Hz (Advanced Neuro Technology, ANT, Enschede, Netherlands). Analysis of rTMS/Sham induced effects was performed separately for the resting EEG period as well as for the rTMS/Sham stimulation phase. Even though evidence exists for a role of high frequency (gamma; >30 Hz) activity in tinnitus [e.g., Ashton et al., 2007; Van der Loo et al, 2011; Weisz et al., 2007b], our extensive analysis focused on lower frequencies due to our assumption that in particular alpha activity most validly reflects the current excitatory–inhibitory state within auditory cortical regions (see Introduction).
rTMS/Sham phase
Epochs were cut in a time window from 3 s pre‐ to 15 s poststimulation onset. Preprocessing was performed in multiple steps, starting with the removal of the dominant direct TMS artifacts (see evoked potential in Supporting Information Fig. 1B, left panel). For this purpose, TMS artifacts were automatically detected and a period starting 5 ms pre to 15 ms post the respective TMS peak was replaced by Gaussian noise with the standard deviation and mean adapted to correspond to a reference period set to be −35 to −10 ms before the respective TMS peak. Following this step, the data was downsampled to 300 Hz meaning that the replaced period consisted of ∼6 instead of the original ∼41 sampling points. This procedure effectively removes the direct (nonphysiological) TMS artifact without introducing strong discontinuities, important for the later time–frequency analysis [see, Thut et al., 2011]. Nevertheless, this measure still left pronounced TMS‐locked artifacts at electrodes directly in contact with the TMS coil. These residual artifacts were effectively removed using ICA (see e.g. evoked potential in Supporting Information Fig. 1B, right panel). For this purpose as well as for the removal of artifacts of other origin—in particular eye movements/blinks—we first ran a course artifact rejection removing, e.g., dead channels, channel jumps, etc. and subsequently filtered the data 1–30 Hz before computing an ICA on the remaining data. Using time‐course and topographic information, components representing clear ocular or TMS‐related artifacts were identified and removed from the raw data. In a last preprocessing step, residual artifactual trials were removed by visual inspection. The cleaned data were used to calculate the (a) evoked potential and (b) the induced and evoked time–frequency responses. For the latter purpose, spectra were calculated for short sliding Hanning tapered time‐windows in a period ranging from −2 s pre‐ to 10 s post‐stimulation onset in steps of 10 ms either on the single trials (for the induced responses) or on the event‐related potential (ERP) (for the evoked responses). The time‐windows were set to a length corresponding to five cycles of the respective frequency of interest (5–10 Hz in 0.5 Hz steps). Subsequently, baseline correction was performed by first subtracting the average power in a −1.5 s to −0.5 s reference window and then dividing by the average baseline power, thus yielding relative changes (with zero indicating no change with respect to baseline). Since an IAF was defined for each participant, the stimulation onset to offset period varied interindividually. Because a focus of this analysis was on the period ultimately following the stimulation offset, ERPs and time–frequency responses were aligned to the stimulation offset (−4 to 2.85 s, with zero representing the stimulation offset). Time–frequency responses were furthermore interindividually aligned to the IAF.
Resting state EEG
The continuous resting state EEG data was cut into 150 periods of 2 s nonoverlapping epochs separately for the first and second block (see Fig. 1). These epochs were first detrended and then downsampled to 500 Hz. Similar to the analysis procedure detailed in the previous section a first coarse artifact rejection was performed before computation of ICA. For the ICA, 100 trials were randomly chosen from the pooled block 1 and block 2 data to reduce the computation time. From this analysis step, we identified components capturing ocular as well as clear muscular artifacts. The component weights were subsequently applied to the entire data set and artifactual components were removed. In a last preprocessing step, residual artifactual trials were removed by visual inspection. The cleaned data epochs were then Hanning tapered and electrode level cross spectral density (CSD) spectra were calculated in a 2–30 Hz range (in steps of 0.5 Hz). In a first step, this analysis allowed us to derive the sensor power spectra. More importantly, however, the outcome of the analysis formed the basis of our source level calculation of power as well as phase synchrony: A standard (BEM) headmodel and electrode positions (provided by ANT) were used to define a dipole grid (separated by 10 mm) covering the entire brain space. For each grid point, we calculated the respective leadfields and then using an lcmv‐beamformer on the 2–30 Hz filtered data [van Veen et al., 1997] the respective beamformer filters. These beamformer filters were then used to project the electrode CSD spectra into source space. By this means we were able to derive the power spectra at each grid point. Furthermore, the source space CSD was used to derive phase synchronization measures between all source combinations in a computationally very efficient manner. The connectivity matrix was subsequently thresholded using P < 0.01 derived from Rayleigh statistics to obtain a binary adjacency matrix. Via this step, we finally calculated the node degree of each source and frequency point, which constitutes a graph theoretical measure [Bullmore and Sporns, 2009] consisting of the sum of all connections of one node in the network. This analysis was performed to investigate whether apart from power modulations, IAF rTMS influences the level of connectedness of brain regions in a specific manner. If not indicated otherwise, power spectra were realigned to the IAF. For visualization and labeling of brain regions, source level data in circumscribed frequency bands were interpolated onto a standard MNI brain.
Determination of IAF
To adapt the rTMS frequency individually, the IAF in left auditory cortex was calculated in each participant before the stimulation phase of the experiment (in practice this was done while participants performed the intensity discrimination task in block 1). For this purpose, we used the first resting state data recording and segmented it into 2 s nonoverlapping epochs. After 2–25 Hz filtering, the data were downsampled to 200 Hz and artifactual trials were removed via visual inspection. EEG data were subsequently projected to source space using following procedure: For two grid points seeded into left and right auditory cortex using coordinates of a previous study [Lorenz et al., 2010], we calculated the respective leadfields. Thereafter, the covariance matrix was determined for the data filtered between 5 and 15 Hz. Via this means, we determined lcmv beamformer filters for the two regions of interest and reconstructed the single trial activity on a source level. Source power spectra were then computed after application of a Hanning taper to the epochs. In all participants, this yielded clear peaks in the alpha band and we chose the peak of the left (stimulated) auditory cortex in case it deviated between the two regions of interest.
Statistical Analysis
With regards to behavioral data, we first fitted individual psychometric curves using psignifit 2.5.6 (http://bootstrap-software.org/psignifit/), a Matab‐based toolbox in which the maximum‐likelihood method of Wichman [Wichmann, 2001] is implemented. This procedure yielded the 75% intensity discrimination threshold for each ear and block. Since we were only interested in changes following the experimental intervention the threshold values of block 1 was subtracted from the block 2 values (positive values thereby indicating a worsening of thresholds). These values were then entered into a 2 × 2 mixed ANOVA, with a within‐group factor Ear and a between‐group factor Group.
Similarly to the behavioral data, we analyzed resting EEG changes from block 1 to block 2, however with the addition of dividing by block 1 values (i.e., [block 2 − block 1]/block 1). Sensor and source power/degree spectra were then contrasted between rTMS and Sham using an independent sample t‐test. Effects were evaluated on two levels: In a statistically more rigorous approach we applied a nonparametric cluster permutation test as described by Maris and Oostenveld 2007. In brief, this approach uses a defined threshold (here P < 0.05) to define coherent—in our case—spatio‐spectral clusters in which the respective statistical metric is summed up (T sum). Thereafter, the procedure is repeated several times (here 1,000) on shuffled data and on each permutation the maximal T sum is stored, yielding a distribution of T sum under the null hypothesis that the conditions do not differ. By comparing the empirically observed T sum with this distribution a probability can be attributed to each 2D‐cluster. A cluster with P < 0.05 was considered to be significant and will be later on discussed as “robust” effects. This approach was however complemented by a more explorative one, e.g., by specifically investigating patterns of changes at the IAF for which modulations could not be uncovered using the rigorous statistical approach outlined above. to make the explorative nature clear to the reader and facilitating potential reports of these effects in case of replications, we will always refer to these effects as “uncorrected.” Since differences in brain activity changes between conditions may not be implicated in those underlying the behaviorally observed changes, we also calculated Pearson correlations (r) between brain activity and behavioral modulations. An identical two‐step approach to the statistically observed effects was chosen as in the case of the group comparison.
All aspects concerning offline EEG signal as well as statistical analysis were performed using Fieldtrip [Oostenveld et al., 2011; http://fieldtrip.fcdonders.nl/] as well as custom‐made Matlab functions. Behavioral data were analyzed using R (http://www.r-project.org/).
RESULTS
In this part of the manuscript, we first intend to disclose any possible behavioral effects of IAF rTMS. Following this we will present a very detailed description of the effects on EEG activity, first in a time‐period prior and ultimately after stimulation offset and thereafter more sustained modulations in resting EEG activity.
Behavioral Effects
On average across both groups, threshold changes from block 1 to block 2 were small (M = 0.21, SE = 0.16). The mixed ANOVA; however, revealed a marginally significant Group main effect (F 1,28 = 4.02, P = 0.05), indicating a difference between both treatments. This effect was driven by the rTMS group who exhibited stronger increases in threshold following the stimulation phase as compared to the Sham group, in which thresholds remained almost unchanged. The effect is depicted in Figure 2. From this Figure and confirmed by absent Ear main and Ear × Group interaction effects (F's < 1, P's > 0.33) it can be taken that the threshold changes were not specific to the ear contralateral to the rTMS intervention. On a behavioral level, we are thus able to report a small, yet statistically significant, worsening in intensity discrimination performance following real IAF rTMS, i.e., in a sense an effect that could be described as “functional inhibition.” In the following, we will address the issue which macroscopic neurophysiological changes accompany these behavioral changes.
Figure 2.
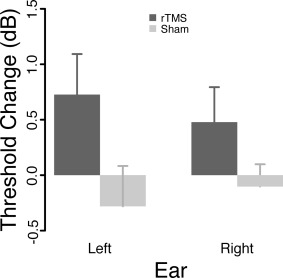
Group averaged changes of intensity discrimination thresholds. In contrast to Sham, real IAF rTMS was followed by a small but significant worsening of thresholds. This effect was however ear‐unspecific.
IAF‐rTMS Entrainment Effects
Even though the main interest of the study concerned the question whether IAF rTMS is followed by sustained alpha modulations in the auditory cortex, we also investigated the presence of transient increases during and directly following the rTMS pulse. Naturally, TMS injected artifacts on the order of several magnitudes larger than normal EEG activity, necessitating special signal processing steps. As outlined in detail above and exemplified in a single participant in Supporting Information Figure 1 a combination of noise replacement of the direct TMS artifact and ICA removal of muscular activity was able to remove the largest part of the artifactual data (note e.g., the clear auditory evoked response to the stimulation onset in Supporting Information Fig. 1B, right panel). The time–frequency analyses shown in Supporting Information Figure 1A indicates that whereas strong increases around the IAF was observable in close proximity to the stimulation during rTMS, increases at frontocentral sites were particularly pronounced following stimulation offset.
This induced activity pattern described for a single participant was very consistent across participants. The direct comparison of the treatment groups is depicted in Figure 3, indicating that any presence of IAF effects was not different across both groups (see middle panel, Fig. 3A). The only pronounced effect (P uncorrected < 0.05) was a relative increase of power for the rTMS group ranging from ∼0 to 3 Hz above the IAF could be seen in a time‐window 1–1.5 s following stimulation offset. The topography of the effect has a frontocentral maximum, very suggestive of an auditory cortical generator (for a comparison, see the N1 topographies in the left and right panel of Fig. 3B). Even though the N1 appeared to be somewhat larger for the rTMS group, it is important to note that the reported relative alpha increases do not overlap with any noticeable evoked responses (see middle panel, Fig. 3B). Furthermore, at a closer look it appears that the effect is not driven by a clear increase (“entrainment”) of alpha activity following IAF rTMS: whereas relative to baseline real rTMS stimulation lead to unsystematic effects with no change on average, on a single participant level consistent decrease of alpha power followed Sham stimulation (Fig. 3A, right panel). A very similar pattern can also be observed when looking at the evoked time–frequency data (Fig. 3C), with a relative increase (P uncorrected < 0.05) only observed after stimulation offset, however at a slightly earlier latency than for the induced data (∼0.6–0.8). Again however, this effect is not caused by genuine increases of power in the IAF rTMS group, but rather by a power decrease in the Sham group. Overall, it can be stated from our results that relative to Sham stimulation, IAF rTMS does not produce any genuine signs of alpha entrainment, neither during nor ultimately following stimulation (see also Supporting Information Fig. 2). Poststimulation effects appear to be driven by rTMS interfering with neurophysiological processes that would emerge by the presence of the acoustic stimulus emitted by the TMS coil in isolation.
Figure 3.
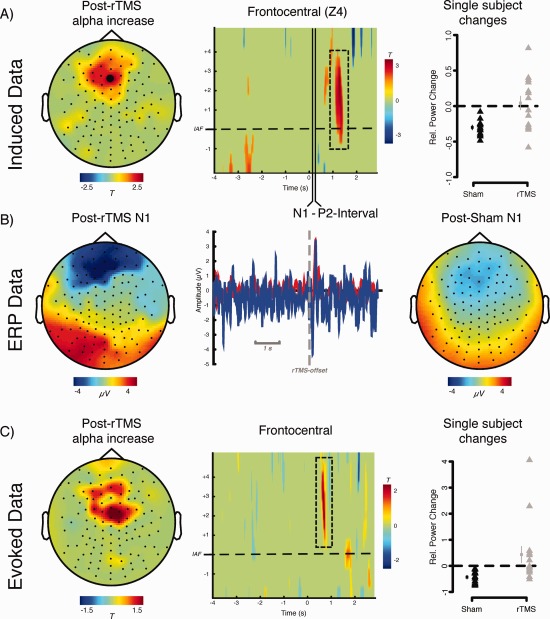
Depiction of group effects during and following rTMS/Sham application. Note that due to interindividually different IAFs the time axis was realigned in all participants that 0 marks the offset of the stimulation. In the time–frequency representation the y‐axis was furthermore realigned according to the IAF. A: Contrasting induced time‐frequency data between rTMS with Sham shows no pronounced differences (P < 0.05) during the stimulation period. Only following the offset of the stimulus with ∼1–1.5 s delay a relative increase of alpha power (0–4 Hz above IAF) can be seen which is pronounced at frontocentral sites. The right panel shows single subject data for this period, indicating that the effect is driven by a reliable decrease of alpha power in the sham condition (small symbols to the left of individual data represent group average ± SE). In contrast, the effects in the rTMS condition are characterized by a strong interindividual variability. B: Depiction of evoked potential activity following stimulation offset (middle panel) for the identical frontocentral electrode (LA4) along with topographies of a latency window of the N1. C: Comparison if evoked time–frequency data suggest no difference at IAF between the groups during the stimulation period. A relative increase, reminiscent of the induced effect in terms of frequency and topography was observed ∼0.6–0.8 s following stimulation offset. Again single subject data (right panel) indicates that this effect is mainly driven by consistent power decreases observed in the Sham group. [Color figure can be viewed in the online issue, which is available at http://wileyonlinelibrary.com.]
Sensor Power Spectra
Both stimulation forms—Sham as well as IAF rTMS lead to significant reductions of power, as expressed in significant negative clusters (Sham: P = 0.001; IAF: P = 0). As can be seen in Figure 4B, depicting the proportion of electrodes involved in the respective negative cluster, the effect was particularly pronounced at frequencies below the IAF (corresponding approximately to frequencies in the delta to theta range). On a descriptive level (see Fig. 4A,B) more electrodes appear to exhibit a power reduction following IAF as compared to Sham, however this was not sufficient to produce a significant difference between the groups on a cluster statistical level. No specific effect at the IAF was observed when comparing for multiple comparisons. An uncorrected exploration of the data at IAF resulted in a circumscribed relative increase for the IAF group compared to the Sham group with a maximum at right central electrodes (see Fig. 4C). However, similar to the poststimulation effect described above this effect appears to be to a lesser degree driven by a genuine increase of alpha power after IAF rTMS, rather than by a pronounced global decrease of power after Sham. Similar to this experimental condition, power at frequencies below and above the IAF appear to be reduced following IAF rTMS, leaving frequencies at the IAF spared however. To summarize this part, on an electrode level we find no evidence for specific alpha increases following IAF rTMS even when data are explored in a very liberal sense.
Figure 4.
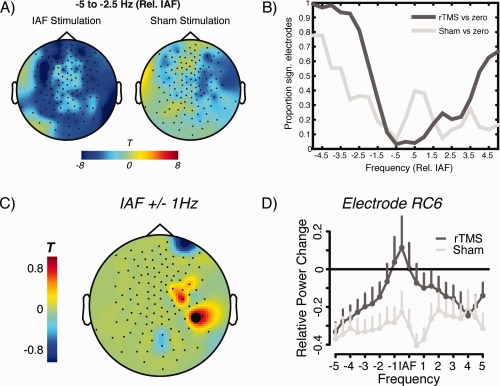
Depiction of group level electrode effects for resting EEG recordings. Results are shown relative to individual IAF. A: Broad power reductions observed for both conditions (tested against zero change) in particular at frequencies below IAF (corresponding to theta and delta frequencies) after intervention. The effect appears more distributed confirmed by (B) the proportion of significant electrodes for frequencies ±5 Hz relative to IAF. However, a direct statistical comparison between the conditions yields no significant effect on a cluster‐corrected level. C: On an uncorrected (explorative) level, a circumscribed relative increase was observed for the IAF rTMS condition at right central electrodes. D: Spectra of power changes for electrode marked in black in (C), showing global decreases of power after Sham intervention. The IAF range is spared after IAF rTMS, however this intervention did not induce genuine alpha increases. [Color figure can be viewed in the online issue, which is available at http://wileyonlinelibrary.com.]
Source Power Spectra Results
Additionally to the electrode level analysis, source level data were calculated by means of beamformer filters (see Methods). This data analysis step largely confirms the overall impressions described previously, with the notable exception however that the direct condition contrast also yields a significant result following cluster correction (P < 0.05). Interestingly, the differences involved in this effect were solely confined to the left (i.e., stimulated hemisphere) and can be described by a greater relative power reduction at frequencies in particular ∼2.5–5 Hz below the IAF (i.e., corresponding to delta to theta frequencies). Frequencies between approximately −1 and 3 Hz around the IAF appear to be spared from this effect. In terms of brain regions this relative reduction involves a distributed set of locations in the left hemisphere, the main ones being the auditory cortex, precentral regions, medial temporal gyrus (MTG), and cuneus (see Fig. 5, I–IV). Inspection of changes of source power spectra (see Fig. 5, I–IV) indicate that while both conditions exhibit a reduction of power particularly at lower frequencies, this effect is more pronounced following real IAF rTMS.
Figure 5.
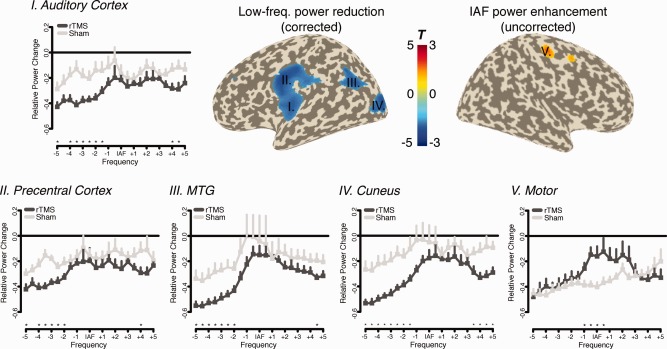
Cluster level effect on source power spectra data. Power reductions (depicted −2.5 to −4 Hz relative to IAF) were confined to the left hemisphere, in particular the (i) auditory cortex, (ii) precentral cortex, (iii) MTG, and (iv) cuneus. In an uncorrected manner a relative increase was observed in (v) right motor cortex. [Color figure can be viewed in the online issue, which is available at http://wileyonlinelibrary.com.]
Genuine increases of alpha power following IAF rTMS could not be revealed by means of cluster correction. An uncorrected view of the data specifically at the IAF indicates relative power increases for the IAF rTMS group in right motor and premotor regions (see Fig. 5, V). This result fits well to the topographic pattern from the electrode level data (see Fig. 4C). Similar to the former analysis on the surface level, however, the source power spectra indicate that the effect is driven by a global power decrease after intervention from which frequencies around the IAF are spared in the true rTMS condition.
All aforementioned analyses point to the fact that IAF rTMS does not lead to increases of alpha activity, making this process an unlikely candidate for the (weakly) impaired performance of the IAF rTMS group. To follow‐up this issue more systematically, behavioral changes were correlated with source power changes. This analysis, when calculated over both groups, shows a strong and negative correlation between power changes in the anterior cingulate cortex (ACC) ∼2–5 Hz (corresponding approximately to beta activity) above the IAF and threshold changes (cluster‐corrected P < 0.03; see Fig. 6A). Figure 6B depicts the scatterplots for this region, showing increasing discrimination thresholds (i.e., worsening of performance) to be associated with decreasing ACC beta power. This correlation is significant for the IAF rTMS (r = −0.75, P = 0.001) and marginally significant for the Sham group (r = −0.52, P = 0.06), being descriptively stronger in the former group. However, the correlation coefficient did not differ between these two groups (z = −95, P = 0.34). On average, both groups exhibited pronounced ACC decreases (see Fig. 6C) on average, with a weak trend (t 27 = −1.66, P = 0.10) for stronger decreases following IAF rTMS intervention. Also an F‐test to compare the variances between both groups indicated a trend for unequal variances (F 13,14 = 2.78, P = 0.07), reflecting the greater variability in the Sham group (see also Fig. 6B). Importantly, no associations between changes of power in auditory cortex and behavioral changes were noted even following a liberal uncorrected test.
Figure 6.
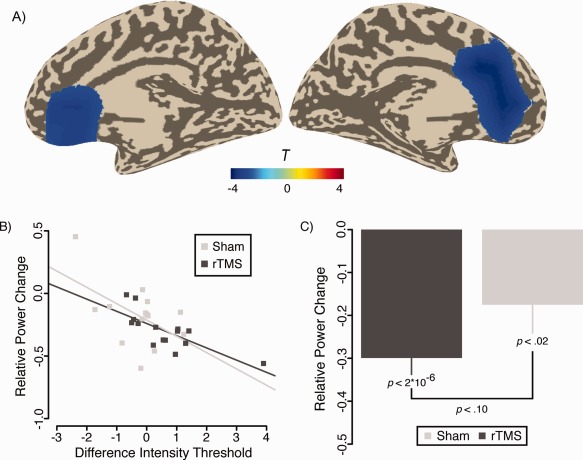
Depiction of association of power changes on source level with changes of behavioral thresholds. A: A highly significant negative correlation was found bilaterally for ACC beta band power. B: Scatterplot for power changes in this region and changes in intensity discrimination thresholds. C: Besides greater variability of beta power reductions in the Sham group (see text), a trend was found for greater decreases in the IAF rTMS group. [Color figure can be viewed in the online issue, which is available at http://wileyonlinelibrary.com.]
Source Connectivity Results
Besides of investigating power changes on a source level, the derivation of source level CSD matrices also allowed us to analyze changes of functional connectivity to assess whether our intervention affected the level of connectedness (node degree) of distributed brain regions. As a connectivity measure, we chose phase synchronization (see Methods) and thresholded the data using a P < 0.01 to derive the adjacency matrix. Statistical analysis using cluster correction did not reveal any significant differences between the groups. On an uncorrected level, relative focal decreases of node degree were found in left temporopolar regions at the IAF for the IAF rTMS group as compared to the Sham group (data not shown). Importantly however, neither examination revealed any auditory cortical effects meaning that on a level of absolute amount of connectedness of the stimulated auditory cortex, IAF rTMS and Sham did not show any differential effects.
Also, when correlating changes in node degree with behavioral changes no effect at the cluster level became significant. An uncorrected inspection of the data exhibited a positive correlation between posterior cingulate cortex (PCC) node degree in the beta frequency range (∼20–25 Hz) and changes of intensity discrimination thresholds. The correlation for this region over both groups was r = 0.58 (P = 0.0009; see Fig. 7A). Viewing the groups separately, a highly significant association was observed for the Sham group (r = 0.71, P = 0.004), whereas a trend was observed for the IAF rTMS group (r = 0.49, P = 0.06). The difference between the correlation coefficients was statistically not significant however (z = 0.84, P = 0.40). This uncorrected result is partly also reported, since a very strong correlation between node degree changes in PCC and beta power reductions in ACC could be observed (over both groups: r = −0.54, P = 0.002; difference between group n.s.): Weaker ACC beta power reductions were associated with less pronounced decouplings of the PCC (see Fig. 7B). Since both, beta power or node degree changes in ACC and PCC, respectively, appeared to be related to changes in behavioral performance, we also decided to calculate this association using a compound measure of both neurophysiological changes. For this purpose we used Pythagoras' theorem to calculate the vector length formed by PCC node degree changes and ACC power changes and correlated this with changes in intensity discrimination threshold. Deviating from the previous analyses, the overall correlation, i.e., when considering both groups together, became nonsignificant (r = 0.25, P = 0.18; see Fig. 7C). This was due to a differential pattern for both groups: while the association was not significant for the Sham group (r = −0.28, P = 0.34), it was highly significant for the IAF rTMS group (r = 0.74, P = 0.002). The differences of correlation coefficients was highly significant (z = 2.97, P = 0.003). The result indicates that while in the Sham group ACC and PCC beta band dynamics exert independent influences on behavioral outcome, in the IAF rTMS group the impacts on behavior are highly linked.
Figure 7.

A: Relative increases of beta band node degree in PCC correlated strongly with increases of threshold following intervention. B: PCC connectivity effects were strongly negatively associated with ACC power effects. C: Compound measure summarizing PCC and ACC effects via Pythagoras' theorem, indicates a highly significant association for the IAF rTMS group only. [Color figure can be viewed in the online issue, which is available at http://wileyonlinelibrary.com.]
State‐Dependency Effects
As a final analysis step, we investigated specifically for the stimulated auditory cortex whether changes in power following intervention were related to preintervention source power at the respective frequency. Differences between the correlation coefficients served to test whether these associations were specific to a condition, rather than an unspecific effect. Two participants (one per group) were excluded due to very high preintervention power levels. While this did not influence effects at sub‐IAF frequencies, maintaining these extreme values highly influenced the pattern of differences at supra‐IAF frequencies.
While an association between postintervention changes and preintervention auditory source power can be observed at multiple frequencies, they appear not to be specific for any intervention for the majority of frequencies. At frequencies ∼2–3.5 Hz below the IAF however, significant differences can be observed between the correlation coefficients (P's < 0.002; Bonferroni correction), driven by a stronger negative association for the IAF rTMS group (see Fig. 8A,B). The frequency range strongly overlaps with the one in which a general group difference was found as well (see Fig. 5). This means that besides of affecting sub‐IAF frequencies (delta to theta range), the effects of IAF rTMS strongly depends on pre‐rTMS states with higher power at these low frequencies predicting a stronger impact (i.e., power decrease) following intervention.
Figure 8.
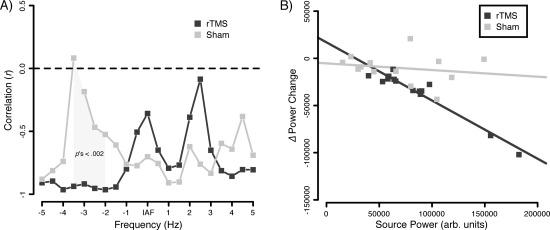
Depiction of state‐dependent rTMS changes. A: Poststimulus power changes are in particularly highly negatively correlated for the rTMS condition at frequencies ∼2–3.5 Hz below IAF. In this frequency range, correlation coefficients differ highly significantly from the Sham group (Bonferroni corrected). B: Scatterplot depicting the respective group associations in the aforementioned frequency range.
DISCUSSION
Ever since the introduction of TMS as a neuroscientific tool and the demonstration that its repetitive application leads to motor cortical excitability changes outlasting the period of stimulation, clinical neuroscientists have been exploring its utility in the treatment of neurological and psychiatric disorders [see Ridding and Rothwell, 2007]. Unfortunately this enthusiasm has so far not been matched by an adequate amount of empirical studies that carefully investigate neurophysiological activity changes following rTMS. The main motivation of our present work was to explore whether IAF rTMS would be capable of enhancing auditory cortical alpha activity in a sustained manner, a process that we hypothesize to be of an outstanding importance to reestablish a normal excitatory–inhibitory balance [Weisz, 2007b]. Even though single sessions of alpha (“high frequency”) rTMS applied to the motor cortex [Pascual‐Leone et al., 1994] implies to be increasing motor cortical excitability, some studies applying this stimulation form to tinnitus [see Plewnia, 2010 for an overview] or schizophrenia [Jin et al., in press] have yielded positive results. Furthermore, application of brief alpha‐pulse trains to the visual cortex have resulted in clear patterns of transient alpha increases [entrainment; Thut et al., 2011] along with evidence of behavioral inhibition [Thut and Miniussi, 2009]. We regarded these strands of evidence as sufficient to justify the research question whether an IAF rTMS applied to the auditory cortex in healthy individuals could significantly increase auditory cortical alpha activity. A successful affirmation of this research question would have important clinical implications with regards to the treatment of chronic tinnitus using rTMS, a domain in which low frequency (“inhibitory”) stimulation forms dominate [e.g., so far the application of alpha rTMS has only been in the context of single session studies; see Plewnia, 2010 for an overview and Khedr et al., 2008 for an exception].
To assess also behavioral consequences of IAF rTMS participants performed an intensity discrimination task before and after intervention. The results point to a weak, however statistically significant, worsening of performance for the IAF rTMS group as compared to the Sham group. Based on behavioral evidence alone, it is thus tempting to assume that IAF rTMS induced a functional inhibition by increasing alpha activity in auditory cortical regions a view that would nicely complement current entrainment results from cognitive neuroscience [Thut and Miniussi, 2009]. The clear absence of an Ear × Group effect however adds a level of complexity to such a straight‐forward interpretation, since IAF rTMS induced behavioral relevant neurophysiological effects would then be either (a) bilateral or (b) the stimulated left auditory cortex would be relevant for performance of both ears. Alternatively and not conform with the alpha increase interpretation is that IAF rTMS leads to (c) altered brain activity patterns outside of the auditory cortex in brain regions relevant for performance of both ears.
Behavioral data in isolation are insufficient to give a satisfactory answer to the raised questions, however in combination with the EEG results some important conclusions can be drawn: (1) No matter how the data are regarded, i.e. even with relaxed statistical rigor, a genuine increase of auditory cortical alpha activity cannot be observed, neither during or directly following the rTMS pulse series nor in a sustained manner during the resting EEG recordings. Relative decreases were found in a brief period following the rTMS pulses as well as in right motor and premotor regions in the resting EEG recording following intervention. These effects were however driven by a interindividually consistent IAF power reduction in the Sham condition whereas for the IAF rTMS group the effects were characterized by great interindividual variability. (2) Comparing the groups, the most pronounced effect is a stronger overall power decrease pronounced at sub‐IAF frequencies corresponding to the delta to theta range. This effect was strongly lateralized to the stimulated (left) hemisphere and included among other regions also the auditory cortex. Power at such frequencies in spontaneous activity EEG recordings is most pronounced during slow‐wave sleep [Marshall and Born, 2007] and the stronger decrease of power following real rTMS treatment may reflect an increased vigilant state, a plausible interpretation considering the fact that it likely was more unpleasant than the Sham treatment. Interestingly however, our correlation analysis revealed that the low frequency effect was highly state‐dependent, with high levels of power predicting a greater rTMS impact. Even though it is uncertain how the low frequency changes translate into terms of neuronal excitability (lacking specific ideas as e.g. present for alpha activity), this result fully supports current notions that TMS effects strongly depend on pre‐TMS brain states [Siebner et al., 2004; Silvanto et al., 2008]. Despite of the nature of interpretation for the low frequency effects, which would require additional experiments, it is important to point out that this low frequency effect was not correlated with behavioral changes. (3) Correlations with behavioral changes were however observed outside of the auditory cortex, mainly ACC beta power (more beta power being associated with improved thresholds) and PCC beta connectivity (increased connectedness being associated with deteriorated thresholds). Interestingly, the ACC and PCC effects were inversely related and a compound measure (using Pythagoras' theorem) indicated a strong relationship with behavioral changes in particular for the IAF rTMS group. It has to be emphasized that the ACC/PCC effect were not a focus while planning the study, so any interpretation will be necessarily speculative at the current moment. Nevertheless, from the present data ACC and PCC activational properties appear to have a joint functional relevance in the context of the present behavioral task and which may be affected by IAF rTMS. Interestingly, the PCC has been reported to form a core region of the default mode network [Raichle et al., 2001], whereas the ACC appear to play a vital role in executive control [Carter et al., 1999]: IAF rTMS may thus interfere with a disengagement from inwardly focused attention to acting upon environmental stimuli, a post hoc hypothesis that would need to be explored further in future. Considering the extra‐auditory nature as well as the putatively higher‐order mental processes, it comes as no surprise that behavioral effects were not lateralized to a specific ear, which would have been expected in case IAF rTMS significantly and selectively altered auditory cortical excitability at the stimulated site. Next, we will first discuss some of the major limitations of this study or when applying rTMS to the auditory cortex in general.
One criticism may be that large parts of the auditory cortex along the transverse temporal gyri are located deeply in the lateral sulcus of the human brain and may thus be difficult to target, since the effects of the TMS pulse drop dramatically with increasing distance of the targeted region to the coil. While this indeed may be an obstacle to some extent, particularly our resting‐state EEG data however show, that auditory cortical activity was clearly affected. So the question, rather than being whether one can modulate auditory cortical activity using rTMS, is better formulated as how to modulate auditory cortical activity in a desired direction. It becomes evident from the EEG data that the effects elicited by IAF rTMS neither conform with effects of high frequency (alpha) rTMS reported in the motor system [Pascual‐Leone et al., 1994] nor with the short‐term (entrainment) increases following IAF applied to the visual system [Thut et al., 2011]. In particular with the latter approach, we however see no fundamental disagreement, since (a) the effects reported in these entrainment studies are very brief and in no way sustained and (b) the amount of pulses was considerably higher in the present study which may be affect entrainment effects in a so far unknown manner. Furthermore (c) and also in contrast to rTMS applied to the visual and motor modality, rTMS applied to the auditory cortex suffers from a problem that a clear acoustic click accompanies the TMS. Our Sham data actually show at least for the fast effects following the rTMS pulse series a highly consistent decrease of alpha power, which could mean that any attempt to increase alpha power via IAF could be drowned by the simultaneously desynchronizing effects of the acoustic stimulation. This issue may be related to the last aspect, that we were not capable of observing alpha increases as a basic response feature of TMS reported by Veniero et al. 1997 for 5 and 20 Hz as well as by Brigagni et al. [2008] for 1 Hz applied to the motor cortex (the authors of these papers appropriately limit their claims to the motor system). One issue that may be raised as well is that uncommon to previous studies on tinnitus [e.g., Kleinjung et al., 2005] a fixed TMS intensity was used rather than deriving an intensity from MEP assessment. Since cortical excitability is likely to vary between individuals, we cannot exclude completely that this factor may have had some influences on the results. We find that the use of a fixed intensity however is justified due to following arguments: (1) A similar measure for assessing auditory cortical excitability does not exist so far contrary to the motor system (i.e., MEP threshold) or visual system (i.e., phosphene threshold). (2) A previous study [Stewart et al., 2001] found MEP and phosphene threshold to be uncorrelated, i.e., one measure from one cortical system is unsuited for inferring intensity values in the other system. We think that the auditory system is likely not an exception, i.e., MEP or phosphene threshold values are not valid measures for the auditory system. (3) A clinical study by Meeus et al. 2009 found the influence of TMS intensity on reducing tinnitus to be rather small (∼10%). A final possible limitation of the study is the lack of neuronavigation resulting in some imprecisions with regards to the targeted region. The scalp‐based procedure used in the present study has been shown previously to fall within a range of 20 mm and clinical improvements were comparable to those using more sophisticated neuronavigation‐based coil placement strategies [Langguth et al., 2006].
To conclude and to return to our initial motivation of this study, since genuine alpha increases could not be observed following IAF rTMS applied to the auditory cortex, we do not consider this intervention to be a strong candidate as a treatment tool of chronic tinnitus [Weisz et al., 2011]. Based on these findings, we also find it unlikely that the (few) reported beneficial effects of alpha rTMS in tinnitus are mediated via normalizing the excitatory–inhibitory balance in auditory cortical areas, even though a combined EEG/rTMS study awaits to be performed in this patient group to derive a strong conclusion. At least our study should caution researchers and clinicians again that rTMS‐induced behavioral effects do not necessarily need to mediated via direct effects at the stimulation site. For example, our study opens up the hypothesis that beneficial effects of IAF rTMS (and perhaps even other stimulation forms) in tinnitus could be mediated via affecting activational properties of the ACC and PCC (or their interaction), which have been frequently reported in mediating aspects of tinnitus‐related distress [Vanneste et al., 2010]. Finally, caution is also advised when directly inferring mode of actions of rTMS paradigms, which have been elaborated for the motor system, for the auditory cortex.
Supporting information
Supporting Information Figure 1.
Supporting Information Figure 2.
ACKNOWLEDGMENTS
The authors greatly appreciate input by Joachim Gross on how to treat the TMS artefact during EEG analysis and Berthold Langguth for helpful input. The authors declare no conflict of interest.
References
- Ashton H, Reid K, Marsh R, Johnson I, Alter K, Griffiths T (2007): High‐frequency localised “hot spots” in temporal lobes of patients with intractable tinnitus: A quantitative electroencephalographic (QEEG) study. Neurosci Lett 426:23–28. [DOI] [PubMed] [Google Scholar]
- Basta D, Ernst A (2004): Effects of salicylate on spontaneous activity in inferior colliculus brain slices. Neurosci Res 50:237–243. [DOI] [PubMed] [Google Scholar]
- Bauer M, Oostenveld R, Peeters M, Fries P (2006): Tactile spatial attention enhances gamma‐band activity in somatosensory cortex and reduces low‐frequency activity in parieto‐occipital areas. J Neurosci 26:490–501. [DOI] [PMC free article] [PubMed] [Google Scholar]
- Brignani D, Manganotti P, Rossini PM, Miniussi C (2008): Modulation of cortical oscillatory activity during transcranial magnetic stimulation. Hum Brain Mapp 29:603–612. [DOI] [PMC free article] [PubMed] [Google Scholar]
- Bullmore E, Sporns O (2009): Complex brain networks: Graph theoretical analysis of structural and functional systems. Nat Rev Neurosci 10:186–198. [DOI] [PubMed] [Google Scholar]
- Carter CS, Botvinick MM, Cohen JD (1999): The contribution of the anterior cingulate cortex to executive processes in cognition. Rev Neurosci 10:49–57. [DOI] [PubMed] [Google Scholar]
- De Ridder D, Menovsky T, van de Heyning P (2008): Auditory cortex stimulation for tinnitus suppression. Otol Neurotol 29:574–575 [DOI] [PubMed] [Google Scholar]
- Dohrmann K, Weisz N, Schlee W, Hartmann T, Elbert T (2007): Neurofeedback for treating tinnitus. Prog Brain Res 166:473–485. [DOI] [PubMed] [Google Scholar]
- Eggermont JJ, Roberts LE (2004): The neuroscience of tinnitus. Trends Neurosci 27:676–682. [DOI] [PubMed] [Google Scholar]
- Haegens S, Nácher V, Luna R, Romo R, Jensen O (2011): α‐Oscillations in the monkey sensorimotor network influence discrimination performance by rhythmical inhibition of neuronal spiking. Proc Natl Acad Sci USA 108:19377–19382. [DOI] [PMC free article] [PubMed] [Google Scholar]
- Hartmann T, Schulz H, Weisz N (2011): Probing of brain states in real‐time: Introducing the ConSole environment. Front Psychol 2:36. [DOI] [PMC free article] [PubMed] [Google Scholar]
- Jensen O, Mazaheri A (2010): Shaping functional architecture by oscillatory alpha activity: Gating by inhibition. Front Hum Neurosci 4:186. [DOI] [PMC free article] [PubMed] [Google Scholar]
- Jin Y, Kemp A, Huang Y, Thai T, Liu Z, Xu W, He H, Potkin SG: Alpha EEG guided TMS in schizophrenia. Brain stimul (in press), http://dx.doi.org/ 10.1016/j.brs.2011.09.005. [DOI] [PubMed] [Google Scholar]
- Kaltenbach JA, Zacharek MA, Zhang J, Frederick S (2004): Activity in the dorsal cochlear nucleus of hamsters previously tested for tinnitus following intense tone exposure. Neurosci Lett 355:121–125. [DOI] [PubMed] [Google Scholar]
- Khedr EM, Rothwell JC, Ahmed MA, El‐Atar A (2008): Effect of daily repetitive transcranial magnetic stimulation for treatment of tinnitus: Comparison of different stimulus frequencies. J Neurol Neurosurg Psychiatr 79:212–215. [DOI] [PubMed] [Google Scholar]
- Kleinjung T, Eichhammer P, Langguth B, Jacob P, Marienhagen J, Hajak G, Wolf SR, Strutz J (2005): Long‐term effects of repetetive transcranial magnetic stimulation (rTMS) in patients with chronic tinnitus. Otolaryngol Head Neck Surg 132:566–569. [DOI] [PubMed] [Google Scholar]
- Kleinjung T, Eichhammer P, Landgrebe M, Sand P, Hajak G, Steffens T, Strutz J, Langguth B (2008): Combined temporal and prefrontal transcranial magnetic stimulation for tinnitus treatment: A pilot study. Otolaryngol Head Neck Surg 138:497–501. [DOI] [PubMed] [Google Scholar]
- Langguth B, Zowe M, Landgrebe M, Sand P, Kleinjung T, Binder H, Hajak G, Eichhammer P (2006): Transcranial magnetic stimulation for the treatment of tinnitus: A new coil positioning method and first results. Brain Topogr 18:241–247. [DOI] [PubMed] [Google Scholar]
- Langguth B, Kleinjung T, Marienhagen J, Binder H, Sand PG, Hajak G, Eichhammer P (2007): Transcranial magnetic stimulation for the treatment of tinnitus: Effects on cortical excitability. BMC Neurosci 8:45. [DOI] [PMC free article] [PubMed] [Google Scholar]
- Langguth B, de Ridder D, Dornhoffer JL, Eichhammer P, Folmer RL, Frank E, Fregni F, Gerloff C, Khedr E, Kleinjung T, Landgrebe M, Lee S, Lefaucheur JP, Londero A, Marcondes R, Moller AR, Pascual‐Leone A, Plewnia C, Rossi S, Sanchez T, Sand P, Schlee W, Pysch D, Steffens T, van de Heyning P, Hajak G (2008): Controversy: Does repetitive transcranial magnetic stimulation/transcranial direct current stimulation show efficacy in treating tinnitus patients? Brain Stimul 1:192–205. [DOI] [PubMed] [Google Scholar]
- Lorenz I, Muller N, Schlee W, Langguth B, Weisz N (2010): Short‐term effects of single repetitive TMS sessions on auditory evoked activity in patients with chronic tinnitus. J Neurophysiol 104:1497–1505. [DOI] [PubMed] [Google Scholar]
- Maris E, Oostenveld R (2007): Nonparametric statistical testing of EEG‐ and MEG‐data. J Neurosci Methods 164:177–190. [DOI] [PubMed] [Google Scholar]
- Marshall L, Helgadóttir H, Mölle M, Born J (2006): Boosting slow oscillations during sleep potentiates memory. Nature 444:610–613. [DOI] [PubMed] [Google Scholar]
- Marshall L, Born J (2007): The contribution of sleep to hippocampus‐dependent memory consolidation. Trends Cogn Sci 11:442–450. [DOI] [PubMed] [Google Scholar]
- Mathewson KE, Fabiani M, Gratton G, Beck DM, Lleras A (2010): Rescuing stimuli from invisibility: Inducing a momentary release from visual masking with pre‐target entrainment. Cognition 115:186–191. [DOI] [PubMed] [Google Scholar]
- Meeus O, Blavie C, Ost J, De Ridder D, Van de Heyning P (2009): Influence of tonic and burst transcranial magnetic stimulation characteristics on acute inhibition of subjective tinnitus. Otol Neurotol 30:697–703. [DOI] [PubMed] [Google Scholar]
- Müller N, Weisz N (2012): Lateralized auditory cortical alpha band activity and interregional connectivity pattern reflect anticipation of target sounds. Cereb Cortex 22:1604–1613. [DOI] [PubMed] [Google Scholar]
- Noreña AJ, Eggermont JJ (2003): Changes in spontaneous neural activity immediately after an acoustic trauma: Implications for neural correlates of tinnitus. Hear Res 183:137–153. [DOI] [PubMed] [Google Scholar]
- Okamoto H, Stracke H, Stoll W, Pantev C (2010): Listening to tailor‐made notched music reduces tinnitus loudness and tinnitus‐related auditory cortex activity. Proc Natl Acad Sci USA 107:1207–1210. [DOI] [PMC free article] [PubMed] [Google Scholar]
- Oostenveld R, Fries P, Maris E, Schoffelen JM (2011): FieldTrip: Open source software for advanced analysis of MEG, EEG, and invasive electrophysiological data. Comput Intell Neurosci 2011:156869. [DOI] [PMC free article] [PubMed] [Google Scholar]
- Ozen S, Sirota A, Belluscio MA, Anastassiou CA, Stark E, Koch C, Buzsáki G (2010): Transcranial electric stimulation entrains cortical neuronal populations in rats. J Neurosci 30:11476–11485. [DOI] [PMC free article] [PubMed] [Google Scholar]
- Pascual‐Leone A, Valls‐Solé J, Wassermann EM, Hallett M (1994): Responses to rapid‐rate transcranial magnetic stimulation of the human motor cortex. Brain 117:847–858. [DOI] [PubMed] [Google Scholar]
- Pfurtscheller G, Stancak A, Neuper C (1996): Event‐related synchronization (ERS) in the alpha band—An electrophysiological correlate of cortical idling: A review. In J Psychophysiol 24:39–46. [DOI] [PubMed] [Google Scholar]
- Plewnia C, Bartels M, Gerloff C (2003): Transient supression of tinnitus by transcranial magnetic stimulation. Annal Neurol 53:263–236. [DOI] [PubMed] [Google Scholar]
- Plewnia C (2010): Brain stimulation: New vistas for the exploration and treatment of tinnitus. CNS Neurosci Ther 17:449–461. [DOI] [PMC free article] [PubMed] [Google Scholar]
- Raichle ME, MacLeod AM, Snyder AZ, Powers WJ, Gusnard DA, Shulman GL (2001): A default mode of brain function. Proc Natl Acad Sci USA 98:676–682. [DOI] [PMC free article] [PubMed] [Google Scholar]
- Ridding M, Rothwell JC (2007): Is there a future for therapeutic use of transcranial magnetic stimulation. Nat Rev Neurosci 8:559–567. [DOI] [PubMed] [Google Scholar]
- Romei V, Murray MM, Merabet LB, Thut G (2007): Occipital transcranial magnetic stimulation has opposing effects on visual and auditory stimulus detection: Implications for multisensory interactions. J Neurosci 27:11465–11472. [DOI] [PMC free article] [PubMed] [Google Scholar]
- Sauseng P, Klimesch W, Gerloff C, Hummel F (2009): Spontaneous locally restricted EEG alpha activity determines cortical excitability in the motor cortex. Neuropsychologia 47:284–288. [DOI] [PubMed] [Google Scholar]
- Siebner HR, Lang N, Rizzo V, Nitsche MA, Paulus W, Lemon RN, Rothwell JC (2004): Preconditioning of low‐frequency repetitive transcranial magnetic stimulation with transcranial direct current stimulation: Evidence for homeostatic plasticity in the human motor cortex. J Neurosci 24:3379–3385. [DOI] [PMC free article] [PubMed] [Google Scholar]
- Silvanto J, Muggleton N, Walsh V (2008): State‐dependency in brain stimulation studies of perception and cognition. Trends Cogn Sci 12:447–454. [DOI] [PubMed] [Google Scholar]
- Stewart LM, Wlash V, Rothwell JC (2001): Motor and phosphene thresholds: A transcranial magnetic stimulation study. Neuropsychologia 39:415–419. [DOI] [PubMed] [Google Scholar]
- Thut G, Miniussi C (2009): New insights into rhythmic brain activity from TMS‐EEG studies. Trends Cogn Sci 13:182–189. [DOI] [PubMed] [Google Scholar]
- Thut G, Nietzel A, Brandt SA, Pascual‐Leone A (2006): Alpha‐band electroencephalographic activity over occipital cortex indexes visuospatial attention bias and predicts visual target detection. J Neurosci 26:9494–9502. [DOI] [PMC free article] [PubMed] [Google Scholar]
- Thut G, Veniero D, Romei V, Miniussi C, Schyns P, Gross J (2011): Rhythmic TMS causes local entrainment of natural oscillatory signatures. Curr Biol 21:1176–1185. [DOI] [PMC free article] [PubMed] [Google Scholar]
- Van der Loo E, Gais S, Congedo M, Vanneste S, Plazier M, Menovsky T, van de Heyning P, De Ridder D (2009).Tinnitus intensity dependent gamma oscillations of the contralateral auditory cortex. PLoS One 4:e7396. [DOI] [PMC free article] [PubMed] [Google Scholar]
- Vanneste S, Plazier M, Loo der EV, de Heyning PV, Congedo M, de Ridder D (2010): The neural correlates of tinnitus‐related distress. NeuroImage 52:470–480. [DOI] [PubMed] [Google Scholar]
- van Veen B, van Drongelen W, Yuchtman M, Suzuki A (1997): Localization of brain electrical activity via linearly constrained minimum variance spatial filtering. IEEE Trans Biomed Eng 44:867–880. [DOI] [PubMed] [Google Scholar]
- Veniero D, Brignani D, Thut G, Miniussi C (2011): Alpha‐generation as basic response‐signature to transcranial magnetic stimulation (TMS) targeting the human resting motor cortex: A TMS/EEG co‐registration study. Psychophysiology 48:1381–1389. [DOI] [PubMed] [Google Scholar]
- Weisz N, Moratti S, Meinzer M, Dohrmann K, Elbert T (2005): Tinnitus perception and distress is related to abnormal spontaneous brain activity as measured by magnetoencephalography. PLoS Med 2:e153. [DOI] [PMC free article] [PubMed] [Google Scholar]
- Weisz N, Hartmann T, Dohrmann K, Schlee W, Norena A (2006): High‐frequency tinnitus without hearing loss does not mean absence of deafferentation. Hear Res 222:108–114. [DOI] [PubMed] [Google Scholar]
- Weisz N, Dohrmann K, Elbert T (2007a): The relevance of spontaneous activity for the coding of the tinnitus sensation. Prog Brain Res 166:61–70. [DOI] [PubMed] [Google Scholar]
- Weisz N, Müller S, Schlee W, Dohrmann K, Hartmann T, Elbert T (2007b): The neural code of auditory phantom perception. J Neurosci 27:1479–1484. [DOI] [PMC free article] [PubMed] [Google Scholar]
- Weisz N, Hartmann T, Müller N, Lorenz I, Obleser J (2011): Alpha rhythms in audition: Cognitive and clinical perspectives. Front Psychol 2:73. [DOI] [PMC free article] [PubMed] [Google Scholar]
- Wichmann F (2001): The psychometric function. I. Fitting, sampling, and goodness of fit. Percept Psychophys 63:1293–1313. [DOI] [PubMed] [Google Scholar]
- Worden MS, Foxe JJ, Wang N, Simpson GV (2000): Anticipatory biasing of visuospatial attention indexed by retinotopically specific alpha‐band electroencephalography increases over occipital cortex. J Neurosci 20:RC63. [DOI] [PMC free article] [PubMed] [Google Scholar]
- Zaehle T, Rach S, Herrmann C (2010): Transcranial alternating current stimulation enhances individual alpha activity in human EEG. PLoS One 5:e13766. [DOI] [PMC free article] [PubMed] [Google Scholar]
Associated Data
This section collects any data citations, data availability statements, or supplementary materials included in this article.
Supplementary Materials
Supporting Information Figure 1.
Supporting Information Figure 2.