

Abstract
The brainstem and basal ganglia are important in the pathophysiology of Parkinson's disease (PD). Reliable and sensitive detection of neural activity changes in these regions should be helpful in scientific and clinical research on PD. In this study, we used resting state functional MRI and amplitude of low frequency fluctuation (ALFF) methods to examine spontaneous neural activity in 109 patients with PD. We examined activity in two frequency bands, slow‐4 (between 0.027 and 0.073 Hz) and slow‐5 (0.010–0.027 Hz). Patients had decreased ALFF in the striatum and increased ALFF in the midbrain, and changes were more significant in slow‐4. Additionally, changes in slow‐4 in both basal ganglia and midbrain correlated with the severity of the parkinsonism. The ALFF in the caudate nucleus positively correlated with the dose of levodopa, while the ALFF in the putamen negatively correlated with the disease duration in both slow‐4 and slow‐5 bands. In addition, the ALFF in the rostral supplementary motor area negatively correlated with bradykinesia subscale scores. Our findings show that with a large cohort of patients and distinguishing frequency bands, neural modulations in the brainstem and striatum in PD can be detected and may have clinical relevance. The physiological interpretation of these changes needs to be determined. Hum Brain Mapp 35:5815–5833, 2014. © 2014 Wiley Periodicals, Inc.
Keywords: functional MRI, amplitude of low frequency fluctuation, frequency band, midbrain, basal ganglia
INTRODUCTION
Parkinson's disease (PD) is one of the most common progressive neurological degenerative disorders. The cardinal clinical manifestations of PD include resting tremor, rigidity, and bradykinesia. The pathological characteristic of PD is the degeneration of dopaminergic neurons in the substantia nigra within midbrain coupled with intracytoplasmic inclusions known as Lewy bodies. Neuropathological studies indicate that the pathological changes of PD may initially appear in the brainstem below the substantia nigra, and extend into the midbrain and neocortex gradually [Braak et al., 2003]. Major parkinsonian symptoms appear as a consequence of significant dopamine depletion in the basal ganglia. Thus, the basal ganglia and brainstem are two of the most important brain structures in the pathophysiology of PD. Reliable and sensitive detection of neural modifications in these regions should be helpful in our understanding of pathophysiological mechanisms, or the developing of biomarkers for diagnosis, or monitoring disorder progress of PD.
Neuroimaging studies with positron emission tomography (PET) or single photon emission computed tomography (SPECT) have shown that PD patients have abnormal cerebral metabolism in the striatum and brainstem, as well as in other brain regions [Eidelberg, 2009; Ma et al., 2007]. In recent years, resting state functional MRI (RS‐fMRI) has been increasingly applied in investigation on PD. Compared to PET or SPECT, RS‐fMRI is simpler, no need of radiotracers, and there is availability in many more clinics. Our group used a RS‐fMRI method called regional homogeneity (ReHo) to examine neural activity in PD [Wu et al., 2009]. ReHo is a method to analyze the blood‐oxygen‐level dependent (BOLD) signal of the brain [Zang et al., 2004]. It assumes that within a functional cluster, the hemodynamic characteristics of every voxel would be similar or synchronous with that of each other; and such similarity could be changed or modulated by different conditions. We found decreased spontaneous neural activity in the striatum, along with activity changes in many other areas in PD; additionally, the decreased activity in the striatum is correlated with the severity of symptoms, and can be normalized by administration of levodopa [Wu et al., 2009]. Some later studies by measuring the amplitude of low frequency fluctuations (ALFF) or ReHo, have also reported decreased activity in the striatum [Wen et al., 2013; Yang et al., 2013], and showed correlation between motor deficits and decrease of ALFF in the putamen in PD patients [Skidmore et al., 2013].
Although RS‐fMRI investigations have revealed PD‐related neural activity, most of these studies did not observe neural modulations in the brainstem, and some studies did not detect neural changes in the basal ganglia [Choe et al., 2013; Kwak et al., 2012]. While different clinical characteristics, for example, phenotype or symptom severity, may have an influence, we suppose a likely reason contributing to this problem is methodological limitations. Despite higher spatial‐temporal resolution, fMRI techniques generally had poorer signal to noise characteristics relative to PET on the individual level [Krings et al., 2002]. Additionally, the BOLD signal in subcortical regions, including the basal ganglia and brainstem, is always not as robust as that in the cortical regions. Thus, the relatively small sample size being used in most previous RS‐fMRI study may not be sufficient to properly detect subcortical neural activity changes in PD patients.
In addition, most previous RS‐fMRI studies have examined the PD‐related neural activity in the typical low frequency band between 0.01 and 0.1 Hz [Biswal et al., 1995]. However, it has been shown that the low frequency range can be subdivided into several bands, and independent frequency bands may be generated by distinct oscillators with specific properties and physiological functions [Buzsáki and Draguhn, 2004; Penttonen and Buzsáki, 2003]. Recently, Zuo et al. [2010] found that the ALFF had distinct pattern in each individual low frequency band; moreover, at the frequency band between 0.027 and 0.073 Hz, the ALFF was significantly more robust in the basal ganglia and midbrain than in other frequency band. Therefore, it is possible that PD‐specific neural modifications might be more sensitively detected at certain frequencies. By now, only a few studies have investigated PD‐related neural modulations in different frequency bands [Esposito et al., 2013; Kwak et al., 2010; Zhang et al., 2013]. Kwak et al. [2010] and Esposito et al. [2013] examined the effects of levodopa administration on network connectivity, whereas Zhang et al. [2013] simply showed the neural activity in each frequency band. However, none of these reports have investigated which frequency band is more sensitive to detect PD‐related neural changes in the brainstem or basal ganglia.
In this study, we used RS‐fMRI and ALFF approaches to examine spontaneous neural activity in different frequency bands in a large cohort of PD patients. Our purpose was to examine whether PD‐related neural changes in the basal ganglia and brainstem can be revealed with a large sample size. Moreover, we investigated which frequency band is more sensitive to explore PD‐related neural changes in the basal ganglia and brainstem. These findings will be helpful to our understanding of neurophysiological mechanisms, and most importantly, to determine the optimal paradigm for data analysis in future RS‐fMRI studies on PD.
METHODS
Subjects
This study included 109 patients with PD and 106 age and gender matched healthy control subjects. The diagnosis of PD was based on the UK Parkinson's Disease Society Brain Bank Clinical Diagnostic Criteria [Hughes et al., 1992]. Patients were assessed with the UPDRS (Unified Parkinson's Disease Rating Scale) [Lang and Fahn, 1989], the Hoehn and Yahr disability scale [Hoehn and Yahr, 1967] and mini‐mental state examination (MMSE) while off their medications. The fMRI data from eight patients and four controls were excluded because of excessive head motion. The demographics and clinical details from the remaining 101 patients and 102 controls are shown in Table 1. There were no significant differences in age, gender, or MMSE between the groups. All subjects were right‐handed according to the Edinburgh Handedness Inventory [Oldfield, 1971]. The experiments were performed according to the Declaration of Helsinki and were approved by the Institutional Review Board. All subjects gave their written informed consent for the study.
Table 1.
Demographics and clinical details of the subjects
| PD patients | Controls | |
|---|---|---|
| Age (years) | 43–79 (59.84 ± 7.15) | 44–79 (59.91 ± 7.09) |
| Sex | 59 M, 42 F | 60 M, 42 F |
| Disease duration (years) | 7.23 ± 4.42 | |
| UPDRS motor score (off medication) | 25.54 ±11.51 | |
| H&Y (off medication) | 1.87 ± 0.71 | |
| Bradykinesia subscale | 9.55 ± 6.02 | |
| MMSE | 28.72 ± 1.31 | 29.01 ± 1.10 |
| L‐dopa dose (mg/day) | 310.64 ± 163.09 |
Data are presented as mean ± SD. Abbreviations: PD, Parkinson's disease; M, male; F, female; UPDRS, Unified Parkinson's Disease Rating Scale; H&Y, Hoehn and Yahr Staging; MMSE, Mini‐Mental State Examination.
Data Acquisition
fMRIs were performed on a 3T MR scanner (Triosystem; Siemens Magnetom scanner, Erlangen, Germany). PD patients were scanned only after their medication had been withdrawn for at least 12 h. A standard head coil was used with foam padding to restrict head motion. High resolution axial T1‐and T2‐weighted images were obtained in every participant to detect clinically silent lesions. High‐resolution anatomical images were acquired with 3D‐MPRAGE sequence (TR = 2530 ms, TE = 3.39 ms, 128 axial slices, 1.33 mm thickness, field of view [FOV] = 256 mm). BOLD data were acquired with gradient‐echo echo‐planar sequences (TR = 2000 ms, TE = 30 ms, 33 axial slices, 3.5 mm thickness, flip angle = 90°, FOV = 220 mm). During the RS‐fMRI scanning, subjects were instructed to keep their eyes closed, and to remain motionless. The fMRI scanning session lasted for 8 min.
Data Analysis
Data of each fMRI series contained 240 time points. The first 10 time points were discarded because of instability of the initial MRI signal and the adaptation of the subjects to the environment. Preprocessing of remaining fMRI data was carried out using Data Processing Assistant for Resting‐State fMRI V2.1 (http://www.restfmri.net). Time‐series data were first slice‐time corrected and aligned to the first image of each session for motion correction. Each subject's head motion parameters were examined. As described previously, the dataset from eight patients and four controls were discarded because their head motion had more than 1.5 mm maximum translation in x, y, or z, or 1.50 of maximum rotation about three axes. Functional images of each remaining subject were coregistered to high‐resolution anatomical images and underwent spatial normalization into the standard Montreal Neurological Institute brain space. All images were then resampled into voxels that were 3 × 3 × 3 mm3 in size, and smoothed with a 3 mm full width at half maximum Gaussian smoothing kernel. Then, linear drift was removed. No temporal filtering was implemented during preprocessing. This assures that the entire frequency band below the Nyquist frequency can be examined in the subsequent analyses. The Nyquist frequency represents the highest frequency of a sampled signal which is reliably recorded and is equal to half the sampling frequency of that signal [Nyquist, 1928]. Here, it is (1/2) × (1/TR) = 0.25 Hz.
We divided the full frequency range (0–0.25 Hz) into five different bands: slow‐6 (0–0.01 Hz), slow‐5 (0.01–0.027 Hz), slow‐4 (0.027–0.073 Hz), slow‐3 (0.073–0.198 Hz), and slow‐2 (0.198–0.25 Hz) [Buzsáki and Draguhn, 2004; Zuo et al., 2010]. The signals of slow‐6, slow‐3, and slow‐2 were discarded because they mainly reflect very low frequency drift, white matter signals, and high‐frequency physiological noises, respectively [Biswal et al., 1995; Zuo et al., 2010]. Thus, we computed ALFF in the slow‐5 and slow‐4 bands. ALFF was calculated with the same procedure reported previously [Yang et al., 2007; Yan et al., 2009; Zang et al., 2007], using the Resting‐State fMRI Data Analysis Toolkit (REST, http://www.restfmri.net). The time courses of each voxel were first converted to the frequency domain using a Fast Fourier Transform. The square root of the power spectrum was computed and then averaged across a predefined frequency interval. This averaged square root was termed ALFF at the given voxel, and was further divided by the global mean value to reduce the global effects of variability across participants [Zang et al., 2007].
To determine the effects of group, frequency band and interaction between frequency band and group on ALFF, we performed a repeated‐measures analysis of variance (ANOVA) with SPM8 software (Wellcome Institute of Cognitive Neurology, London, UK). The ALFF results from each subject were modeled using flexible factorial design with group (PD patients and healthy controls) as a between‐subject factor and frequency band (slow‐4 and slow‐5) as a repeated measure. For those findings showing significant main effects and interaction between group and frequency band, post hoc two‐sample t‐tests were further performed. A family‐wise error (FWE) corrected threshold of P < 0.05 was used for all above statistical analyses. Extent threshold was 10 voxels.
A multiple regression model was used to analyze the correlations between ALFF and UPDRS motor score, disease duration, and age in PD patients in each frequency band. We first analyzed the correlation between ALFF and these three covariates separately. The correlation between ALFF and UPDRS motor score in each frequency band was to explore whether the correlations between spontaneous neural activity and disease severity were similar in different frequency bands in PD patients. Then, interaction analyses between these covariates were applied to show whether disease duration and age contribute to the effects of disease severity on ALFF.
Levodopa was withdrawn for at least 12 h before scanning, however, long‐term administration of levodopa may have chronic effects on the central nervous system. Thus, a correlation analysis of ALFF against the levodopa dose in each patient was also performed to examine the effect of chronically administered levodopa.
We also analyzed the correlation between the ALFF in the rostral supplementary motor area (pre‐SMA) and bradykinesia subscale scores to examine whether ALFF in the pre‐SMA relates to bradykineisa in PD. The bradykinesia subscale consisted of the following five items of the UPDRS motor examination: finger taps (left and right), hand movement (left and right), rapid alternating movements of hands (right and left), leg agility (right and left), and body bradykinesia and hypokinesia. The bradykinesia subscale is shown in Table 1.
RESULTS
Brain regions showing a significant main effect for group (repeated‐measures ANOVA, P < 0.05, FWE corrected) included the bilateral striatum, left pre‐SMA, left precentral gyrus, left superior temporal gyrus, and right occipital lobe (patients < controls), and midbrain, bilateral cerebellum, right inferior temporal gyrus, and right parietal cortex (patients > controls; Fig. 1). Post hoc two‐sample t‐tests were applied to show the differences between PD patients and controls in each frequency band. The comparisons between PD patients and healthy controls showed some similarities in the two frequency bands, such as decreased ALFF in the left striatum, pre‐SMA, and precentral gyrus, as well as increased ALFF in the midbrain and cerebellum in the patients in both bands (Fig. 2, Table 2; two‐sample t‐test, P < 0.05, FWE corrected). In contrast, some obvious differences also existed between the two bands. There was decreased ALFF in the right striatum, along with increased ALFF in the pons and parietal cortex in PD patients compared to the controls in slow‐4 band, changes which were not seen in the slow‐5 band.
Figure 1.
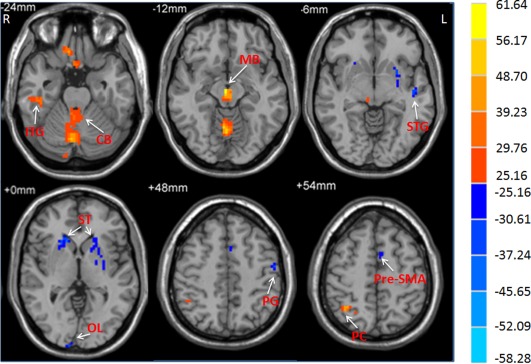
The main effect of group on ALFF. The differences in ALFF between the PD patients and controls (repeated‐measures ANOVA, P < 0.05, FWE corrected). F‐value bar is shown on the right. Hot and cold colors indicate higher and lower ALFF in the patients than in the controls, respectively. L, left; R, right. CB, cerebellum; ITG, inferior temporal gyrus; MB, midbrain; OL, occipital lobe; PC, parietal cortex; PG, precentral gyrus; ST, striatum; STG, superior temporal gyrus.
Figure 2.
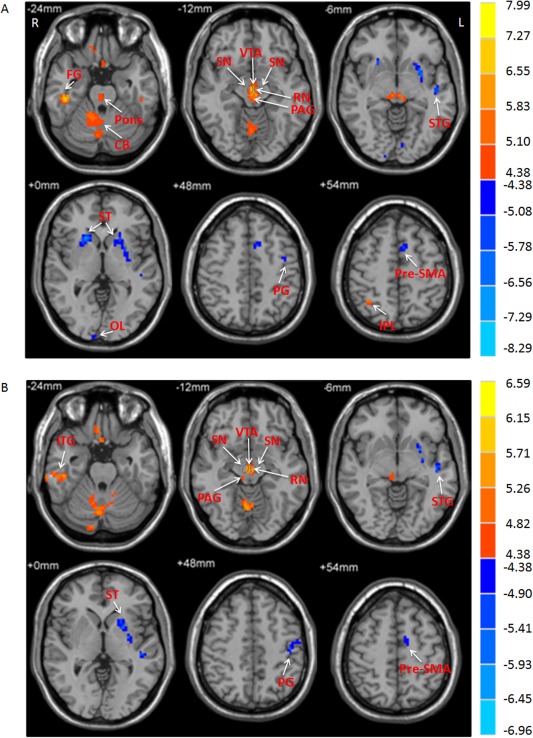
The difference of amplitude of low frequency fluctuations (ALFF) between the groups. A: The difference of ALFF between PD patients and healthy controls in the slow‐4 band. B: The difference of ALFF between PD patients and healthy controls in the slow‐5 band (two‐sample t‐test; P < 0.05, FWE corrected). T‐score bars are shown on the right. Hot and cold colors indicate PD‐related ALFF increases and decreases, respectively. L, left; R, right; CB, cerebellum; FG, fusiform gyrus; IPL, inferior parietal lobule; ITG, inferior temporal gyrus; OL, occipital lobe; PAG, periaqueductal gray; PG, precentral gyrus; RN, red nucleus; SN, substantia nigra; ST, striatum; STG, superior temporal gyrus; VTA, ventral tegmental area.
Table 2.
The difference of ALFF in each frequency band between PD patients and healthy subjects
| MNI coordinates | |||||||
|---|---|---|---|---|---|---|---|
| Frequency band | Brain region | Brodmann area | x | y | z | t value | Cluster size |
| Slow‐4 (0.027–0.073 Hz) | |||||||
| Controls > patients | |||||||
| L Precentral Gyrus | 6 | −39 | −3 | 45 | 5.40 | 13 | |
| L Pre‐SMA | 6 | −7 | 11 | 50 | 6.08 | 34 | |
| R Occipital Lobe | 18 | 6 | −94 | 18 | 5.95 | 34 | |
| L Superior Temporal Gyrus | 22 | −46 | −15 | −6 | 5.76 | 13 | |
| L Putamen | −27 | 6 | 13 | 8.16 | 174 | ||
| R Putamen | 22 | 18 | −1 | 8.29 | 72 | ||
| L Caudate Nucleus | 16 | 21 | 2 | 5.32 | 13 | ||
| Patients > controls | |||||||
| R Inferior Parietal Lobule | 7 | 36 | −54 | 54 | 5.46 | 18 | |
| R Fusiform Gyrus | 20 | 45 | −27 | −24 | 7.00 | 101 | |
| R Inferior Frontal Gyrus | 47 | 15 | 24 | −18 | 5.52 | 35 | |
| L Cerebellum, Posterior Lobe | −45 | −45 | −45 | 5.47 | 12 | ||
| R Cerebellum, Anterior Lobe | 3 | −69 | −15 | 5.81 | 183 | ||
| R Midbrain | 3 | −15 | −12 | 7.99 | 284 | ||
| R Pons | 4 | −26 | −26 | 6.15 | 20 | ||
| Slow‐5 (0.01–0.027 Hz) | |||||||
| Controls > patients | |||||||
| L Precentral Gyrus | 4 | −45 | −38 | 40 | 5.39 | 87 | |
| L Pre‐SMA | 6 | −6 | 3 | 63 | 4.80 | 18 | |
| L Superior Temporal Gyrus | 21 | −48 | −18 | −6 | 5.58 | 107 | |
| L Medial Frontal Gyrus | 32 | −12 | 33 | 30 | 5.05 | 39 | |
| L Putamen | −29 | −6 | −3 | 5.69 | 83 | ||
| Patients > controls | |||||||
| R Inferior Temporal Gyrus | 20 | 60 | −24 | −27 | 6.59 | 113 | |
| L Cerebellum, Posterior Lobe | −42 | −45 | −38 | 5.06 | 14 | ||
| R Cerebellum, Posterior Lobe | 9 | −57 | −15 | 6.08 | 315 | ||
| R Midbrain | −3 | −3 | −12 | 6.18 | 87 | ||
The results are the comparison of amplitude of low frequency fluctuations (ALFF) between PD patients and controls in each frequency band (two‐sample t‐test, P < 0.05, FWE corrected). Abbreviations: L, left; R, right; pre‐SMA, rostral supplementary motor area.
The analysis on the effect of frequency band in both groups (repeated‐measures ANOVA, P < 0.05, FWE corrected) showed that the ALFF in the slow‐4 band compared to that in the slow‐5 band was higher in the pons, midbrain, cerebellum, striatum, thalamus, temporal lobe, pre‐SMA, and premotor cortex, but lower in the medial frontal gyrus, precuneus, and posterior cingulate cortex (Fig. 3, Table 3).
Figure 3.
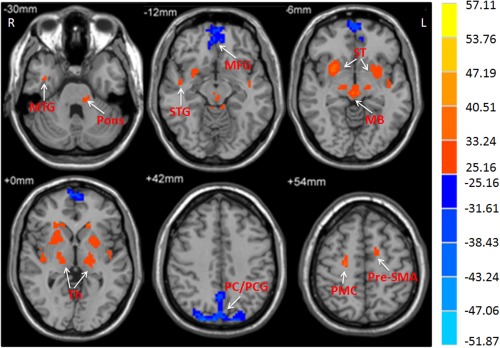
The main effect of frequency band on ALFF. The differences in ALFF between the slow‐4 and slow‐5 frequency bands (repeated‐measures ANOVA, P < 0.05, FWE corrected). F‐value bar is shown on the right. Hot and cold colors indicate higher and lower ALFF in the slow‐4 band than in the slow‐5 band, respectively. L, left; R, right. MB, midbrain; MFG, medial frontal gyrus; MTG, middle temporal gyrus; Pr/PCG, precuneus/posterior cingulate cortex; PG, precentral gyrus; PMC, premotor cortex; ST, striatum; STG, superior temporal gyrus; Th, thalamus.
Table 3.
The difference of ALFF between two frequency bands
| MNI coordinates | |||||||
|---|---|---|---|---|---|---|---|
| Frequency band | Brain region | Brodmann area | x | y | z | t value | Cluster size |
| Slow‐4 > Slow‐5 | |||||||
| L Pre‐SMA | 6 | −10 | 3 | 51 | 7.62 | 28 | |
| R Premotor Cortex | 6 | 23 | −18 | 57 | 7.81 | 31 | |
| R Middle Temporal Gyrus | 21 | 39 | −3 | −33 | 5.25 | 14 | |
| L Temporal Lobe | 21 | −42 | −9 | −12 | 5.16 | 14 | |
| R Superior Temporal Gyrus | 22 | 45 | −6 | −7 | 5.84 | 41 | |
| L Caudate Nucleus | −13 | 22 | 3 | 6.32 | 12 | ||
| R Caudate Nucleus | 15 | 23 | −3 | 5.92 | 28 | ||
| L Putamen | −25 | 7 | −2 | 11.40 | 176 | ||
| R Putamen | 27 | 8 | −4 | 15.07 | 205 | ||
| L Thalamus, Ventral Posterior Lateral Nucleus | −19 | −21 | 6 | 6.72 | 115 | ||
| R Thalamus, Ventral Posterior Lateral Nucleus | 18 | −17 | 4 | 7.11 | 89 | ||
| L Cerebellum, Anterior Lobe | −6 | −39 | −18 | 6.05 | 65 | ||
| R Cerebellum, Anterior Lobe | 15 | −30 | −18 | 6.06 | 41 | ||
| R Midbrain | 3 | −21 | −6 | 10.03 | 130 | ||
| L Pons | −12 | −31 | −27 | 5.45 | 11 | ||
| Slow‐5 > Slow‐4 | |||||||
| R Precuneus | 7 | 3 | −61 | 45 | 7.92 | 241 | |
| L Medial Frontal Gyrus | 10 | −3 | 60 | 2 | 8.87 | 359 | |
| R Posterior Cingulate Cortex | 23 | 7 | −54 | 21 | 7.12 | 52 | |
The differences in ALFF between the slow‐4 and slow‐5 frequency bands (repeated‐measures ANOVA, P < 0.05, FWE corrected). Abbreviations: L, left; R, right; pre‐SMA, rostral supplementary motor area.
There was significant interaction between frequency band and group in the midbrain, striatum, cerebellum, temporal lobe, medial frontal gyrus, precentral gyrus, and SMA (Fig. 4; repeated‐measures ANOVA, P < 0.05, FWE corrected). Further post hoc t‐test showed that the decreased ALFF in the striatum and increased ALFF in the midbrain in PD patients compared to controls were greater in the slow‐4 band than those in the slow‐5 band (Fig. 5).
Figure 4.
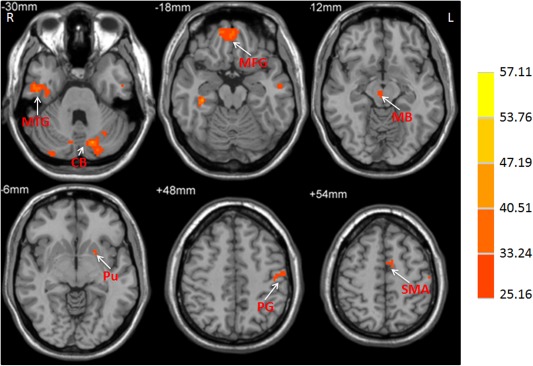
The interaction between frequency band and group on ALFF. The activations show the interaction between frequency band (slow‐4 and slow‐5) and group (patients and controls). Repeated‐measures ANOVA, P < 0.05, FWE corrected. F‐value bar is shown on the right. L, left; R, right. CB, cerebellum; MB, midbrain; MFG, medial frontal gyrus; MTG, middle temporal gyrus; PG, precentral gyrus; Pu, putamen; SMA, supplementary motor area.
Figure 5.
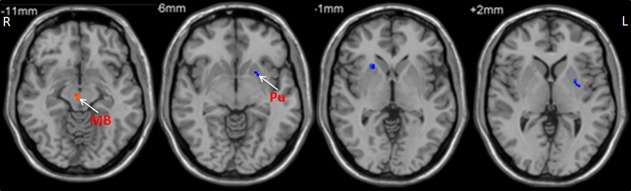
The difference of PD‐related activity between frequency bands. The decreased ALFF in the striatum and increased ALFF in the midbrain in PD compared to controls was greater in the slow‐4 band than those in the slow‐5 band (repeated‐measures ANOVA and post hoc test, P < 0.05, FWE corrected). Hot and cold colors indicate increased and decreased ALFF in PD compared to controls in the slow‐4 band than those in the slow‐5 band, respectively. L, left; R, right. MB, midbrain; Pu, putamen.
Correlation analysis between ALFF and the UPDRS motor score showed different results at the slow‐4 and slow‐5 bands (Fig. 6 and Table 4; multiple regression analysis, P < 0.05, FWE corrected). The putamen, pre‐SMA, and cingulate motor area (CMA) had significantly negative correlation in both bands. In contrast, the substantia nigra and globus pallidus showed negative correlation only at the slow‐4 band, whereas the cerebellum presented positive correlation only at the slow‐5 band. In addition, some results were opposite in the two bands, for example, the insula showed positive correlation in the slow‐4 band, but had negative correlation in the slow‐5 band.
Figure 6.
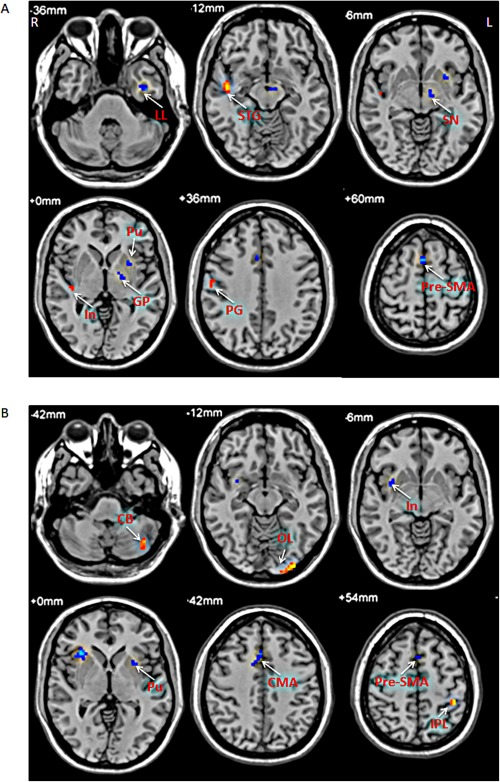
The results of correlation between ALFF and UPDRS motor scores in PD patients. The correlation between ALFF and UPDRS motor scores in the slow‐4 band (A), and slow‐5 band (B). Correlation analysis, P < 0.05, FWE corrected. Hot and cold colors indicate positive and negative correlation, respectively. L, left; R, right. CB, cerebellum; CMA, cingulate motor area; GP, globus pallidus; In, insula; LL, limbic lobe; IPL, inferior parietal lobule; OL, occipital lobe; PG, precentral gyrus; Pu, putamen; SN, substantia nigra; STG, superior temporal gyrus.
Table 4.
Correlation between ALFF and UPDRS motor scores in PD patients
| MNI coordinates | |||||||
|---|---|---|---|---|---|---|---|
| Frequency band | Brain region | Brodmann area | x | y | z | t value | Cluster size |
| Slow‐4 (0.027–0.073 Hz) | |||||||
| Negative correlation | |||||||
| L Pre‐SMA | 6 | 3 | 3 | 65 | −0.71 | 63 | |
| L Limbic Lobe | 20 | −36 | −6 | −33 | −0.59 | 30 | |
| R Cingulate Motor Area | 32 | 3 | 21 | 39 | −0.61 | 24 | |
| L Substantia Nigra | −8 | −15 | −9 | −0.58 | 21 | ||
| L Putamen | −24 | 6 | −2 | −0.59 | 24 | ||
| L Globus Pallidus | −19 | −3 | −3 | −0.56 | 27 | ||
| Positive correlation | |||||||
| R PrecentralGyrus | 4 | 60 | −8 | 24 | 0.55 | 37 | |
| R Insula | 13 | −39 | −24 | −3 | 0.56 | 11 | |
| R Superior Temporal gyrus | 21 | 48 | −9 | −12 | 0.60 | 36 | |
| L Superior Temporal gyrus | 41 | −45 | −30 | 15 | 0.62 | 29 | |
| Slow‐5 (0.010–0.027 Hz) | |||||||
| Negative correlation | |||||||
| L Pre‐SMA | 6 | −3 | 3 | 59 | −0.68 | 66 | |
| R Insula | 13 | 33 | 21 | 2 | −0.60 | 67 | |
| R Cingulate Motor Area | 32 | 10 | 12 | 39 | −0.62 | 35 | |
| L Putamen | −26 | 9 | −2 | −0.66 | 13 | ||
| Positive correlation | |||||||
| L Occipital Lobe | 18 | −30 | −92 | −12 | 0.68 | 22 | |
| R Superior Temporal Gyrus | 22 | 60 | −51 | 18 | 0.57 | 10 | |
| L Superior Temporal Gyrus | 22 | −54 | −57 | 15 | 0.58 | 12 | |
| L Inferior Parietal Lobule | 40 | −42 | −38 | 54 | 0.59 | 11 | |
| L Cerebellum, Posterior Lobe | −42 | −66 | −42 | 0.59 | 26 | ||
Brain regions showing significant correlation between ALFF and UPDRS motor scores in PD patients in each frequency band (multiple regression analysis, P < 0.05, FWE corrected). Abbreviations: L, left; R, right; pre‐SMA, rostral supplementary motor area.
In the slow‐4 band, the putamen and cerebellum showed negative correlation, while the PMC, inferior frontal gyrus, postcentral gyrus, paracentral lobule, supramarginal gyrus, posterior cingulate gyrus, superior temporal gyrus, and middle temporal gyrus showed positive correlations between ALFF and disease duration in PD. In the slow‐5 band, there was no area that showed negative correlation, while the inferior frontal gyrus, postcentral gyrus, paracentral lobule, superior parietal lobule, postcentral gyrus, insula, middle temporal gyrus, superior temporal gyrus had positive correlations between ALFF and disease duration in PD patients (Fig. 7 and Table 5; multiple regression analysis, P < 0.05, FWE corrected).
Figure 7.

The results of correlation between ALFF and disease duration in PD patients. The correlation between ALFF and disease duration in the slow‐4 band (A), and slow‐5 band (B). Correlation analysis, P < 0.05, FWE corrected. Hot and cold colors indicate positive and negative correlation, respectively. L, left; R, right. CB, cerebellum; IFG, inferior frontal gyrus; MTG, middle temporal gyrus; PG, precentral gyrus; PL, paracentral lobule; PMC, premotor cortex; Pu, putamen; STG, superior temporal gyrus.
Table 5.
Correlation between ALFF and disease duration in PD patients
| MNI coordinates | |||||||
|---|---|---|---|---|---|---|---|
| Frequency band | Brain region | Brodmann area | x | y | z | t value | Cluster size |
| Slow‐4 (0.027–0.073 Hz) | |||||||
| Negative correlation | |||||||
| L Putamen | −24 | −15 | 6 | −0.59 | 12 | ||
| R Putamen | 27 | −15 | 6 | −0.64 | 11 | ||
| R Cerebellum, Posterior Lobe | 6 | −75 | −42 | −0.65 | 12 | ||
| R Cerebellum, Posterior Lobe | 12 | −69 | −39 | −0.61 | 10 | ||
| Positive correlation | |||||||
| L Superior Temporal Gyrus | −54 | −18 | −3 | 0.57 | 16 | ||
| L PMC | 6 | −30 | −9 | 48 | 0.66 | 31 | |
| R Paracentral Lobule | 6 | 3 | −33 | 60 | 0.68 | 31 | |
| R Middle Temporal Gyrus | 21 | 66 | −9 | −15 | 0.64 | 24 | |
| L Posterior Cingulate Gyrus | 30 | −12 | −63 | 9 | 0.55 | 11 | |
| R Superior Temporal Gyrus | 38 | 39 | 21 | −33 | 0.74 | 18 | |
| L Supramarginal Gyrus | 40 | −60 | −51 | 33 | 0.60 | 10 | |
| L Postcentral Gyrus | 40 | −33 | −48 | 58 | 0.76 | 202 | |
| R Inferior Frontal Gyrus | 47 | 36 | 27 | 3 | 0.57 | 22 | |
| Slow‐5 (0.010–0.027 Hz) | |||||||
| Positive correlation | |||||||
| R Inferior Frontal Gyrus | 36 | 32 | 9 | 0.80 | 65 | ||
| R Postcentral Gyrus | 3 | 27 | −30 | 72 | 0.74 | 81 | |
| R Paracentral Lobule | 6 | 3 | −33 | 60 | 0.66 | 185 | |
| R Superior Parietal Lobule | 7 | 21 | −51 | 63 | 0.55 | 11 | |
| L Postcentral Gyrus | 7 | −24 | −51 | 69 | 0.75 | 104 | |
| L Insula | 13 | −35 | 20 | 14 | 0.65 | 16 | |
| R Middle Temporal Gyrus | 21 | 69 | −9 | −15 | 0.64 | 15 | |
| L Superior Temporal Gyrus | 22 | −60 | −33 | 9 | 0.62 | 21 | |
Brain regions showing significant correlation between ALFF and disease duration in PD patients in each frequency band (multiple regression analysis, P < 0.05, FWE corrected). Abbreviations: L, left; R, right; PMC, premotor cortex.
In the slow‐4 band, the thalamus and cerebellum had negative correlation, while the postcentral gyrus, precuneus, inferior parietal lobule, middle frontal gyrus, insula, middle temporal gyrus, superior temporal gyrus, and anterior cingulate gyrus showed positive correlation between ALFF and age in PD. In the slow‐5 band, the cerebellum, precentral gyrus, rectal gyrus, middle occipital gyrus, and middle temporal gyrus showed negative correlation, while the precuneus, superior frontal gyrus, medial frontal gyrus, middle frontal gyrus, insula, temporal lobe, and posterior cingulate gyrus had positive correlation between ALFF and age in PD (Fig. 8 and Table 6; multiple regression analysis, P < 0.05, FWE corrected).
Figure 8.
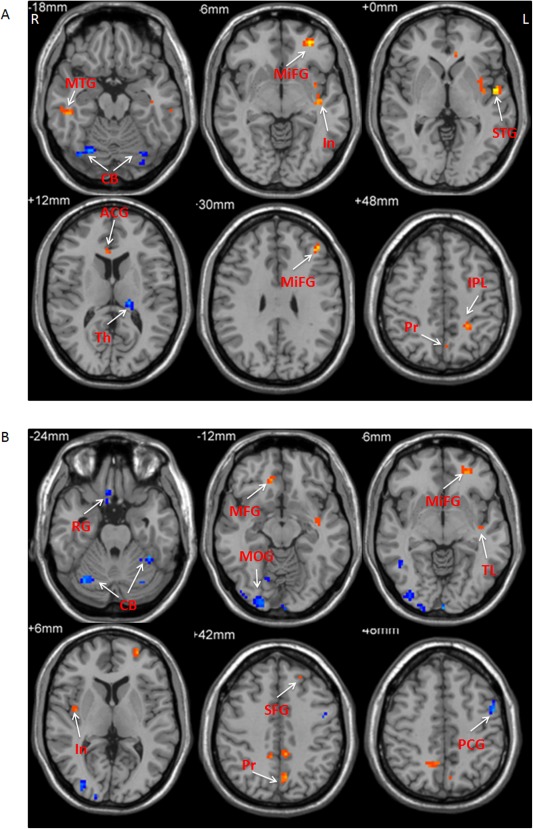
The results of correlation between ALFF and age in PD patients. The correlation between ALFF and age in the slow‐4 band (A), and slow‐5 band (B). Correlation analysis, P < 0.05, FWE corrected. Hot and cold colors indicate positive and negative correlation, respectively. L, left; R, right. ACG, anterior cingulate gyrus; CB, cerebellum; In, insula; IPL, inferior parietal lobule; MFG, medial frontal gyrus; MiFG, middle frontal gyrus; MOG, middle occipital gyrus; MTG, middle temporal gyrus; PCG, precentral gyrus; Pr, precuneus; PG, precentral gyrus; PMC, premotor cortex; RG, rectal gyrus; SFG, superior frontal gyrus; STG, superior temporal gyrus; Th, thalamus; TL, temporal lobe.
Table 6.
Correlation between ALFF and age in PD patients
| MNI coordinates | |||||||
|---|---|---|---|---|---|---|---|
| Frequency band | Brain region | Brodmann area | x | y | z | t value | Cluster size |
| Slow‐4 (0.027–0.073 Hz) | |||||||
| Negative correlation | |||||||
| L Thalamus, Pulvinar | −18 | −27 | 12 | −0.58 | 11 | ||
| L Cerebellum, Posterior Lobe | −30 | −72 | −21 | −0.58 | 20 | ||
| R Cerebellum, Posterior Lobe | 27 | −72 | −21 | −0.60 | 51 | ||
| Positive correlation | |||||||
| L Postcentral Gyrus | 5 | −9 | −48 | 69 | 0.59 | 21 | |
| L Precuneus | 7 | −3 | −63 | 45 | 0.55 | 13 | |
| L Inferior Parietal Lobule | 7 | −27 | −48 | 45 | 0.61 | 20 | |
| L Middle Frontal Gyrus | 10 | −39 | 36 | 27 | 0.67 | 20 | |
| L Middle Frontal Gyrus | 11 | −30 | 48 | −6 | 0.65 | 39 | |
| L Insula | 13 | −39 | −12 | −9 | 0.68 | 56 | |
| R Middle Temporal Gyrus | 21 | 57 | −27 | −15 | 0.62 | 17 | |
| L Middle Temporal Gyrus | 21 | −60 | −27 | −15 | 0.66 | 20 | |
| L Superior Temporal Gyrus | 22 | −54 | −6 | 0 | 0.68 | 17 | |
| L Anterior Cingulate Gyrus | 24 | −6 | 33 | 3 | 0.56 | 12 | |
| Slow‐5 (0.010–0.027 Hz) | |||||||
| Negative correlation | |||||||
| L PrecentralGyrus | 6 | −51 | 0 | 48 | −0.66 | 14 | |
| R Rectal Gyrus | 11 | 3 | 33 | −30 | −0.70 | 83 | |
| R Middle Occipital Gyrus | 18 | 36 | −87 | −3 | −0.60 | 127 | |
| R Middle Temporal Gyrus | 37 | 51 | −57 | 0 | −0.56 | 14 | |
| L Cerebellum, Posterior Lobe | −24 | −72 | −18 | −0.69 | 38 | ||
| R Cerebellum, Posterior Lobe | 6 | −73 | −40 | −0.62 | 23 | ||
| R Cerebellum, Posterior Lobe | 30 | −66 | −21 | −0.74 | 71 | ||
| Positive correlation | |||||||
| L Precuneus | 7 | −6 | −66 | 42 | 0.57 | 17 | |
| R Precuneus | 7 | 15 | −57 | 48 | 0.56 | 24 | |
| L Superior Frontal Gyrus | 9 | −15 | 45 | 30 | 0.60 | 12 | |
| R Medial Frontal Gyrus | 10 | 12 | 36 | −12 | 0.56 | 11 | |
| L Superior Frontal Gyrus | 10 | −24 | 54 | 3 | 0.62 | 28 | |
| L Middle Frontal Gyrus | 11 | −27 | 45 | −6 | 0.59 | 17 | |
| R Insula | 13 | 39 | −6 | 6 | 0.55 | 13 | |
| L Temporal Lobe | 21 | −39 | −12 | −9 | 0.57 | 15 | |
| R Posterior Cingulate Gyrus | 31 | 9 | −45 | 39 | 0.59 | 15 | |
Brain regions showing significant correlation between ALFF and age in PD patients in each frequency band (multiple regression analysis, P < 0.05, FWE corrected). Abbreviations: L, left; R, right.
Interaction analyses between the covariates of UPDRS motor score and disease duration, as well as between the covariates of UPDRS motor score and age did not show any significant results (P < 0.05, FWE corrected).
In the slow‐4 band, the precuneus, middle temporal gyrus, and parahippocampal gyrus had negative correlation, while the precentral gyrus, superior frontal gyrus, medial frontal gyrus, fusiform gyrus, middle frontal gyrus, caudate nucleus, and cerebellum showed positive correlation between ALFF and levodopa dose in PD. In the slow‐5 band, the SMA and middle temporal gyrus had negative correlation, while the inferior parietal lobule, medial frontal gyrus, superior frontal gyrus, inferior frontal gyrus, insula, uncus, superior temporal gyrus, inferior frontal gyrus, caudate nucleus, parahippocampal gyrus, and cerebellum showed positive correlation between ALFF and levodopa dose in PD (Fig. 9 and Table 7; correlation analysis, P < 0.05, FWE corrected).
Figure 9.
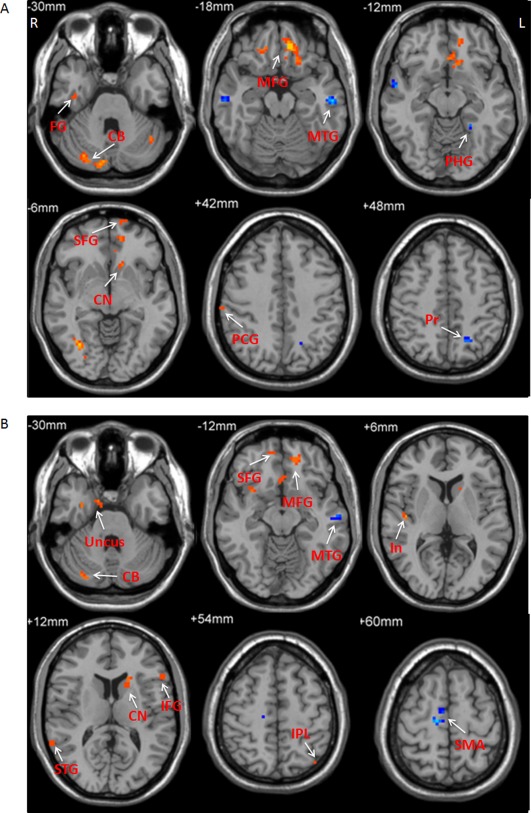
The results of correlation between ALFF and dosage of levodopa in PD patients. The correlation between ALFF and dosage of levodopa in the slow‐4 band (A), and slow‐5 band (B). Correlation analysis, P < 0.05, FWE corrected. Hot and cold colors indicate positive and negative correlation, respectively. L, left; R, right. CB, cerebellum; CN, caudate nucleus; FG, fusiform gyrus; In, insula; IFG, inferior frontal gyrus; IPL, inferior parietal lobule; MFG, medial frontal gyrus; MTG, middle temporal gyrus; PCG, precentral gyrus; PHG, parahippocampal gyrus; Pr, precuneus; SFG, superior frontal gyrus; SMA, supplementary motor area; STG, superior temporal gyrus.
Table 7.
Correlation between ALFF and L‐dopa dose in PD patients
| MNI coordinates | |||||||
|---|---|---|---|---|---|---|---|
| Frequency band | Brain region | Brodmann area | x | y | z | t value | Cluster size |
| Slow‐4 (0.027–0.073 Hz) | |||||||
| Negative correlation | |||||||
| L Precuneus | 7 | −18 | −60 | 48 | −0.56 | 13 | |
| L Middle Temporal Gyrus | 21 | −57 | −18 | −18 | −0.60 | 19 | |
| L Parahippocampal Gyrus | 37 | −24 | −45 | −12 | −0.55 | 10 | |
| Positive correlation | |||||||
| R Precentral Gyrus | 4 | 60 | −21 | 39 | 0.57 | 13 | |
| L Superior Frontal Gyrus | 10 | −18 | 69 | 0 | 0.58 | 39 | |
| R Superior Frontal Gyrus | 10 | 30 | 60 | 18 | 0.55 | 12 | |
| R Medial Frontal Gyrus | 11 | 6 | 24 | 9 | 0.63 | 148 | |
| R Fusiform Gyrus | 20 | 39 | −24 | −24 | 0.55 | 21 | |
| R Middle Frontal Gyrus | 47 | 21 | 36 | −18 | 0.56 | 13 | |
| L Caudate Nucleus | −12 | 19 | −6 | 0.57 | 15 | ||
| L Cerebellum, Posterior Lobe | −42 | −57 | −33 | 0.57 | 16 | ||
| R Cerebellum, Posterior Lobe | 9 | −84 | −27 | 0.60 | 67 | ||
| Slow‐5 (0.010–0.027 Hz) | |||||||
| Negative correlation | |||||||
| R SMA | 6 | 10 | −15 | 58 | −0.62 | 32 | |
| L Middle Temporal Gyrus | 21 | −60 | −18 | −15 | −0.56 | 16 | |
| Positive correlation | |||||||
| L Inferior Parietal Lobule | 7 | −39 | −66 | 45 | 0.55 | 16 | |
| L Medial Frontal Gyrus | 10 | −10 | 42 | −14 | 0.58 | 68 | |
| R Superior Frontal Gyrus | 11 | 15 | 54 | −15 | 0.56 | 14 | |
| R Inferior Frontal Gyrus | 13 | 33 | 12 | −12 | 0.55 | 17 | |
| R Insula | 13 | 45 | −15 | 6 | 0.58 | 10 | |
| R Uncus | 20 | 27 | −6 | −36 | 0.61 | 16 | |
| R Superior Temporal Gyrus | 22 | 66 | −48 | 15 | 0.56 | 11 | |
| L Inferior Frontal Gyrus | 45 | −54 | 33 | 15 | 0.55 | 18 | |
| L Caudate Nucleus | −15 | 15 | 9 | 0.57 | 16 | ||
| L Parahippocampal Gyrus | −24 | −12 | −24 | 0.56 | 37 | ||
| R Cerebellum, Posterior Lobe | 33 | −78 | −33 | 0.60 | 15 | ||
Brain regions showing significant correlation between ALFF and levodopa dose in PD patients in each frequency band (multiple regression analysis, P < 0.05, FWE corrected). Abbreviations: L, left; R, right; SMA, supplementary motor area.
In addition, we found that the ALFF in the pre‐SMA had negative correlation with the bradykinesia subscale scores in both slow‐4 and slow‐5 bands in PD (−0.79 and −0.75, respectively; Fig. 10).
Figure 10.
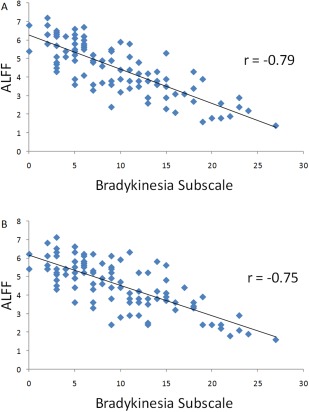
The results of correlation between ALFF in the pre‐SMA and bradykinesia subscale in PD patients. The correlation between ALFF in the pre‐SMA and bradykinesia subscale scores in the slow‐4 band (A), and slow‐5 band (B). [Color figure can be viewed in the online issue, which is available at http://wileyonlinelibrary.com.]
DISCUSSION
In this study, we investigated spontaneous neural activity changes in a large cohort of PD patients in different frequency bands (slow‐4 and slow‐5). We found that PD‐related neural activity changes in the brainstem or striatum can be identified in each band. However, the pattern of spontaneous neural activity is different in these two frequency bands. Most importantly, PD‐related neural activity changes in the basal ganglia or brainstem are significantly greater in the slow‐4 band than those in the slow‐5 band.
Our findings demonstrate that with a large cohort of patients, PD‐related neural activity changes in the brainstem or basal ganglia can be clearly detected. The advantage of using a large sample size is not only increasing the power but also minimizing the effect of diverse clinical features, for example, phenotype or symptom severity. Most previous imaging studies on PD were with a small sample size. Thus, it is not surprising to find inconsistent results frequently, and neural changes in the brainstem or basal ganglia have not always been observed in previous fMRI studies on PD. Large cohorts are clearly better for reliability, particularly for small changes.
Frequency effect analysis showed that the ALFF was higher in the striatum and midbrain, but was lower in the medial frontal gyrus, posterior cingulate cortex, and precuneus in the slow‐4 than in the slow‐5 band (Fig. 3, Table 3), which is consistent with previous reports [Han et al., 2010; Zuo et al., 2010]. There was significant difference of PD‐related activity between the two bands (Fig. 2, Table 2). Moreover, the decreased activity in the striatum and increased activity in the midbrain in PD are more significant in the slow‐4 band than that in the slow‐5 band. These findings suggest that a properly chosen frequency band can be helpful to more sensitively explore PD‐related neural changes.
In PD, the dopamine uptake is reduced in the striatum [Brooks et al., 1990]. The decreased ALFF in the striatum is likely a reflection of dysfunction in this region. However, a recent study did not find reduced ALFF in the striatum in PD in either slow‐4 or slow‐5 band [Zhang et al., 2013]. In contrast, the authors found higher ALFF in the caudate nucleus in PD patients compared to controls in the slow‐5 band. These results are inconsistent with our findings, as well as several previous reports [Skidmore et al., 2013; Wen et al., 2013; Wu et al., 2009; Yang et al., 2013]. That study [Zhang et al. 2013] also had a relatively large cohort of patients (72 PD patients), thus, the contradictory findings are unlikely due to sample size, various phenotype, or symptom severity of the patients. The authors did not clarify whether their patients were scanned after levodopa has been withdrawn for at least 12 h. Several previous studies have shown that levodopa administration can normalize activity pattern in PD, including increasing the activity in the striatum [Kraft et al., 2009; Martinu et al., 2012; Schwingenschuh et al., 2013; Wu et al., 2009]. We suppose that a possible reason is the scanning in that study [Zhang et al., 2013] was performed when levodopa was not withdrawn for a considerable period, which may contribute to the difficulty in detection of neural changes in the striatum.
The enhanced ALFF in the midbrain did not involve the substantia nigra, but included extensive other areas, like the red nucleus and ventral tegmental area (Fig. 2). It is possible that this increased activity might be attempting to compensate for the dysfunction of the substantia nigra. The red nucleus receives significant projections from ipsilateral motor cortex and contralateral cerebellum [Habas and Cabanis, 2007]. Animal studies showed that red nucleus output provides important compensation after corticospinal lesions [Belhaj‐Saif and Cheney, 2000; Kanagal and Muir, 2009]. It has been suggested that the red nucleus might increase its function to fulfill cerebellar compensation in the presence of basal ganglia dysfunction in PD [Lewis et al., 2013].
Extensive studies have demonstrated that different cell groups within the dopaminergic system display different susceptibilities to cell death. Degeneration of the dopamine neurons in the substantia nigra is the most prominent; in contrast, dopamine neurons in the ventral tegmental area are much less affected [Braak et al., 2004; Damier et al., 1999; Hirsch et al., 1988]. The dopamine depletion can trigger sprouting of collateral dopaminergic terminals [Finkelstein et al., 2000; Song and Haber, 2000]. It is possible that PD patients may use the relatively spared ventral tegmental area to compensate for the dysfunction of the substantia nigra. These findings also suggest that ALFF has the potential to be used as a biomarker to detect pathological changes in PD.
Another significant finding is that the correlation between spontaneous neural activity and UPDRS motor scores showed different pattern in each frequency band. The negative correlation between the ALFF and UPDRS motor scores in the basal ganglia and substantia nigra is more obvious at the slow‐4 band than that in the slow‐5 band. In contrast, the positive correlation in the cerebellum is significant in the slow‐5 band but is not in slow‐4 band. Negative/positive correlation indicates that as the severity of symptoms increases, the neural activity in the brain regions becomes less/more. It is likely that in PD, disorder progression‐related pathological neural modulations in the substantia nigra and basal ganglia can be more sensitively detected in the slow‐4 band, whereas progression‐related compensatory efforts in the cerebellum may be more clearly shown at the slow‐5 band.
The oscillations within the slow‐5 band (0.010–0.027 Hz) have been found in the cerebral cortex [Aladjalova, 1957; Norton and Jewett, 1965; Novak et al., 1992], whereas the oscillations within the slow‐4 band (0.027–0.073 Hz) have been observed in the basal ganglia [Ruskin et al., 1999]. However, one brain region may present multiple oscillations belonging to different frequency bands. Evidence from animal and human studies found the existence of synchronized oscillations within different nuclei of the basal ganglia, for example, the subthalamic nucleus, the external and internal portions of the globus pallidus, at frequencies ranging from 0.01 to 300 Hz [Gatev et al., 2006]. Moreover, the relationship between neuronal synchronized oscillatory activity and BOLD signal frequency remains unclear. Therefore, the underlying physiological mechanism why the slow‐4 band can be more prominent in detecting PD‐related neural changes in the brainstem and basal ganglia than in the slow‐5 band is difficult to explain from this study. In addition, the reason why the pattern of correlation between neural activity and disease severity is different, or even reversed at some regions, for example, the insula (Fig. 6 and Table 4), is also unclear. The physiological mechanisms and significance of these findings need further investigation, possibly with combination of fMRI, electrophysiological, and pathological methods.
Difference of neural activity between PD patients and controls was not detected in the substantia nigra in either studied band. A possible reason is that the frequency bands used in this study may not be optimal to explore neural activity in the substantia nigra. In vivo, the firing rate of substantia nigra dopamine neurons ranges from 0.5 Hz to approximately 10 Hz, with an average around 4.5 Hz [Grace and Bunney, 1984]. With a faster TR of fMRI scanning, for example, 300 or 400 ms, the frequency band being examined can achieve more than 1 Hz. In future studies, we will examine whether scanning with a faster TR can improve the detection of PD‐related neural activity in the substantia nigra.
We found negative correlation between ALFF and disease duration in the bilateral putamen in the slow‐4 band, but not in the slow‐5 band (Fig. 7 and Table 5). This finding indicates that as disease duration is prolonged, the neural activity in the putamen is more decreased, and this phenomenon can be more sensitively detected in the slow‐4 band. However, most of the correlation results between ALFF and disease duration and age (Figs. 7 and 8; Tables 5 and VI) are different from that between ALFF and UPDRS motor scores (Fig. 6 and Table 4). Moreover, the interaction analyses between the covariates of UPDRS motor score, disease duration, and age did not show any significant results. Therefore, disease duration and normal aging have no significant contribution to the effects of disease severity on ALFF.
We also found that the dose of levodopa has effects on ALFF in several regions (Fig. 9 and Table 7). In both the slow‐4 and slow‐5 bands, the ALFF at the caudate nucleus showed positive correlation with levodopa dose, which indicates that administration of levodopa could increase the neural activity in the striatum. Levodopa induced modulations of neural activity changes in PD can be detected in both slow‐4 and slow‐5 bands.
Besides the midbrain and striatum, we also found some other characteristic changes in PD. One is decreased ALFF in the pre‐SMA (Fig. 1). Pre‐SMA is suggested to be critical in planning and initiation of movements, particularly for those internally generated [Jenkins et al., 2000; Tanji and Hoshi, 2001]. In PD patients, the hypoactivation in the SMA during tasks requiring motor selection and initiation [Buhmann et al., 2003; Haslinger et al., 2001; Jahanshahi et al., 1995; Wu et al., 2010], or in the resting state [Wu et al., 2009] has been extensively reported. This hypoactivation could be relatively normalized after the administration of levodopa [Buhmann et al., 2003; Haslinger et al., 2001; Wu et al., 2009], or deep brain stimulation of the subthalamic nucleus [Grafton et al., 2006]. Our finding that the ALFF in the pre‐SMA negatively correlated with the bradykinesia subscale (Fig. 10) suggests the dysfunction of the pre‐SMA, likely due to the deficit of nigrostriatal dopamine system, is an important reason contributing to the difficulty in initiation of movements in PD [Grafton, 2004].
Another feature is enhanced ALFF in PD in some brain regions besides the midbrain, for example, the cerebellum (Fig. 1). The cerebellum and basal ganglia have reciprocal connections [Bostan et al., 2010; Hoshi et al., 2005], and have distinct loops connecting with largely overlapping cortical areas [Middleton and Strick, 2000]. The cerebellum is known to influence motor and cognitive operations via the cerebello‐thalamo‐cortical circuits [Middleton and Strick, 2001]. Hyperactivation in the cerebellum in PD has been commonly explained as a functional compensation for the defective basal ganglia [Catalan et al., 1999; Rascol et al., 1997; Wu and Hallett, 2005] but may also reflect a primary pathophysiological change of PD [Mink, 1996; Wu and Hallett, 2013].
A limitation of this study is that most of our patients did not receive PET/SPECT scanning for dopaminergic function, thus, we cannot correlate ALFF in the brainstem and striatum to dopaminergic deficits. Another problem is that the relationship between neuronal synchronized oscillatory activity and BOLD signal frequency remains unclear, and BOLD signal should reflect the activity from all types of neurons in the area; therefore, it is impossible to relate the specific bands of ALFF to specific types of neurons based on current knowledge. Future studies with combination of fMRI, electrophysiological, and pathological methods may help to answer these problems.
In conclusion, our study demonstrates that with a large cohort of patients, PD‐related spontaneous neural activity in the brainstem and basal ganglia can be clearly detected. Most importantly, we found that the abnormalities of activity in the brainstem and basal ganglia in PD patients are more robust in certain frequency bands. Our findings suggest that the use of specific frequency bands will be helpful in detection of neural changes in PD, which should be considered in future investigations.
REFERENCES
- Aladjalova NA (1957): Intra‐slow rhythmic oscillations of the steady potential of the cerebral cortex. Nature 179:957–959. [DOI] [PubMed] [Google Scholar]
- Belhaj‐Saif A, Cheney PD (2000): Plasticity in the distribution of the red nucleus output to forearm muscles after unilateral lesions of the pyramidal tract. J Neurophysiol 83:3147–3153. [DOI] [PubMed] [Google Scholar]
- Biswal B, Yetkin FZ, Haughton VM, Hyde JS (1995): Functional connectivity in the motor cortex of resting human brain using echo‐planar MRI. Magn Reson Med 34:537–541. [DOI] [PubMed] [Google Scholar]
- Bostan AC, Dum RP, Strick PL (2010): The basal ganglia communicate with the cerebellum. Proc Natl Acad Sci USA 107:8452–8456. [DOI] [PMC free article] [PubMed] [Google Scholar]
- Braak H, Del Tredici K, Rüb U, de Vos RA, Jansen Steur EN, Braak E (2003): Staging of brain pathology related to sporadic Parkinson's disease. Neurobiol Aging 24:197–211. [DOI] [PubMed] [Google Scholar]
- Braak H, Ghebremedhin E, Rub U, Bratzke H, Del Tredici K (2004): Stages in the development of Parkinson's disease‐related pathology. Cell Tissue Res 318:121–134. [DOI] [PubMed] [Google Scholar]
- Brooks DJ, Ibanez V, Sawle GV, Quinn N, Lees AJ, Mathias CJ, Bannister R, Marsden CD, Frackowiak RS (1990): Differing patterns of striatal 18F‐dopa uptake in Parkinson's disease, multiple system atrophy, and progressive supranuclear palsy. Ann Neurol 28:547–555. [DOI] [PubMed] [Google Scholar]
- Buhmann C, Glauche V, Sturenburg HJ, Oechsner M, Weiller C, Büchel C (2003): Pharmacologically modulated fMRI—Cortical responsiveness to levodopa in drug‐naÿve hemiparkinsonian patients. Brain 126:451–461. [DOI] [PubMed] [Google Scholar]
- Buzsáki G, Draguhn A (2004): Neuronal oscillations in cortical networks. Science 304:1926–1929. [DOI] [PubMed] [Google Scholar]
- MJ Catalan, K Ishii, M Honda, A Samii, A Hallett (1999): PET study of sequential finger movements of varying length in patients with Parkinson's disease. Brain 122:483–495. [DOI] [PubMed] [Google Scholar]
- Choe IH, Yeo S, Chung KC, Kim SH, Lim S (2013): Decreased and increased cerebral regional homogeneity in early Parkinson's disease. Brain Res 1527:230–127. [DOI] [PubMed] [Google Scholar]
- Damier P, Hirsch EC, Agid Y, Graybiel AM (1999): The substantia nigra of the human brain: II. Patterns of loss of dopamine‐containing neurons in Parkinson's disease. Brain 122:1437–1448. [DOI] [PubMed] [Google Scholar]
- Eidelberg D (2009): Metabolic brain networks in neurodegenerative disorders: A functional imaging approach. Trends Neurosci 32:548–557. [DOI] [PMC free article] [PubMed] [Google Scholar]
- F Esposito, A Tessitore, A Giordano, R De Micco, A Paccone, R Conforti, G Pignataro, L Annunziato, G Tedeschi (2013): Rhythm‐specific modulation of the sensorimotor network in drug‐naive patients with Parkinson's disease by levodopa. Brain 136:710–725. [DOI] [PubMed] [Google Scholar]
- Finkelstein DI, Stanic D, Parish CL, Tomas D, Dickson K, Horne MK (2000): Axonal sprouting following lesions of the rat substantia nigra. Neuroscience 97:99–112. [DOI] [PubMed] [Google Scholar]
- Gatev P, Darbin O, Wichmann T (2006): Oscillations in the basal ganglia under normal conditions and in movement disorders. Mov Disord 21:1566–1577. [DOI] [PubMed] [Google Scholar]
- Grace AA, Bunney BS (1984): The control of firing pattern in nigral dopamine neurons: Burst firing. J Neurosci 4:2877–2890. [DOI] [PMC free article] [PubMed] [Google Scholar]
- Grafton ST (2004): Contributions of functional imaging to understanding parkinsonian symptoms. Curr Opin Neurobiol 14:715–719. [DOI] [PubMed] [Google Scholar]
- Grafton ST, Turner RS, Desmurget M, Bakay R, Delong M, Vitek J, Crutcher M (2006): Normalizing motor‐related brain activity: Subthalamic nucleus stimulation in Parkinson disease. Neurology 66:1192–1199. [DOI] [PubMed] [Google Scholar]
- Habas C, Cabanis EA (2007): Cortical projection to the human red nucleus: Complementary results with probabilistic tractography at 3 T. Neuroradiology 49:777–784. [DOI] [PubMed] [Google Scholar]
- Han Y, Wang J, Zhao Z, Min B, Lu J, Li K, He Y, Jia J (2010): Frequency‐dependent changes in the amplitude of low‐frequency fluctuations in amnestic mild cognitive impairment: A resting‐state fMRI study. NeuroImage 55:287–295. [DOI] [PubMed] [Google Scholar]
- Haslinger B, Erhard P, Kampfe N, Boecker H, Rummeny E, Schwaiger M, Conrad B, Ceballos‐Baumann AO (2001): Event‐related functional magnetic resonance imaging in Parkinson's disease before and after levodopa. Brain 124:558–570. [DOI] [PubMed] [Google Scholar]
- Hirsch E, Graybiel AM, Agid YA (1988): Melanized dopaminergic neurons are differentially susceptible to degeneration in Parkinson's disease. Nature 334:345–348. [DOI] [PubMed] [Google Scholar]
- Hoehn MM, Yahr MD (1967): Parkinsonism: Onset, progression and mortality. Neurology 17:427–442. [DOI] [PubMed] [Google Scholar]
- Hoshi E, Tremblay L, Féger J, Carras PL, Strick PL (2005): The cerebellum communicates with the basal ganglia. Nat Neurosci 8:1491–1493. [DOI] [PubMed] [Google Scholar]
- Hughes AJ, Daniel SE, Kilford L, Lees AJ (1992): Accuracy of clinical diagnosis of idiopathic Parkinson's disease: A clinico‐pathological study of 100 cases. J Neurol Neurosurg Psychiatry 55:181–184. [DOI] [PMC free article] [PubMed] [Google Scholar]
- Jahanshahi M, Jenkins IH, Brown RG, Marsden CD, Passingham RE, Brooks DJ (1995): Self‐initiated versus externally triggered movements. I. An investigation using measurement of regional cerebral blood flow with PET and movement‐related potentials in normal and Parkinson's disease subjects. Brain 118:913–933. [DOI] [PubMed] [Google Scholar]
- Jenkins IH, Jahanshahi M, Jueptner M, Passingham RE, Brooks DJ (2000): Self‐initiated versus externally triggered movements. II. The effect of movement predictability on regional cerebral blood flow. Brain 123:1216–1228. [DOI] [PubMed] [Google Scholar]
- Kanagal SG, Muir GD (2009): Task‐dependent compensation after pyramidal tract and dorsolateral spinal lesions in rats. ExpNeurol 216:193–206. [DOI] [PubMed] [Google Scholar]
- Kraft E, Loichinger W, Diepers M, Lule D, Schwarz J, Ludolph AC, Storch A (2009): Levodopa‐induced striatal activation in Parkinson's disease: A functional MRI study. Parkinsonism Relat Disord 15:558–563. [DOI] [PubMed] [Google Scholar]
- Krings T, Schreckenberger M, Rohde V, Spetzger U, Sabri O, Reinges MH, Hans FJ, Meyer PT, Möller‐Hartmann W, Gilsbach JM, Buell U, Thron A (2002): Functional MRI and 18F FDG‐positron emission tomography for presurgical planning: Comparison with electrical cortical stimulation. Acta Neurochir (Wien) 144:889–899. [DOI] [PubMed] [Google Scholar]
- Kwak Y, Peltier S, Bohnen N, Müller M, Dayalu P, Seidler RD (2010): Altered resting state cortico‐striatal connectivity in mild to moderate stage Parkinson's disease. Front Syst Neurosci 4:143. [DOI] [PMC free article] [PubMed] [Google Scholar]
- Kwak Y, Peltier SJ, Bohnen NI, Müller ML, Dayalu P, Seidler RD (2012): L‐DOPA changes spontaneous low‐frequency BOLD signal oscillations in Parkinson's disease: A resting state fMRI study. Front Syst Neurosci 6:52. [DOI] [PMC free article] [PubMed] [Google Scholar]
- Lang AE, Fahn S (1989): Assessment of Parkinson's disease In: Munsat TL, editor. Quantification of Neurological Deficit. Boston: Butterworths; pp 285–309. [Google Scholar]
- Lewis MM, Du G, Kidacki M, Patel N, Shaffer ML, Mailman RB, Huang X (2013): Higher iron in the red nucleus marks Parkinson's dyskinesia. Neurobiol Aging 34:1497–1503. [DOI] [PMC free article] [PubMed] [Google Scholar]
- Ma Y, Tang C, Spetsieris PG, Dhawan V, Eidelberg D (2007): Abnormal metabolic network activity in Parkinson's disease: Test‐retest reproducibility. J Cereb Blood Flow Metab 27:597–605. [DOI] [PMC free article] [PubMed] [Google Scholar]
- Martinu K, Degroot C, Madjar C, Strafella AP, Monchi O (2012): Levodopa influences striatal activity but does not affect cortical hyper‐activity in Parkinson's disease. Eur J Neurosci 35:572–583. [DOI] [PubMed] [Google Scholar]
- Middleton FA, Strick PL (2000): Basal ganglia and cerebellar loops: Motor and cognitive circuits. Brain Res Brain Res Rev 31:236–250. [DOI] [PubMed] [Google Scholar]
- Middleton FA, Strick PL (2001): Cerebellar projections to the prefrontal cortex of the primate. J Neurosci 21:700–712. [DOI] [PMC free article] [PubMed] [Google Scholar]
- Mink J (1996): The basal ganglia: Focused selection and inhibition of competing motor programs. Prog Neurobiol 50:381–425. [DOI] [PubMed] [Google Scholar]
- Norton S, Jewett RE (1965): Frequencies of slow potential oscillations in the cortex of cats. Electroencephalogr Clin Neurophysiol 19:377–386. [DOI] [PubMed] [Google Scholar]
- Novak P, Lepicovska V, Dostalek C (1992): Periodic amplitude modulation of EEG. Neurosci Lett 136:213–215. [DOI] [PubMed] [Google Scholar]
- Nyquist H (1928): Certain topics in telegraph transmission theory. Trans Am Inst Electr Eng 47:617–644. [Google Scholar]
- Oldfield RC (1971): The assessment and analysis of handedness: The Edinburgh inventory. Neuropsychologia 9:97–113. [DOI] [PubMed] [Google Scholar]
- Penttonen M, Buzsáki G (2003): Natural logarithmic relationship between brain oscillators. Thalamus Relat Syst 2:145–152. [Google Scholar]
- O Rascol, U Sabatini, N Fabre, C Brefel, I Loubinoux, P Celsis, JM Senard, JL Montastruc, F Chollet (1997): The ipsilateral cerebellar hemisphere is overactive during hand movements in akinetic parkinsonian patients. Brain 120:103–110. [DOI] [PubMed] [Google Scholar]
- Ruskin DN, Bergstrom DA, Kaneoke Y, Patel BN, Twery MJ, Walters JR (1999): Multisecond oscillations in firing rate in the basal ganglia: Robust modulation by dopamine receptor activation and anesthesia. J Neurophysiol 81:2046–2055. [DOI] [PubMed] [Google Scholar]
- Schwingenschuh P, Katschnig P, Jehna M, Koegl‐Wallner M, Seiler S, Wenzel K, Ropele S, Langkammer C, Gattringer T, Svehlík M, Ott E, Fazekas F, Schmidt R, Enzinger C (2013): Levodopa changes brain motor network function during ankle movements in Parkinson's disease. J Neural Transm 120:423–433. [DOI] [PubMed] [Google Scholar]
- Skidmore FM, Yang M, Baxter L, von Deneen K, Collingwood J, He G, Tandon R, Korenkevych D, Savenkov A, Heilman KM, Gold M, Liu Y (2013): Apathy, depression, and motor symptoms have distinct and separable resting activity patterns in idiopathic Parkinson disease. Neuroimage 81:484–495. [DOI] [PubMed] [Google Scholar]
- Song DD, Haber SN (2000): Striatal responses to partial dopaminergic lesion: Evidence for compensatory sprouting. J Neurosci 20:5102–5114. [DOI] [PMC free article] [PubMed] [Google Scholar]
- J Tanji, E Hoshi (2001): Behavioral planning in the prefrontal cortex. Curr Opin Neurobiol 11:164–170. [DOI] [PubMed] [Google Scholar]
- Wen X, Wu X, Liu J, Li K, Yao L (2013): Abnormal baseline brain activity in non‐depressed Parkinson's disease and depressed Parkinson's disease: A resting‐state functional magnetic resonance imaging study. PLoS One 8:e63691. [DOI] [PMC free article] [PubMed] [Google Scholar]
- Wu T, Hallett M (2005): Automatic movements in patients with Parkinson's disease. Brain 562:605–615. [DOI] [PubMed] [Google Scholar]
- Wu T, Hallett M (2013): The cerebellum in Parkinson's Disease. Brain 136:696–709. [DOI] [PMC free article] [PubMed] [Google Scholar]
- Wu T, Long X, Zang Y, Wang L, Hallett M, Li K, Chan P (2009): Regional homogeneity changes in patients with Parkinson's disease. Hum Brain Mapp 30:1502–1510. [DOI] [PMC free article] [PubMed] [Google Scholar]
- Wu T, Wang L, Hallett M, Li K, Chan P (2010): Neural correlates of bimanual anti‐phase and in‐phase movements in Parkinson's disease. Brain 133:2394–2409. [DOI] [PMC free article] [PubMed] [Google Scholar]
- Yan C, Liu D, He Y, Zou Q, Zhu C, Zuo X, Long X, Zang Y (2009): Spontaneous brain activity in the default mode network is sensitive to different resting‐state conditions with limited cognitive load. PLoS One 4:e5743. [DOI] [PMC free article] [PubMed] [Google Scholar]
- Yang H, Long XY, Yang YH, Yan H, Zhu CZ, Zhou XP, Zang YF, Gong QY (2007): Amplitude of low frequency fluctuation within visual areas revealed by resting‐state functional MRI. Neuroimage 36:144–152. [DOI] [PubMed] [Google Scholar]
- Yang H, Zhou XJ, Zhang MM, Zheng XN, Zhao YL, Wang J (2013): Changes in spontaneous brain activity in early Parkinson's disease. Neurosci Lett 549:24–28. [DOI] [PubMed] [Google Scholar]
- Zang YF, Jiang TZ, Lu YL, He Y, Tian LX (2004): Regional homogeneity approach to fMRI data analysis. NeuroImage 22:394–400. [DOI] [PubMed] [Google Scholar]
- Zang YF, He Y, Zhu CZ, Cao QJ, Sui MQ, Liang M, Tian LX, Jiang TZ, Wang YF (2007): Altered baseline brain activity in children with ADHD revealed by resting‐state functional MRI. Brain Dev 29:83–91. [DOI] [PubMed] [Google Scholar]
- Zhang J, Wei L, Hu X, Zhang Y, Zhou D, Li C, Wang X, Feng H, Yin X, Xie B, Wang J (2013): Specific frequency band of amplitude low‐frequency fluctuation predicts Parkinson's disease. Behav Brain Res 252:18–23. [DOI] [PubMed] [Google Scholar]
- Zuo XN, Di Martino A, Kelly C, Shehzad ZE, Gee DG, Klein DF, Castellanos FX, Biswal BB, Milham MP (2010): The oscillating brain: Complex and reliable. Neuroimage 49:1432–1445. [DOI] [PMC free article] [PubMed] [Google Scholar]