

Abstract
The hypothalamus is of enormous importance for multiple bodily functions such as energy homeostasis. Especially, rodent studies have greatly contributed to our understanding how specific hypothalamic subregions integrate peripheral and central signals into the brain to control food intake. In humans, however, the neural circuitry of the hypothalamus, with its different subregions, has not been delineated. Hence, the aim of this study was to map the hypothalamus network using resting‐state functional connectivity (FC) analyses from the medial hypothalamus (MH) and lateral hypothalamus (LH) in healthy normal‐weight adults (n = 49). Furthermore, in a separate sample, we examined differences within the LH and MH networks between healthy normal‐weight (n = 25) versus overweight/obese adults (n = 23). FC patterns from the LH and MH revealed significant connections to the striatum, thalamus, brainstem, orbitofrontal cortex, middle and posterior cingulum and temporal brain regions. However, our analysis revealed subtler distinctions within hypothalamic subregions. The LH was functionally stronger connected to the dorsal striatum, anterior cingulum, and frontal operculum, while the MH showed stronger functional connections to the nucleus accumbens and medial orbitofrontal cortex. Furthermore, overweight/obese participants revealed heightened FC in the orbitofrontal cortex and nucleus accumbens within the MH network. Our results indicate that the MH and LH network are tapped into different parts of the dopaminergic circuitry of the brain, potentially modulating food reward based on the functional connections to the ventral and dorsal striatum, respectively. In obese adults, FC changes were observed in the MH network. Hum Brain Mapp 35:6088–6096, 2014. © 2014 Wiley Periodicals, Inc.
Keywords: eating behavior, functional connectivity, food, obesity, resting‐state fMRI
INTRODUCTION
The hypothalamus is a small but functionally diverse region of the brain [Saper, 1990] controlling vital bodily functions, such as sleep, thermoregulation, food and fluid homeostasis, sexual behavior, stress, immune responses, and autonomic and endocrine functions. The profound regulatory influence of hypothalamic subregions in energy intake and feeding behavior was first revealed by lesion studies in rats [Anand and Brobeck, 1951; Brobeck, 1946; Grossman, 1975; Hetherington and Ranson, 1942; Jansen and Hutchison, 1969; Marshall and Mayer, 1956; Oomura, 1973]. Hereby, it was shown that lesions of the hypothalamic ventromedial nuclei induced an abnormal increase in appetite and food intake (“satiety center”), by contrast a destruction of the lateral hypothalamus (LH) reduced food intake and motivation for pleasurable stimuli (“hunger center”), whereas stimulation of the LH could induce feeding as well as reward and motivate behavior [Margules and Olds, 1962]. Since then considerable insight has been gained emphasizing the importance of the hypothalamus as a dynamic integrative center highly influencing central and peripheral nervous systems [Card, 2001]. Significantly, rodent studies have greatly contributed in identifying the blueprint of the hypothalamic feeding circuits, by revealing rich connections from and to the hypothalamus especially projections of the limbic system [Kampe et al., 2009; Kelley et al., 2005]. The greatest attention in animal research, however, has been turned to the arcuate nucleus (near the ventromedial hypothalamus), with its two distinct local counterparts of the pro‐opiomelanocortin cells (agouti‐related‐protein and neuropeptide Y producing cells) to regulate energy balance. These neural systems are directly targeted by peripheral metabolic signals in an effective manner, due to the privileged location at the basal part of the hypothalamus, a region with a leaky blood‐brain barrier [Horvath, 2005; Williams and Elmquist, 2012].
Beyond animal studies, several human brain imaging studies have shown that the hypothalamus plays a critical role in energy balance. These studies have found the hypothalamus to respond to glucose [Heni et al., 2013; Liu et al., 2000; Smeets et al., 2005, 2007] and fat [De Araujo and Rolls, 2004; Frank et al., 2012] with a profound and persistent signal decrease after ingestion [Frank et al., 2012]. Interestingly, diabetes type 2 patients failed to show this response to glucose [Vidarsdottir et al., 2007], while obese individuals showed an attenuated response [Matsuda et al., 1999] with partial reversibility after massive reduction of body weight by hypocaloric diet [van de Sande‐Lee et al., 2011]. Furthermore, obesity has been associated with neural injury in the hypothalamus [Thaler et al., 2011]. However, eating behavior is not exclusively regulated by the hypothalamus, instead other brain areas, such as the striatum and higher‐order cortical areas, are in the greater circuitry of the energy regulator (for review see [Berthoud, 2012; Kenny, 2011; Volkow et al., 2013]). In particular, obesity is associated with blunted dopamine signaling [Wang et al., 2001] and increased responsivity to palatable food in the striatum [Rothemund et al., 2007; Stice et al., 2011; Stoeckel et al., 2008] and reduced responsivity in the prefrontal cortex [Hare et al., 2011], which is important for self control.
In humans, no study has yet investigated how different hypothalamic subregions integrate into a more distributed neural network including higher cortical regions underlying eating behavior. Hence in this study, we sought to map the neural circuitry projected from the medial hypothalamus (MH) and LH, by means of “resting‐state” functional magnetic resonance imaging in healthy normal‐weight adults. Additionally, we examined potential changes on hypothalamic connections in normal‐weight versus obese/overweight adults in a separate sample.
MATERIAL AND METHODS
Our participants took part in one of two different study designs (sample 1 and sample 2) under different conditions. Hence we did not combine the participants for analyses.
All participants of sample 1 and sample 2 were healthy as ascertained by a physician; they did not suffer from psychiatric, neurological nor metabolic diseases. Any volunteer treated for chronic disease or taking any kind of medication other than oral contraceptives was excluded at screening. Before the experiment, participants rated their subjective feeling of hunger on a visual analogue scale from 0 to 10 (0: not hungry at all; 10: very hungry). Informed written consent was obtained from all subjects and the local Ethics Committee approved the protocol.
Participants sample 1: The sample consisted of 49 healthy normal‐weight adults (Gender: 36 women, 13 men; age 29 ± 9.41 years; BMI (in kg/m2): 22.09 ± 2.05). Resting‐state functional magnetic resonance imaging (fMRI) measurements were conducted in the morning and afternoon 1 to 4 h after a meal. The average rating for subjective feeling of hunger was 1.26 ± 1.76.
Participants sample 2: The sample consisted of 25 normal‐weight participants (10 women, age 26.3 ± 3.6 years; BMI (in kg/m2): 22.59 ± 1.99) and 23 overweight and obese participants (10 women, age 27.52 ± 3.5 years; BMI (in kg/m2): 31.26 ± 4.77). Resting‐state fMRI measurements were conducted in the morning after an overnight fast of at least 10 h. The average rating for subjective feeling of hunger was 3.99 ± 2.5.
Data Acquisition
Whole‐brain fMRI data was obtained using a 3.0 T scanner (Siemens Tim Trio, Erlangen, Germany). Functional data were collected using echo‐planar imaging sequences. All subjects were instructed not to focus their thoughts on anything in particular and to keep their eyes closed during the resting state MR acquisition. Based on different sequence parameters, participants of sample 1 and sample 2 were not combined into a single analysis.
For sample 1, the following sequence was used: TR = 3 s, TE = 30 ms, FOV = 192 mm2, matrix 64 × 64, flip angle 90°, voxel size 3 × 3 × 3 mm3, slice thickness 3 mm, and the images were acquired in an interleaved order. Each brain volume comprised 47 axial slices and each functional run contained 200 image volumes, resulting in a total scan time of 10.06 min.
For sample 2 the following sequence was used: TR = 2 s, TE = 30 ms, FOV = 210 mm2,matrix 64 × 64, flip angle 90°, voxel size 3 × 3 × 3.6 mm3, slice thickness 3.6 mm, images were acquired in ascending order. Each brain volume comprised 26 axial slices and each functional run contained 176 image volumes, resulting in a total scan time of 6:04 min. In addition, high‐resolution T1 weighted anatomical images (MPRage: 192 slices, matrix: 256 × 240, 1 × 1 ×1 mm3) of the brain were obtained.
Resting‐State fMRI Data Processing
Preprocessing was carried out using data processing assistant for resting‐state fMRI [Chao‐Gan and Yu‐Feng, 2010] (http://www.restfmri.net) which is based on statistical parametric mapping (SPM8) (http://www.fil.ion.ucl.ac.uk/spm) and Resting‐State fMRI Data Analysis Toolkit [Song et al., 2011] (REST, http://www.restfmri.net). Functional images were realigned and coregistered to the T1 structural image. The anatomical image was normalized to the Montreal Neurological Institute template using DARTEL, and the resulting parameter file was used to normalize the functional images (voxel size: 3 × 3 × 3 mm3). Finally the normalized images were smoothed with a three‐dimensional isotropic Gaussian kernel (full‐width at half‐maximum (FWHM): 6 mm). A temporal filter (0.01–0.08 Hz) was applied to reduce low frequency drifts and high frequency physiological noise. Nuisance regression was performed using white matter, cerebrospinal fluid (CSF), and the six head motion parameters as covariates. No participant had head motion with more than 2.0 mm maximum displacement or 2.0° of any angular motion.
Resting‐State Functional Connectivity Analyses
Functional connectivity (FC) maps were obtained using the voxel wise approach by computing FC between the region of interest (ROI) and each voxel within the brain. We defined two ROIs according to Baroncini et al. [2012]: the bilateral LH (x: ±6; y: −9; z: −10 plus 2 mm sphere) and MH (x: ±4; y: −2; z: −12 plus 2 mm sphere) (Fig. 1). The MH included the arcuate nucleus, ventromedial and parts of the dorsomedial hypothalamus. To minimize overlap between the two ROIs, we chose the peak voxel of the LH to be in the posterior part of the LH according to Baroncini et al. [2012] The FC maps were transferred to z values using Fisher's transformation [Song et al., 2011].
Figure 1.
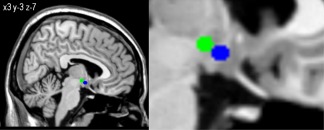
Hypothalamic regions of interests used as seeds for FC analyses. Blue seed represents the MH and the green seed the LH displayed on an anatomical template.
Statistical Analyses
For sample 1, FC maps were then analyzed in SPM8 using a full‐factorial model (within group factor: ROI) including three covariates to adjust for age, gender, and subjective feeling of hunger. For sample 2, a full‐factorial model (between‐subject factor: normal‐ versus overweight and within factor: ROI) including three covariates to adjust for age, gender, and subjective feeling of hunger. Brain regions exceeding a threshold of P < 0.05, Family‐wise‐error (FWE) corrected for multiple comparisons were considered significant.
RESULTS
Identifying Lateral Versus Medial Hypothalamus Functional Connectivity Networks
In sample 1, the LH and MH functional connectivity network (LH and MH conjunction contrast) included the ventral striatum, caudate, putamen, pallidum, thalamus, midbrain, middle and posterior cingulum, inferior orbitofrontal gyrus, temporal regions, and cerebellum. The differential contrast (LH > MH) revealed a stronger FC between the LH and the caudate, putamen (dorsal striatum), anterior cingulum, thalamus, and frontal operculum. The medial hypothalamus (MH > LH contrast) showed stronger FC to the nucleus accumbens (ventral striatum) medial orbitofrontal cortex and occipital gyrus (P < 0.05, FWE‐corrected, Table 1, Fig. 2).
Table 1.
Sample 1: Peak coordinates of hypothalamus intrinsic functional connectivity networks in healthy normal‐weight participants (n = 49)
| Activated region | Brodmann's area | Peak location (x, y, z)a | Cluster size | T score |
|---|---|---|---|---|
| Hypothalamus functional connectivity network: LH and MH conjuction | ||||
| Ventral striatum/nucleus accumbens | −9, 6, −6 | 40 | 11.18 | |
| Caudate | −12, 21, 3 | 104 | 9.21 | |
| Putamen | −15, 9, −9 | 38 | 9.77 | |
| Cerebellum | 45, −60, −33 | 205 | 9.20 | |
| Pallidum | −15, −6, −6 | 20 | 8.92 | |
| Thalamus | −9, −33, 3 | 111 | 8.16 | |
| Posterior cingulum | 7 | 0, −75, 36 | 606 | 7.94 |
| Parahippocampal gyrus | 35 | 18, −30, −12 | 355 | 7.35 |
| Inferior frontal orbital gyrus | 11 | 30, 33, −15 | 84 | 6.40 |
| Superior temporal gyrus | 37 | 45, 24, −18 | 17 | 6.38 |
| Fusiform gyrus | 34 | −33, −36, −18 | 117 | 6.24 |
| Middle temporal gyrus | 19 | −45, −78, 21 | 216 | 6.19 |
| Middle cingulum | 32 | 0, 24, 36 | 49 | 5.92 |
| Midbrain (brainstem) | −6, −21, −24 | 20 | 5.85 | |
| LH > MH | ||||
| Caudate | 12, 9, 0 | 130 | 10.42 | |
| Putamen | −15, 3, 0 | 232 | 9.96 | |
| Anterior cingulum | 24 | −6, 33, 9 | 305 | 9.52 |
| Thalamus | −18, −21, 3 | 241 | 8.45 | |
| Inferior frontal operculum | 32 | 42, 15, 9 | 30 | 6.70 |
| MH > LH | ||||
| Sup orbital frontal gyrus Orbitofrontal cortex | 11 | 9, 60, −21 | 14 | 4.91 |
| Superior occipital gyrus | 19 | −15, −93, 36 | 64 | 4.65 |
| Ventral striatum/Nucleus accumbens | −6,9,−9 | 28 | 4.57 | |
| Inferior occipital gyrus | 19 | 42, −78, 3 | 73 | 4.26 |
Note: all regions are P < 0.05 whole‐brain FWE‐corrected for multiple comparisons.
Montreal Neurological Institute.
Abbreviations: LH, lateral hypothalamus; MH, medial hypothalamus.
Figure 2.
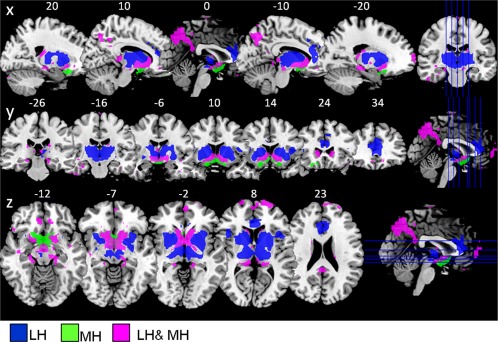
Sample 1: Hypothalamus functional connectivity network from the LH and MH (n = 49; healthy normal‐weight participants) overlaid on t1 template, showing sagittal, coronal, and axial view (P < 0.05, FWE‐corrected for multiple comparisons). Blue: regions functionally connected to the LH but not the MH (LH > MH contrast). Green: regions functionally connected to the MH but not the LH (MH > LH contrast). Magenta: regions functionally connected to both lateral and medial hypothalamus (LH and MH conjunction). Abbreviations: LH, lateral hypothalamus; MH, medial hypothalamus.
Hypothalamic Functional Connectivity Networks in Normal‐Weight and Overweight/Obese Adults
In sample 2, the LH and MH network showed a similar FC pattern as in sample 1. However, the LH network, in this sample, showed additional functional connections to parietal and frontal regions, hippocampus, cerebellum, and brain stem (P < 0.05, FWE‐corrected, Table 2, Fig. 3). Additionally, we observed significant group differences (overweight > normal‐weight contrast) within the MH network, revealing increased FC in the middle orbital frontal gyrus and nucleus accumbens in overweight compared to normal‐weight participants (P < 0.05, FWE‐corrected, Table 2, Fig. 4).
Table 2.
Sample 2: Peak coordinates of hypothalamus intrinsic functional connectivity networks in healthy normal‐weight and overweight participants (n = 48)
| Activated region | Brodmann's area | Peak location (x, y, z)a | Cluster size | T score |
|---|---|---|---|---|
| Hypothalamus functional connectivity network: LH and MH conjunction | ||||
| Putamen | −15, 9, −9 | 29 | 6.86 | |
| Ventral striatum/nucleus accumbens | 9, 9, −6 | 30 | 6.81 | |
| Parahippocampal gyrus | 20 | −30, −27, −21 | 337 | 6.17 |
| Fusiform gyrus | 37 | 36, −42, −18 | 269 | 5.58 |
| Hippocampus | −24, −6, −24 | 104 | 5.51 | |
| Superior temporal gyrus | 38 | 54, 3, −9 | 161 | 5.49 |
| Middle temporal gyrus | 21 | 39, 6, −36 | 236 | 5.44 |
| Middle frontal orbital gyrus | 11 | −24, 36, −18 | 39 | 5.32 |
| Posterior cingulum/Precuneus | 31 | −9, −72, 21 | 327 | 3.71 |
| LH > MH | ||||
| Putamen | 18, 3, −3 | 227 | 12.92 | |
| Caudate | −15, 12, 6 | 120 | 11.94 | |
| Brainstem | 3, −27, −21 | 33 | 10.04 | |
| Anterior cingulum | 24 | 6, 24, 18 | 584 | 10.65 |
| Cerebellum | 0, −54, −30 | 220 | 9.92 | |
| Thalamus | 6, −24, −3 | 211 | 9.60 | |
| Midbrain (Substantia nigra) | 21, −21, −6 | 24 | 8.89 | |
| Precuneus Posterior cingulum | 7 | −9, −57, 30 | 165 | 7.38 |
| Angular gyurs | 39 | 48, −60, 48 | 189 | 6.80 |
| Middle frontal gyrus | 8 | −42, 27, 45 | 59 | 6.78 |
| Hippocampus | 33, −12, −24 | 15 | 6.78 | |
| MH > LH | ||||
| Ventral striatum/nucleus accumbens | 6, 9, −9 | 17 | 4.81 | |
| Group differences MH network: overweight > normal‐weight | ||||
| Middle frontal orbital gyrus | 11 | 6, 39, −12 | 42 | 4.89 |
| Ventral striatum/Nucleus accumbens | 9, 6, −6 | 8 | 4.35 | |
| No significant group differences for LH network | ||||
Note: all regions are P < 0.05 whole‐brain FWE‐corrected for multiple comparisons.
Montreal Neurological Institute.
Abbreviations: LH, lateral hypothalamus; MH, medial hypothalamus.
Figure 3.
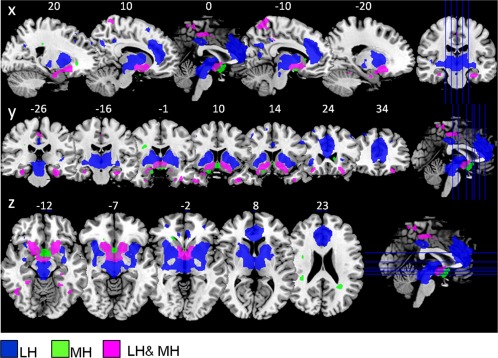
Sample 2: Hypothalamus functional connectivity network from the LH and MH (n = 48; healthy normal‐weight and overweight participants) overlaid on t1 template, showing sagital, coronal, and axial view (P < 0.05, FWE‐corrected for multiple comparisons). Blue: regions functionally connected to the LH but not the MH (LH > MH contrast). Green: regions functionally connected to the MH but not the LH (MH > LH contrast). Magenta: regions functionally connected to both lateral and medial hypothalamus (LH and MH conjunction). Abbreviations: LH, lateral hypothalamus; MH, medial hypothalamus.
Figure 4.
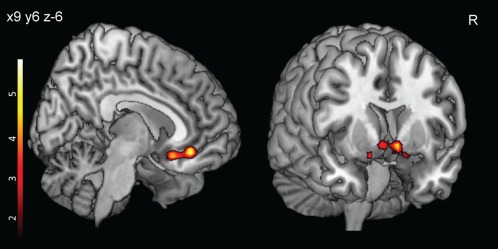
Obesity related heightened FC (Sample 2; n = 48) in the MH network. Overweight and obese participants showed increased FC compared to normal‐weight participants in the medial orbitofrontal cortex (shown on left side) and ventral striatum (shown on ride side). Color bar represents t‐values (P < 0.001, uncorrected for display). Abbreviation: FC, functional connectivity; MH, medial hypothalamus.
DISCUSSION
The hypothalamus is organized into well structured subregions exerting vital regulatory influences over the central and peripheral nervous system. In humans, what has heretofore remained unclear is how different hypothalamic subregions are functionally connected to their associated neural networks to integrate food‐related sensory information and metabolic cues.
In this study, we identified two distinct neural networks from the LH and MH by means of “resting‐state” FC analyses. In healthy normal‐weight adults, both circuitries showed significant connections to the striatum, thalamus, brainstem, orbitofrontal cortex (OFC), cingulum, and temporal regions. However, the LH network revealed stronger connections to the dorsal striatum, anterior cingulum, and frontal operculum, while the MH revealed stronger connections to the nucleus accumbens and medial OFC. Interestingly, we identified only in the MH network increased FC in obese and overweight adults. Based on the FC pattern, we hypothesize that the different hypothalamus subregions impinge on the dopaminergic circuitry to influence eating behavior affecting the rewarding properties of food.
Brain regions within the MH network included the ventral striatum (i.e., nucleus accumbens), OFC, and occipital gyrus, reflecting major components of reward and motivation. The OFC has been shown to encode general reward value for food cues [Simmons et al., 2013]. Furthermore, several studies have illustrated that the OFC is involved in the integration of different food modalities and in reward evaluation [Kringelbach and Rolls, 2004; Rolls and Baylis, 1994; Small et al., 2001]. Albeit, the occipital cortex is not primarily indicated in reward processing, recent imaging studies have shown hypoactivity in visual processing regions involved in attention when participants inhibit their craving [Volkow et al., 2010] or rewarding stimuli [O'Connor et al., 2012]. Furthermore, the lateral occipital cortex was identified to track energy value of food images in a electroencephalography study [Toepel et al., 2009] and showed task related reduced FC in overweight and obese subjects in response to visual food stimulation [Kullmann et al., 2013b].
The ventral striatum, including the nucleus accumbens, revealed the most prominent FC to the MH. The nucleus accumbens is a important hedonic hotspot in the brain, amplifying sensory pleasure [Berridge et al., 2010]. Reward processes in the ventral striatum initially drive the motivation to repeat a certain behavior as drug or also food intake [Tomasi and Volkow, 2013]. Dopamine is hypothesized to promote these reward related activities [Palmiter, 2007] and has been thoroughly investigated in the effects of drugs and food [Volkow et al., 2013]. Indeed obesity has been linked to lower striatal dopamine D2 receptor availability in humans [Wang et al., 2001] and increased responsivity to food cues in the dorsal and ventral striatum [Rothemund et al., 2007; Stice et al., 2011; Stoeckel et al., 2008]. Interestingly, the ventral pallidum activity has been shown to increase with subject's pleasantness ratings for a particular food [Simmons et al., 2013] and dopamine levels correlate with subjective ratings of wanting in the dorsal striatum [Volkow et al., 2002]. Also overeating has been shown to produce blunted dopamine signaling, reducing D2 receptor density and sensitivity [Johnson and Kenny, 2010] and increasing responsitivity to food cues [Stice et al., 2010] and palatable food receipt [Stice et al., 2011]. Furthermore, hormones essential for feeding behavior, as insulin, leptin, and ghrelin, directly modulate dopamine neuron activity to stimulate or inhibit feeding. Insulin, reflecting carbohydrate abundance, suppresses dopamine release by facilitating the clearing of dopamine from synapses; hence reducing the rewarding properties of food [Figlewicz and Sipols, 2010; Figlewicz et al., 1994]. In humans, we were able to show that fasting insulin as well as intranasal insulin modulates central elements of the reward system by decreasing resting‐state brain activity in the OFC and striatum [Heni et al., 2012; Kullmann et al., 2012, 2013a]. In this study, we found a hyperactive reward system in our obese group resulting in increased FC in the OFC and nucleus accumbens within MH network. Since the MH is considered to be the “satiety center” of the brain, the altered FC pattern could lead to an amplified response to food cues in the ventral striatum, promoting increased sensitivity to immediate reward and overconsumption of high caloric foods.
Yet, as mentioned above, altered dopamine signaling in obesity has been identified within the ventral as well as dorsal striatum. It has been suggested that for food reward processes, the homeostatic system of the brain takes advantage of the dopaminergic circuitry to initially drive the motivational aspect for food in the ventral striatum and then subsequently use the dorsal striatal outputs to other cortical areas to couple motivation with motor responses needed for goal directed behavior [Tomasi and Volkow, 2013; Volkow et al., 2013]. Thus the dorsal striatum is of special importance to consume the reward. Concomitantly, the reduced dopamine D2 receptor availability in the striatum in obese individuals has been shown to correlate with prefrontal metabolism of the anterior cingulate, orbitofrontal, and dorsolateral prefrontal cortices [Volkow et al., 2008].
Interestingly, the LH network, in our study, encompassed the dorsal striatum, thalamus, midbrain, operculum, anterior cingulate, and prefrontal cortex. This suggest that the LH is integrated into the dorsal striatum and cingulo‐opercular network, which is thought to play a crucial role in goal‐directed behavior [Dosenbach et al., 2006; Laird et al., 2011] and has been proposed as a translational network linking cognition and emotion or salience processing, respectively [Laird et al., 2011]. The opercular and anterior cingulate cortex respond to personal salience including motivational, emotional, cognitive, or homeostatic [Bush et al., 2000; Critchley, 2005], while the prefrontal and parietal cortex are exceedingly involved in executive control [Seeley et al., 2007]. In obese individuals, a differential pattern within this network has been observed in fMRI activation studies using food stimuli. While an enhanced response to food was observed within regions involved in salience processing, as the operculum, striatum, and medial OFC [Rothemund et al., 2007; Stice et al., 2011; Stoeckel et al., 2008], a reduced response was revealed in prefrontal regions critical for inhibitory control with higher BMI [Hare et al., 2011]. Recently, it has also been shown that obesity is related to prominent FC alterations mainly in prefrontal regions during resting‐state as well as in response to food stimuli. [Garcia‐Garcia et al., 2012; Kullmann et al., 2012, 2013b].
A limitation of the current study is the restricted spatial resolution of the functional images, making it difficult to distinguish between different hypothalamic nuclei. Hence, we used a medial and lateral seed to evaluate hypothalamic networks. Furthermore, the participants of sample 1 and sample 2 were measured under different conditions. Participants of sample 1 were in a fasting‐state, measured early in the morning, while participants of sample 2 were measured later in the day after a meal. These different homeostatic states could potentially influence functional connections to and from the hypothalamus.
CONCLUSION
Our data highlight the existence of two distinct neural circuitries in human adults originating from the MH and LH. Based on the FC patterns, we propose that the LH and MH take advantage of different parts of the dopaminergic circuitry to modulate food reward. Further studies are needed to investigate whether these networks respond to specific physiological and psychological changes, to highlight the importance of the networks for human eating behavior and associated diseases.
REFERENCES
- Anand BK, Brobeck JR (1951): Localization of a "feeding center" in the hypothalamus of the rat. Proc Soc Exp Biol Med 77:323–324. [DOI] [PubMed] [Google Scholar]
- Baroncini M, Jissendi P, Balland E, Besson P, Pruvo JP, Francke JP, Dewailly D, Blond S, Prevot V (2012): MRI atlas of the human hypothalamus. Neuroimage 59:168–180. [DOI] [PubMed] [Google Scholar]
- Berridge KC, Ho CY, Richard JM, DiFeliceantonio AG (2010): The tempted brain eats: Pleasure and desire circuits in obesity and eating disorders. Brain Res 1350:43–64. [DOI] [PMC free article] [PubMed] [Google Scholar]
- Berthoud HR (2012): The neurobiology of food intake in an obesogenic environment. Proc Nutr Soc 71:478–487. [DOI] [PMC free article] [PubMed] [Google Scholar]
- Brobeck JR (1946): Mechanism of the development of obesity in animals with hypothalamic lesions. Physiol Rev 26:541–559. [DOI] [PubMed] [Google Scholar]
- Bush G, Luu P, Posner MI (2000): Cognitive and emotional influences in anterior cingulate cortex. Trends Cogn Sci 4:215–222. [DOI] [PubMed] [Google Scholar]
- Card JP (2001): Hypothalamus. Encyclopedia of Life Sciences. Nature Publishing Group. DOI: 10.1038/npg.els.0000148. [Google Scholar]
- Chao‐Gan Y, Yu‐Feng Z (2010): DPARSF: A MATLAB Toolbox for "Pipeline" Data Analysis of Resting‐State fMRI. Front Syst Neurosci 4:13. [DOI] [PMC free article] [PubMed] [Google Scholar]
- Critchley HD (2005): Neural mechanisms of autonomic, affective, and cognitive integration. J Comp Neurol 493:154–166. [DOI] [PubMed] [Google Scholar]
- De Araujo IE, Rolls ET (2004): Representation in the human brain of food texture and oral fat. J Neurosci 24:3086–3093. [DOI] [PMC free article] [PubMed] [Google Scholar]
- Dosenbach NU, Visscher KM, Palmer ED, Miezin FM, Wenger KK, Kang HC, Burgund ED, Grimes AL, Schlaggar BL, Petersen SE (2006): A core system for the implementation of task sets. Neuron 50:799–812. [DOI] [PMC free article] [PubMed] [Google Scholar]
- Figlewicz DP, Sipols AJ (2010): Energy regulatory signals and food reward. Pharmacol Biochem Behav 97:15–24. [DOI] [PMC free article] [PubMed] [Google Scholar]
- Figlewicz DP, Szot P, Chavez M, Woods SC, Veith RC (1994): Intraventricular insulin increases dopamine transporter mRNA in rat VTA/substantia nigra. Brain Res 644:331–334. [DOI] [PubMed] [Google Scholar]
- Frank S, Linder K, Kullmann S, Heni M, Ketterer C, Cavusoglu M, Krzeminski A, Fritsche A, Haring HU, Preissl H, J Hinrichs, R Veit (2012): Fat intake modulates cerebral blood flow in homeostatic and gustatory brain areas in humans. Am J Clin Nutr 95:1342–1349. [DOI] [PubMed] [Google Scholar]
- Garcia‐Garcia I, Jurado MA, Garolera M, Segura B, Sala‐Llonch R, Marques‐Iturria I, Pueyo R, Sender‐Palacios MJ, Vernet‐Vernet M, Narberhaus A, M Ariza, C Junque (2012): Alterations of the salience network in obesity: A resting‐state fMRI study. Hum Brain Mapp 37:2786–2797. [DOI] [PMC free article] [PubMed] [Google Scholar]
- Grossman SP (1975): Role of the hypothalamus in the regulation of food and water intake. Psychol Rev 82:200–224. [PubMed] [Google Scholar]
- Hare TA, Malmaud J, Rangel A (2011): Focusing attention on the health aspects of foods changes value signals in vmPFC and improves dietary choice. J Neurosci 31:11077–11087. [DOI] [PMC free article] [PubMed] [Google Scholar]
- Heni M, Kullmann S, Ketterer C, Guthoff M, Linder K, Wagner R, Stingl KT, Veit R, Staiger H, Haring HU, H Preissl, A Fritsche (2012): Nasal insulin changes peripheral insulin sensitivity simultaneously with altered activity in homeostatic and reward‐related human brain regions. Diabetologia 55:1773–1782. [DOI] [PubMed] [Google Scholar]
- Heni M, Kullmann S, Ketterer C, Guthoff M, Bayer M, Staiger H, Machicao F, Haring HU, Preissl H, Veit R, A Fritsche (2013): Differential effect of glucose ingestion on the neural processing of food stimuli in lean and overweight adults. Hum Brain Mapp 35:918–928. [DOI] [PMC free article] [PubMed] [Google Scholar]
- Hetherington AW, Ranson SW (1942): The relation of various hypothalamic lesions to adiposity in the rat. J Comp Neurol 76:475–499. [Google Scholar]
- Horvath TL (2005): The hardship of obesity: A soft‐wired hypothalamus. Nat Neurosci 8:561–565. [DOI] [PubMed] [Google Scholar]
- Jansen GR, Hutchison CF (1969): Production of hypothalamic obesity by microsurgery. Am J Physiol 217:487–493. [DOI] [PubMed] [Google Scholar]
- Johnson PM, Kenny PJ (2010): Dopamine D2 receptors in addiction‐like reward dysfunction and compulsive eating in obese rats. Nat Neurosci 13:635–641. [DOI] [PMC free article] [PubMed] [Google Scholar]
- Kampe J, Tschop MH, Hollis JH, Oldfield BJ (2009): An anatomic basis for the communication of hypothalamic, cortical and mesolimbic circuitry in the regulation of energy balance. Eur J Neurosci 30:415–430. [DOI] [PubMed] [Google Scholar]
- Kelley AE, Baldo BA, Pratt WE, Will MJ (2005). Corticostriatal‐hypothalamic circuitry and food motivation: Integration of energy, action and reward. Physiol Behav 86:773–795. [DOI] [PubMed] [Google Scholar]
- Kenny PJ (2011): Reward mechanisms in obesity: new insights and future directions. Neuron 69:664–679. [DOI] [PMC free article] [PubMed] [Google Scholar]
- Kringelbach ML, Rolls ET (2004): The functional neuroanatomy of the human orbitofrontal cortex: Evidence from neuroimaging and neuropsychology. Prog Neurobiol 72:341–372. [DOI] [PubMed] [Google Scholar]
- Kullmann S, Heni M, Veit R, Ketterer C, Schick F, Haring HU, Fritsche A, Preissl H (2012): The obese brain: Association of body mass index and insulin sensitivity with resting state network functional connectivity. Hum Brain Mapp 33:1052–1061. [DOI] [PMC free article] [PubMed] [Google Scholar]
- Kullmann S, Frank S, Heni M, Ketterer C, Veit R, Haring HU, Fritsche A, Preissl H (2013a): Intranasal insulin modulates intrinsic reward and prefrontal circuitry of the human brain in lean women. Neuroendocrinology 97:176–182. [DOI] [PubMed] [Google Scholar]
- Kullmann S, Pape AA, Heni M, Ketterer C, Schick F, Haring HU, Fritsche A, Preissl H, Veit R (2013b): Functional network connectivity underlying food processing: Disturbed salience and visual processing in overweight and obese adults. Cereb Cortex 23:1247–1256. [DOI] [PubMed] [Google Scholar]
- Laird AR, Fox PM, Eickhoff SB, Turner JA, Ray KL, McKay DR, Glahn DC, Beckmann CF, Smith SM, Fox PT (2011) Behavioral interpretations of intrinsic connectivity networks. J Cogn Neurosci 23:4022–4037. [DOI] [PMC free article] [PubMed] [Google Scholar]
- Liu Y, Gao JH, Liu HL, Fox PT (2000): The temporal response of the brain after eating revealed by functional MRI. Nature 405:1058–1062. [DOI] [PubMed] [Google Scholar]
- Margules DL, Olds J (1962): Identical "feeding" and "rewarding" systems in the lateral hypothalamus of rats. Science 135:374–375. [DOI] [PubMed] [Google Scholar]
- Marshall NB, Mayer J (1956): Specificity of gold thioglucose for ventromedial hypothalamic lesions and hyperphagia. Nature 178:1399–1400. [DOI] [PubMed] [Google Scholar]
- Matsuda M, Liu Y, Mahankali S, Pu Y, Mahankali A, Wang J, DeFronzo RA, Fox PT, Gao JH (1999): Altered hypothalamic function in response to glucose ingestion in obese humans. Diabetes 48:1801–1806. [DOI] [PubMed] [Google Scholar]
- O'Connor DA, Rossiter S, Yucel M, Lubman DI, Hester R (2012): Successful inhibitory control over an immediate reward is associated with attentional disengagement in visual processing areas. Neuroimage 62:1841–1847. [DOI] [PubMed] [Google Scholar]
- Oomura Y (1973): Central mechanism of feeding. Adv Biophys 5:65–142. [PubMed] [Google Scholar]
- Palmiter RD (2007): Is dopamine a physiologically relevant mediator of feeding behavior? Trends Neurosci 30:375–381. [DOI] [PubMed] [Google Scholar]
- Rolls ET, Baylis LL (1994): Gustatory, olfactory, and visual convergence within the primate orbitofrontal cortex. J Neurosci 14:5437–5452. [DOI] [PMC free article] [PubMed] [Google Scholar]
- Rothemund Y, Preuschhof C, Bohner G, Bauknecht HC, Klingebiel R, Flor H, Klapp BF (2007): Differential activation of the dorsal striatum by high‐calorie visual food stimuli in obese individuals. Neuroimage 37:410–421. [DOI] [PubMed] [Google Scholar]
- Saper CB (1990): The Hypothalamus. San Diego: Academic Press. [Google Scholar]
- Seeley WW, Menon V, Schatzberg AF, Keller J, Glover GH, Kenna H, Reiss AL, Greicius MD (2007): Dissociable intrinsic connectivity networks for salience processing and executive control. J Neurosci 27:2349–2356. [DOI] [PMC free article] [PubMed] [Google Scholar]
- Simmons WK, Rapuano KM, Ingeholm JE, Avery J, Kallman S, Hall KD, Martin A (2013): The ventral pallidum and orbitofrontal cortex support food pleasantness inferences. Brain Struct Funct 219:473–483. [DOI] [PMC free article] [PubMed] [Google Scholar]
- Small DM, Zatorre RJ, Dagher A, Evans AC, Jones‐Gotman M (2001): Changes in brain activity related to eating chocolate: From pleasure to aversion. Brain 124(Pt 9):1720–1733. [DOI] [PubMed] [Google Scholar]
- Smeets PA, de Graaf C, Stafleu A, van Osch MJ, van der Grond J (2005): Functional MRI of human hypothalamic responses following glucose ingestion. Neuroimage 24:363–368. [DOI] [PubMed] [Google Scholar]
- Smeets PA, Vidarsdottir S, de Graaf C, Stafleu A, van Osch MJ, Viergever MA, Pijl H, van der Grond J (2007): Oral glucose intake inhibits hypothalamic neuronal activity more effectively than glucose infusion. Am J Physiol Endocrinol Metab 293:E754–E758. [DOI] [PubMed] [Google Scholar]
- Song XW, Dong ZY, Long XY, Li SF, Zuo XN, Zhu CZ, He Y, Yan CG, Zang YF (2011): REST: A toolkit for resting‐state functional magnetic resonance imaging data processing. PLoS One 6:e25031. [DOI] [PMC free article] [PubMed] [Google Scholar]
- Stice E, Yokum S, Bohon C, Marti N, Smolen A (2010): Reward circuitry responsivity to food predicts future increases in body mass: Moderating effects of DRD2 and DRD4. Neuroimage 50:1618–1625. [DOI] [PMC free article] [PubMed] [Google Scholar]
- Stice E, Yokum S, Burger KS, Epstein LH, Small DM (2011): Youth at risk for obesity show greater activation of striatal and somatosensory regions to food. J Neurosci 31:4360–4366. [DOI] [PMC free article] [PubMed] [Google Scholar]
- Stoeckel LE, Weller RE, Cook EW, 3rd , Twieg DB, Knowlton RC, Cox JE (2008): Widespread reward‐system activation in obese women in response to pictures of high‐calorie foods. Neuroimage 41:636–647. [DOI] [PubMed] [Google Scholar]
- Thaler JP, Yi CX, Schur EA, Guyenet SJ, Hwang BH, Dietrich MO, Zhao X, Sarruf DA, Izgur V, Maravilla KR, HT Nguyen, JD Fischer, ME Matsen, BE Wisse, GJ Morton, TL Horvath, DG Baskin, MH Tschop, MW Schwartz (2011): Obesity is associated with hypothalamic injury in rodents and humans. J Clin Invest 122:153–162. [DOI] [PMC free article] [PubMed] [Google Scholar]
- Toepel U, Knebel JF, Hudry J, le Coutre J, Murray MM (2009): The brain tracks the energetic value in food images. Neuroimage 44:967–974. [DOI] [PubMed] [Google Scholar]
- Tomasi D, Volkow ND (2013): Striatocortical pathway dysfunction in addiction and obesity: Differences and similarities. Crit Rev Biochem Mol Biol 48:1–19. [DOI] [PMC free article] [PubMed] [Google Scholar]
- van de Sande‐Lee S, Pereira FR, Cintra DE, Fernandes PT, Cardoso AR, Garlipp CR, Chaim EA, Pareja JC, Geloneze B, Li LM, F Cendes, LA Velloso (2011): Partial reversibility of hypothalamic dysfunction and changes in brain activity after body mass reduction in obese subjects. Diabetes 60:1699–1704. [DOI] [PMC free article] [PubMed] [Google Scholar]
- Vidarsdottir S, Smeets PA, Eichelsheim DL, van Osch MJ, Viergever MA, Romijn JA, van der Grond J, Pijl H (2007): Glucose ingestion fails to inhibit hypothalamic neuronal activity in patients with type 2 diabetes. Diabetes 56:2547–2550. [DOI] [PubMed] [Google Scholar]
- Volkow ND, Wang GJ, Fowler JS, Logan J, Jayne M, Franceschi D, Wong C, Gatley SJ, Gifford AN, Ding YS, N Pappas (2002): "Nonhedonic" food motivation in humans involves dopamine in the dorsal striatum and methylphenidate amplifies this effect. Synapse 44:175–180. [DOI] [PubMed] [Google Scholar]
- Volkow ND, Wang GJ, Telang F, Fowler JS, Thanos PK, Logan J, Alexoff D, Ding YS, Wong C, Ma Y, K Pradhan (2008): Low dopamine striatal D2 receptors are associated with prefrontal metabolism in obese subjects: Possible contributing factors. Neuroimage 42:1537–1543. [DOI] [PMC free article] [PubMed] [Google Scholar]
- Volkow ND, Fowler JS, Wang GJ, Telang F, Logan J, Jayne M, Ma Y, Pradhan K, Wong C, Swanson JM (2010): Cognitive control of drug craving inhibits brain reward regions in cocaine abusers. Neuroimage 49:2536–2543. [DOI] [PMC free article] [PubMed] [Google Scholar]
- Volkow ND, Wang GJ, Tomasi D, Baler RD (2013): The addictive dimensionality of obesity. Biol Psychiatry 73:811–818. [DOI] [PMC free article] [PubMed] [Google Scholar]
- Wang GJ, Volkow ND, Logan J, Pappas NR, Wong CT, Zhu W, Netusil N, Fowler JS (2001): Brain dopamine and obesity. Lancet 357:354–357. [DOI] [PubMed] [Google Scholar]
- Williams KW, Elmquist JK (2012): From neuroanatomy to behavior: central integration of peripheral signals regulating feeding behavior. Nat Neurosci 15:1350–1355. [DOI] [PMC free article] [PubMed] [Google Scholar]