

Abstract
Thalamic atrophy is known to be one of the most important predictors for clinical dysfunction in multiple sclerosis (MS). As the thalamus is highly connected to many cortical areas, this suggests that thalamic atrophy is associated with disruption of cortical functional networks. We investigated this thalamo‐cortical system to explain the presence of physical and cognitive problems in MS. Functional magnetic resonance imaging (fMRI) and magnetoencephalography (MEG) were performed in 86 MS patients and 21 healthy subjects. We computed cortical functional networks for fMRI and MEG by respectively the Pearson's correlation coefficient and the phase lag index using the same automated anatomical labeling atlas for both modalities. Thalamo‐cortical functional connectivity was only estimated using fMRI. We computed conventional network metrics such as clustering coefficient and path length and analyzed the minimum spanning tree (MST), a subnetwork and backbone of the original network. MS patients showed reduced thalamic volumes and increased thalamo‐cortical connectivity. MEG cortical functional networks showed a lower level of integration in MS in terms of the MST, whereas fMRI cortical networks did not differ between groups. Lower integration of MEG cortical functional networks was both related to thalamic atrophy as well as to increased thalamo‐cortical functional connectivity in fMRI and to worse cognitive and clinical status. This study demonstrated for the first time that thalamic atrophy is associated with global disruption of cortical functional networks in MS and this global disruption of network activity was related to worse cognitive and clinical function in MS. Hum Brain Mapp 36:603–618, 2015. © 2014 Wiley Periodicals, Inc.
Keywords: fMRI, MEG, multiple sclerosis, functional networks, functional connectivity, thalamic atrophy
INTRODUCTION
Multiple sclerosis (MS) is a chronic demyelinating and neurodegenerative disease, leading to both cognitive impairment and physical disability. Thalamic atrophy and disruption of cortical functional networks have both been reported and found to be associated with cognitive impairment and physical disability in MS [Batista et al., 2012; Gamboa et al., 2013; Houtchens et al., 2007]. Based on the widespread connectivity of the thalamus with cortical regions throughout the brain, one would expect a mutual influence between thalamic atrophy and disruption of cortical functional networks in MS. However, the relationship between thalamic atrophy and cortical functional networks is largely unknown. Shedding more light on this relationship might help to understand disease mechanisms and clinical and cognitive deterioration in MS.
Cortical functional networks can be analyzed using metrics from modern network theory where a network is considered as a set of nodes and links [Bullmore and Sporns, 2012; Stam and van Straaten, 2012]. Nodes refer to brain regions and links to communication between distinct brain regions (i.e., functional connectivity). Cortical functional networks robustly show a highly nonrandom organization that is characterized by dense local connectivity and relatively sparse long range connections [Bullmore and Sporns, 2009]. Such a topology has been associated with a balance of integration and segregation together with a minimization of wiring costs and maximization of efficiency [Bullmore and Sporns, 2012]. However, the quantification and comparison of functional network topology is accompanied by methodological problems as associated with differences in connectivity density or average connectivity strength [Fornito et al., 2013; van Wijk et al., 2010]. Usage of conventional metrics leads to mixing of information about topology with information about functional connectivity. Even corrections for these biases by normalization procedures are not adequate [van Wijk et al., 2010]. Computation of a minimum spanning tree (MST), an acyclic subnetwork containing the strongest connections, enables comparison of networks without the aforementioned biases (see Methods for more details) [Lee et al., 2006; Lee et al., 2010; Schoen et al., 2011].
The organization of functional networks in MS has received relatively little attention as most studies have merely focused on changes in raw functional connectivity [Cader et al., 2006; Hawellek et al., 2011; Parisi et al., 2012; Prakash et al., 2011; Rocca et al., 2007; Rocca et al., 2012; Valsasina et al., 2011]. Previous studies on the organization of functional networks in MS using either functional magnetic resonance imaging (fMRI) or magnetoencephalography (MEG) have demonstrated less integration in functional networks [Gamboa et al., 2013; Hardmeier et al., 2012; Schoonheim et al., 2011]. We recently showed in an MEG study that, in comparison to healthy subjects, the MSTs of MS patients are indeed characterized by less integration of information and loss of hierarchical structure of functional networks, which was related to worse cognitive performance in MS [Tewarie et al., 2013a]. Previous fMRI and MEG studies on the relationship between functional network connectivity and thalamic atrophy have revealed that abnormalities in functional connectivity between the thalamus and the cortex or even between cortical areas was associated with thalamic atrophy, especially for occipito‐parietal and motor areas [Dogonowski et al., 2013; Schoonheim et al., 2013b; Tewarie et al., 2013b; Tona et al., 2014]. However, these previous studies were performed using various modalities and methodologies, hampering comparison of the results of these studies. A multimodal imaging approach employing the same methodology on both fMRI and MEG may help to quantify functional network disruption in MS and may further increase the interpretability of these results between modalities. Furthermore, the high temporal resolution of MEG and the ability of fMRI to assess functional connectivity between the cortex and the thalamus may provide complementary information, and therefore, be an advantage over unimodal functional imaging approaches.
In this study, we included subjects that have been described in previous work, where we demonstrated that thalamic atrophy and related increased thalamo‐cortical functional connectivity (fMRI) were important features in MS patients [Schoonheim et al., in press]. The novel aspect of this study is that we now link thalamic atrophy and changes in thalamo‐cortical functional connectivity to the organization of cortical functional networks in MS, using both fMRI and MEG. Therefore, the aim of this study is to test the hypothesis that thalamic atrophy and a disintegration of cortical functional networks co‐occur and are linked by thalamo‐cortical functional connectivity. We further hypothesize that disruption of this thalamo‐cortical system is associated with clinical and cognitive dysfunction (Fig. 1).
Figure 1.
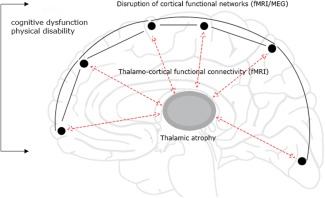
The thalamo‐cortical loop. Depicted is our hypothesis: a loop consisting of the thalamus connected to the cortex through thalamo‐cortical connections is affected. This is potentially caused by thalamic atrophy, disruption of cortical functional networks and changes in BOLD thalamo‐cortical functional connectivity. We further hypothesize that these alterations are interrelated and important for explaining clinical and cognitive dysfunction. [Color figure can be viewed in the online issue, which is available at http://wileyonlinelibrary.com.]
METHODS
Study Design
In this cross‐sectional study, we analyzed cortical functional networks, thalamic volumes, thalamo‐cortical functional connectivity, neurological‐ and neuropsychological status in MS patients and healthy subjects. Differences in thalamic volumes and thalamo‐cortical functional connectivity between MS patients and healthy subjects from this cohort (in a larger but overlapping group) have been reported before [Schoonheim et al., 2012; Schoonheim et al., 2013b; Schoonheim et al., in press] and will be reported in this article as descriptive information and as Supporting Information. The aim of this study was, however, to investigate if these changes were related to disruption of cortical functional networks, where we also made use of a novel atlas‐based approach (not reported before). We quantified resting state cortical functional networks using MEG and fMRI, whereas we quantified thalamo‐cortical functional connectivity using fMRI. For both MEG and fMRI obtained cortical functional networks, we computed conventional graph theoretical measures such as the clustering coefficient and path length to increase the interpretability of our results within the context of previous studies. In addition, we investigated MST measures (MST leaf fraction, MST diameter, MST degree divergence and MST tree hierarchy), as these are unaffected by potential biases that may arise as a consequence of constructing networks from different imaging modalities. An overview of the applied methods is given in Figure 2.
Figure 2.
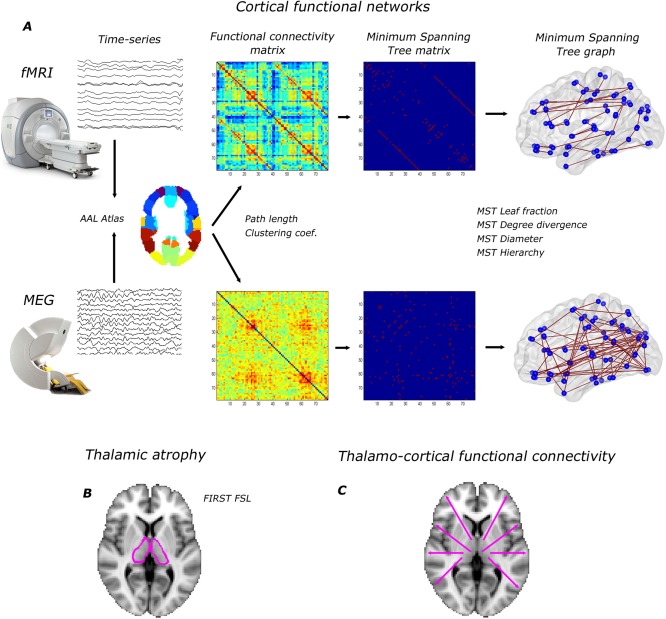
Overview of applied methods. (A) cortical functional networks: for both fMRI and MEG, time signals were projected onto the cortical AAL atlas consisting of 78 regions. For MEG, beamforming was used as source localization method. Based on time signals in the AAL atlas we computed functional connectivity matrices (weighted networks) by the Pearson correlation coefficient and the Phase lag index for fMRI and MEG respectively. The average functional connectivity matrices over subjects are displayed (alpha2 band for MEG). Path length and clustering coefficient were computed based on these weighted networks. Subsequently, we computed the MST and the corresponding MST metrics; (B) thalamic atrophy was computed using FIRST (FSL); (C) we computed BOLD thalamo‐cortical functional connectivity from all 78 cortical regions to the thalamus and averaged over hemispheres. [Color figure can be viewed in the online issue, which is available at http://wileyonlinelibrary.com.]
Participants
All MS patients were part of a six‐year follow‐up of an early inception cohort and were also included in previous studies [Schoonheim et al., 2012; Schoonheim et al., 2013a; Schoonheim et al., 2013b; Schoonheim et al., in press]. In this study, we only included subjects who underwent both fMRI and MEG, during their most recent visit at around six years after diagnosis. Initially, 100 patients (mean age 41.6 ± 8.9 years) and 24 healthy subjects (mean age 41.8 ± 10.3 years) were included in this study and were matched for gender, age, and education. Seventeen subjects were excluded from this study due to absent or corrupt fMRI data (N = 4), mismatch between normalized MRI and template before applying beamforming (N = 2), an excess of noise and artefacts in the raw MEG data (N = 5) and having a diagnosis of clinical isolated syndrome not converted to clinically definite MS (N = 6). Consequently, 86 MS patients (mean age 41.6 ± 8.8 years) and 21 subjects (mean age 42.5 ± 10.3 years) remained in this study (Table 1). Subsequently, all patients were diagnosed with clinically definite MS by experienced neurologists and all patients were recruited from the VU University Medical Centre [Polman et al., 2005]. Ethics approval for this study was granted by the institutional ethics review board and written informed consent was obtained from all subjects prior to participation.
Table 1.
Demographic, clinical, and MRI measures for MS patients and healthy subjects
| MS patients, n = 86 | Healthy subjects, n = 21 | P value | |||
|---|---|---|---|---|---|
| Mean | ±SD | Mean | ±SD | ||
| Age (in years) | 41.58 | 8.82 | 42.48 | 10.29 | >0.05 |
| Gender (F in %) | 61.9% | 65.1% | >0.05 | ||
| Disease duration (years) | 7.15 | 2.11 | |||
| Disease type (RR/SP/PP) | 68/5/9 | — | — | ||
| EDSS (median and range) | 2.5 | (0–6.5) | — | — | |
| Cognition (Z‐score) | −0.83 | 0.76 | 0.06 | 0.48 | <0.001 |
| Thalamic volume (mL) | 18.91 | 2.17 | 20.10 | 1.29 | <0.001 |
| NBV (L) | 1.47 | 0.07 | 1.53 | 0.07 | <0.001 |
| NGMV (L) | 0.82 | 0.05 | 0.84 | 0.05 | <0.001 |
| NDGMV (mL) | 58.60 | 6.18 | 64.79 | 4.25 | <0.001 |
| T1 lesion load | 2.00 | 2.36 | — | — | |
| T2 lesion load | 4.50 | 5.35 | — | — | |
Abbreviations: R, relapsing‐remitting; S, secondary‐progressive; P, primary‐progressive; NBV, normalized brain volume; NGMV, normalized GM volume; NDGMV, normalized deep gray matter volume.
Neurological and Neuropsychological Assessment
Participants underwent a set of neurological and neuropsychological tests as described earlier [Schoonheim et al., 2012]. The physical disability of MS patients was evaluated using the Expanded Disability Status Scale (EDSS) [Kurtzke, 1983]. In order to assess cognitive functioning, we used an expanded version of the brief repeatable battery for neurological disease, which was administered to all subjects. This set of neuropsychological tests included the selective reminding test, the 10/36 spatial recall test (SPART), the symbol digit modalities test (SDMT), the word list generation test (WLG), the concept shifting test (CST), the Stroop color‐word test, and the memory comparison test (MCT; see previous studies for details [Schoonheim et al., 2011; Schoonheim et al., 2012]). Z‐scores were summarized into seven cognitive domains: executive functioning (CST, WLG), verbal memory (SRT), information processing speed (SDMT), visuospatial memory (SPART), working memory (MCT), attention (Stroop), and psychomotor speed (CST, SDMT). In addition, a Z‐score for overall cognition was calculated by averaging Z‐scores over all separate cognitive domains. This overall cognition score was used in further analyses. The rationale behind using an overall cognition score was to reduce the number of statistical tests in order to avoid correction for a large number of tests.
Data Acquisition
MRI scans were performed using a 3T‐MRI system (GE SignaHDxt) with a 3D‐T1 weighted fast‐spoiled gradient‐echo (FSPGR, repetition time (TR) 7.8 ms, echo time (TE) 3.0 ms, inversion time (TI) 450 ms, flip angle 12, 0.9 × 0.9 × 1 mm voxel size), 2D T2‐weighted fast spin‐echo (repetition time 9680 ms, echo time 22/112 ms, flip angle 90, 3 mm contiguous axial slices, in‐plane resolution 0.6 × 0.6 mm), 2D spin‐echo T1‐weighted imaging (repetition time 475 ms, echo time 9.0 ms, flip angle 90, 3 mm contiguous axial slices, inplane resolution 0.7 × 1 mm), and a resting‐state fMRI sequence containing 202 volumes, of which the first two were discarded (echo planar imaging (EPI), TR 2200 ms, TE 35 ms, flip angle 80, 3 mm contiguous axial slices covering the entire brain, in‐plane resolution 3.3 × 3.3 mm). All lesion volumetric analyses were performed using Alice (Perceptive informatics Inc.) applying a local thresholding technique. Preprocessing was performed by an experienced rater (MMS) using FSL 5 (FMRIB's Software Library, http://www.fmrib.ox.ac.uk/fsl), and included brain extraction for the FSPGR sequence. Total gray matter (normalized GM volume [NGMV]), normalized white matter volume [NWMV]), and whole brain volumes (normalized brain volume [NBV]), corrected for head size, were measured using SIENAX [Smith et al., 2002]. Thalamic volumes were measured using FIRST (part of FSL), providing left and right volumes for the thalamus and were corrected for head size using the V‐scaling factor of SIENAX. Left and right thalamic volumes were summed to give the total thalamic volume. The fMRI data were processed as part of the pipeline of MELODIC (part of FSL) using default settings, including masking, motion correction, smoothing, and high‐pass filtering (100 s cutoff). All pre‐processed fMRI images were kept in subject space; the automated anatomical labeling (AAL) atlas was nonlinearly registered back to each subject using nearest‐neighbor interpolation. This was done by inverting the registration steps calculated by a boundary‐based registration (BBR, part of FSL) between fMRI and 3D‐T1 sequences, and nonlinear registration between 3D‐T1 and standard space using FNIRT (part of FSL). After registration, the average time‐series were calculated for each individual AAL and thalamus region, which were used for the connectivity analyses.
MEG data were recorded using a 306‐channel whole‐head MEG system (Elekta Neuromag, Oy, Helsinki, Finland) while participants were in a supine position in a magnetically shielded room (Vacuumschmelze, Hanau, Germany). Fluctuations in magnetic field strength were recorded during a no‐task, eyes‐open condition for 3 minutes (not analysed here) and eyes‐closed condition for 5 consecutive minutes with a sample frequency of 1250 Hz. An antialiasing filter of 410 Hz and a high‐pass filter of 0.1 Hz were applied online and other artefacts were removed offline using the temporal extension of Signal Space Separation (tSSS) in MaxFilter software (Elekta Neuromag Oy, version 2.2.10) [Taulu and Hari, 2009; Taulu and Simola, 2006]. Channels that were malfunctioning during the recording, for example due to excessive noise, were identified by automatic and visual inspection of the data and removed before applying tSSS. Automatic inspection involved SSS (Taulu et al., 2006). The number of excluded channels varied between 1 and 12 and did not differ between MS patients and healthy subjects (Mann‐Whitney U = 7.23, P = 0.076). SSS and tSSS method can be explained as follows: SSS decomposes the recorded magnetic fields into those that have their origin inside the helmet (brain signals) and those that originate outside the helmet (noise signals). The noise signals are then discarded. The temporal extension of SSS was used to remove noise signals that SSS failed to discard, typically from noise sources near the head. Such noise signals have a signature in both the brain and noise signals, and can therefore be detected (and discarded) using a simple correlation approach. In this work, we used a subspace correlation limit of 0.9 and a sliding window of 10 seconds, as done in previous studies [Tewarie et al., 2014; van Dellen et al., 2013; van Dellen et al., 2014]. The head position relative to the MEG sensors was recorded continuously using the signals from four head‐localization coils. The head‐localization coil positions were digitized, as well as the outline of the participants scalp (∼500 points), using a 3D digitizer (3SpaceFastTrack, Polhemus, Colchester, VT). Each subject's scalp surface was coregistered to their structural MRI using a surface‐matching procedure, with an estimated resulting accuracy of 4 mm [Whalen et al., 2008]. A single best fitting sphere was fitted to the outline of the scalp as obtained from the coregistered MRI, which was used as a volume conductor model for the beamformer approach described below.
Estimation of Functional Connectivity
For fMRI we computed functional connectivity between BOLD signals of 78 cortical AAL regions by computing the Pearson correlation coefficient [Gong et al., 2009]. To all functional connectivity values, based on these Pearson correlation coefficients, we added one and subsequently divided by two to avoid negative associations. This transformation was performed to ensure that all matrix elements were positive since most algorithms that we used to compute topological measures require positive weights. Subsequently, network parameters were computed on this cortical fMRI network (see below). In addition, average functional connectivity was also computed for the left and right thalamus, where we averaged over hemispheres, that is, for each hemisphere we averaged functional connectivity values from the left or right thalamus to one of the 39 AAL regions in the corresponding hemisphere. For clarity, thalamo‐cortical functional connectivity is in the rest of the paper mentioned as BOLD thalamo‐cortical functional connectivity to remind the reader that this measure is exclusively estimated by fMRI.
For MEG, a beamformer approach was adopted to map MEG data from sensor level to source space [Hillebrand et al., 2012]. First the coregistered MRI was spatially normalized to a template MRI using the SEG‐toolbox in SPM8 [Ashburner and Friston, 2005; Weiskopf et al., 2011]. The cortical regions of the AAL atlas were used to label the voxels in a subject's normalized coregistered MRI [Tzourio‐Mazoyer et al., 2002]. Subcortical structures were removed, and the voxels in the remaining 78 cortical regions of interest (ROIs) were used for further analysis [Gong et al., 2009], after a nonlinear inverse transformation to the patient's coregistered MRI. Next, neuronal activity in the labeled voxels was reconstructed using a scalar beamformer implementation (Elekta Neuromag Oy, beamformer, version 2.1.27) similar to Synthetic Aperture Magnetometry [Robinson and Vrba, 1999]. Briefly, this beamformer sequentially reconstructs the activity for each voxel in a predefined grid covering the entire brain (spacing 2 mm) by selectively weighting the contribution from each MEG sensor to a voxel's time‐series. The beamformer weights are based on the covariance of the recorded time‐series and the forward solution (lead field) of a dipolar source at the voxel location, where data were band‐pass filtered from 0.5–48 Hz. A time‐window of, on average, 299 seconds (range healthy subjects patients 258–297 s; range MS patients 159–595 s, independent t‐test, t = 1.45, P = 0.15) was used to compute the covariance matrix of the recorded time‐series. Singular value truncation was used when inverting the data covariance matrix, using a default setting of 1e‐06 for the ratio between the largest and smallest acceptable singular value. The sensor‐level data were subsequently projected through the beamformer weights, resulting in a time series for each voxel. Each ROI contains many voxels and the number of voxels per ROI differed. In order to represent a ROI by a single time‐series, we selected, for each ROI and frequency band separately, the voxel with maximum power in that frequency band. Six frequency bands were analyzed: delta (0.5–4 Hz), theta (4–8 Hz), lower alpha (8–10 Hz), upper alpha (10–13 Hz), beta (13–30 Hz), and lower gamma bands (30–48 Hz). The time‐series were visually inspected for each subject and frequency band separately and the first 20 artefact‐free epochs of 4096 samples (3.2768 s) were selected from the ROI time‐series using Brainwave (version 0.9.98 available from http://home.kpn.nl/stam7883/brainwave.html).
Then, for each subject and MEG epoch separately, we computed the phase lag index (PLI) between the time‐series for each pair of ROIs to obtain a (78 × 78) functional connectivity matrix. For this purpose, the phase was computed by taking the argument of the analytical signal [Stam et al., 2007]. The PLI calculates the asymmetry of the distribution of (instantaneous) phase differences between two time‐series:
| (1) |
where the phase difference Δφ is defined in the interval [‐π, π], <> denotes the mean value, sign stands for signum function, ‖ indicates the absolute value, and tk corresponds to time with k = 1…Ns where Ns is the number of samples. The PLI ranges between 0 (completely symmetric phase distribution) and 1 (completely asymmetric phase distribution). As field spread and volume conduction causes a zero phase lag (modulus π) between two time‐series, this hardly influences the PLI since this metric captures only consistent, non‐zero, phase lag between two time‐series [Stam et al., 2007]. For PLI analyses, we averaged for each subject the PLI for the 20 epochs, yielding one PLI matrix per subject for each frequency band.
Network Analysis
Nodes in all networks were defined by the 78 cortical AAL regions. For fMRI this indicated that left and right thalami were not included as nodes. This was necessary to keep the size of MEG and fMRI functional networks equal to preserve comparability between modalities (see also the methodological considerations in the discussion [Fornito et al., 2013; van Wijk et al., 2010]). All networks were weighted: in fMRI functional networks links had weights corresponding to the Pearson correlation coefficient between AAL regions and in MEG functional networks links had weights corresponding to the PLI values between AAL regions. For all networks, we computed weighted network properties (average connectivity, clustering coefficient, path length and their normalized versions) and the MST (see below). This was done for each subject, epoch and frequency band for the MEG functional networks (where for each subject frequency‐band specific averages over the 20 epochs were then computed), and for each subject for fMRI functional networks.
The weighted clustering coefficient C is a measure of segregation and is defined as the geometric mean of triangles around a node [Rubinov and Sporns, 2010]:
| (2) |
where wik and wil is the weight between node i and nodes k and l, respectively, and wkl is the weight between nodes k and l. The average weighted clustering coefficient is computed by averaging Ci over all nodes.
The average weighted shortest path length indicates the amount of global integration. The weighted shortest paths are computed using Dijkstra's algorithm, where distance is defined as the inverse of the link weight and the length of a path is the sum of the inverse weights for all the edges in the path. The average weighted shortest path length is computed by averaging path length over all nodes [Rubinov and Sporns, 2010]. Both measures were normalized by the average weighted clustering and path length obtained from 500 random surrogate networks. A high normalized clustering and shortest path length correspond to a more regular network topology, whereas value close to 1 implies a random network topology [Watts and Strogatz, 1998].
MSTs were constructed using Kruskal's algorithm [Kruskal, 1956], although in our case, we started the algorithm with the highest link weights as we were interested in the strongest connections (highest PLI values) in the network. In short, the algorithm first orders the weights of all links in a descending order and starts the construction of the MST with the highest link weight and adds the following highest link weight until all N nodes are connected in a loopless (i.e., not containing cycles) subnetwork that consists of M = N−1 links. A link is ignored if its addition would form a loop. After construction of the MST, all link weights are assigned a value of one. We computed the following MST properties: leaf fraction (L), diameter (d), tree hierarchy (T H) and degree divergence (κ). Leaf number LN is the number of nodes in the tree with a degree of one, where the degree, (k), refers to the number of links connected to a node. Leaf number has a lower bound of 2 and an upper bound of M = N − 1. We report the leaf fraction (=LN/M) which is bounded between 0 and 1. The diameter of the tree is defined as the largest distance between any two nodes in the tree. The upper limit of the diameter is d = M − L + 2, implying that the largest possible diameter decreases with increasing leaf number. Furthermore, we computed tree hierarchy T H, that measures the tradeoff between diameter reduction and overload prevention of the central nodes, which is necessary for efficient communication [Boersma et al., 2012]:
| (3) |
To assure T H ranges between 0 and 1, the denominator is multiplied by 2. If L = 2, that is, a path‐like topology, and M approaches infinity, T H approaches 0. If L = M, that is, a star‐like topology, TH approaches 0.5. BC max refers to the maximum betweenness centrality in the tree network, where betweenness centrality is the fraction of all shortest paths that transverse through a specific node. Finally, we computed degree divergence κ, which is a measure of the broadness of the degree distribution [Barrat et al., 2008]:
| (4) |
Here, <> denotes the average. See Table 2 for a brief description of all network metrics. Note that all network metrics in the present study are global measures. All network metrics were calculated using Brainwave (version 0.9.98 available from http://home.kpn.nl/stam7883/brainwave.html).
Table 2.
Network properties (Definitions are based on [Stam and van Straaten, 2012])
| N | Nodes | Number of nodes in the network |
|---|---|---|
| M | Links | Number of links in the MST |
| C | Clustering | The unweighted clustering coefficient describes the likelihood that neighbours of a node are also connected, and it quantifies the tendency of network elements to form local clusters. We used the weighted equivalent of this measure to characterize local clustering. |
| Path length | Measure for integration; path with lowest sum of link weights between two nodes | |
| k | Degree | Number of neighbors for a given node |
| L | Leaf fraction | Fraction of leaf nodes in the MST where a leaf node is defined as a node with degree one |
| D | Diameter | Longest shortest path of an MST |
| Th | Tree hierarchy | A hierarchical metric that quantifies the tradeoff between large scale integration in the MST and the overload of central nodes. |
| κ | Degree divergence | Measure of the broadness of the degree distribution |
Statistical Analysis
Statistical analyses were performed using SPSS for windows v.20. The data were checked for normality using the Kolmogorov‐Smirnov test and by visually inspecting histograms. Either independent samples t‐tests or the Chi‐square test were used to assess differences in gender, age and education between MS patients and healthy subjects. Structural metrics such as thalamic volumes were compared between groups by means of regression analysis with age, gender and education as covariates. We then followed a two‐step approach:
First, we first compared mean cortical functional connectivity and functional network measures between MS patients and healthy subjects for fMRI and MEG separately using a multivariate general linear model (GLM) with age, gender, and education as covariates. The used multivariate GLM can be considered as a one‐way MANOVA or a multivariate regression analysis with more than one dependent variable, mean cortical functional connectivity and functional network measures in this case. Group membership (MS patients versus healthy controls) was considered as independent variable. Since effect size in males and females may be different, effect size in each gender group was also estimated by computing the relative change within females or males between groups.
Second, only for those metrics that significantly differed between groups, we computed Spearman correlations between functional network properties on the one hand and thalamic volumes, thalamo‐cortical functional connectivity, clinical disability (EDSS), and average cognition on the other hand in the MS patient group only [Rousselet and Pernet, 2012]. For these analyses, we used the average thalamo‐cortical functional connectivity in the MS patient group.
For both steps, we corrected for the number of tests with the false discovery rate (FDR) [Benjamini and Hochberg, 1995].
RESULTS
Table Ireports subject characteristics. MS patients and healthy subjects did not differ in gender or age distribution. Patient group of 83% consisted of relapsing‐remitting MS patients, 6% of secondary, and 11% of primary progressive MS patients. EDSS values ranged between 0 and 6.5 and average cognitive performance was significantly worse (P < 0.001) in the MS patient group. Furthermore, MS patients showed significant reduction in thalamic volumes (Table 1).
Functional Connectivity
In the first step of the analysis, differences in mean cortical functional connectivity (i.e., averaged over cortical ROIs) were assessed between groups for each MEG frequency band separately and for fMRI. We found significantly higher MEG cortical functional connectivity in the theta band and significantly lower MEG cortical functional connectivity in the gamma band for MS patients (Fig. 3 and Supporting Information Table S1). No significant differences between groups in mean fMRI functional connectivity were found at the cortical level.
Figure 3.
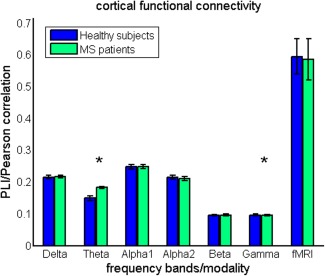
Cortical functional connectivity. Mean cortical functional connectivity (i.e., averaged over cortical ROIs and epochs [MEG]) is compared between groups. Note the significantly higher functional connectivity in the theta band for MS patients and lower functional connectivity in the gamma band in MS patients. Comparison for fMRI based cortical functional connectivity revealed no significant group differences. [Color figure can be viewed in the online issue, which is available at http://wileyonlinelibrary.com.]
However, BOLD thalamo‐cortical functional connectivity was already studied region‐wise in an overlapping but larger cohort, and shown to be higher with respect to especially occipital and temporal areas in MS patients [Schoonheim et al., in press]. Also in this subpopulation, we demonstrate a higher BOLD thalamo‐cortical functional connectivity in MS patients with especially temporal and occipital regions (see Supporting Information Table S2).
Cortical Functional Networks
Conventional network analysis revealed that normalized clustering values were significantly lower in MS patients for all MEG frequency bands, except for the beta band. Normalized path length was only significantly lower in the theta band in MS patients (Fig. 4 and Supporting Information Table S1). Together this indicates that cortical functional networks obtained by MEG are shifted towards more random network topology in MS patients, irrespective of the MEG frequency band. This was more prominent for men than for women, as can be noted from the effect sizes for the groups (Fig. 4 and Supporting Information Table S1). For fMRI, no differences in conventional network measures were found between the groups. However, note that within groups both clustering and path length were higher for fMRI than for MEG, indicating that the topology of fMRI obtained cortical functional networks is more regular‐like.
Figure 4.
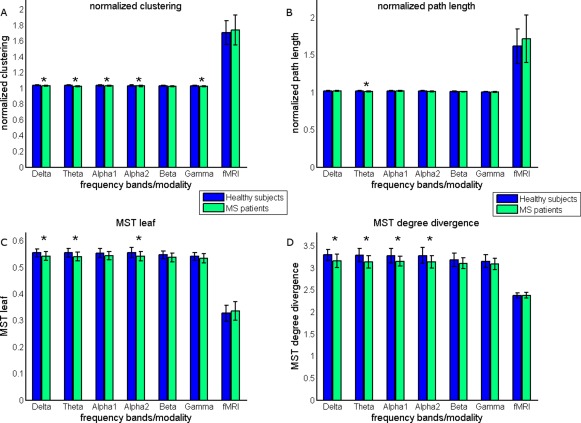
Conventional network and MST findings. Conventional network measures (A) normalized clustering and (B) normalized path length were compared between groups. MEG obtained cortical functional networks were characterized by significantly lower normalized clustering (delta, theta, alpha1, alpha2, and gamma band) and lower normalized path length (theta band), indicating that these networks are shifted towards random networks [Watts and Strogatz 1998]. The MSTs of MS patients were characterized by (C) lower leaf fraction (delta, theta, and alpha2 band) and (D) lower degree divergence (delta, theta, alpha1, and alpha2 band). This suggests that the MSTs of MS patients are shifted towards more path‐like trees (Fig. 5). [Color figure can be viewed in the online issue, which is available at http://wileyonlinelibrary.com.]
To characterize MST topology in both groups, we computed MST leaf fraction, MST degree divergence, MST diameter and MST tree hierarchy. MST analyses for MEG revealed lower leaf fraction for the delta, theta, and alpha2 band in MS patients compared to healthy subjects (Fig. 4 and Supporting Information Table S1). This was accompanied by a lower degree divergence in the delta, theta, and alpha1 alpha2 bands in MS patients (Fig. 4 and Supporting Information Table S1). Analysis of the remaining MST measures for MEG data only revealed that the diameter of MSTs was larger in the theta band in MS patients. Therefore, MSTs in MS patients obtained with MEG tended to have a more path like (less integrated) topology for the delta, theta, alpha1, and alpha2 frequency bands, however, most prominently for the theta and alpha2 band (Fig. 5). In contrast to MEG, we did not find any differences between groups with respect to the MST analysis for fMRI (Fig. 4 and Supporting Information Table S1). However, by inspecting within group differences it is clear that MSTs obtained from fMRI are characterized by lower leaf fraction and lower degree divergence, indicating a more path‐like topology MST topology.
Figure 5.
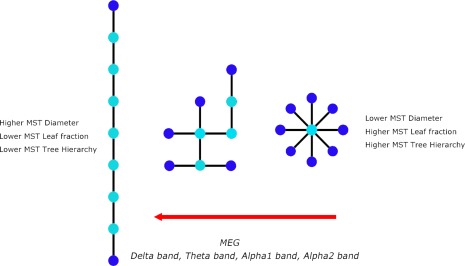
Main MST findings. Three MST configurations are depicted. The MST on the left is known as a path which has a high diameter (d = 8), low number of leaf nodes (end nodes, depicted as dark blue) and is characterized by low tree hierarchy, a measure that quantifies the tradeoff between large scale integration and the overload of central nodes. The MST on the extreme right is known as a star which has a short diameter (d = 2), a large number of leaf nodes and is characterized by a high tree hierarchy. The MST in the middle is an intermediate configuration between these two extremes. For MEG we found a shift towards a more path‐like configuration in MS patients, that is, less efficient and less integrated. In contrast to MEG, we found a shift towards a more star‐like configuration for fMRI. [Color figure can be viewed in the online issue, which is available at http://wileyonlinelibrary.com.]
Cortical Functional Networks vs Thalamic Volume and BOLD Thalamo‐Cortical Functional Connectivity
In the second step of the analysis, we computed correlations between the network properties that significantly differed between groups and thalamic volume and BOLD thalamo‐cortical functional connectivity, only for MS patients (Table 3).
With respect to conventional network measures, we observed that thalamic volume was positively associated with normalized clustering (alpha1, alpha2, and gamma band) and normalized path length (theta band). This suggests that decreased thalamic volumes in MS patients are associated with more random cortical functional network topology. With respect to MST measures, we observed that thalamic volumes in MS patients were positively correlated with MST leaf fraction (theta and alpha2 band) and MST degree divergence (theta and alpha2 band). Thus, a more path‐like topology in MS patients is associated with decreased thalamic volumes.
BOLD thalamo‐cortical functional connectivity was also associated with MEG obtained network measures in MS, however, only in the theta band. We found negative correlations between BOLD thalamo‐cortical functional connectivity and clustering, MST leaf fraction and MST degree divergence in this frequency band. Again, a more random and path‐like topology seemed to be associated with other disease effects in MS such as increased BOLD thalamo‐cortical functional connectivity. Also, note that some MST measures, especially in the theta band, such as leaf fraction and degree divergence were both associated with thalamic atrophy and BOLD thalamo‐cortical functional connectivity (Fig. 6).
Table 3.
Correlations between functional network measures and BOLD thalamo‐cortical functional connectivity, thalamic atrophy, and clinical cognitive measures
| Thalamic volume | BOLD thalamo‐cortical functional connectivity | Average Cognition | EDSS | |
|---|---|---|---|---|
| Normalized clustering Delta | 0.16 (0.15) | −0.18 (0.10) | 0.09 (0.40) | −0.40 (<0.001) |
| Normalized clustering Theta | 0.23 (0.03) | −0.42 (<0.001) | 0.13 (0.23) | −0.17 (0.12) |
| Normalized clustering Alpha1 | 0.32 (0.003) | −0.17 (0.13) | 0.15 (0.19) | −0.31 (0.004) |
| Normalized clustering Alpha2 | 0.42 (<0.001) | −0.09 (0.42) | 0.16 (0.14) | −0.27 (0.01) |
| Normalized clustering Gamma | 0.36 (0.001) | −0.22 (0.05) | 0.12 (0.28) | −0.19 (0.08) |
| Normalized path length Theta | 0.36 (0.001) | −0.23 (0.04) | 0.26 (0.02) | −0.09 (0.40) |
| MST Leaf fraction Delta | 0.09 (0.41) | −0.24 (0.03) | 0.12 (0.30) | −0.40 (<0.001) |
| MST Leaf fraction Theta | 0.33 (0.002) | −0.31 (0.005) | 0.22 (0.05) | −0.30 (0.001) |
| MST Leaf fraction Alpha2 | 0.28 (0.01) | −0.26 (0.02) | 0.06 (0.56) | −0.17 (0.13) |
| MST Diameter Theta | −0.14 (0.21) | 0.19 (0.1) | −0.08 (0.46) | 0.05 (0.65) |
| MST Degree divergence Delta | 0.05 (0.67) | −0.14 (0.23) | 0.07 (0.54) | −0.36 (0.001) |
| MST Degree divergence Theta | 0.29 (0.007) | −0.35 (0.001) | 0.16 (0.14) | −0.28 (0.01) |
| MST Degree divergence Alpha1 | 0.23 (0.04) | −0.23 (0.04) | 0.29 (0.007) | −0.35 (0.001) |
| MST Degree divergence Alpha2 | 0.34 (0.002) | −0.22 (0.05) | 0.16 (0.15) | −0.13 (0.23) |
Values are reported as Spearman correlation values (P‐value) (step 2 of the analysis).
Bold, significant after correcting for multiple comparisons by the FDR. Italic, the result is not significant anymore after correction for multiple comparisons using the FDR (corrected for 4 × 14 tests) with FDR = p FDR *i/N. Here, p FDR = 0.05 (usual significance value in most statistical tests), i refers to the ranked index of the P‐values that are computed and N to the number of tests.
Figure 6.
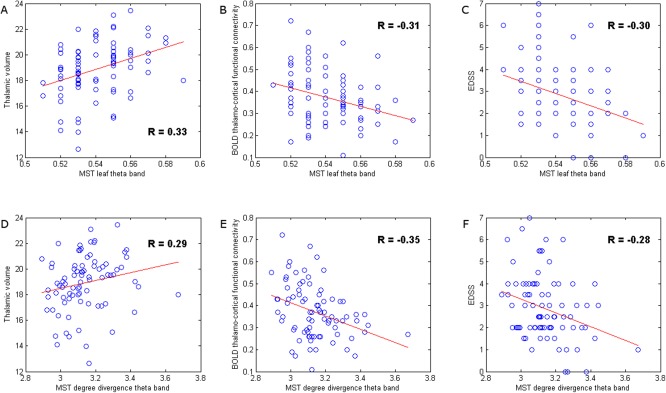
Correlation analysis. These scatter plots illustrate the relationship between disruption of cortical functional network topology in the theta band with other pathological characteristics of the disease, such as thalamic atrophy and increased BOLD thalamo‐cortical functional connectivity, and with clinical status in MS (EDSS). Although other network measures were also related to thalamic pathology and clinical status, we illustrate that two network measures itself were related to both thalamic pathology and clinical status. MST leaf fraction in the theta band in MS patients was positively correlated to thalamic volume (A), but negatively correlated to BOLD thalamo‐cortical functional connectivity (B) and EDSS (C). Similarly, MST degree divergence in the theta band in MS patients was positively correlated to thalamic volume (D), but also negatively correlated to BOLD thalamo‐cortical functional connectivity (E) and EDSS (F), that is, general decrease in the degree of nodes seemed to be a sign of damage. [Color figure can be viewed in the online issue, which is available at http://wileyonlinelibrary.com.]
Cortical Functional Networks vs Clinical and Cognitive Dysfunction
To investigate if a more random or path‐like network topology in MS had clinical significance, we computed correlations between MEG network measures that significantly differed between the groups and average cognition and physical disability (EDSS). These correlations were only computed for the MS patient group (Table 3).
With respect to average cognition, we only found a positive correlation between this outcome variable with MST degree divergence in the alpha1 band.
For EDSS, we found significant negative correlations with several MEG obtained network measures in several frequency bands: normalized clustering (delta, alpha1, and alpha2 band), MST leaf fraction (delta, theta, alpha1), MST degree divergence (delta, theta, alpha1) and MST tree hierarchy (alpha2 band). These findings demonstrate that a more random or path‐like network topology in MS in several frequency bands is indeed related to clinical and cognitive status. Note that some network measures that had significant correlations with EDSS were also associated with reduced thalamic volume and increased BOLD thalamo‐cortical functional connectivity. This was especially the case for MST measures in the theta band, such as the degree divergence and the leaf fraction.
DISCUSSION
We hypothesized that widespread disruption of the thalamocortical system, consisting of cortical functional networks connected with the thalamus, would be associated with physical disability and cognitive dysfunction (Fig. 1). Our main findings were: (1) a disruption of cortical functional connectivity, as measured with MEG, and a shift towards a more random functional network topology in several MEG frequency bands in early MS. This was confirmed by MST findings that showed a less integrated (more path‐like) tree topology for the same MEG frequency bands; (2) MS patients showed increased thalamocortical functional connectivity and thalamic atrophy, which (3) was associated with the shift towards a more random network topology or more path‐like tree topology; (4) last, for only MS patients, we demonstrated that this shift in network topology was associated with worse cognitive and physical disability.
Functional Connectivity
Functional connectivity analyses revealed higher MEG functional connectivity in the theta band and lower functional connectivity in the gamma band. Higher functional connectivity in the theta band has been reported in previous studies in different disease cohorts and has been positively associated with disruption of gray matter thickness correlations in MS [Schoonheim et al., 2011; Tewarie et al., 2014]. Lower functional connectivity in the gamma band has not been a consistent finding in MEG and electroencephalography (EEG) studies so far, which makes the interpretation of this finding less straightforward, especially considering the potential for biases due to contamination by muscle activity [Pope et al., 2009]. We also mention a trend of lower functional connectivity in the alpha2 band and a trend of higher functional connectivity in the beta band as these current findings, especially for the alpha2 band, have also been reported consistently in previous studies and have been linked to clinical and cognitive dysfunction [Cover et al., 2006; Leocani et al., 2000; Schoonheim et al., 2011; Tewarie et al., 2013b; Tewarie et al., 2014].
Cortical Functional Networks
MEG functional network analyses revealed disruption of cortical functional networks in early MS quantified by both conventional network measures as well as MST measures. Using conventional network measures, we found a shift toward a more random network topology in MS patients for several MEG frequency bands (delta, theta, alpha1, alpha2, and gamma band). A more random network topology in the alpha2 band has also been reported in a previous MEG study in an MS sample with longer disease duration [Tewarie et al., 2014]. The same study reported a more regular network topology in the theta band, which was also in agreement with one earlier MEG study analyzing an MS sample with similar disease duration as this study [Schoonheim et al., 2011]. Discrepancy between the latter studies and this study may be caused by the use of a different functional connectivity metric, analysis at the sensor level in one of the previous study, due to biases inherent to conventional network analysis such as differences in average functional connectivity, differences in density between networks or due to difference in disease duration. Therefore, we also computed MST measures to control for these biases and we found that MSTs in MS patients displayed a less integrated, more path‐like, tree topology (delta, theta, alpha1, alpha2). This type of topology was also accompanied with lower degree divergence, indicative of a loss of high degree nodes or an overall decrease in degrees of nodes in the network, which is generally observed in neurological disorders [Crossley et al., 2014]. The shift toward a more path‐like tree topology and thus less integrated MEG network has been a consistent finding in MS as has also been linked to worse cognitive performance [Tewarie et al., 2013a; Tewarie et al., 2014]. Other recent MEG studies involving patients with Parkinson's disease or gliomas also found that shifts toward more path‐like tree topologies were signs of mal‐adaptation or cognitive dysfunction [Olde Dubbelink, in preparation; van Dellen E. et al., 2014]. The hypothesis is that an optimal configuration for a tree should allow for large scale integration and at the same time it has to prevent overload of central nodes. Such an optimal configuration is probably somewhere between a path‐like topology and a star‐like topology and may constitute an optimum level of hierarchy and allows for efficiency. A shift toward a more path‐like topology in MS could therefore also indicate a less efficient and hierarchical network which is required for integration of distinct cognitive functions.
Cortical Functional Networks vs Thalamic Pathology and Disability
The thalamus plays a central role in transferring information in the brain and is one of the most important predictors for clinical and cognitive status in MS [Schoonheim et al., 2012]. We therefore hypothesized that atrophy of this important structure would co‐occur with widespread disintegration of functional brain connectivity. In this study, we indeed found that thalamic atrophy was associated with a shift to a more random cortical network topology or a more path‐like tree topology. We suggest that this relation between thalamic atrophy and disintegration may partially be mediated by increased BOLD thalamo‐cortical functional connectivity, which might be maladaptive in this context. The clinical relevance of disruption of this thalamo‐cortical system is that less integrated functional networks were associated with worse cognitive performance and especially with worse physical disability. This indicates that physical disability is not only explained by pathology in the motor cortex or pyramidal tract alone but is also influenced by global network damage. The correlations between network measures and clinical status were moderate, which indicates that a part of the occurring physical disability needs to be explained by other measures, such as spinal cord damage since these are not captured by brain related measures [Daams et al., 2014].
Not all frequency bands that showed an abnormal network layout were related to thalamic pathology. For example, network disruption in the delta band showed associations with worse physical disability, but not with BOLD thalamo‐cortical functional connectivity or thalamic atrophy, indicating that worse physical disability may not merely be associated by changes due to thalamic atrophy but also with cortical pathology that may be independent of thalamic atrophy. This also indicates that the relation between disintegration of cortical functional brain networks and thalamic atrophy is frequency dependent, which makes sense given the knowledge that the role of the thalamus as cogenerator of brain rhythms and oscillations is frequency specific [Grossberg and Versace, 2008; Hughes and Crunelli, 2005; Klimesch et al., 2007; Steriade, 1997].
In this study, we analyzed associations between functional networks and thalamic atrophy in early MS and therefore we have to stress that we cannot make causal claims that thalamic atrophy causes disruption of cortical functional networks. In other words: this relation might be reverse, causally bidirectional or driven by a third common source. However, in analyses of a previous study, we showed that increased BOLD thalamo‐cortical functional connectivity was only present in more severely cognitively impaired patients. Thalamic atrophy was worst in these patients as well, although it was also significantly present in cognitively preserved patients [Schoonheim et al., in press]. Therefore, it is likely that thalamic atrophy may precede increases in BOLD thalamo‐cortical functional connectivity, and as a result may also play a causal role for disintegration of cortical functional networks. Future longitudinal studies are needed to explore this hypothesis further. However, on the other hand, increased BOLD thalamo‐cortical functional connectivity itself may lead to structural damage and thus contribute to thalamic atrophy since it has been demonstrated in modelling studies that increased firing rates or functional connectivity due to disinhibition may lead to synaptic damage, especially in central regions, such as the thalamus [de Haan W. et al., 2012; Kostic et al., 2013]. It is also plausible that increased thalamic connectivity might lead to increased local neurotransmitter levels, perhaps leading to excitotoxicity.
Furthermore, the thalamus is involved in feedback projections (first order relays) and in feedforward cortico‐thalamo‐cortical routes (higher order relays) [Sherman, 2007]. These feedforward routes that travel trough the thalamus may serve as parallel pathways to cortico‐cortical projections and could play an important role in integration of information in functional cortical networks. Therefore, thalamic atrophy in MS could impact these parallel feedforward cortico‐thalamo‐cortical projections, which could eventually lead to less integrated cortical functional networks. Last, we have to stress that the relationship between thalamic atrophy and disruption of cortical functional networks could also be driven by a third common global process. For example, white matter lesions or decreased white matter integrity could be associated with structural disconnection between the cortex and the thalamus [Steenwijk et al., 2014]. Similarly, diffuse occurrence of gray matter lesions in both the cortex and the thalamus [Minagar et al., 2013] may lead to both thalamic atrophy and altered cortical functional networks. Future studies are needed to tease these factors apart.
Methodological Considerations
We need to mention some methodological disadvantages and advantages of our approach. First, in our beamforming analysis of MEG data we selected the time‐series of one voxel (i.e., the voxel with the highest power) as a representation for the whole ROI. This can be regarded as a reduction of data. However, averaging over voxels in a ROI could introduce biases due to differences in ROI size leading to time‐series having different signal‐to‐noise‐ratios. Given these biases with averaging over sources, we chose to adhere to methods used previously in our group [Hillebrand et al., 2012]. Furthermore, we used a single sphere as a volume conductor model, which may have lead to localisation inaccuracies, particularly near temporal regions [Lalancette et al., 2011]. However, we have assumed that the effects of these potential inaccuracies are negligible, given the spatial resolution of the AAL atlas in these regions. Second, functional network analyses revealed widespread disruption of cortical MEG functional networks, which was not reflected in cortical fMRI functional networks. This could be caused by either higher sensitivity of MEG due to its higher temporal resolution, and/or due to use of an atlas as most fMRI findings in MS have been found at the voxel level and usage of an atlas might minimize the advantage of having a high spatial resolution for fMRI [Bonavita et al., 2011; Hawellek et al., 2011; Rocca et al., 2012; Schoonheim et al., 2013b]. Third, MSTs mainly capture the strongest functional connections in the functional networks, which were not the same for MEG and fMRI. For fMRI we observed the highest functional connectivity in homologous interhemispheric connectivity, which was not the case for MEG. Nevertheless, the inclusion of fMRI in addition to MEG proved to provide important additional information regarding functional connectivity of the thalamus, as it enabled the observation that increased BOLD thalamo‐cortical functional connectivity was related to disruption of MEG functional networks.
Fourth, we did not include the left and right thalamus as a node in the fMRI functional network. The rationale behind this was to construct functional networks for MEG and fMRI with equal size (equal number of nodes) since differences in network size can cause biases in network comparisons [van Wijk et al., 2010]. The rationale to leave out subcortical ROIs in the AAL atlas and therefore in the MEG functional networks is that the MEG sensitivity for activity in these ROIs is very low [Hillebrand and Barnes, 2002]. Estimated time‐series for these regions are consequently very noisy, and the spatial resolution for these deep structures is poor. One would therefore not be sure whether an estimated source corresponding to the thalamus was only associated with thalamus activity or also with activity from surrounding deep gray matter structures or even from the cortex. Fifth, there was a mismatch between the numbers of MS patients and healthy subjects. A larger healthy subject group could have led to more reliable results for this group and a higher sensitivity to pick up disease effects. Sixth, in this first multimodal fMRI/MEG analysis in MS, we omitted computation of nodal network properties in order to preserve a clear message. However, future studies could examine whether regions with different roles in the functional network are affected differentially by thalamic atrophy and thalamo‐cortical interactions, and how this relates to clinical symptoms and cognition. Last, the main advantages of the used MEG atlas‐based beamformer approach over sensor‐level analyses is that it improves the signal‐to‐noise of the reconstructed timeseries [Adjamian et al., 2009], eases interpretation in terms of involved anatomical structures, and the usage of an atlas allows for direct comparison of MEG with fMRI.
CONCLUSIONS
There is a need for an integrated and cross‐modal framework that is able to clarify how complex pathological alterations affecting both structure and function are related to each other and how the interplay between these eventually lead to clinical and cognitive problems in MS. This study was a step toward such an integrated framework where we found that thalamic atrophy, one of the most important predictors of clinical and cognitive dysfunction in MS, was associated with less integrated cortical functional networks, possibly mediated by increased BOLD thalamo‐cortical functional connectivity. This is the first multimodal fMRI and MEG study that analyzed disintegration of functional networks in relation to thalamic atrophy in early MS, in which we have demonstrated that a multimodal approach has an advantage over an unimodal approach as MEG and fMRI findings were complementary. The importance of these findings is that it demonstrates how two different pathological features in early MS are indeed related and how they are associated with physical disability and cognitive dysfunction. Future studies are warranted to investigate to what extent disruption of this thalamo‐cortical system occurs in latter stages of the disease or whether it is different between MS disease types.
Supporting information
Supplementary Information Table S1.
Supplementary Information Table S2.
Supplementary Information
ACKNOWLEDGMENTS
The authors thank Jos van Kuik, Natasja Heederik, Alexandra Linger, and Laura Overbeek for their assistance during the inclusion and assessment of the participants. They also thank Karin Plugge, Ndedi Sijsma, Peter Jan Ris, and Nico Akemann for recording the MEG data. In addition, They thank Ndedi Sijsma for assistance with post‐processing of MEG data.
REFERENCEs
- Adjamian P, Worthen SF, Hillebrand A, Furlong PL, Chizh BA, Hobson AR, Aziz Q, Barnes GR (2009): Effective electromagnetic noise cancellation with beamformers and synthetic gradiometry in shielded and partly shielded environments. J Neurosci Methods 178:120–127. [DOI] [PubMed] [Google Scholar]
- Ashburner J, Friston KJ (2005): Unified segmentation. Neuroimage 26:839–851. [DOI] [PubMed] [Google Scholar]
- Barrat A, Barthelemy M, Vespignani A (2008): Networks and complexity. In: Dynamical processes on complex networks. pp 24–49, Cambridge University Press, New York. [Google Scholar]
- Batista S, Zivadinov R, Hoogs M, Bergsland N, Heininen‐Brown M, Dwyer MG, Weinstock‐Guttman B, Benedict RH (2012): Basal ganglia, thalamus and neocortical atrophy predicting slowed cognitive processing in multiple sclerosis. J Neurol 259:139–146. [DOI] [PubMed] [Google Scholar]
- Benjamini Y, Hochberg Y (1995): Controlling the false discovery rate: a practical and powerful approach to multiple testing. J R Stat Soc 57:289–300. [Google Scholar]
- Boersma M, Smit DJ, Boomsma DI, Geus EJ, Delemarre‐van de Waal HA, Stam C (2012): Growing trees in child brains: Graph theoretical analysis of EEG derived minimum spanning tree in 5 and 7 year old children reflects brain maturation. Brain Connect 3:50–60. [DOI] [PubMed] [Google Scholar]
- Bonavita S, Gallo A, Sacco R, Corte MD, Bisecco A, Docimo R, Lavorgna L, Corbo D, Costanzo AD, Tortora F, Cirillo M, Esposito F, Tedeschi G (2011): Distributed changes in default‐mode resting‐state connectivity in multiple sclerosis. Mult Scler 17:411–422. [DOI] [PubMed] [Google Scholar]
- Bullmore E, Sporns O (2009): Complex brain networks: Graph theoretical analysis of structural and functional systems. Nat Rev Neurosci 10:186–198. [DOI] [PubMed] [Google Scholar]
- Bullmore E, Sporns O (2012): The economy of brain network organization. Nat Rev Neurosci 13:336–349. [DOI] [PubMed] [Google Scholar]
- Cader S, Cifelli A, Abu‐Omar Y, Palace J, Matthews PM (2006): Reduced brain functional reserve and altered functional connectivity in patients with multiple sclerosis. Brain 129:527–537. [DOI] [PubMed] [Google Scholar]
- Cover KS, Vrenken H, Geurts JJ, van Oosten BW, Jelles B, Polman CH, Stam CJ, van Dijk BW (2006): Multiple sclerosis patients show a highly significant decrease in alpha band interhemispheric synchronization measured using MEG. Neuroimage 29:783–788. [DOI] [PubMed] [Google Scholar]
- Crossley NA, Mechelli A, Scott J, Carletti F, Fox PT, McGuire P, Bullmore ET (2014): The hubs of the human connectome are generally implicated in the anatomy of brain disorders. Brain 137:2382–2395. [DOI] [PMC free article] [PubMed] [Google Scholar]
- Daams M, Weiler F, Steenwijk MD, Hahn HK, Geurts JJ, Vrenken H, van Schijndel RA, Balk LJ, Tewarie PK, Tillema JM, Killestein J, Uitdehaag BM, Barkhof F (2014): Mean upper cervical cord area (MUCCA) measurement in long‐standing multiple sclerosis: Relation to brain findings and clinical disability. Mult Scler. [DOI] [PubMed] [Google Scholar]
- de Haan W., Mott K, van Straaten EC, Scheltens P, Stam CJ (2012): Activity dependent degeneration explains hub vulnerability in Alzheimer's disease. PLoS Comput Biol 8:e1002582. [DOI] [PMC free article] [PubMed] [Google Scholar]
- Dogonowski AM, Siebner HR, Sorensen PS, Wu X, Biswal B, Paulson OB, Dyrby TB, Skimminge A, Blinkenberg M, Madsen KH (2013): Expanded functional coupling of subcortical nuclei with the motor resting‐state network in multiple sclerosis. Mult Scler 19:559–566. [DOI] [PubMed] [Google Scholar]
- Fornito A, Zalesky A, Breakspear M (2013): Graph analysis of the human connectome: Promise, progress, and pitfalls. Neuroimage 80C:426–444. [DOI] [PubMed] [Google Scholar]
- Gamboa OL, Tagliazucchi E, von WF, Jurcoane A, Wahl M, Laufs H, Ziemann U (2013): Working memory performance of early MS patients correlates inversely with modularity increases in resting state functional connectivity networks. Neuroimage 94:385–395. [DOI] [PubMed] [Google Scholar]
- Gong G, He Y, Concha L, Lebel C, Gross DW, Evans AC, Beaulieu C (2009): Mapping anatomical connectivity patterns of human cerebral cortex using in vivo diffusion tensor imaging tractography. Cereb Cortex 19:524–536. [DOI] [PMC free article] [PubMed] [Google Scholar]
- Grossberg S, Versace M (2008): Spikes, synchrony, and attentive learning by laminar thalamocortical circuits. Brain Res 1218:278–312. [DOI] [PubMed] [Google Scholar]
- Hardmeier M, Schoonheim MM, Geurts JJ, Hillebrand A, Polman CH, Barkhof F, Stam CJ (2012): Cognitive dysfunction in early multiple sclerosis: altered centrality derived from resting‐state functional connectivity using magneto‐encephalography. PLoS One 7:e42087. [DOI] [PMC free article] [PubMed] [Google Scholar]
- Hawellek DJ, Hipp JF, Lewis CM, Corbetta M, Engel AK (2011): Increased functional connectivity indicates the severity of cognitive impairment in multiple sclerosis. Proc Natl Acad Sci USA 108:19066–19071. [DOI] [PMC free article] [PubMed] [Google Scholar]
- Hillebrand A, Barnes GR (2002): A quantitative assessment of the sensitivity of whole‐head MEG to activity in the adult human cortex. Neuroimage 16:638–650. [DOI] [PubMed] [Google Scholar]
- Hillebrand A, Barnes GR, Bosboom JL, Berendse HW, Stam CJ (2012): Frequency‐dependent functional connectivity within resting‐state networks: an atlas‐based MEG beamformer solution. Neuroimage 59:3909–3921. [DOI] [PMC free article] [PubMed] [Google Scholar]
- Houtchens MK, Benedict RH, Killiany R, Sharma J, Jaisani Z, Singh B, Weinstock‐Guttman B, Guttmann CR, Bakshi R (2007): Thalamic atrophy and cognition in multiple sclerosis. Neurology 69:1213–1223. [DOI] [PubMed] [Google Scholar]
- Hughes SW, Crunelli V (2005): Thalamic mechanisms of EEG alpha rhythms and their pathological implications. Neuroscientist 11:357–372. [DOI] [PubMed] [Google Scholar]
- Klimesch W, Sauseng P, Hanslmayr S (2007): EEG alpha oscillations: the inhibition‐timing hypothesis. Brain Res Rev 53:63–88. [DOI] [PubMed] [Google Scholar]
- Kostic M, Zivkovic N, Stojanovic I (2013): Multiple sclerosis and glutamate excitotoxicity. Rev Neurosci 24:71–88. [DOI] [PubMed] [Google Scholar]
- Kurtzke JF (1983): Rating neurologic impairment in multiple sclerosis: an expanded disability status scale (EDSS). Neurology, 33:1444–1452. [DOI] [PubMed] [Google Scholar]
- Kruskal J (1956): On the Shortest Spanning Subtree of a Graph and the Traveling Salesman Problem. Proceedings of the American Mathematical Society, Vol. 7, American Mathematical Society, Providence, USA, pp 48–50. [Google Scholar]
- Lalancette M, Quraan M, Cheyne D (2011): Evaluation of multiple‐sphere head models for MEG source localization. Phys Med Biol 56:5621–5635. [DOI] [PubMed] [Google Scholar]
- Lee U, Kim S, Jung KY (2006): Classification of epilepsy types through global network analysis of scalp electroencephalograms. Phys Rev E 73:041920. [DOI] [PubMed] [Google Scholar]
- Lee U, Oh G, Kim S, Noh G, Choi B, Mashour GA (2010): Brain networks maintain a scale‐free organization across consciousness, anesthesia, and recovery: evidence for adaptive reconfiguration. Anesthesiology 113:1081. [DOI] [PMC free article] [PubMed] [Google Scholar]
- Leocani L, Locatelli T, Martinelli V, Rovaris M, Falautano M, Filippi M, Magnani G, Comi G (2000): Electroencephalographic coherence analysis in multiple sclerosis: Correlation with clinical, neuropsychological, and MRI findings. J Neurol Neurosurg Psychiatry 69:192–198. [DOI] [PMC free article] [PubMed] [Google Scholar]
- Minagar A, Barnett MH, Benedict RH, Pelletier D, Pirko I, Sahraian MA, Frohman E, Zivadinov R (2013): The thalamus and multiple sclerosis: modern views on pathologic, imaging, and clinical aspects. Neurology 80:210–219. [DOI] [PMC free article] [PubMed] [Google Scholar]
- Parisi L, Rocca MA, Valsasina P, Panicari L, Mattioli F, Filippi M (2012): Cognitive rehabilitation correlates with the functional connectivity of the anterior cingulate cortex in patients with multiple sclerosis. Brain Imaging Behav 8:387–393. [DOI] [PubMed] [Google Scholar]
- Polman CH, Reingold SC, Edan G, Filippi M, Hartung HP, Kappos L, Lublin FD, Metz LM, McFarland HF, O'Connor PW, Sandberg‐Wollheim M, Thompson AJ, Weinshenker BG, Wolinsky JS (2005): Diagnostic criteria for multiple sclerosis: 2005 revisions to the "McDonald Criteria". Ann Neurol 58:840–846. [DOI] [PubMed] [Google Scholar]
- Pope KJ, Fitzgibbon SP, Lewis TW, Whitham EM, Willoughby JO (2009): Relation of gamma oscillations in scalp recordings to muscular activity. Brain topography 22:13–17. [DOI] [PubMed] [Google Scholar]
- Prakash RS, Patterson B, Janssen A, Abduljalil A, Boster A (2011): Physical activity associated with increased resting‐state functional connectivity in multiple sclerosis. J Int Neuropsychol Soc 17:986–997. [DOI] [PubMed] [Google Scholar]
- Robinson SE, Vrba J (1999):Functional neuroimaging by synthetic aperture magnetometry In: Yoshimoto M, Kotani S, Kuriki H, Karibe N, Nakatato E, editors. Recent Advances in Biomagnetism. Sendai: Tohoku University Press; pp 302–305. [Google Scholar]
- Rocca MA, Pagani E, Absinta M, Valsasina P, Falini A, Scotti G, Comi G, Filippi M (2007): Altered functional and structural connectivities in patients with MS: a 3‐T study. Neurology 69:2136–2145. [DOI] [PubMed] [Google Scholar]
- Rocca MA, Valsasina P, Martinelli V, Misci P, Falini A, Comi G, Filippi M (2012): Large‐scale neuronal network dysfunction in relapsing‐remitting multiple sclerosis. Neurology 79:1449–1457. [DOI] [PubMed] [Google Scholar]
- Rousselet GA, Pernet CR (2012): Improving standards in brain‐behavior correlation analyses. Front Hum Neurosci 6:119. [DOI] [PMC free article] [PubMed] [Google Scholar]
- Rubinov M, Sporns O (2010): Complex network measures of brain connectivity: Uses and interpretations. Neuroimage 52:1059–1069. [DOI] [PubMed] [Google Scholar]
- Schoen W, Chang JS, Lee U, Bob P, Mashour GA (2011): The temporal organization of functional brain connectivity is abnormal in schizophrenia but does not correlate with symptomatology. Conscious Cogn 20:1050–1054. [DOI] [PubMed] [Google Scholar]
- Schoonheim MM, Geurts JJ, Landi D, Douw L, van der Meer ML, Vrenken H, Polman CH, Barkhof F, Stam CJ (2011): Functional connectivity changes in multiple sclerosis patients: A graph analytical study of MEG resting state data. Hum Brain Mapp 34:52–61. [DOI] [PMC free article] [PubMed] [Google Scholar]
- Schoonheim MM, Popescu V, Rueda Lopes FC, Wiebenga OT, Vrenken H, Douw L, Polman CH, Geurts JJ, Barkhof F (2012): Subcortical atrophy and cognition: sex effects in multiple sclerosis. Neurology 79:1754–1761. [DOI] [PubMed] [Google Scholar]
- Schoonheim MM, Vigeveno RM, Lopes FC, Pouwels PJ, Polman CH, Barkhof F, Geurts JJ (2013a): Sex‐specific extent and severity of white matter damage in multiple sclerosis: Implications for cognitive decline. Hum Brain Mapp 35: 2348–2358. [DOI] [PMC free article] [PubMed] [Google Scholar]
- Schoonheim M, Geurts J, Wiebenga O, de Munck J, Polman C, Stam C, Barkhof F, Wink A (2013b): Decreased functional network centrality in early multiple sclerosis: Relations with cognitive dysfunction and physical disability. Mult Scler 20:1058–1065. [DOI] [PubMed] [Google Scholar]
- Schoonheim M, Hulst HE, Roemer B, Strik M, Wink AM, Uitdehaag BMJ, Barkhof F, Geurts JG: Thalamus structure and function determines severity of cognitive impairment in multiple sclerosis (in press). [DOI] [PubMed]
- Sherman SM (2007): The thalamus is more than just a relay. Curr Opin Neurobiol 17:417–422. [DOI] [PMC free article] [PubMed] [Google Scholar]
- Smith SM, Zhang Y, Jenkinson M, Chen J, Matthews PM, Federico A, De SN (2002): Accurate, robust, and automated longitudinal and cross‐sectional brain change analysis. Neuroimage 17:479–489. [DOI] [PubMed] [Google Scholar]
- Stam CJ, van Straaten EC (2012): The organization of physiological brain networks. Clin Neurophysiol 123:1067–1087. [DOI] [PubMed] [Google Scholar]
- Stam CJ, Nolte G, Daffertshofer A (2007): Phase lag index: Assessment of functional connectivity from multi channel EEG and MEG with diminished bias from common sources. Hum Brain Mapp 28:1178–1193. [DOI] [PMC free article] [PubMed] [Google Scholar]
- Steenwijk MD, Daams M, Pouwels PJW, Balk L, Tewarie P, Killestein J, Uitdehaag BMJ, Geurts JJG, Barkhof F, Vrenken H (2014): What explains gray matter atrophy in long‐standing multiple sclerosis? Radiology 272:832–842. [DOI] [PubMed] [Google Scholar]
- Steriade M (1997): Synchronized activities of coupled oscillators in the cerebral cortex and thalamus at different levels of vigilance. Cereb Cortex 7:583–604. [DOI] [PubMed] [Google Scholar]
- Taulu S, Hari R (2009): Removal of magnetoencephalographic artifacts with temporal signal‐space separation: Demonstration with single‐trial auditory‐evoked responses. Hum Brain Mapp 30:1524–1534. [DOI] [PMC free article] [PubMed] [Google Scholar]
- Taulu S, Simola J (2006): Spatiotemporal signal space separation method for rejecting nearby interference in MEG measurements. Phys Med Biol 51:1759–1768. [DOI] [PubMed] [Google Scholar]
- Tewarie P, Hillebrand A, Schoonheim MM, van Dijk BW, Geurts JJG, Barkhof F, Polman CH, Stam CJ (2013a): Functional brain network analysis using minimum spanning trees in Multiple Sclerosis: An MEG source‐space study. Neuroimage 88:308–318. [DOI] [PubMed] [Google Scholar]
- Tewarie P, Schoonheim MM, Stam CJ, van der Meer ML, van Dijk BW, Barkhof F, Polman CH, Hillebrand A (2013b): Cognitive and clinical dysfunction, altered MEG resting‐state networks and thalamic atrophy in multiple sclerosis. PLoS One 8:e69318. [DOI] [PMC free article] [PubMed] [Google Scholar]
- Tewarie P, Hillebrand A, DE, van Schoonheim MM, Barkhof F, Polman CH, Beaulieu C, Gong G, van Dijk BW, Stam CJ (2014): Structural degree predicts functional network connectivity: A multimodal resting‐state fMRI and MEG study. Neuroimage 97:296–307. [DOI] [PubMed] [Google Scholar]
- Tewarie P, Steenwijk M, Tijms B, Daams M, Balk L, Stam C, Uitdehaag B, Polman C, Geurts J, Barkhof F, Pouwels P, Vrenken H, Hillebrand A (2014): Disruption of structural and functional networks in long‐standing multiple sclerosis. Hum Brain Mapp. [DOI] [PMC free article] [PubMed] [Google Scholar]
- Tona F, Petsas N, Sbardella E, Prosperini L, Carmellini M, Pozzilli C, Pantano P (2014): Multiple Sclerosis: Altered Thalamic Resting‐State Functional Connectivity and Its Effect on Cognitive Function. Radiology 271:814–821. [DOI] [PubMed] [Google Scholar]
- Tzourio‐Mazoyer N, Landeau B, Papathanassiou D, Crivello F, Etard O, Delcroix N, Mazoyer B, Joliot M (2002): Automated anatomical labeling of activations in SPM using a macroscopic anatomical parcellation of the MNI MRI single‐subject brain. Neuroimage 15:273–289. [DOI] [PubMed] [Google Scholar]
- Valsasina P, Rocca MA, Absinta M, Sormani MP, Mancini L, De SN, Rovira A, Gass A, Enzinger C, Barkhof F, Wegner C, Matthews PM, Filippi M (2011): A multicentre study of motor functional connectivity changes in patients with multiple sclerosis. Eur J Neurosci 33:1256–1263. [DOI] [PubMed] [Google Scholar]
- van Dellen E., Douw L, Hillebrand A, de Witt Hamer PC, Baayen JC, Heimans JJ, Reijneveld JC, Stam CJ (2014): Epilepsy surgery outcome and functional network alterations in longitudinal MEG: A minimum spanning tree analysis. Neuroimage 86:354–363. [DOI] [PubMed] [Google Scholar]
- van Dellen E, de Witt Hamer PC, Douw L, Klein K, Heimans JJ, Stam CJ, Reijneveld JC, Hillebrand A (2013): Connectivity in MEG resting‐state networks increases after resective surgery for low‐grade glioma and correlates with improved cognitive performance. Neuroimage:clinical 2:1–7. [DOI] [PMC free article] [PubMed] [Google Scholar]
- van Wijk BC, Stam CJ, Daffertshofer A (2010): Comparing brain networks of different size and connectivity density using graph theory. PLoS One 5:e13701. [DOI] [PMC free article] [PubMed] [Google Scholar]
- Watts DJ, Strogatz SH (1998): Collective dynamics of 'small‐world' networks. Nature 393:440–442. [DOI] [PubMed] [Google Scholar]
- Weiskopf N, Lutti A, Helms G, Novak M, Ashburner J, Hutton C (2011): Unified segmentation based correction of R1 brain maps for RF transmit field inhomogeneities (UNICORT). Neuroimage 54:2116–2124. [DOI] [PMC free article] [PubMed] [Google Scholar]
- Whalen C, Maclin EL, Fabiani M, Gratton G (2008): Validation of a method for coregistering scalp recording locations with 3D structural MR images. Hum Brain Mapp 29:1288–1301. [DOI] [PMC free article] [PubMed] [Google Scholar]
Associated Data
This section collects any data citations, data availability statements, or supplementary materials included in this article.
Supplementary Materials
Supplementary Information Table S1.
Supplementary Information Table S2.
Supplementary Information