

Abstract
Recent studies at the cellular and regional levels have pointed out the multifaceted importance of neural synchronization and temporal variance of neural activity. For example, neural synchronization and temporal variance has been shown by us to be altered in patients in the vegetative state (VS). This finding nonetheless leaves open the question of whether these abnormalities are specific to VS or rather more generally related to the absence of consciousness. The aim of our study was to investigate the changes of inter‐ and intra‐regional neural synchronization and temporal variance of resting state activity in anesthetic‐induced unconsciousness state. Applying an intra‐subject design, we compared resting state activity in functional magnetic resonance imaging (fMRI) between awake versus anesthetized states in the same subjects. Replicating previous studies, we observed reduced functional connectivity within the default mode network (DMN) and thalamocortical network in the anesthetized state. Importantly, intra‐regional synchronization as measured by regional homogeneity (ReHo) and temporal variance as measured by standard deviation (SD) of the BOLD signal were significantly reduced in especially the cortical midline regions, while increased in the lateral cortical areas in the anesthetized state. We further found significant frequency‐dependent effects of SD in the thalamus, which showed abnormally high SD in Slow‐5 (0.01–0.027 Hz) in the anesthetized state. Our results show for the first time of altered temporal variance of resting state activity in anesthesia. Combined with our findings in the vegetative state, these findings suggest a close relationship between temporal variance, neural synchronization and consciousness. Hum Brain Mapp 35:5368–5378, 2014. © 2014 Wiley Periodicals, Inc.
Keywords: anesthesia, fMRI, resting state, consciousness, functional connectivity, low‐frequency fluctuations, cortical midline regions
INTRODUCTION
Recent functional neuroimaging studies exhibit impaired functional connectivity within the default mode network (DMN) [Boveroux et al., 2010; Schrouff et al., 2011] and the thalamocortical network [Mashour, 2006; White and Alkire, 2003] in anesthesia. These findings point to impaired inter‐regional synchronization and consequently decreased communication between regions and networks in anesthesia, but a specific association with loss of consciousness as opposed to other factors of the anesthetized state remains unclear [Alkire et al., 2000; Boveroux et al., 2010].
The fluctuations of resting‐state BOLD signals are generally observed to be present below 0.1 Hz frequency band [Biswal et al., 1995; Fox and Raichle, 2007; Zhang and Raichle, 2010]. The temporal variance of BOLD fluctuations is usually calculated in this low‐frequency band, and higher temporal variance in resting‐state has been shown in the DMN as well as thalamocortical regions [Zang et al., 2007]. This suggests temporal variance to some extent reflects spontaneous neural activity, which is also in line with studies demonstrating the importance of variance at the cellular level [Churchland et al., 2010; Monier et al., 2003; White et al., 2012]. The scale of the signals (e.g., temporal variance) should be, theoretically, independent of the correlation coefficient (e.g., functional connectivity). However, recent studies observed a close relationship between temporal variance of brain activity and functional connectivity [Abou Elseoudetal., 2014; Di et al., 2013; Xuan et al., 2012]. These observations were potentially extended to the level of consciousness in a recent study of ours [Huang et al., 2013], which demonstrated decreased temporal variance of resting state activity and functional connectivity in the cortical midline regions in patients with vegetative state (VS). However, whether this effect is specific to the absence of consciousness or to other factors implicated in the VS (like the brain lesion) remains unclear. If the former, one would expect a similar effect in other states characterized by loss of consciousness such as anesthesia.
The general aim of our study was to investigate the changes of inter‐ and intra‐regional neural synchronization and temporal variance of resting state activity in anesthetic‐induced unconsciousness state. First we used functional connectivity (FC) analysis to examine the inter‐regional synchronization changes, and to define regions of interest (ROI) in the DMN. Then we used regional homogeneity (ReHo) which employs the Kendall's coefficient of concordance (KCC) to measure the local functional coherence, reflecting intra‐regional synchronization [Zang et al., 2004]. In a next step, we employed the measurement of standard deviation of activity across time (SD) [Garrett et al., 2010; 2011] to examine the temporal variance of the brain's spontaneous activity, which was also established in our previous study [Huang et al., 2013]. Furthermore, we studied BOLD frequency‐dependent effects [Buzsaki and Draguhn, 2004; Hoptman et al., 2010; Han et al., 2011; Wu et al., 2008; Wee et al., 2012; Yu et al., 2012; Zuo et al., 2010] of the temporal variance (SD) in two separate bands within the traditional frequency range (0.01–0.1 Hz): Slow‐5 (0.01‐0.027 Hz) and Slow‐4 (0.027‐0.073 Hz) [Buzsaki and Draguhn, 2004; Han et al., 2011; Hoptman et al., 2010; Zuo et al., 2010], as frequency‐dependent effects in different brain regions may reflect synaptic/functional/cytoarchitectonic complexity [Baria et al., 2011; He et al., 2010] which may be affected by the loss of consciousness as in anesthesia. In order to distinguish between drug‐related and consciousness‐related effects of anesthesia we included two different subgroups where anesthesia was induced by different drugs with different molecular targets, propofol and sevoflurane [Hemmings et al., 2005; Franks, 2008; Kaisti et al., 2003].
MATERIALS AND METHODS
Subjects
The study was approved by the Ethics Committee of Huashan Hospital, Fudan University. Written informed consent was obtained from all subjects. Twelve subjects undergoing elective transsphenoidal approach for resection of pituitary microadenoma were included in this study (5 women and 7 men; age range, 26–62 years; mean ± SD, 47 ± 13 years). The pituitary microadenomas were diagnosed by their size (less than 10 mm in diameter without sella expansion) based on radiological findings and plasma endocrinal indicators. These patients, who were ASA (American society of Anesthesiologists) physical Status I or II grade, had no previous craniotomy, cerebral neuropathy, vital organ dysfunction, or contraindication for a MRI examination.
Protocol
The subjects were divided randomly to receive intravenous propofol anesthesia (n = 6) and inspiratory sevoflurane anesthesia (n = 6). Propofol, one of the intravenous anesthetics, selectively modulates GABAA receptors by enhancing gating of the receptors by GABA [Hales and Lambert, 1991; Tomlin et al., 1998] reducing neuronal excitability [Franks, 2006]. Sevoflurane, one of the inhaled anesthetics, enhances GABAA receptor function [Krasowski and Harrison, 1999] that increases channel opening to enhance inhibition at both synaptic and extrasynaptic receptors [Hemmings et al., 2005]. In the group with intravenous propofol anesthesia (Group P), a target‐controlled infusion (TCI) was used to set plasma concentration of propofol at 3.0–5.0 μg/mL, followed by remifentanil 1.0 μg/kg and succinylcholine 1.5 mg/kg to facilitate endotracheal intubation. The TCI propofol was maintained at a stable effect‐site concentration 4.0 μg/mL to reliably induce an unconscious state [Xu et al., 2009]. In the group with inspiratory sevoflurane anesthesia (Group S), anesthesia induction was completed with 8% sevoflurane in 100% oxygen, adjusting fresh gas flow to 6 L/min, combined with remifentanil 1.0 μg/kg, succinylcholine 1.0 mg/kg and maintained with 2.6% (1.3 MAC) ETsevo in 100% oxygen, fresh gas flow at 2.0 L/min. The concentration of sevoflurane used in our study also fulfill the requirement to maintain loss of consciousness in patients classified as ASA physical Status I or II [Katoh and Ikeda, 1998]. Considering the quick elimination of the analgesic remifentanil and depolarized neuromuscular relaxant succinylcholine from plasma, the effects of drugs on the brain during anesthetized status can be attributed solely to intravenous anesthetic propofol or inhalational anesthetic sevoflurane in respective groups.
After induction of anesthesia the subjects were ventilated with intermittent positive pressure ventilation, set tidal volume 8–10 mL/kg, respiratory rate 10–12 beats per minute, to maintain PetCO2 (end tidal partial pressure of CO2) at 35–40 mm Hg. No body movement was observed in any subject during anesthesia, and no subject reported explicit memory in the post‐operative follow‐up, hence all the subjects are considered as unconscious during anesthesia.
Functional Data Acquisition
Functional magnetic resonance imaging (fMRI) acquisition consisted of two 8‐min resting state fMRI (r‐fMRI) volumes in awake and anesthetized state. Under the awake state r‐fMRI scan, the subject's head was fixed in the scan frame to limit its movement. The subjects were instructed to wear earplugs, take a comfortable supine position, relax, eyes closed during scanning, and not to concentrate on anything in particular. Eye‐tracking during fMRI was not available, but off‐line post‐scan recordings ensured that subjects could well comply with this instruction. The subjects were anesthetized after the awake state scan and given full hydration with hydroxyethyl starch to avoid hypotension. Fifteen minutes after stabilization of anesthetic levels and hemodynamics, the anesthetized state r‐fMRI scan was done.
A Siemens 3T scanner (Siemens MAGNETOM, Germany) with a standard head coil was used to acquire gradient‐echo EPI images of the whole brain (25 slices, repetition time/echo time TR/TE = 2000/30 ms, slice thickness = 6 mm, field of view (FOV) = 192 mm, flip angle = 90°, image matrix: 64 × 64). In addition, high‐resolution anatomical images were acquired for all the patients.
Data Analysis
Preprocessing steps were implemented in AFNI (Cox, 1996). After discarding the first two volumes the functional images from each scan were aligned (head motion correction), slice timing corrected, temporally standardized, resampled to 3 × 3 × 3 mm3, spatially smoothed (6‐mm full width at half maximum Gaussian blur), transformed into Talaraich space [Talairach and Tournoux, 1988], and linear trends were removed. The data was then filtered with a band‐pass filter preserving signals between 0.01–0.10 Hz, which is thought to reflect mainly neuronal fluctuations [Fox and Raichle, 2007; Zhang and Raichle, 2010], and the estimated six parameters of head motion and mean time series from the white matter (WM) and cerebrospinal fluid (CSF) were regressed out. To minimize partial voluming with gray matter, the WM and CSF masks were eroded by one voxel [Chai et al., 2012]. The issue of motion artifacts was addressed rigorously as minor group differences in motion have been shown to artificially create between‐groups differences [Power et al., 2012; Van Dijk et al., 2012]. We first calculated the index of the amount of motion (shift and rotation) for each subject. No group difference (awake vs. anesthesia) was observed for either shift or rotation by paired sample t‐tests (p = 0.78 for shift; p = 0.51 for rotation, see Supporting Information Fig. S1). Further, the number of “outliers” for the data at each time point was calculated to tag the outliers of global signal intensity and motion. Head motion greater than 0.3 mm per TR and TR's with outliers comprising more than 10% were censored for the following analysis.
Whole Brain Functional Connectivity (FC) Analysis—Inter‐Regional Synchronization
To identify the default mode network, functional connectivity (FC) with a seed region in the posterior cingulate cortex (PCC) was used. The seed region was 12 mm diameter (spherical) centered on a previously published focus (Talairach coordinates: [−2, −51, 27], Greicius et al., 2003). To study the thalamocortical connectivity, bilateral thalamus was anatomically defined from TT_N27 template in AFNI [Eickhoff et al., 2005]. The Talairach coordinates of the centers at the left and right thalamus are [−12, −19, 8] and [12, −19, 8], respectively. As the BOLD signal of the bilateral thalamus was homogenous (Supporting Information Fig. S2), the two regions were collapsed to yield a single mask. To minimize potential partial voluming with other brain regions, the mask was eroded by one voxel yielding a seed region with 338 voxels. For both awake and anesthetized states in each subject, voxel‐wise FC maps to a given seed were computed as maps of temporal correlation coefficients between blood oxygenation level‐dependent (BOLD) time course in each voxel and BOLD time course averaged across voxels in the seed region. The FC maps from individual subjects were then transformed by Fisher's Z transform for group‐level t‐tests.
Whole Brain Regional Homogeneity (ReHo) Analysis—Intra‐Regional Synchronization
ReHo is supposed to measure intra‐regional synchronization—that is, coordination of activity between voxels within a region [Zang et al., 2004]. ReHo analysis was performed for each subject by AFNI program 3dReHo. As spatial smoothing could artificially enhances ReHo intensity and reduce its reliability [Zuo et al., 2013], we calculated ReHo based on unsmoothed BOLD time series. Specifically, for each voxel in the whole brain Kendall's coefficient of concordance (KCC) was calculated between the BOLD time series for the voxel and those of its 26 nearest neighbor voxels [Zang et al., 2004, 2013], giving a voxel‐wise ReHo map. Spatial smoothing was then performed with a 6‐mm full‐width at half‐maximum (FWHM) Gaussian kernel. All individual ReHo map were computed and standardized into ReHo Z‐values by subtracting the mean voxel‐wise ReHo obtained for the entire brain (i.e., global ReHo), and then dividing by the standard deviation [Zuo et al., 2013]. This subject‐wise ReHo normalization has been demonstrated to be able to improve both normality and reliability across subjects [Zuo et al., 2010, 2013].
Whole Brain Standard Deviation (SD) of BOLD Signal Analysis—Temporal Variance
The standard deviation (SD) of BOLD signal [Garrett et al., 2010, 2011] describes the temporal variance of brain activity across time within a particular region. The standard deviation (SD) of the BOLD signal change across the time series for each voxel was also calculated to yield an SD map for each subject. Subject‐level voxel‐wise SD maps were standardized into subject‐level Z‐score maps, i.e. by subtracting the mean voxel‐wise SD obtained for the entire brain, and then dividing by the standard deviation [Zuo et al., 2010].
Group Analysis of the Whole Brain
The FC maps with PCC as seed region were used to identify the DMN for awake and anesthetized states respectively. Specifically, one‐sample t‐tests against zero were conducted for the awake state (n = 12), both propofol and sevoflurane‐induced anesthetized states (pooling Groups P and S together, n = 12) with anesthesia type (propofol or sevoflurane) as a covariate, propofol‐induced anesthesia only (Group P, n = 6), and sevoflurane‐induced anesthesia only (Group S, n = 6). Different thresholds (top 10%, top 5%, and top 2% of voxels for the whole brain) were used to generate difference views of DMN connectivity.
To test the group difference between propofol and sevoflurane‐induced anesthetized states in FC, ReHo, and SD, two‐sample t‐tests with age as a covariate were conducted for each measurement. Group P and Group S were then pooled together in order to enhance the subject sample size for the comparison with the awake state. FC, ReHo, and SD maps were tested in paired t‐tests, with anesthesia type as a covariate, to examine the differences between the awake state (n = 12) and anesthetized state (n = 12). Unless otherwise stated, all resulting t‐maps were thresholded at a corrected P value < 0.05. Specifically, the multiple‐comparison error was corrected using Monte Carlo simulation as implemented in AFNI program AlphaSim, yielding a family‐wise error rate (FWER) at P < 0.05 with a minimal cluster size of 97 voxels. The smoothness used in the AlphaSim was the average smoothness across subjects.
Region of Interest (ROI) Analysis
All regions within the DMN were defined as ROI's from the one‐sample t‐test results of the FC maps with PCC seed in the awake state thresholded at top 5% of voxels in the whole brain, combined with a cluster size of 58 voxels at threshold P < 0.01, corrected. For additional analysis, FC with the thalamus seed was also computed based on the extensive literature on the role of the thalamus in the neurophysiology of consciousness [Bonhomme et al., 2001; Boveroux et al., 2010; Mhuircheartaigh et al., 2010]. The values of FC, ReHo and SD were extracted from each ROI and then entered into paired t‐tests. Furthermore, we studied frequency‐dependent effects [Buzsaki and Draguhn, 2004; Han et al., 2011; Hoptman et al., 2010; Wee et al., 2012; Wu et al., 2008; Yu et al., 2012; Zuo et al., 2010] of the SD in two separate bands within the traditional frequency range (0.01–0.1 Hz): Slow‐5 (0.01–0.027 Hz) and Slow‐4 (0.027‐0.073 Hz) [Buzsaki and Draguhn, 2004; Han et al., 2011; Hoptman et al., 2010; Zuo et al., 2010], as the frequency‐dependent effects in different brain regions may reflect synaptic/functional/cytoarchitectonic complexity [Baria et al., 2011; He et al., 2010]. A two‐way repeated‐measures analysis of variance (ANOVA) was performed to examine the potential interaction effect between states (awake and anesthetized states) and frequency bands (Slow‐5 and Slow‐4) for each ROI. For ROIs showing significant interaction, post‐hoc paired t‐tests were further performed. All ROI results were corrected for multiple comparisons to a significant level of P < 0.05 (Bonferroni correction across 6 ROIs).
RESULTS
Default Mode Network (Frequency Band 0.01–0.1 Hz) in the Awake and Anesthetized State
Based on FC with the PCC seed region, a robust DMN pattern including the medial prefrontal cortex (MPFC), perigenual anterior cingulate cortex (PACC), posterior cingulate cortex (PCC), precuneus (PreCu), inferior temporal cortex (ITC), and inferior parietal cortex (IPC), was observed for both awake (Fig. 1 left) and anesthetized states (Fig. 1 middle and right; Group P + S, Group P (= Propofol) only and Group S (= Sevoflurane) only) in two relatively strict thresholds (top 10% and top 5% of voxels across the whole brain at P < 0.01 corrected at the cluster level). The regions in the DMN we observed were highly consistent with previous studies [Fox et al., 2005; Fox and Raichle, 2007; Greicius et al., 2003; Mason et al., 2007]. Five clusters in the awake state (top 5%) including the left ITC, left IPC, right IPC, PCC/precuneus, and MPFC/PACC were selected as ROI's in the following ROI analysis.
Figure 1.
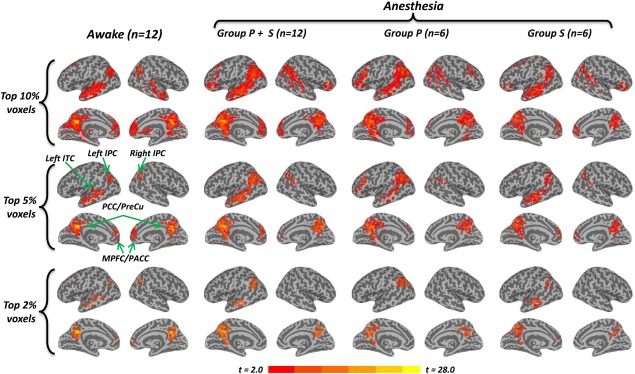
Default Mode Network in the awake and anesthetized state. The inflated cortical surfaces show the group results (one‐sample t‐test against zero) of functional connectivity (FC) with a seed region in the PCC (Talairach coordinates: [–2 −51 27], Greicius et al., 2003), in the awake state (n = 12), both propofol and sevoflurane‐induced anesthetized state (Group P + S, n = 12), propofol‐induced anesthesia only (Group P, n = 6), and sevoflurane‐induced anesthesia only (Group S, n = 6), respectively. Different thresholds, top 10%, top 5%, and top 2% voxels of the whole brain, were chosen to give different views of the DMN connectivity pattern. A robust DMN pattern, including the MPFC, PACC, PCC, ITC, and IPC, was observed for both the awake (left part) and anesthetized (middle and right parts) state in top 10% and top 5%. Five clusters in the awake state (top 5%) including the left ITC, left IPC, right IPC, PCC/precuneus, and MPFC/PACC were selected as ROIs. The frontoparietal connectivity disappeared in the anesthetized state of Group P + S and Group P at top 2%, while this connectivity remains in the awake state and Group S. The color bar shows voxel‐wise t‐value. [Color figure can be viewed in the online issue, which is available at http://wileyonlinelibrary.com.]
Interestingly, connectivity between PCC seed and voxels in the frontoparietal network disappeared in the anesthetized state of Group P + S and Group P when setting the threshold at top 2% of voxels (P < 0.005 corrected at the cluster level), while still existing in the awake state and Group S (Fig. 1). This was further confirmed by the group comparison of FC between the awake (n = 12) and anesthetized state (n = 12) (Fig. 2A), showing deceased FC between PCC seed and other midline regions (e.g., MPFC and PACC).
Figure 2.
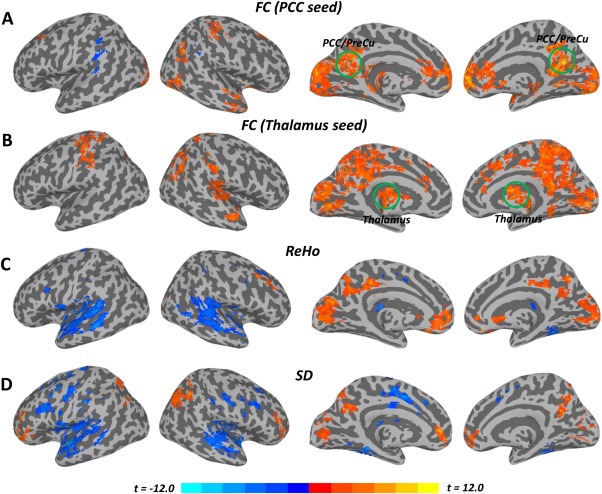
Inter‐ and Intra‐ regional synchronization and temporal variance (Awake vs. Anesthetized). A: Group comparison of the functional connectivity (FC) with a seed region in the PCC showed reduced FC between the PCC and other brain regions (e.g., MPFC, PACC, visual cortex, thalamus, etc.). B: Group comparison of the FC with a seed region in the thalamus showed widespread decreased thalamocortical connectivity during the anesthetized state. C: Group comparison of regional homogeneity (ReHo) showed reduced ReHo in cortical midline regions while ReHo was increased in widespread lateral regions during the anesthetized state. D: Group comparison of temporal variance (SD) also showed significant decrease in cortical midline regions while SD was increased in lateral regions during the anesthetized state. All t‐maps were thresholded at corrected P < 0.05. The color bar shows voxel‐wise t‐value. [Color figure can be viewed in the online issue, which is available at http://wileyonlinelibrary.com.]
Propofol Group (Group P) vs. Sevoflurane Group (Group S) During the Anesthetized State
No group difference was observed between propofol and sevoflurane‐induced anesthetized state for inter‐regional (FC) and intra‐regional (ReHo) resting state measures during the anesthetized state. Differences in SD was only detected in two clusters (less than 2.2 cm3 each) along the left precentral gyrus (BA4) (Talairach coordinates of the peak values: [–31 −22 62] and [–40 −13 38]) for Group P versus Group S. In the next step, the Group P and Group S were pooled into one group to enlarge the sample size and examine the differences between awake (n = 12) and anesthetized states (n=12) in the following results. The results may suggest that the differences between anesthetized and awake states as reported in the following are due to differences in the level of consciousness rather than other drug‐specific factors (Kaisti et al., 2003). Alternatively, the results could also indicate there is not enough power to detect the difference between anesthetic agents due to relatively small simple size.
Awake vs. Anesthesia: Functional Connectivity (FC) – Inter‐Regional Synchronization
Significantly reduced FC between the PCC and other regions (MPFC, PACC, visual cortex, thalamus, etc.) was observed during the anesthetized state (Fig. 2A and Supporting Information Table S1), in line with previous studies [Boveroux et al., 2010; Schrouff et al., 2011].
For the group comparison of FC with the thalamus seed, a widespread decrease in thalamocortical connectivity was observed during the anesthetized state (Fig. 2B and Supporting Information Table S1), encompassing the MPFC, PCC, precuneus, cuneus, dorsal anterior cingulate cortex (dACC), primary/supplemental motor cortex, auditory cortex, and temporoparietal junction areas, which confirmed previous findings [Bonhomme et al., 2012; Martuzzi et al., 2010; Mhuircheartaigh et al., 2010; White and Alkire, 2003]. The ROI results also showed significant reduction of functional connectivity between MPFC/PACC and PCC/PreCu (P < 0.001, corrected), between MPFC/PACC and thalamus (P = 0.049, corrected), and between PCC/PreCu and thalamus (P = 0.008, corrected) during the anesthetized state (Fig. 3A).
Figure 3.
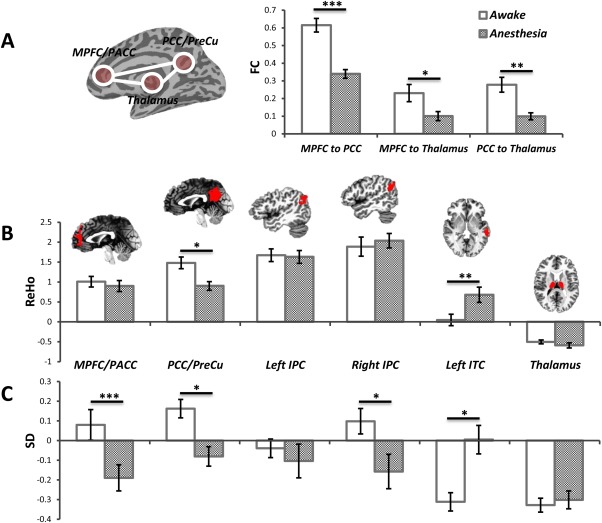
The ROI results of FC, ReHo, and SD in 0.01–0.1 Hz (Awake vs. Anesthetized). A: Group comparison of FC between MPFC/PACC and PCC/PreCu, between MPFC/PACC and thalamus, and between PCC/PreCu and thalamus. B: Group comparison of ReHo in 6 ROIs showed significantly decreased ReHo in the PCC/PreCu but increased ReHo in the left ITC during the anesthetized state. C: Group comparison of SD in 6 ROIs showed significantly reduced SD in the MPFC/PACC, PCC/PreCu and right IPC during the anesthetized state. In contrast, significantly increased SD was observed in the left ITC during the anesthetized state. *P < 0.05, **P < 0.01, ***P < 0.005, all corrected. [Color figure can be viewed in the online issue, which is available at http://wileyonlinelibrary.com.]
Awake vs. Anesthesia: Regional Homogeneity (ReHo)—Intra‐Regional Synchronization
Significantly reduced intra‐regional synchronization (ReHo) in the anesthetized state was observed in especially cortical midline regions while increase in the lateral brain areas (Fig. 2C and Supporting Information Table S1). The ROI analysis further confirmed the above results by showing decreased ReHo in the PCC/PreCu (P = 0.014, corrected), but increased ReHo in the left ITC (P = 0.008, corrected) during the anesthetized state (Fig. 3B).
Awake vs. Anesthesia: Standard Deviation (SD)—Temporal Variance
Significantly reduced SD in the anesthetized state was observed in the MPFC, PACC, PCC, visual cortex, and IPC, while widespread increased SD was observed in the lateral part of the brain, including dorsal lateral prefrontal cortex, temporal cortex, and other regions (Fig. 2D and Supporting Information Table S1). For the ROI analysis, a significantly reduced SD was found in the MPFC/PACC (P = 0.005, corrected), PCC/PreCu (P = 0.029, corrected), and right IPC (P = 0.048, corrected) during the anesthetized state (Fig. 3C). In contrast, significantly increased SD was observed in the left ITC (P = 0.018, corrected) during the anesthetized state (Fig. 3C). Furthermore, we observed a significant interaction effect between states (awake and anesthetized states) and frequency bands (Slow‐5 and Slow‐4) only in the thalamus (F = 14.5, P = 0.017, corrected by Bonferroni correction across 6 ROIs). Further post‐hoc t‐tests revealed significantly increase in SD only in Slow‐5 (P = 0.009) during the anesthetized state (Fig. 4).
Figure 4.
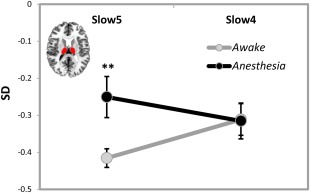
Interaction effect between states (awake and anesthetized states) and frequency bands (Slow‐5: 0.01–0.027 Hz and Slow‐4: 0.027–0.073 Hz) for temporal variance (SD). Significant interaction effect was observed in the thalamus where post‐hoc t‐tests revealed significant increase in SD only in Slow‐5 (but not Slow‐4) during the anesthetized state compared to the awake state. **P < 0.01, corrected. [Color figure can be viewed in the online issue, which is available at http://wileyonlinelibrary.com.]
DISCUSSION
We report reduced functional connectivity (FC) (inter‐regional synchronization) between regions of the DMN in both propofol and sevoflurane‐induced anesthesia, extending the results of a previous macaque study [Vincent et al., 2007] to humans [Greicius et al., 2008, 2009; Martuzzi et al., 2010]. Reduced functional connectivity was also observed between thalamus and cortical midline regions during anesthesia, in line with previous work [Bonhomme et al., 2012; Martuzzi et al., 2010; Mhuircheartaigh et al., 2010]. We extend these FC results by showing decreased regional homogeneity (ReHo) (intra‐regional synchronization) and temporal variance (SD) of spontaneous activity in especially cortical midline regions while both ReHo and SD increased in lateral regions during the anesthetized state. Finally, we observed significant frequency‐dependent effects in the thalamus, where SD increased in Slow‐5 (0.01–0.027 Hz) during the anesthetized state. Taken together, these novel findings extend our current knowledge about the neural correlates of anesthetic‐induced unconsciousness and our understanding of the relationship between the temporal variance of resting state brain activity, neural synchronization, and consciousness.
Decreased Inter‐Regional Synchronization (FC) Within the DMN and Thalamocortical Network
We found decreased FC within the DMN (Fig. 2A), especially between the MPFC/PACC and PCC/PreCu during the anesthetized state. These results are consistent with previous findings on sedation/anesthesia [Boveroux et al., 2010; Schrouff et al., 2011]. We also observed a remarkable decrease FC within the thalamocortical network in anesthetized state, e.g. between the thalamus and cortical regions including the MPFC, PCC/PreCu, dACC, SMA, auditory cortex, and temporoparietal junction areas (Fig. 2B). The results were consistent with a PET study of both halothane‐ and isoflurane‐induced anesthesia [White and Alkire, 2003] as well as other fMRI studies [Bonhomme et al., 2012; Martuzzi et al., 2010; Mhuircheartaigh et al., 2010]. Our results thus further emphasize the central role of the thalamus in consciousness [Tononi, 2008].
Altered Intra‐regional Synchronization (ReHo) and Temporal Variance (SD)
We extend these FC results by showing decreased intra‐regional synchronization (ReHo) and temporal variance (SD) of spontaneous activity in cortical midline regions (including MPFC/PACC and PCC/PreCu) while increased in widespread lateral regions (including dorsal lateral prefrontal and temporal cortex) during anesthetized state. Our findings indicate a disrupted neural synchronization and temporal variance pattern across brain regions during anesthesia, which is also consistent with studies on light sleep showing increased SD in the sensory areas [Fukunaga, 2006; Horovitz, 2008]. Taken together, the results strongly suggest abnormal balance between medial and lateral cortical networks in anesthesia: the balance seems to shift from the midline regions (decreased in ReHo and SD) toward the lateral networks (increased in ReHo and SD). A recent study by Vanhaudenhuyse et al. [2010] showed that the balance between midline and lateral regions/networks is relevant to the contents of consciousness. Our results in anesthesia (this study) and vegetative state [Huang et al., 2013] suggest that the midline‐lateral balance may also be central for the level or state of consciousness as an independent dimension.
Our observation of decreased temporal variance in the midline regions is in line with several recent findings indicating a central role for temporal variance in shaping neural activity [Abbott et al., 2009; Churchland et al., 2010; He, 2013; Monier et al., 2003]. Most importantly, our findings in anesthesia suggest a role for temporal variance in consciousness. We scanned the same subjects twice, once awake and once anesthetized state, with clear differences between states emerging in resting state temporal variance. The reduction in temporal variance is unlikely to be drug‐specific since it was consistent across two drugs with different molecular targets [Franks, 2008; Hemmings et al., 2005; Kaisti et al., 2003]. Further, the assumption of consciousness‐related reduction in DMN temporal variance is consistent with our previous findings in the midline regions of VS patients [Huang et al., 2013]. Mechanisms underlying the importance of midline temporal variance for the support of consciousness remain for future investigation.
Besides the midline regions, we observed significant frequency‐dependent effects in the thalamus, where SD increased in Slow‐5 (0.01–0.027 Hz) during the anesthetized state. The variance of activation changes in thalamus may be related to the hyperpolarization of thalamic neurons during anesthesia [Meuth et al., 2003; Ries and Puil, 1999] by potentiating GABA‐A receptors [Belelli et al., 2005; Jia et al., 2005], as well as glutamatergic and cholinergic neurotransmission inhibition [Alkire et al., 2000].
CONCLUSIONS
Our results shed light on the relationship between the temporal variance of spontaneous brain activity, neural synchronization, and consciousness by studying the anesthetized state. Aside from alterations in neural synchronization measures of resting state activity including functional connectivity (inter‐regional) and regional homogeneity (intra‐regional), our data reveals significant abnormality in the temporal variance of resting state activity in subcortical, cortical midline regions, and lateral brain areas in anesthesia. This extends the recently demonstrated relevance of temporal variance for neural activity to the realm of consciousness. However, the exact mechanisms by which temporal variance of neural activity mediates consciousness remain unclear [see Northoff 2013a,b].
Supporting information
Supplementary Information
REFERENCES
- Abbott LF, Rajan K, Sompolinsky H (2009): Interactions between intrinsic and stimulus‐evoked activity in recurrent neural networks. ArXiv E‐Prints 0912:3832. [Google Scholar]
- Abou Elseoud A, Nissilä J, Liettu A, Remes J, Jokelainen J, Takala T, Aunio A, Starck T, Nikkinen J, Koponen H, Zang YF, Tervonen O, Timonen M, Kiviniemi V (2014): Altered resting‐state activity in seasonal affective disorder. Hum Brain Mapp 35:161–172. [DOI] [PMC free article] [PubMed] [Google Scholar]
- Alkire MT, Haier RJ, Fallon JH (2000): Toward a unified theory of narcosis: Brain imaging evidence for a thalamocortical switch as the neurophysiologic basis of anesthetic‐induced unconsciousness. Conscious Cogn 9:370–386. [DOI] [PubMed] [Google Scholar]
- Baria AT, Baliki MN, Parrish T, Apkarian AV (2011): Anatomical and functional assemblies of brain BOLD oscillations. J Neurosci 31:7910–7919. [DOI] [PMC free article] [PubMed] [Google Scholar]
- Belelli D, Peden DR, Rosahl TW, Wafford KA, Lambert JJ (2005): Extrasynaptic GABAA receptors of thalamocortical neurons: A molecular target for hypnotics. J Neurosci 25:11513–11520. [DOI] [PMC free article] [PubMed] [Google Scholar]
- Biswal B, Yetkin FZ, Haughton VM, Hyde JS (1995): Functional connectivity in the motor cortex of resting human brain using echo‐planar MRI. Magn Reson Med 34:537–541. [DOI] [PubMed] [Google Scholar]
- Bonhomme V, Fiset P, Meuret P, Backman S, Plourde G, Paus T, Bushnell MC, Evans AC (2001): Propofol anesthesia and cerebral blood flow changes elicited by vibrotactile stimulation: A positron emission tomography study. J Neurophysiol 85:1299–1308. [DOI] [PubMed] [Google Scholar]
- Bonhomme VLG, Boveroux P, Brichant JF, Laureys S, Boly M (2012): Neural correlates of consciousness during general anesthesia using functional magnetic resonance imaging (fMRI). Arch Ital Biol 150:155–163. [DOI] [PubMed] [Google Scholar]
- Boveroux P, Vanhaudenhuyse A, Bruno M‐A, Noirhomme Q, Lauwick S, Luxen A, Degueldre C, Plenevaux A, Schnakers C, Phillips C, Brichant J‐F, Bonhomme V, Maquet P, Greicius MD, Laureys S, Boly M (2010): Breakdown of within‐ and between‐network resting state functional magnetic resonance imaging connectivity during propofol‐induced loss of consciousness. Anesthesiology 113:1038–1053. [DOI] [PubMed] [Google Scholar]
- Buzsáki G, Draguhn A (2004): Neuronal oscillations in cortical networks. Science 304:1926–1929. [DOI] [PubMed] [Google Scholar]
- Chai XJ, Castañón AN, Ongür D, Whitfield‐Gabrieli S (2012): Anticorrelations in resting state networks without global signal regression. Neuroimage 59:1420–1428. [DOI] [PMC free article] [PubMed] [Google Scholar]
- MM Churchland, BM Yu, JP Cunningham, LP Sugrue, MR Cohen, GS Corrado, WT Newsome, AM Clark, P Hosseini, BB Scott, DC Bradley, MA Smith, A Kohn, JA Movshon, KM Armstrong, T Moore, SW Chang, LH Snyder, SG Lisberger, NJ Priebe, IM Finn, D Ferster, SI Ryu, G Santhanam, M Sahani, KV Shenoy (2010): Stimulus onset quenches neural variability: A widespread cortical phenomenon. Nat Neurosci 13:369–378. [DOI] [PMC free article] [PubMed] [Google Scholar]
- Cox RW (1996): AFNI: Software for analysis and visualization of functional magnetic resonance neuroimages. Comput Biomed Res Int J 29:162–173. [DOI] [PubMed] [Google Scholar]
- Eickhoff SB, Stephan KE, Mohlberg H, Grefkes C, Fink GR, Amunts K, Zilles K (2005): A new SPM toolbox for combining probabilistic cytoarchitectonic maps and functional imaging data. Neuroimage 25:1325–1335. [DOI] [PubMed] [Google Scholar]
- Di X, Kim EH, Huang CC, Tsai SJ, Lin CP, Biswal BB (2013): The influence of the amplitude of low‐frequency fluctuations on resting‐state functional connectivity. Front Hum Neurosci 7:118. [DOI] [PMC free article] [PubMed] [Google Scholar]
- Fox MD, Raichle ME (2007): Spontaneous fluctuations in brain activity observed with functional magnetic resonance imaging. Nat Rev Neurosci 8:700–711. [DOI] [PubMed] [Google Scholar]
- Fox MD, Snyder AZ, Vincent JL, Corbetta M, Essen DCV, Raichle ME (2005): The human brain is intrinsically organized into dynamic, anticorrelated functional networks. Proc Natl Acad Sci USA 102:9673–9678. [DOI] [PMC free article] [PubMed] [Google Scholar]
- Franks NP (2006): Molecular targets underlying general anaesthesia. Br J Pharmacol 1:S72–S81. [DOI] [PMC free article] [PubMed] [Google Scholar]
- Franks NP (2008): General anaesthesia: From molecular targets to neuronal pathways of sleep and arousal. Nat Rev Neurosci 9:370–386. [DOI] [PubMed] [Google Scholar]
- Fukunaga M, Horovitz SG, van Gelderen P, de Zwart JA, Jansma JM, Ikonomidou VN, Chu R, Deckers RH, Leopold DA, Duyn JH (2006): Large‐amplitude, spatially correlated fluctuations in BOLD fMRI signals during extended rest and early sleep stages. Magn Reson Imaging 24:979–992. [DOI] [PubMed] [Google Scholar]
- Garrett DD, Kovacevic N, McIntosh AR, Grady CL (2010): Blood oxygen level‐dependent signal variability is more than just noise. J Neurosci 30:4914–4921. [DOI] [PMC free article] [PubMed] [Google Scholar]
- Garrett DD, Kovacevic N, McIntosh AR, Grady CL (2011): The importance of being variable. J Neurosci 31:4496–4503. [DOI] [PMC free article] [PubMed] [Google Scholar]
- Greicius MD, Kiviniemi V, Tervonen O, Vainionpää V, Alahuhta S, Reiss AL, Menon V (2008): Persistent default‐mode network connectivity during light sedation. Hum Brain Mapp 29:839–847. [DOI] [PMC free article] [PubMed] [Google Scholar]
- Greicius MD, Krasnow B, Reiss AL, Menon V (2003): Functional connectivity in the resting brain: A network analysis of the default mode hypothesis. Proc Natl Acad Sci USA 100:253–258. [DOI] [PMC free article] [PubMed] [Google Scholar]
- Greicius MD, Supekar K, Menon V, Dougherty RF (2009): Resting‐state functional connectivity reflects structural connectivity in the default mode network. Cereb Cortex 19:72–78. [DOI] [PMC free article] [PubMed] [Google Scholar]
- Hales TG, Lambert JJ (1991): The actions of propofol on inhibitory amino acid receptors of bovine adrenomedullary chromaffin cells and rodent central neurones. Br J Pharmacol 104:619–628. [DOI] [PMC free article] [PubMed] [Google Scholar]
- Han Y, Wang J, Zhao Z, Min B, Lu J, Li K, He Y, Jia J (2011): Frequency‐dependent changes in the amplitude of low‐frequency fluctuations in amnestic mild cognitive impairment: A resting‐state fMRI study. Neuroimage 55:287–295. [DOI] [PubMed] [Google Scholar]
- He BJ, Zempel JM, Snyder AZ, Raichle ME (2010): The temporal structures and functional significance of scale‐free brain activity. Neuron 66:353–369. [DOI] [PMC free article] [PubMed] [Google Scholar]
- He BJ (2013): Spontaneous and task‐evoked brain activity negatively interact. J Neurosci 33:4672–4682. [DOI] [PMC free article] [PubMed] [Google Scholar]
- Hemmings HC Jr, Akabas MH, Goldstein PA, Trudell JR, Orser BA, Harrison NL (2005): Emerging molecular mechanisms of general anesthetic action. Trends Pharmacol Sci 26:503–510. [DOI] [PubMed] [Google Scholar]
- Hoptman MJ, Zuo X‐N, Butler PD, Javitt DC, D'Angelo D, Mauro CJ, Milham MP (2010): Amplitude of low‐frequency oscillations in schizophrenia: A resting state fMRI study. Schizophr Res 117:13–20. [DOI] [PMC free article] [PubMed] [Google Scholar]
- Horovitz SG, Fukunaga M, de Zwart JA, van Gelderen P, Fulton SC, Balkin TJ, Duyn JH (2008): Low frequency BOLD fluctuations during resting wakefulness and light sleep: A simultaneous EEG‐fMRI study. Hum Brain Mapp 29:671–682. [DOI] [PMC free article] [PubMed] [Google Scholar]
- Huang Z, Dai R, Wu X, Yang Z, Liu D, Hu J, Gao L, Tang W, Mao Y, Jin Y, Wu X, Liu B, Zhang Y, Lu L, Laureys S, Weng X, Northoff G (2013): The self and its resting state in consciousness: An investigation of the vegetative state. Hum Brain Mapp doi: 10.1002/hbm.22308. [DOI] [PMC free article] [PubMed] [Google Scholar]
- Jia F, Pignataro L, Schofield CM, Yue M, Harrison NL, Goldstein PA (2005): An extrasynaptic GABAA receptor mediates tonic inhibition in thalamic VB neurons. J Neurophysiol 94:4491–4501. [DOI] [PubMed] [Google Scholar]
- Kaisti KK, Långsjö JW, Aalto S, Oikonen V, Sipilä H, Teräs M, Hinkka S, Metsähonkala L, Scheinin H (2003): Effects of sevoflurane, propofol, and adjunct nitrous oxide on regional cerebral blood flow, oxygen consumption, and blood volume in humans. Anesthesiology 99:603–613. [DOI] [PubMed] [Google Scholar]
- Katoh T, Ikeda K (1998): The effects of fentanyl on sevoflurane requirements for loss of consciousness and skin incision. Anesthesiology 88:18–24. [DOI] [PubMed] [Google Scholar]
- Krasowski MD, Harrison NL (1999): General anaesthetic actions on ligand‐gated ion channels. Cell Mol Life Sci 55:1278–1303. [DOI] [PMC free article] [PubMed] [Google Scholar]
- Martuzzi R, Ramani R, Qiu M, Rajeevan N, Constable RT (2010): Functional connectivity and alterations in baseline brain state in humans. Neuroimage 49:823–834. [DOI] [PMC free article] [PubMed] [Google Scholar]
- Mashour GA (2006): Integrating the science of consciousness and anesthesia. Anesth Analg 103:975–982. [DOI] [PubMed] [Google Scholar]
- Mason MF, Norton MI, Horn JDV, Wegner DM, Grafton ST, Macrae CN (2007): Wandering minds: The default network and stimulus‐independent thought. Science 315:393–395. [DOI] [PMC free article] [PubMed] [Google Scholar]
- Meuth SG, Budde T, Kanyshkova T, Broicher T, Munsch T, Pape H‐C(2003): Contribution of TWIK‐related acid‐sensitive K+ channel 1 (TASK1) and TASK3 channels to the control of activity modes in thalamocortical neurons. J Neurosci 23:6460–6469. [DOI] [PMC free article] [PubMed] [Google Scholar]
- Mhuircheartaigh RN, Rosenorn‐Lanng D, Wise R, Jbabdi S, Rogers R, Tracey I (2010): Cortical and subcortical connectivity changes during decreasing levels of consciousness in humans: A functional magnetic resonance imaging study using propofol. J Neurosci 30:9095–9102. [DOI] [PMC free article] [PubMed] [Google Scholar]
- Monier C, Chavane F, Baudot P, Graham LJ, Frégnac Y (2003): Orientation and direction selectivity of synaptic inputs in visual cortical neurons: A diversity of combinations produces spike tuning. Neuron 37:663–680. [DOI] [PubMed] [Google Scholar]
- Northoff G. 2013a. Unlocking the Brain, Vol. I: Coding. New York: Oxford University Press.
- Northoff G. 2013b. Unlocking the Brain, Vol. II: Consciousness. New York: Oxford University Press.
- Power JD, Barnes KA, Snyder AZ, Schlaggar BL, Petersen SE (2012): Spurious but systematic correlations in functional connectivity MRI networks arise from subject motion. Neuroimage 59:2142–2154. [DOI] [PMC free article] [PubMed] [Google Scholar]
- Ries CR, Puil E (1999): Mechanism of anesthesia revealed by shunting actions of isoflurane on thalamocortical neurons. J Neurophysiol 81:1795–1801. [DOI] [PubMed] [Google Scholar]
- Schrouff J, Perlbarg V, Boly M, Marrelec G, Boveroux P, Vanhaudenhuyse A, Bruno M‐A, Laureys S, Phillips C, Pélégrini‐Issac M, Maquet P, Benali H (2011): Brain functional integration decreases during propofol‐induced loss of consciousness. Neuroimage 57:198–205. [DOI] [PubMed] [Google Scholar]
- Talairach J, Tournoux P (1988): Co‐planar stereotaxic atlas of the human brain. 3‐Dimensional proportional system: An approach to cerebral imaging. Available at: http://www.citeulike.org/group/96/article/745727.
- Tomlin SL, Jenkins A, Lieb WR, Franks NP (1998): Stereoselective effects of etomidate optical isomers on gamma‐aminobutyric acid type A receptors and animals. Anesthesiology 88:708–717. [DOI] [PubMed] [Google Scholar]
- Tononi G (2008): Consciousness as integrated information: A provisional manifesto. Biol Bull 215:216–242. [DOI] [PubMed] [Google Scholar]
- Van Dijk KRA, Sabuncu MR, Buckner RL (2012): The influence of head motion on intrinsic functional connectivity MRI. Neuroimage 59:431–438. [DOI] [PMC free article] [PubMed] [Google Scholar]
- Vanhaudenhuyse A, Noirhomme Q, Tshibanda LJ‐F, Bruno M‐A, Boveroux P, Schnakers C, Soddu A, Perlbarg V, Ledoux D, Brichant J‐F, Moonen G, Maquet P, Greicius MD, Laureys S, Boly M (2010): Default network connectivity reflects the level of consciousness in non‐communicative brain‐damaged patients. Brain 133:161–171. [DOI] [PMC free article] [PubMed] [Google Scholar]
- Vincent JL, Patel GH, Fox MD, Snyder AZ, Baker JT, Van Essen DC, Zempel JM, Snyder LH, Corbetta M, Raichle ME (2007): Intrinsic functional architecture in the anaesthetized monkey brain. Nature 447:83–86. [DOI] [PubMed] [Google Scholar]
- Wee C‐Y, Yap P‐T, Denny K, Browndyke JN, Potter GG, Welsh‐Bohmer KA, Wang L, Shen D (2012): Resting‐state multi‐spectrum functional connectivity networks for identification of MCI patients. PloS One 7:e37828. [DOI] [PMC free article] [PubMed] [Google Scholar]
- White B, Abbott LF, Fiser J (2012): Suppression of cortical neural variability is stimulus‐ and state‐dependent. J Neurophysiol 108:2383–2392. [DOI] [PMC free article] [PubMed] [Google Scholar]
- White NS, Alkire MT (2003): Impaired thalamocortical connectivity in humans during general‐anesthetic‐induced unconsciousness. Neuroimage 19:402–411. [DOI] [PubMed] [Google Scholar]
- Wu CW, Gu H, Lu H, Stein EA, Chen J‐H, Yang Y (2008): Frequency specificity of functional connectivity in brain networks. Neuroimage 42:1047–1055. [DOI] [PMC free article] [PubMed] [Google Scholar]
- Xu Z, Liu F, Yue Y, Ye T, Zhang B, Zuo M, Xu M, Hao R, Xu Y, Yang N, Che X (2009): C50 for Propofol‐remifentanil target‐controlled infusion and bispectral index at loss of consciousness and response to painful stimulus in Chinese patients: A multicenter clinical trial. Anesth Analg 108:478–483. [DOI] [PubMed] [Google Scholar]
- Xuan Y, Meng C, Yang Y, Zhu C, Wang L, Yan Q, Lin C, Yu C (2012): Resting‐state brain activity in adult males who stutter. PLoS One 7:e30570. [DOI] [PMC free article] [PubMed] [Google Scholar]
- Yu R, Chien Y‐L, Wang H‐LS, Liu C‐M, Liu C‐C, Hwang T‐J, Hsieh MH, Hwu H‐G, Tseng W‐YI(2012): Frequency‐specific alternations in the amplitude of low‐frequency fluctuations in schizophrenia. Hum Brain Mapp 35:627–637. [DOI] [PMC free article] [PubMed] [Google Scholar]
- Zang Y, Jiang T, Lu Y, He Y, Tian L (2004): Regional homogeneity approach to fMRI data analysis. Neuroimage 22:394–400. [DOI] [PubMed] [Google Scholar]
- Zang Y‐F, He Y, Zhu C‐Z, Cao Q‐J, Sui M‐Q, Liang M, Tian L‐X, Jiang T‐Z, Wang Y‐F(2007): Altered baseline brain activity in children with ADHD revealed by resting‐state functional MRI. Brain Dev 29:83–91. [DOI] [PubMed] [Google Scholar]
- Zhang D, Raichle ME (2010): Disease and the brain's dark energy. Nat Rev Neurol 6:15–28. [DOI] [PubMed] [Google Scholar]
- Zuo XN, Di Martino A, Kelly C, Shehzad ZE, Gee DG, Klein DF, Castellanos FX, Biswal BB, Milham MP (2010): The oscillating brain: Complex and reliable. Neuroimage 49:1432–1445. [DOI] [PMC free article] [PubMed] [Google Scholar]
- Zuo XN, Xu T, Jiang L, Yang Z, Cao XY, He Y, Zang YF, Castellanos FX, Milham MP (2013): Toward reliable characterization of functional homogeneity in the human brain: Preprocessing, scan duration, imaging resolution and computational space. Neuroimage 65:374–386. [DOI] [PMC free article] [PubMed] [Google Scholar]
Associated Data
This section collects any data citations, data availability statements, or supplementary materials included in this article.
Supplementary Materials
Supplementary Information