

Abstract
Individuals with fragile X syndrome (FXS) exhibit frontal lobe‐associated cognitive and behavioral deficits, including impaired general cognitive abilities, perseverative behaviors, and social difficulties. Neural signals related to these functions are communicated through frontostriatal circuits, which connect with distinct regions of the caudate nucleus (CN). Enlargement of the CN is the most robust and reproduced neuroanatomical abnormality in FXS, but very little is known on how this affects behavioral/cognitive outcomes in this condition. Here, we investigated topography within focal regions of the CN associated with prefrontal circuitry and its link with aberrant behavior and intellect in FXS. Imaging data were acquired from 48 individuals with FXS, 28 IQ‐matched controls without FXS (IQ‐CTL), and 36 typically developing controls (TD‐CTL). Of the total participant count, cognitive and behavioral assessment data were obtained from 44 individuals with FXS and 27 participants in the IQ‐CTL group. CN volume and topography were compared between groups. Correlations were performed between CN topography and cognitive as well as behavioral measures within FXS and IQ‐CTL groups. As expected, the FXS group had larger CN compared with both IQ‐CTL and TD‐CTL groups. Correlations between focal CN topography and frontal lobe‐associated cognitive and behavioral deficits in the FXS group supported the hypothesis that CN enlargement is related to abnormal orbitofrontal‐caudate and dorsolateral‐caudate circuitry in FXS. These findings deepen our understanding of neuroanatomical mechanisms underlying cognitive‐behavioral problems in FXS and hold promise for informing future behavioral and psychopharmacological interventions targeting specific neural pathways. Hum Brain Mapp 35:2861–2868, 2014. © 2013 Wiley Periodicals, Inc.
Keywords: caudate nucleus, fragile X syndrome, shape, cognition, behavior, topography
INTRODUCTION
Fragile X syndrome (FXS) is the most common known heritable cause of behavioral and cognitive disability. It is a disorder involving a transcriptional silencing mutation of the fragile X mental retardation gene (FMR1) on chromosome Xq27.3, which codes for the fragile X mental retardation protein (FMRP) [Krawczun et al., 1985]. FMRP is responsible for translational regulation of proteins critical for synaptic maturation and plasticity [Khandjian et al., 1996; Ule and Darnell, 2006; Zalfa et al., 2006]. Absence of this critical protein in individuals with FXS causes delayed dendritic spine formation and decreased synaptic plasticity, resulting in impaired neural development and function [Darnell et al., 2011; Nimchinsky et al., 2001; Pan et al., 2004; Rudelli et al., 1985].
The most robust neuroanatomical characteristic of individuals with FXS detected with neuroimaging is an enlarged caudate nucleus (CN) [Bray et al., 2011; Eliez et al., 2001; Hallahan et al., 2011]. Previous studies have shown that the characteristic enlarged CN in FXS emerges early, possibly prenatally [Hazlett et al., 2012; Hoeft et al., 2010], and remains enlarged throughout adolescence [Bray et al., 2011]. The CN is one of four basal ganglia, controlling and relaying information related to motor behavior, learning, emotions, and directing attention. This information is communicated through frontostriatal circuitry, which connects with the CN in specific subregions [Selemon and Goldman‐Rakic, 1985]. The extant literature indicates that different cognitive and behavioral signals are communicated through distinct frontostriatal circuits [Bonelli and Cummings, 2007].
The dorsolateral prefrontal circuit originates on the lateral surface of the anterior frontal lobe and connects with the dorsolateral CN head [Robinson et al., 2012; Selemon and Goldman‐Rakic, 1985]. This circuit plays an important role in general cognition and executive functioning [Alvarez and Emory, 2006; Lichter and Cummings, 2001]. The orbitofrontal circuit originates on the medial inferior frontal gyrus and connects with the ventromedial CN, playing an integral role in social behavior [Bonelli and Cummings, 2007; Selemon and Goldman‐Rakic, 1985]. Some symptoms associated with orbitofrontal lesions in individuals who do not have FXS include decreased impulse inhibition, lack of judgment and social tact, irritability, inattention, distractibility, increased motor activity, and euphoria [Eslinger and Damasio, 1985; Lichter and Cummings, 2001; Mendez et al., 1989; Meyers et al., 1992; Starkstein and Kremer, 2001].
The cognitive and behavioral profiles of individuals with FXS have been well described. The cognitive phenotype associated with FXS includes intellectual disability and impaired executive functioning abilities [Reiss and Dant, 2003]. Behaviorally, individuals with FXS exhibit many autistic traits including repetitive behaviors, problems with socialization, and excessive attention or sensitivity to particular sensory stimuli [Hagerman and Hagerman, 2002]. These behavioral and cognitive deficits may be related to structural abnormalities in the aforementioned frontostriatal circuits, including the CN [Hallahan et al., 2011; Hoeft et al., 2007].
Previous surface‐based modeling studies in FXS showed that CN volumes are positively correlated with increasing levels of autistic and repetitive behaviors and decreased intellectual level [Gothelf et al., 2008]. The purpose of this study was to build on these previous findings and more precisely determine the nature of the relationship between CN size increase, aberrant behaviors and intellectual level, and prefrontal circuits in FXS. In light of current knowledge regarding the function of human prefrontal‐CN circuitry, we hypothesized that general impairment in cognitive functioning would be associated with increases in dorsolateral CN head sizes and increased aberrant behavior with greater ventromedial CN sizes in individuals with FXS. These associations may be a key to understanding brain‐behavior links in FXS and possibly serve as biomarkers to test for the effectiveness of future ameliorative interventions.
MATERIALS AND METHODS
Subjects
The study sample consisted of 112 subjects between the ages of 15 and 27. This included a total of 48 individuals with FXS, 28 IQ‐matched controls (IQ‐CTL), and 36 typically developing controls (TD‐CTL). All groups were in the same age range and were matched by sex. Participants in the IQ‐CTL and TD‐CTL groups did not weigh less than 4.4 pounds at birth and were not born 8 weeks or more premature. We used standardized screening practices developed in our laboratory to rule out significant neurological, psychiatric, or medical conditions in the TD‐CTL group that could affect imaging results (e.g., traumatic brain injury with loss of consciousness, significant impairment of hearing or vision, learning disorders, and ADHD). In addition, the FXS and IQ‐CTL groups received a detailed questionnaire focused on developmental and medical history. The IQ‐CTL group was heterogeneous, with a continuum of behaviors comparable to the FXS group. The IQ‐CTL and FXS groups were well matched for IQ and Autism Behavior Diagnostic Observation Schedule—Communication and Social scores. Standard Southern blot procedures and polymerase chain reaction analyses confirm the presence of the FMR1 full mutation for participants in the FXS group. Rapid polymerase chain reaction analyses confirm the absence of the FMR1 expanded alleles for participants in the IQ‐CTL group [Tassone et al., 2008].
Cognitive and Behavioral Tests
Of the previously listed participants, cognitive and behavioral data were acquired for 44 individuals with FXS and 27 IQ‐CTL individuals (Table 1). No cognitive or behavioral data were obtained for the TD‐CTL group other than screening behavior checklists and interviews indicating the absence of significant cognitive, neurological, or behavioral problems. The Aberrant Behavior Checklist—Community (AbBC) was used to quantify behaviors of the participants. The AbBC is divided into five subscales: hyperactivity, inappropriate speech, irritability, lethargy/social withdrawal, and stereotypy/repetitive behavior. Scores were reported in each subscale, along with a total score, with higher scores indicating worse outcome [Aman et al., 1985].
Table 1.
Demographic table with statistics
| TD‐CTL | IQ‐CTL | FXS | |
|---|---|---|---|
| N | 36 | 28 | 48 |
| Sex, F/M | 17/19 | 15/13 | 31/17 |
| Full‐scale IQ | — | 69.7 ± 15.9 (53–106) | 71.0 ± 19.2 (40–116) |
| ADOS | — | 5.45 ± 4.08 (0–16) | 6.74 ± 5.26 (0–18) |
| Age, years | 19.7 ± 2.7 (15.3–25.8) | 19.5 ± 3.1 (15.2–26.7) | 21.3 ± 3.0 (15.4–25.9) |
ADOS: Autism Behavior Diagnostic Observation Schedule—Community and Social Score. Mean ± standard deviation, and range in parenthesis.
The Wechsler Abbreviated Scale of Intelligence (WASI) or the Wechsler Intelligence Scale for Children III (WISC‐III) was used to measure full‐scale IQ (IQ). The WASI was administered to participants over 16 years of age [Wechsler, 1999], and the WISC‐III was administered to participants 16 years old and younger [Wechsler, 1991]. Specifically, 38 participants in the FXS group were administered the WASI and six the WISC‐III. In the IQ‐CTL group, 22 participants were administered the WASI and five the WISC‐III. Full‐scale IQ measures from the WASI and WISC‐III are highly correlated (r = 0.87) [Wechsler, 1999].
MRI Acquisition
Each subject was scanned using a 3‐T GE Signa scanner (Lucas Center of Radiology, Stanford University), which resulted in 124 contiguous T1‐weighted, three‐dimensional volumetric slow spoiled gradient echo coronal slices, with slices adjusted to a thickness of 1.5–1.7 mm to accommodate the whole brain, repetition time (TR) = 35 ms, echo time (TE) = 6 ms, flip angle = 45°, field of view = 240 × 240 mm2, matrix size = 256 × 256, and in‐plane resolution = 0.94 mm3.
CN Delineation
The CN was delineated from the rest of the subcortical structures using software version 4.5 of Freesurfer (http://surfer.nmr.mgh.harvard.edu/), an automated MRI analysis tool used to digitally segment brain structures [Dale et al., 1999; Fischl and Dale, 2000; Fischl et al., 2002, 2004; Segonne et al., 2004; Sled et al., 1998]. This method of subcortical structure delineation is more consistent than manual delineation because it reduces intra‐rater and inter‐rater bias [Wonderlick et al., 2009]. Automated segmentations of the CN were visually inspected using FreeSurfer's FreeView application, and when needed, the appropriate manual corrections were performed by a single rater. The rater was trained to manually delineate the CN and had achieved an intraclass correlation coefficient of ≥0.95 on a gold‐standard dataset before undertaking this analysis. Manual editing of the CN was required for only one dataset.
Volumetric Analysis
Left and right CN volumes were compared between groups. CN volumes were adjusted for total brain volume for each subject by dividing caudate volumes by total brain volumes [Capitao et al., 2011]. Using ANCOVA, we investigated group differences (FXS vs. IQ‐CTL; FXS vs. TD‐CTL; and IQ‐CTL vs. TD‐CTL) for left and right adjusted CN volumes, covaried by age. We analyzed within‐group associations between adjusted CN volumes and AbBC total, AbBC subscale, IQ scores, as well as age. Data did not satisfy parametric assumption of normal distribution, so nonparametric Kruskal–Wallis and Mann–Whitney U‐tests were used to compare adjusted CN volumes between groups, and Spearman correlation was used to analyze correlation between adjusted CN volumes and AbBC total and subscale scores, IQ scores, and age.
Surface Contour Mapping
The FreeSurfer‐generated CN ROIs were registered to a standard brain‐imaging template (ICBM452) using a nine‐parameter transformation accounting for total brain volume variation between individuals (FMRIB Software Library—FSL). Using Shape Tools (http://www.loni.ucla.edu/Software/ShapeTools), spatially transformed CN ROIs were constructed into parametric surface mesh models [Thompson et al., 2004, 2007]. CN surface points derived from FreeSurfer segmentation were matched across subjects by equalizing their spatial frequency within and across brain slices between subjects. A medial line was drawn through the center, along the anteroposterior axis, of each CN. To represent CN topography, radial distances were measured perpendicularly along the medial line to each uniformly distributed surface point of the model [Madsen et al., 2011; Thompson et al., 2004]. Radial distances measured from corresponding surface points were matched across subjects and averaged across groups. Using an ANCOVA with age as a covariate, differences in average radial distance for each corresponding surface point across subjects were analyzed for the following comparisons: FXS vs. IQ‐CTL, FXS vs. TD‐CTL, and IQ‐CTL vs. TD‐CTL [Thompson et al., 2004]. Post hoc Pearson's correlations were then conducted to investigate the association between localized variation of radial distances for each surface point and AbBC total and subscale scores, IQ, and age. Each P‐value was plotted onto a CN surface mesh model.
Overall P‐values corrected for multiple comparisons were obtained through permutation testing (100,000 iterations) of group or covariate assignment for the dorsal and ventral halves of the left and right CN [Thompson et al., 2003, 2004, 2007]. Permutation tests compared the statistical features observed in the true experiment to those occurring with randomly assigned groups or covariate values. A ratio was calculated to quantify the probability of randomly obtaining a statistical effect similar or greater than that which would be observed in the true experiment. Guided by the overall P‐value for each dorsal or ventral CN bisection, the locations of significant between‐group differences and within‐group correlations were examined visually with reference to caudate subregional anatomy associated with the dorsolateral prefrontal and orbitofrontal circuits described above.
RESULTS
Differences in CN Volume Between Groups
Bilateral adjusted CN volumes were greater in the FXS group compared with IQ‐CTL and TD‐CTL groups (ANCOVA: P < 0.01 for all comparisons). There was no significant difference in left or right adjusted CN volumes between TD‐CTL and IQ‐CTL groups (ANCOVA: P > 0.05 for left and right comparisons).
Left adjusted CN volumes for FXS group data were not normally distributed (Shapiro–Wilk = 0.983, P = 0.044). From nonparametric tests, we found that bilateral adjusted CN volumes of the FXS group were greater than those of the TD‐CTL and IQ‐CTL groups (Mann–Whitney U‐test, P < 0.01 for all comparisons). CN volumes of the TD‐CTL group were not significantly different from those of the IQ‐CTL group (Mann–Whitney U‐test, P > 0.05 for both comparisons).
Correlations With CN Volume
In the FXS group, adjusted CN volumes were bilaterally correlated with AbBC total (left Spearman's correlation coefficient ρ = 0.358, P < 0.02; right ρ = 0.356, P < 0.02) and IQ (left ρ = 0.477, P < 0.01; right ρ = 0.394, P < 0.01). In the IQ‐CTL group, adjusted CN volumes were not correlated with AbBC total or IQ scores (P > 0.05 for all comparisons). Age was not correlated with adjusted CN volumes in either group (P > 0.05 for all comparisons). Complete statistics describing CN volume correlation with cognitive/behavioral variables and age can be found in Supporting Information Figure S1.
Differences in CN Topography Between Groups
We observed gross bilateral CN radial distance increases in the FXS group compared with TD‐CTL and IQ‐CTL groups (P < 0.005 for all comparisons). Figure 1 shows greater dorsolateral CN head and ventromedial CN body radial distances in the FXS group compared with TD‐CTL and IQ‐CTL groups. Unilateral CN radial distance increases were observed in the IQ‐CTL compared with the TD‐CTL group for the right CN only (P < 0.01).
Figure 1.
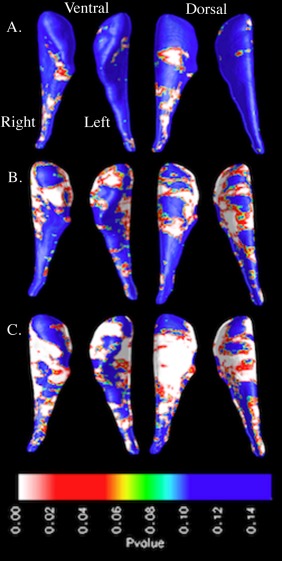
Surface‐based maps of the caudate nucleus showing significant gross enlargement in (A) the IQ‐control group (IQ‐CTL, n = 28) compared with the typically developing control group (TD‐CTL, n = 36), (B) the fragile X syndrome group (FXS, n = 48) compared with the TD‐CTL group, and (C) the FXS group compared with the IQ‐CTL group. [Color figure can be viewed in the online issue, which is available at http://wileyonlinelibrary.com.]
Correlations With Topographical Variation in the CN
Age was not significantly correlated with CN topography in any group (P > 0.05). In the FXS group, significant (P < 0.05) positive correlations between AbBC total scores and radial distance variation were observed across bilateral CN dorsal and ventral subregions, indicating that increases in aberrant behavior were associated with greater topographical variation. These observed positive correlations between radial distances and AbBC total scores extended down the dorsolateral CN head and body as well as the ventromedial CN body (Fig. 2 and Supporting Information Fig. S2). In the IQ‐CTL group, AbBC total scores were not significantly correlated with CN topography.
Investigation of overall correlations between each of the five AbBC subscale scores and CN topography in the FXS group yielded mixed results. Inappropriate speech and irritability subscale scores were positively correlated with dorsal and ventral radial distance variation (P < 0.05 bilaterally for both subscales). Lethargy/social withdrawal subscale scores were positively correlated across bilateral dorsal CN radial distances (P < 0.05), but not ventral (P > 0.05). Stereotypy subscale scores were positively correlated dorsally and ventrally with radial distance on the left CN (P < 0.05), but not the right (P > 0.05). Hyperactivity scores were not significantly correlated with radial distance variation, but trended toward significance (0.05 < P < 0.07 for all hemispheres). AbBC subscale scores were not significantly correlated with CN topographical variation in the IQ‐CTL group (P > 0.05).
With visual interpretation of the CN surface mesh models, we observed that greater ventromedial CN body radial distances were linked to increases in inappropriate speech, irritability, and stereotypy subscale scores (Fig. 2). Inappropriate speech and irritability subscale scores were bilaterally positively correlated with radial distances in the ventromedial CN body, while stereotypy subscale scores were positively correlated with radial distances of the left ventromedial CN body, but not the right. Greater dorsolateral CN head radial distances were linked to increases in inappropriate speech, irritability, and stereotypy subscale scores (Fig. 2 and Supporting Information Fig. S2). Inappropriate speech and irritability subscale scores were positively correlated with bilateral radial distance increases in the posterior area of the dorsolateral CN head. Stereotypy subscale scores were positively correlated with radial distances on the left dorsolateral CN head, but not the right. The positive correlations between these AbBC subscale scores and dorsolateral CN radial distances are displayed in the lateral view shown in Supporting Information Figure S2. In addition, Figure 2 shows that although the permutation analysis output indicates no significant correlation between hyperactivity subscale score and CN topographical variation, the positive correlation that is observed is concentrated bilaterally within the dorsolateral and ventromedial CN body.
Figure 2.
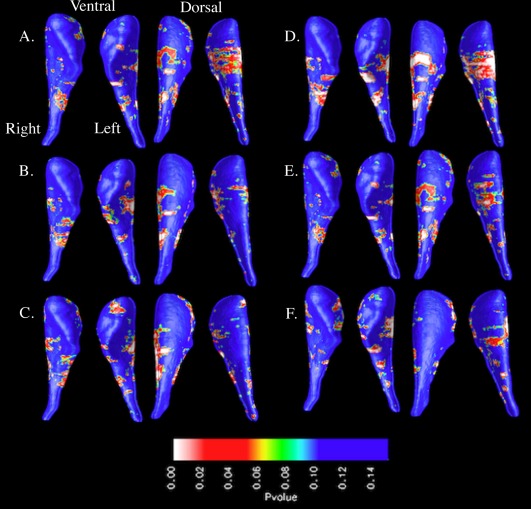
Surface‐based maps of the caudate nucleus showing positive correlation between Aberrant Behavior Checklist total/subscale scores and radial distances in the fragile X syndrome group: (A) total, (B) hyperactivity, (C) inappropriate speech, (D) irritability, (E) lethargy/social withdrawal, and (F) stereotypy. [Color figure can be viewed in the online issue, which is available at http://wileyonlinelibrary.com.]
In the FXS group, significant negative correlation (P < 0.05) was observed between IQ scores and radial distance variation across bilateral CN dorsal and ventral subregions, indicating that lower cognitive levels are associated with larger radial distances. Subregions of negative correlation were located bilaterally on the dorsolateral head and body and unilaterally on the right ventromedial body (Fig. 3). IQ scores were not significantly correlated with radial distance variation within the IQ‐CTL group.
Figure 3.
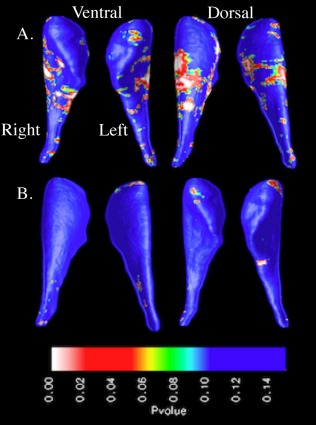
Surface‐based maps of the caudate nucleus showing negative correlation between IQ scores and radial distances in the (A) fragile X syndrome group and (B) IQ‐control group. [Color figure can be viewed in the online issue, which is available at http://wileyonlinelibrary.com.]
DISCUSSION
This study sought to expand on the established finding of enlarged caudate volumes in FXS [Bray et al., 2011; Eliez et al., 2001; Hallahan et al., 2011] by investigating differences in CN topography between FXS, IQ‐CTL, and TD‐CTL groups. Additionally, we examined the association of CN topography with cognitive and behavioral variations in FXS. Supporting our hypothesis, the data showed larger CN volumes and widespread radial distance increases in the FXS group compared with the TD‐CTL and IQ‐CTL groups. Further, we found that topographical variation in the dorsolateral and ventromedial CN was correlated with cognitive/behavioral variation in FXS. However, the observed correlations lacked the specificity that we had hypothesized.
Volumetric and topographical comparisons between the FXS and IQ‐CTL groups showed significantly larger overall and subregional CN size in individuals with FXS compared with a non‐FXS population of comparable cognitive level. These results support the hypothesis that CN size increase is linked to the fragile X genotype, and not general lower cognitive level. Specific relevance of enlarged CN size to the FXS phenotype was also supported by the within‐group correlation analyses, as neither AbBC subscale scores nor IQ was correlated with CN topography in the IQ‐CTL group.
Within‐group correlation data partially supported the hypothesis that aberrant behavior and general cognition would be associated with topography of specific subregions of the CN in FXS. We observed positive correlation between aberrant behavior and ventromedial CN enlargement and negative correlation between general cognition and dorsolateral CN head enlargement. The ventromedial CN is associated with the orbitofrontal circuit, which plays a key role in social behavior, whereas the dorsolateral CN head is a part of the dorsolateral prefrontal circuit, which plays an important role in general cognition and executive functioning [Alvarez and Emory, 2006; Bonelli and Cummings, 2007; Lichter and Cummings, 2001; Robinson et al., 2012; Selemon and Goldman‐Rakic, 1985]. Based on our observations and what is known about the function and connectivity of these prefrontal circuits, it is probable that well‐documented CN enlargement in FXS is related to disruption in both orbitofrontal‐caudate circuitry and dorsolateral‐caudate circuitry. Dysfunction of prefrontal‐caudate circuits provides a conceptually parsimonious explanation for several cognitive and behavioral deficits in FXS [Hagerman and Hagerman, 2002; Reiss and Dant, 2003].
Contrary to our hypotheses, the observed correlations were not spatially restricted as originally predicted (cognitive function with dorsolateral CN head and aberrant behavior with ventromedial CN). Inappropriate speech, irritability, and stereotypy scores were correlated with dorsolateral CN topography, and IQ was correlated with right ventromedial CN topography in the FXS group. These unexpected associations are likely due to interplay between dorsolateral prefrontal and orbitofrontal circuit functioning for each cognitive and behavioral task. Poor executive functioning can underscore many aberrant behaviors. The most apparent example is seen in the inappropriate speech subscale in which a high score can show a participant's difficulty with social behavior as well as poor executive function (impulse inhibition). As executive function is associated with the orbitofrontal circuit and social behavior with the dorsolateral prefrontal circuit, it is likely that both circuits are involved in a trait such as inappropriate speech. The data suggest that it is difficult to separate circuits involved with executive function and general cognition from those involved with social behavior.
We also observed unexpected, nonspecific correlations between CN topography and behavioral/cognitive characteristics (Fig. 2). Aside from the dorsolateral prefrontal and orbitofrontal cortex, the CN is linked to additional circuits, which play essential roles in behavior, general cognition, and executive function [Robinson et al., 2012]. For example, the ventral CN is connected to the temporal lobe, limbic striatum, hippocampus, and amygdala, whereas the CN head is connected to the associative striatum [Robinson et al., 2012]. It is likely that the existence of these circuits confounded the correlation analyses between CN topography and a priori defined behavioral/cognitive traits.
Several limitations to the generalizability of the findings for this study should be considered. In this study, we attempted to link CN subregion morphology to behavioral/cognitive traits in FXS based on established prefrontal circuit functions. An assessment of the white matter microstructure of frontostriatal circuits through diffusion tensor imaging would add to the findings of this study to better represent the nature of the aberrant frontostriatal‐caudate connections in FXS. In addition, a subset of the structural scans used in this analysis was acquired with a slightly larger slice thickness than recommended for FreeSurfer analyses (http://surfer.nmr.mgh.harvard.edu/fswiki/FreeSurferBeginnersGuide). This permitted backward compatibility with longitudinal data while maintaining TR and T1 contrast. The use of the AbBC as the sole measurement of aberrant social behavior was also a limitation. The AbBC is a broad behavioral assessment tool and may not be ideal for evaluation of highly specific aberrant behaviors.
In this study, we used a novel method for interrogating brain‐behavior links in FXS. We found that the characteristic increase in CN volume among individuals with FXS is associated with variation of both aberrant behavior and general cognitive function. Furthermore, we found that topographical variations in specific subregions of the CN are linked with these cognitive and behavioral features in FXS, though not in a manner that clearly delineates cognitive from behavioral function. Our findings support the overarching assertion that cognitive and behavioral features of FXS are strongly connected to dysfunction of dorsolateral prefrontal‐striatal and orbitofrontal‐striatal circuits. Thus, assessment of the structure, function, and connectivity of these circuits with in vivo neuroimaging can potentially contribute a critical biomarker for use in ongoing clinical trials for this important condition.
ACKNOWLEDGMENT
The authors sincerely thank all the participants and their families. Funding for this study came from the National Institutes of Health grant #MH50047.
Supporting information
Additional Supporting Information may be found in the online version of this article
Supporting Information
Supporting Information
REFERENCES
- Alvarez JA, Emory E (2006): Executive function and the frontal lobes: A metaanalytic review. Neuropsychol Rev 16:17–42. [DOI] [PubMed] [Google Scholar]
- Aman MG, Singh NN, Stewart AW, Field CJ (1985): The aberrant behavior checklist: A behavior rating scale for the assessment of treatment effects. Am J Ment Defic 89:485–491. [PubMed] [Google Scholar]
- Bonelli RM, Cummings JL (2007): Frontal‐subcortical circuitry and behavior. Dialogues Clin Neurosci 9:141–151. [DOI] [PMC free article] [PubMed] [Google Scholar]
- Bray S, Hirt M, Jo B, Hall SS, Lightbody AA, Walter E, Chen K, Patnaik S, Reiss AL, (2011): Aberrant frontal lobe maturation in adolescents with fragile X syndrome is related to delayed cognitive maturation. Biol Psychiatry 70:852‐858. [DOI] [PMC free article] [PubMed] [Google Scholar]
- Capitão L, Sampaio A, Sampaio C, Vasconcelos C, Férnandez M, Garayzábal E, Shenton ME, Gonçalves OF, (2011): MRI amygdala volume in Williams syndrome. Res Dev Disabil 32:2767–2772. [DOI] [PubMed] [Google Scholar]
- Eliez S, Blasey CM, Freund LS, Hastie T, Reiss AL (2001): Brain anatomy, gender and IQ in children and adolescents with fragile X syndrome. Brain 124:1610–1618. [DOI] [PubMed] [Google Scholar]
- Eslinger PJ, Damasio AR (1985): Severe disturbance of higher cognition after bilateral frontal lobe ablation: Patient EVR. Neurology 35:1731–1741. [DOI] [PubMed] [Google Scholar]
- Dale AM, Fischl B, Sereno MI (1999): Cortical surface‐based analysis. I. Segmentation and surface reconstruction. Neuroimage 9:179–194. [DOI] [PubMed] [Google Scholar]
- Darnell JC, Van Driesche SJ, Zhang C, Hung KY, Mele A, Fraser CE (2011): FMRP stalls ribosomal translocation on mRNAs linked to synaptic function and autism. Cell 146:247–261. [DOI] [PMC free article] [PubMed] [Google Scholar]
- Fischl B, Dale AM (2000): Measuring the thickness of the human cerebral cortex from magnetic resonance images. Proc Natl Acad Sci USA 97:11050–11055. [DOI] [PMC free article] [PubMed] [Google Scholar]
- Fischl B, Salat DH, Busa E, Albert M, Dieterich M, Haselgrove C, van der Kouwe A, Killany R, Klaveness S, Montillo A, Makris N, Rosen B, Dale AM, (2002): Whole brain segmentation: Automated labeling of neuroanatomical structures in the human brain. Neuron 33:341–355. [DOI] [PubMed] [Google Scholar]
- Fischl B, Salat DH, van der Kouwe AJ, Makris N, Ségonne F, Quinn BT, Dale AM, (2004): Sequence‐independent segmentation of magnetic resonance images. Neuroimage 23 (Suppl 1):S69–S84. [DOI] [PubMed] [Google Scholar]
- Gothelf D, Furfaro JA, Hoeft F, Eckert MA, Hall SS, O'Hara R, Erba HW, Ringel J, Hayashi KM, Patnaik S, Golianu B, Kraemer HC, Thompson PM, Piven J, Reiss AL, (2008): Neuroanatomy of fragile X syndrome is associated with aberrant behavior and the fragile X mental retardation protein (FMRP). Ann Neurol 63:40–51. [DOI] [PMC free article] [PubMed] [Google Scholar]
- Hagerman RJ, Hagerman PJ (2002): Fragile X Syndrome: Diagnosis, Treatment and Research, 3rd ed. Baltimore, MA: Johns Hopkins University Press. [Google Scholar]
- Hallahan BP, Craig MC, Toal F, Daly EM, Moore CJ, Ambikapathy A, Robertson D, Murphy KC, Murphy DG, (2011): In vivo brain anatomy of adult males with Fragile X syndrome: An MRI study. Neuroimage 54:16–24. [DOI] [PubMed] [Google Scholar]
- Hazlett HC, Poe MD, Lightbody AA, Styner M, MacFall JR, Reiss AL, Piven J, (2012): Trajectories of early brain volume development in Fragile X syndrome and autism. J Am Acad Child Adolesc Psychiatry 51:921–933. [DOI] [PMC free article] [PubMed] [Google Scholar]
- Hoeft F, Hernandez A, Parthasarathy S, Watson CL, Hall SS, Reiss AL, (2007): Fronto‐striatal dysfunction and potential compensatory mechanisms in male adolescents with Fragile X syndrome. Hum Brain Mapp 28:543–554. [DOI] [PMC free article] [PubMed] [Google Scholar]
- Hoeft F, Carter JC, Lightbody AA, Cody Hazlett H, Piven J, Reiss AL, (2010): Region‐specific alterations in brain development in one‐ to three‐year‐old boys with fragile X syndrome. Proc Natl Acad Sci USA 107:9335–9339. [DOI] [PMC free article] [PubMed] [Google Scholar]
- Khandjian EW, Corbin F, Woerly S, Rousseau F (1996): The fragile X mental retardation protein is associated with ribosomes. Nat Genet 12:91–93. [DOI] [PubMed] [Google Scholar]
- Krawczun MS, Jenkins EC, Brown WT (1985): Analysis of the fragile‐X chromosome: Localization and detection of the fragile site in high resolution preparations. Hum Genet 69:209–211. [DOI] [PubMed] [Google Scholar]
- Lichter DG, Cummings JL (2001): Introduction and overview In: Lichter DG, Cummings JL, editors. Frontal Subcortical Circuits in Psychiatric and Neurological Disorders. New York, NY: Guilford Press; pp 1–43. [Google Scholar]
- Madsen SK, Ho AJ, Hua X, Saharan PS, Toga AW, Jack CR, Weiner MW, Thompson PM, (2011): 3D maps localize caudate nucleus atrophy in 400 Alzheimer's disease, mild cognitive impairment, and healthy elderly subjects. Neurobiol Aging 31:1312–1325. [DOI] [PMC free article] [PubMed] [Google Scholar]
- Mendez MF, Adams NL, Lewandowski KS (1989): Neurobehavioral changes associated with caudate lesions. Neurology 39:349–354. [DOI] [PubMed] [Google Scholar]
- Meyers CA, Berman SA, Scheibel RS, Hayman A (1992): Case report: Acquired antisocial personality disorder associated with unilateral left orbital frontal lobe damage. J Psychiatry Neurosci 17:121–125. [PMC free article] [PubMed] [Google Scholar]
- Nimchinsky EA, Oberlander AM, Svoboda K (2001): Abnormal development of dendritic spines in FMR1 knock‐out mice. J Neurosci 21:5139–5146. [DOI] [PMC free article] [PubMed] [Google Scholar]
- Pan L, Zhang YQ, Woodruff E, Broadie K (2004): The Drosophila fragile X gene negatively regulates neuronal elaboration and synaptic differentiation. Curr Biol 14:1863–1870. [DOI] [PubMed] [Google Scholar]
- Reiss AL, Dant CC (2003): The behavioral neurogenetics of fragile X syndrome: Analyzing gene‐brain‐behavior relationships in child developmental psychopathologies. Dev Psychopathol 15:927–968. [DOI] [PubMed] [Google Scholar]
- Robinson JL, Laird AR, Glahn DC, Blangero J, Sanghera MK, Pessoa L, Fox PM, Uecker A, Friehs G, Young KA, Griffin JL, Lovallo WR, Fox PT, (2012): The functional connectivity of the human caudate: An application of meta‐analytic connectivity modeling with behavioral filtering. Neuroimage 60:117–129. [DOI] [PMC free article] [PubMed] [Google Scholar]
- Rudelli RD, Brown WT, Wisniewski K, Jenkins EC, Laure‐Kamionowska M, Connell F, Wisniewski HM (1985): Adult fragile X syndrome. Clinico‐neuropathologic findings. Acta Neuropathol 67:289–295. [DOI] [PubMed] [Google Scholar]
- Segonne F, Dale AM, Busa E, Glessner M, Salat D, Hahn HK, Fischl B, (2004): A hybrid approach to the skull stripping problem in MRI. Neuroimage 22:1060–1075. [DOI] [PubMed] [Google Scholar]
- Selemon LD, Goldman‐Rakic PS (1985): Longitudinal topography and interdigitation of corticostriatal projections in the rhesus monkey. J Neurosci 5:776–794. [DOI] [PMC free article] [PubMed] [Google Scholar]
- Sled JG, Zijdenbos AP, Evans AC (1998): A nonparametric method for automatic correction of intensity nonuniformity in MRI data. IEEE Trans Med Imaging 17:87–97. [DOI] [PubMed] [Google Scholar]
- Starkstein SE, Kremer J (2001): The disinhibition syndrome and frontal‐subcortical circuits In: Lichter DG, Cummings JL, editors. Frontal‐Subcortical Circuits in Psychiatric and Neurological Disorders. New York, NY: Guilford Press; pp 163–176. [Google Scholar]
- Tassone F, Pan R, Amiri K, Taylor AK, Hagerman PJ (2008): A rapid polymerase chain reaction‐based screening method for identification of all expanded alleles of the fragile X (FMR1) gene in newborn and high‐risk populations. J Mol Diagn 10:43–49. [DOI] [PMC free article] [PubMed] [Google Scholar]
- Thompson PM, Hayashi KM, De Zubicaray GI, Janke AL, Rose SE, Semple J, Herman D, Hong MS, Dittmer SS, Doddrel DM, Toga AW, (2003): Dynamics of gray matter loss in Alzheimer's disease. J Neurosci 22:994–1005. [DOI] [PMC free article] [PubMed] [Google Scholar]
- Thompson PM, Hayashi KM, De Zubicaray GI, Janke AL, Rose SE, Semple J, Hong MS, Herman DH, Gravano D, Doddrell DM, Toga AW, (2004): Mapping hippocampal and ventricular change in Alzheimer disease. Neuroimage 22:1754–1766 [DOI] [PubMed] [Google Scholar]
- Thompson PM, Hayashi KM, Sowell ER, Gogtay N, Giedd JN, Rapoport JL, deZubicaray GI, Janke AL, Rose SE, Semple J, Doddrell DM, Wang Y, van Erp TG, Cannon TD, Toga AW, (2007): Mapping cortical change in Alzheimer's disease, brain development, and schizophrenia. Neuroimage 23:S2–S18. [DOI] [PubMed] [Google Scholar]
- Ule J, Darnell RB (2006): RNA binding proteins and the regulation of neuronal synaptic plasticity. Curr Opin Neurobiol 16:102–110. [DOI] [PubMed] [Google Scholar]
- Wechsler D (1991): Wechsler Intelligence Scale for Children, 3rd ed. San Antonio: The Psychological Corporation. [Google Scholar]
- Wechsler D (1999): The Wechsler Abbreviated Scale of Intelligence. San Antonio: The Psychological Corporation. [Google Scholar]
- Wonderlick JS, Ziegler DA, Hosseini‐Varnamkhasti P, Locascio JJ, Bakkour A, van der Kouwe A, Triantafyllou C, Corkin S, Dickerson BC (2009): Reliability of MRI‐derived cortical and subcortical morphometric measures: Effects of pulse sequence, voxel geometry, and parallel imaging. Neuroimage 44:1324–1333. [DOI] [PMC free article] [PubMed] [Google Scholar]
- Zalfa F, Achsel T, Bagni C (2006): mRNPs, polysomes or granules: FMRP in neuronal protein synthesis. Curr Opin Neurobiol 16:265–269. [DOI] [PubMed] [Google Scholar]
Associated Data
This section collects any data citations, data availability statements, or supplementary materials included in this article.
Supplementary Materials
Additional Supporting Information may be found in the online version of this article
Supporting Information
Supporting Information