

Abstract
Human cortical gray matter (GM) is structurally asymmetrical and this asymmetry has been discussed to be partly responsible for functional lateralization of human cognition and behavior. Past studies on brain asymmetry have shown mixed results so far, with some studies focusing on the global shapes of the brain's surface, such as gyrification patterns, while others focused on regional brain volumes. In this study, we investigated cortical GM asymmetries in a large sample of right‐handed healthy volunteers (n = 101), using a surface‐based method which allows to analyze brain cortical thickness and surface area separately. As a result, substantially different patterns of symmetry emerged between cortical thickness and surface area measures. In general, asymmetry is more prominent in the measure of surface compared to that of thickness. Such a detailed investigation of structural asymmetries in the normal brain contributes largely to our knowledge of normal brain development and also offers insights into the neurodevelopmental basis of psychiatric disorders, such as schizophrenia. Hum Brain Mapp 35:6011–6022, 2014. © 2014 Wiley Periodicals, Inc.
Keywords: asymmetry, cortical thickness, cortical volume, lateralization, surface area
INTRODUCTION
In healthy adults, cortical gray matter (GM) is structurally asymmetrical or lateralized [Toga and Thompson, 2003]. Anatomically visible significant leftward brain asymmetry in the planum temporale (PT), which subserves language‐ and sound production, was determined and reproduced repeatedly [Geschwind and Lewitsky, 1968, ch. 2.3]. This lateralization effect has been found to be enhanced by factors such as handedness and gender [Good et al., 2001] as well as frequent use of brain areas, which Luders et al. [2004] demonstrated in their investigation of a population of healthy musicians with and without absolute pitch. Other than the mentioned PT, frequently reported to be anatomically lateralized are the right frontal and left occipital petalia [LeMay, 1976]. Recently, Goldberg et al. [2013] summarized in their study on GM volume asymmetries that areas implicated in visual processing show rightward asymmetries, while, in contrast, somatosensory, auditory and parts of the premotor cortex show leftward asymmetries. Cykowski et al. [2008] reported a leftward asymmetry of the central sulcus. However, for some areas of the brain, controversial results have been reported regarding the direction of asymmetries. For example, for the Heschl's gyrus (HG) Campain and Minkler [1976] found a rightward asymmetry, while Penhune et al. [1996] reported a lateralization to the left. Also, for the anterior cingulate cortex (ACC) Fornito et al. [2004] found a lateralization to the left, while Pujol et al. [2002b] found a rightward asymmetry of the ACC. Controversial findings of brain asymmetry have previously been attributed, for instance, to small sample sizes [Cykowski et al., 2008] and to biased results due to differences of segmentation methods [Kovalev et al., 2003].
Structural asymmetry has been hypothesized to form the basis of functional lateralization, seen, for example, in language function [Blackmon et al., 2010; Deutsch, 1985; Geschwind and Lewitsky, 1968]. Then again, negative results regarding correlations between structural asymmetry of PT and language lateralization have been reported [Eckert et al., 2006], and the hypothesis of a simple correlation has been abandoned in favor of more multifaceted causal relationships. For example, Dos Santos Sequeira et al. [2006] found that gender, handedness and functional lateralization of dichotic listening contributed to a complex pattern of PT asymmetry, indicating a strong interindividual variability.
Differences in the microstructure of the cortical GM are considered to underlie structural brain asymmetry [Hutsler and Galuske, 2003; Uylings et al., 2006]. The volume of GM is a composite of thickness and surface area [Panizzon et al., 2009]. As the cerebral cortex is organized into columns [Mountcastle, 1997], GM thickness reflects microstructural factors as the number of cells within each column [Rakic, 1988], density of neurons, glia, and their processes, for example, regional myelination [Paus et al., 1996; Sowell et al., 2004], while GM surface area mirrors neuron density [Sisodiya et al., 1996; Sisodiya and Free, 1997] and/or number of columns in each region [Glantz et al., 2006]. These two structural measurements have been argued to be highly heritable and apparently driven by distinct evolutionary, cellular and genetic mechanisms [Im et al., 2008; Panizzon et al., 2009]. Considering the microstructural and modular organization of the cortex, thickness and surface area are likely to be two variables that would separately and independent of each other contribute to the neural network formation and realization of its functions [Ecker et al., 2013].
Knowledge of the complex patterns of hemispheric lateralization and the distinct contribution of brain surface area and thickness to cortical GM structure in the healthy brain is crucial, informing on distinct neurobiological structural bases involved in the pathophysiology of neuropsychiatric conditions, such as schizophrenia. Abnormalities of GM asymmetries have been identified in schizophrenia [Bilder et al., 1994] which may be genetically determined [Crow, 1998]. Altered asymmetry in the PT has been shown to be related to reduced functional connectivity and to clinical symptoms such as auditory hallucinations [Oertel‐Knochel et al., 2013]. However, only few studies separately assessed the contribution of GM thickness and surface area to structural asymmetries in the healthy brain, and the functional relevance of the findings is not yet known. A recent study on the human auditory‐related cortex assessed cortical volume and thickness as well as surface area [Meyer et al., in press]. It was demonstrated that the surface area of the cortex showed a leftward asymmetry, while a rightward asymmetry was found for GM thickness in the primary and the secondary auditory cortex. Regarding cortical thickness asymmetries, Crespo‐Facorro et al. [2011] investigated 76 healthy volunteers, correlating cortical thickness asymmetries to cognitive functioning and gender. They showed a greater leftward asymmetry of cortical thickness in men. Luders et al. [2006] showed diffuse and widespread cortical thickness asymmetries in a lager sample of healthy volunteers, with generally thicker cortex in the left hemisphere. Taken together, cortical thickness has mainly been found to be leftward lateralized, including the temporal and occipital sulci, ACC and superior temporal sulcus (STS) in the healthy brain. Surface area asymmetries have been assessed by Pujol et al. [2002b] and data revealed that the right ACC was larger, although more pronounced in women than in men. Lyttelton et al. [2009] investigated the cortical surface area of a large sample of young adults. Their study could confirm leftward hemispheric asymmetries in the supramarginal gyrus, the left HG and PT region, as well as a rightward asymmetry of the surface area in a band around the medial junction between the occipital lobe and parietal and temporal lobes. Hutsler et al. [1998] measured cortical asymmetry in a whole‐brain approach, and specifically the postcentral and the cingulate gyrus of 10 male subjects. While a general tendency of asymmetries has been confirmed in these regions, the mean asymmetry scores did not reach significance. In summary, the few available studies on surface area asymmetries concentrated on specific structures, were performed in very small samples of participants or did not relate results on surface area to cortical thickness.
In this study, we will therefore assess the components of cortical GM volumes, thickness and surface area separately in a large sample of healthy volunteers, using a surface‐based morphometric approach [FreeSurfer; Dale et al., 1999; Fischl et al., 1999]. Our aim is to identify brain regions with structural asymmetry in either thickness or surface area measures, as well as their relative contribution to observed differences in regional GM volume asymmetries in a whole‐brain approach.
MATERIALS AND METHODS
Participants
The study group consisted of 101 right‐handed healthy individuals [53 female; mean age (years): 33.0 (standard deviation: 10.6), range: 19–56; mean years of education: 14.4; SD: 2.7]. Verbal (V) and performance (P) IQ were assessed with a short version of the WAIS‐R (vocabulary and block design) [Wechsler, 1981] [n = 99: verbal IQ: 113.7; SD: 16.4; performance IQ: 115.9; SD: 15.0]. Healthy volunteers were recruited via word of mouth and local advertisement. All were Japanese natives. None of them had a personal or family history of psychiatric illness. The Structured Clinical Interview for DSM‐IV‐TR Axis I Disorders, Research Version, Non‐patient Edition (SCID‐I/NP) [First et al., 2002] was used to exclude the presence of psychiatric disorders. Exclusion criteria for all individuals were a history of head trauma, serious neurological, medical or surgical illness, and substance abuse. No participant was on psychotropic medication. Handedness was assessed using the Edinburgh Handedness Inventory (EHI) [Oldfield, 1971]. As we included only right‐handed persons, the mean laterality quotient of EHI was 89.7 (SD: 13.9; range: 20–100). This valid and reliable measure assesses the subject's dominant hand based on 10 items (plus two additional items) in their daily lives, history of correction of handedness, left‐handedness in the family, and history of brain disease in their childhood. Four participants had to be excluded for gross anatomical abnormalities discovered in the structural magnetic resonance imaging (MRI) images. Those were checked by visual inspection and additional exploratory box plot analyses in the statistical software SPSS version 21.0 (SPSS, Chicago, IL) were used to identify extreme outliers. After a complete description of the study, participants gave written informed consent. The study design was approved by the Committee on Medical Ethics of Kyoto University and conforms to the Declaration of Helsinki (http://www.wma.net/en/30publications/10policies/b3/index.html; last access to all referred HP: 06/18/2014).
MRI Acquisition and Processing
Image acquisition
All participants received MRI scans using a 3.0 T whole‐body scanner equipped with a 40 mT/m gradient and a receiver‐only 8‐channel phased‐array head‐coil (Trio, Siemens, Erlangen, Germany). The scanning parameters for the three‐dimensional magnetization‐prepared, rapid‐gradient echo (3D‐MPRAGE) sequences were as follows: echo time = 4.38 ms; repetition time = 2,000 ms; inversion time = 990 ms; field of view = 225 × 240 mm2; matrix = 240 × 256; resolution = 0.9375 × 0.9375 × 1.0 mm3; 208 axial sections without intersection gaps.
Image processing
Cortical reconstruction and volumetric segmentation was performed with the FreeSurfer image analysis suite, which is documented and freely available for download online (version 4.5.0; http://surfer.nmr.mgh.harvard.edu/). The 3D‐MPRAGE images were used to calculate thickness and surface area of the cerebral cortex throughout the cortical mantle. In brief, the processing stream includes a Talairach transform of each participant's native brain, removal of non‐brain tissue and segmentation of GM/white matter (WM) tissue. The GM/WM boundary was tessellated to generate multiple vertices across the whole brain. The cortical surface of each hemisphere was inflated to a sphere to locate the pial surface and the GM/WM boundary. The entire cortex of each participant was visually inspected and any topological defects were corrected manually, blind to participant identity. After the creation of cortical representations, all vertices were assigned neuroanatomical labels on a cortical surface model based on the automated labeling system, and the entire cortex of each hemisphere was parcellated into 33 brain regions [see Desikan et al., 2006]. Cortical thickness was computed as the shortest distance between the pial surface and the GM/WM boundary at each vertex across the cortical mantle. The cortical volume was defined by surface‐based volumetric calculation (area × thickness). The (inner) surface area of a region was computed by adding up the area of the vertices in that region [Greve et al., 2013].
The cortical volume (in mm3), mean thickness (in mm) and surface area (in mm2) were calculated for each brain region for both hemispheres separately. We calculated the Laterality Index (LI) for cortical volume, thickness, and surface area of each brain region according to the formula of 2 × (left‐right)/(left+right). To test the leftward or rightward asymmetry, we conducted one sample t‐tests for LIs for each brain region. A significance level of P < 0.0015 (0.05/33 brain regions) was assumed due to Bonferroni corrections to prevent inflated error rates.
Additionally, we investigated the possible influence of age and gender, as they are known to have a significant impact on asymmetries of GM volumes [Good et al., 2001a,b]. General Linear Models were applied separately for LIs of volume, thickness and surface area data, with brain regions (33) as a within‐subject factor, gender as a between‐subject factor and age as a covariate. Interaction terms included in the models are region and age as well as region and gender. We also included IQ (VIQ and PIQ) in the initial models. However, as this had no effect on the results, we will not report on these data. A significance level of P < 0.05 was set, and if we found significant interaction between region and age or gender, effects of age and gender were further examined in post hoc region‐specific analyses.
Last, we correlated LIs of GM thickness and GM surface using Pearson product‐moment correlation coefficients. The aim was to explore differential contribution patterns of GM thickness and surface area to overall GM volume, and the statistical significance threshold was set at P < 0.05.
For all statistical analyses, SPSS version 21.0 was used.
RESULTS
Cortical Volume
Significant leftward asymmetries were located in the rostral ACC, the transverse temporal gyrus, the inferior frontal gyrus (IFG) (pars opercularis), the postcentral gyrus, the caudal middle frontal gyrus, and the superior frontal gyrus.
Significant rightward asymmetries were found in the medial orbitofrontal cortex (OFC), rostral middle frontal gyrus, the parahippocampal gyrus, the middle temporal gyrus, the IFG (pars orbitalis, pars triangularis), the caudal ACC, the inferior parietal lobule, the pericalcarine cortex, and the frontal pole.
Results of the cortical volumes and its LI are presented in Table 1 and Figure 1
Table 1.
Cortical volumes and laterality index (LI) for each brain region
| Region labels in freesurfer | Volume Mean R (mm3) | Std. dev. R | Volume Mean L (mm3) | Std. dev. L | Laterality index L > R | P LI |
|---|---|---|---|---|---|---|
| Rostral anterior cingulate cortex | 1,935 | 412 | 2,509 | 534 | 0.255 | 0.000 |
| Transverse temporal gyrus | 968 | 201 | 1,241 | 258 | 0.244 | 0.000 |
| Inferior frontal gyrus ‐ pars opercularis | 4,617 | 967 | 5,432 | 1,126 | 0.160 | 0.000 |
| Postcentral gyrus | 9,647 | 1,395 | 10,387 | 1,734 | 0.071 | 0.000 |
| Caudal middle frontal gyrus | 6,593 | 1,321 | 7,084 | 1,512 | 0.068 | 0.001 |
| Temporal pole | 2,002 | 389 | 2,129 | 436 | 0.060 | 0.017 |
| Isthmus of cingulate gyrus | 2,280 | 412 | 2,397 | 490 | 0.046 | 0.027 |
| Superior frontal gyrus | 22,305 | 3,094 | 23,281 | 3,261 | 0.042 | 0.000 |
| Paracentral lobule | 3,872 | 682 | 3,550 | 655 | 0.037 | 0.019 |
| Lateral occipital cortex | 11,613 | 1,875 | 12,040 | 1,974 | 0.035 | 0.014 |
| Supramarginal gyrus | 11,033 | 1,837 | 11,412 | 1,859 | 0.034 | 0.019 |
| Lateral orbitofrontal cortex | 7,502 | 907 | 7,683 | 975 | 0.023 | 0.009 |
| Inferior temporal gyrus | 10,826 | 2,100 | 10,998 | 1,803 | 0.020 | 0.212 |
| Entorhinal cortex | 1,832 | 463 | 1,856 | 447 | 0.013 | 0.582 |
| Fusiform gyrus | 9,423 | 1,687 | 9,511 | 1,592 | 0.010 | 0.510 |
| Precentral gyrus | 13,997 | 1,951 | 14,019 | 1,804 | 0.003 | 0.736 |
| Lingual gyrus | 6,453 | 930 | 6,495 | 1,168 | 0.000 | 0.994 |
| Superior parietal lobule | 13,499 | 1,821 | 13,418 | 1,626 | −0.004 | 0.665 |
| Insula | 6,496 | 726 | 6,456 | 655 | −0.005 | 0.257 |
| Precuneus | 9,511 | 1,329 | 9,421 | 1,268 | −0.009 | 0.325 |
| Superior temporal sulcus | 12,238 | 1,666 | 12,101 | 1,772 | −0.013 | 0.209 |
| Posterior cingulate cortex | 3,503 | 508 | 3,363 | 504 | −0.042 | 0.008 |
| Cuneus | 2,851 | 528 | 2,735 | 533 | −0.043 | 0.012 |
| Rostral middle frontal gyrus | 16,461 | 2,999 | 15,721 | 2,715 | −0.044 | 0.001 |
| Medial orbitofrontal cortex | 5,043 | 785 | 4,638 | 665 | −0.082 | 0.000 |
| Parahippocampal gyrus | 2,156 | 365 | 2,235 | 355 | −0.088 | 0.000 |
| Middle temporal gyrus | 13,503 | 1,983 | 11,957 | 2,001 | −0.124 | 0.000 |
| Inferior frontal gyrus ‐ pars triangularis | 4,617 | 996 | 4,004 | 778 | −0.136 | 0.000 |
| Caudal anterior cingulate cortex | 2,186 | 451 | 1,897 | 434 | −0.145 | 0.000 |
| Inferior parietal lobule | 16,664 | 2,334 | 14,005 | 1,844 | −0.172 | 0.000 |
| Pericalcarine cortex | 2,347 | 476 | 1,908 | 375 | −0.204 | 0.000 |
| Inferior frontal gyrus ‐ pars orbitalis | 2,746 | 512 | 2,213 | 460 | −0.216 | 0.000 |
| Frontal pole | 893 | 192 | 677 | 176 | −0.279 | 0.000 |
Figure 1.
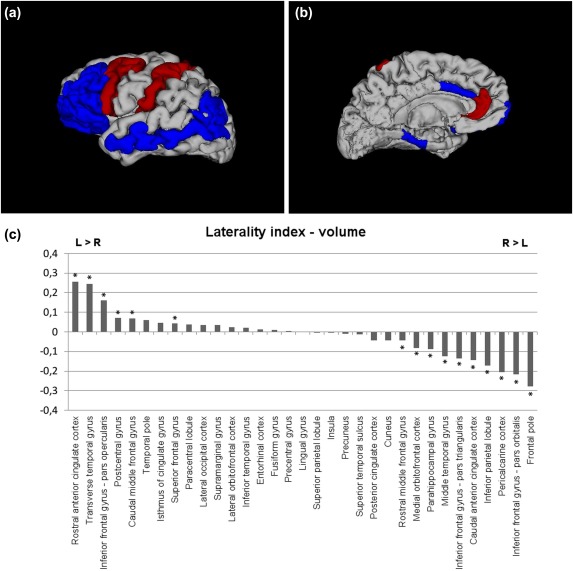
Brain regions of significantly positive Laterality Index (LI) (leftward asymmetry) or negative LI (rightward asymmetry) in cortical volume (Bonferroni‐corrected, P < 0.0015). 3D models generated with 3Dslicer (http://www.slicer.org/). Red color = brain regions showing significant leftward asymmetry; blue color = brain regions showing significant rightward asymmetry. The results are shown on the left hemisphere. (a) lateral, (b) medial view, and (c) LI for cortical volumes of each brain region is displayed by histogram. * indicates significant LI increase or decrease controlling for age and gender in region‐specific analyses (Bonferroni‐corrected, P < 0.0015).
Cortical Thickness
The regions with significant leftward asymmetries were the rostral ACC, the isthmus cinguli, and the caudal ACC.
Regions of significant rightward asymmetries were found in the transverse temporal gyrus, the IFG (pars opercularis, pars triangularis), the temporal pole, the lateral occipital cortex, the entorhinal cortex, the STS, and the middle temporal gyrus.
Results of the cortical thickness and its LI are presented in Table 2 and Figure 2
Table 2.
Cortical thickness and laterality index (LI) for each brain region
| Region labels in freesurfer | Thickness Mean R (mm) | Std. dev. R | Thickness Mean L (mm) | Std. dev. L | Laterality index L > R | P LI |
|---|---|---|---|---|---|---|
| Caudal anterior cingulate cortex | 2.67 | 0.24 | 2.82 | 0.25 | 0.056 | 0.000 |
| Isthmus of cingulate gyrus | 2.56 | 0.21 | 2.68 | 0.21 | 0.048 | 0.000 |
| Rostral anterior cingulate cortex | 3.03 | 0.25 | 3.11 | 0.21 | 0.027 | 0.000 |
| Frontal pole | 2.81 | 0.31 | 2.88 | 0.42 | 0.020 | 0.217 |
| Fusiform gyrus | 2.65 | 0.13 | 2.68 | 0.12 | 0.010 | 0.031 |
| Precentral gyrus | 2.62 | 0.13 | 2.64 | 0.12 | 0.007 | 0.071 |
| Inferior parietal lobule | 2.59 | 0.14 | 2.61 | 0.13 | 0.006 | 0.108 |
| Postcentral gyrus | 2.14 | 0.14 | 2.15 | 0.11 | 0.005 | 0.052 |
| Superior frontal gyrus | 2.93 | 0.13 | 2.94 | 0.13 | 0.005 | 0.368 |
| Posterior cingulate cortex | 2.63 | 0.16 | 2.64 | 0.16 | 0.004 | 0.479 |
| Paracentral lobule | 2.47 | 0.15 | 2.48 | 0.15 | 0.003 | 0.546 |
| Parahippocampal gyrus | 2.56 | 0.22 | 2.58 | 0.30 | 0.003 | 0.769 |
| Precuneus | 2.37 | 0.13 | 2.38 | 0.13 | 0.001 | 0.739 |
| Lateral orbitofrontal cortex | 2.68 | 0.14 | 2.68 | 0.13 | 0.000 | 0.985 |
| Medial orbitofrontal cortex | 2.71 | 0.16 | 2.71 | 0.16 | −0.001 | 0.895 |
| Pericalcarine cortex | 1.50 | 0.11 | 1.50 | 0.10 | −0.002 | 0.770 |
| Supramarginal gyrus | 2.64 | 0.15 | 2.64 | 0.13 | −0.002 | 0.586 |
| Lingual gyrus | 1.94 | 0.10 | 1.93 | 0.12 | −0.004 | 0.235 |
| Rostral middle frontal gyrus | 2.52 | 0.11 | 2.51 | 0.12 | −0.004 | 0.392 |
| Cuneus | 1.84 | 0.13 | 1.83 | 0.12 | −0.006 | 0.382 |
| Inferior temporal gyrus | 2.79 | 0.13 | 2.77 | 0.13 | −0.007 | 0.114 |
| Caudal middle frontal gyrus | 2.68 | 0.13 | 2.66 | 0.14 | −0.008 | 0.078 |
| Superior parietal lobule | 2.26 | 0.14 | 2.24 | 0.12 | −0.009 | 0.019 |
| Inferior frontal gyrus ‐ pars orbitalis | 2.79 | 0.19 | 2.76 | 0.21 | −0.012 | 0.124 |
| Inferior frontal gyrus ‐ pars triangularis | 2.67 | 0.16 | 2.62 | 0.17 | −0.019 | 0.001 |
| Insula | 3.14 | 0.16 | 3.08 | 0.23 | −0.022 | 0.022 |
| Inferior frontal gyrus ‐ pars opercularis | 2.74 | 0.16 | 2.67 | 0.15 | −0.023 | 0.000 |
| Lateral occipital cortex | 2.17 | 0.12 | 2.11 | 0.11 | −0.026 | 0.000 |
| Superior temporal sulcus | 2.92 | 0.15 | 2.84 | 0.17 | −0.027 | 0.000 |
| Middle temporal gyrus | 3.05 | 0.15 | 2.97 | 0.15 | −0.029 | 0.000 |
| Transverse temporal gyrus | 2.38 | 0.21 | 2.31 | 0.23 | −0.032 | 0.001 |
| Temporal pole | 3.75 | 0.39 | 3.53 | 0.40 | −0.062 | 0.000 |
| Entorhinal cortex | 3.33 | 0.34 | 3.12 | 0.31 | −0.064 | 0.000 |
Figure 2.
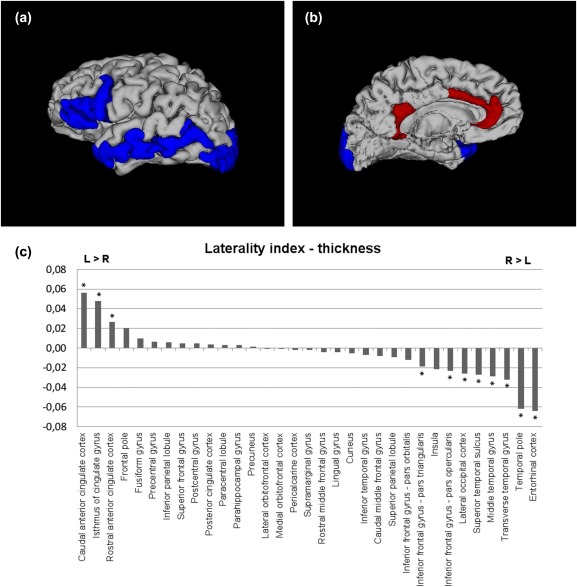
Brain regions of significantly positive LI (leftward asymmetry) or negative LI (rightward asymmetry) in cortical thickness (Bonferroni‐corrected, P < 0.0015). 3D models generated with 3Dslicer (http://www.slicer.org/). Red color = brain regions showing significant leftward asymmetry; blue color = brain regions showing significant rightward asymmetry. The results are shown on the left hemisphere. (a) lateral, (b) medial view, and (c) LI for cortical thickness of each brain region is displayed by histogram. * indicates significant LI increase or decrease controlling for age and gender in region‐specific analyses (Bonferroni‐corrected, P < 0.0015).
Surface Area
Regions with significant leftward asymmetries were identified in the transverse temporal gyrus, the rostral ACC, the IFG (pars opercularis), the postcentral gyrus, the caudal middle frontal gyrus, the temporal pole, the superior frontal gyrus, the lateral occipital cortex, and the entorhinal cortex.
Regions with significant rightward asymmetries were identified in the IFG (pars orbitalis, triangularis), the paracentral lobule, the medial OFC, the middle temporal gyrus, the caudal ACC, the inferior parietal lobule, the pericalcarine cortex, and the frontal pole.
Results of the surface and its LI are presented in Table 3 and Figure 3
Table 3.
Cortical surface area and laterality index (LI) for each brain region
| Region labels in freesurfer | Surface Mean R (mm2) | Std.dev. R | Surface Mean L (mm2) | Std.dev. L | Laterality index L > R | P LI |
|---|---|---|---|---|---|---|
| Transverse temporal gyrus | 354 | 65 | 479 | 93 | 0.298 | 0.000 |
| Rostral anterior cingulate cortex | 551 | 115 | 698 | 129 | 0.238 | 0.000 |
| Inferior frontal gyrus ‐ pars opercularis | 1,510 | 304 | 1,786 | 328 | 0,168 | 0.000 |
| Temporal pole | 359 | 61 | 399 | 62 | 0.108 | 0.000 |
| Entorhinal cortex | 379 | 87 | 419 | 97 | 0.097 | 0.000 |
| Caudal middle frontal gyrus | 2,193 | 410 | 2,414 | 480 | 0.093 | 0.000 |
| Postcentral gyrus | 3,986 | 508 | 4,240 | 595 | 0.060 | 0.000 |
| Lateral occipital cortex | 5,099 | 850 | 5,356 | 822 | 0.051 | 0.000 |
| Inferior temporal gyrus | 3,324 | 560 | 3,443 | 479 | 0.039 | 0.009 |
| Superior frontal gyrus | 6,736 | 875 | 7,006 | 932 | 0.039 | 0.000 |
| Supramarginal gyrus | 3,792 | 614 | 3,902 | 596 | 0.030 | 0.034 |
| Isthmus of cingulate gyrus | 797 | 141 | 818 | 149 | 0.025 | 0.148 |
| Parahippocampal gyrus | 735 | 105 | 754 | 110 | 0.025 | 0.123 |
| Superior parietal lobule | 5,268 | 725 | 5,340 | 584 | 0.017 | 0.092 |
| Superior temporal sulcus | 3,643 | 433 | 3,709 | 459 | 0.017 | 0.069 |
| Lateral orbitofrontal cortex | 2,617 | 290 | 2,629 | 296 | 0.004 | 0.606 |
| Insula | 2,096 | 470 | 2,080 | 180 | 0.003 | 0.769 |
| Lingual gyrus | 3,197 | 406 | 3,200 | 476 | −0.002 | 0.850 |
| Fusiform gyrus | 3,216 | 532 | 3,194 | 448 | −0.004 | 0.777 |
| Precentral gyrus | 4,867 | 643 | 4,808 | 606 | −0.011 | 0.247 |
| Precuneus | 3,833 | 502 | 3,733 | 450 | −0.025 | 0.003 |
| Cuneus | 1,454 | 251 | 1,417 | 244 | −0.027 | 0.094 |
| Rostral middle frontal gyrus | 5,714 | 989 | 5,514 | 919 | −0.034 | 0.007 |
| Posterior cingulate cortex | 1,218 | 169 | 1,165 | 160 | −0.044 | 0.004 |
| Medial orbitofrontal cortex | 1,646 | 232 | 1,524 | 205 | −0.076 | 0.000 |
| Middle temporal gyrus | 3,631 | 488 | 3,292 | 518 | −0.101 | 0.000 |
| Paracentral lobule | 1,437 | 206 | 1,284 | 195 | −0.113 | 0.000 |
| Inferior frontal gyrus ‐ pars triangularis | 1,524 | 297 | 1,340 | 228 | −0.122 | 0.000 |
| Caudal anterior cingulate cortex | 725 | 135 | 619 | 113 | −0.156 | 0.000 |
| Inferior parietal lobule | 5,725 | 807 | 4,791 | 615 | −0.175 | 0.000 |
| Pericalcarine cortex | 1,688 | 290 | 1,399 | 241 | −0.187 | 0.000 |
| Inferior frontal gyrus ‐ pars orbitalis | 795 | 132 | 628 | 129 | −0.238 | 0.000 |
| Frontal pole | 229 | 48 | 170 | 37 | −0.297 | 0.000 |
Figure 3.
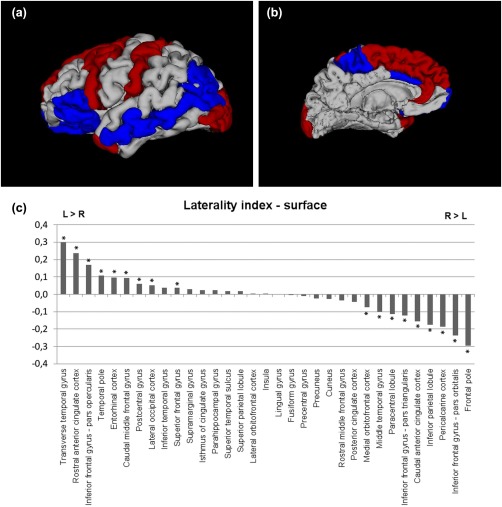
Brain regions of significantly positive LI (leftward asymmetry) or negative LI (rightward asymmetry) in cortical surface area (Bonferroni‐corrected, P < 0.0015). 3D models generated with 3Dslicer (http://www.slicer.org/). Red color = brain regions showing significant leftward asymmetry; blue color = brain regions showing significant rightward asymmetry. The results are shown on the left hemisphere. (a) lateral, (b) medial view, and (c) LI for surface area of each cortical region is displayed by histogram. * indicates significant LI increase or decrease controlling for age and gender in region‐specific analyses (Bonferroni‐corrected, P < 0.0015).
Effect of Gender and Age
For GM volume and GM thickness, there were no main effects of age, gender or interactions of region and age or region and gender.
For GM surface, a significant main effect of gender [F(1,98) = 5.14; P < 0.05] was found. Post hoc comparisons indicated a significantly stronger asymmetry [F(1,98)= 5.142; P < 0.05] of GM surface area to the right in males (mean = −0.01; SD: 0.02) than in females (mean = −0.005; SD: 0.02) over all regions.
There were no significant main effects of age or interaction effects of region × age or region × gender.
Correlational Analysis
In the correlational analysis between GM thickness and surface area, significant correlations have been confirmed in the following brain regions: the caudal ACC (r = 0.4), the isthmus cinguli (r = 0.24), and the lateral OFC (r = 0.32) showed positive correlations, while the fusiform gyrus (r = −0.22), the IFG (pars opercularis) (r = −0.27), the insula (r = −0.21), the medial OFC (r = −0.27), the parahippocampal gyrus (r = −0.31), the precentral gyrus (r = −0.30), the superior frontal gyrus (r = −0.25), the superior parietal lobule (r = −0.28), and the supramarginal gyrus (r = −0.22) showed negative correlations.
DISCUSSION AND CONCLUSION
The aim of our study was to determine cortical asymmetries in healthy volunteers with specific regard to subcomponents of GM volume, namely GM thickness and GM surface area. The study was conducted in a large sample of healthy volunteers, providing the necessary statistical power to detect the effects of interest, creating a detailed map of normal GM asymmetries. We also tested possible impact of age or gender on the LIs but overall lateralization patterns were found to be affected neither by gender nor by age.
With regard to GM volumes, our data, for the most part, agree with previous studies [e.g. Luders et al., 2004]. However, we found some exceptions. Tanaka et al. [2012] identified a trend for a greater rightward asymmetry of cortical GM volume for all brain regions. While in our analysis we found a leftward asymmetry for the rostral ACC and a rightward asymmetry for the caudal ACC, Paus et al. [1996] demonstrated a right larger than left asymmetry of the ACC using a voxel‐based approach. Contrary to our findings, Hammers et al. [2007], using manual region‐of‐interest analyses, noticed no lateralization of GM in the IFG, while we found parts of the IFG (pars orbitalis, pars triangularis) lateralized to the right and parts to the left (pars opercularis). Different findings might be due to differences of methodology or populations (Asian vs. Westerners) [Chee et al., 2011].
While there is sufficient data on asymmetries of GM volumes, only little data has been published on lateralization of cortical thickness and surface area. Regarding cortical thickness, our study showed regions of highly significant leftward cortical thickness asymmetries in the caudal ACC, the isthmus cinguli and the rostral ACC. These findings are in line with results of Wang et al. [2007], who found left larger than right asymmetry in thickness of the ACC in healthy volunteers. Kang et al. [2012] found in a study on GM thickness that the thickness of the temporal pole was larger in the right hemisphere than in the left, which corresponds to our own results. Moreover, in a study by Eckert et al. [2008], similar to our findings, significant leftward asymmetry of cortical thickness was demonstrated, although the study was conducted with children. In a study by Zhou et al. [2013], the authors found a rightward lateralization of the IFG and the occipital lobe that we could replicate. We could not replicate findings by Luders et al. [2006], however, who showed a greater leftward asymmetry in GM thickness in women, most prominently in the temporal and the frontal regions, using a cortical pattern matching system.
Regarding the GM surface area, widespread regions in the frontotemporal areas were found either with leftward or rightward asymmetry. While in general our data is in line with previous studies, it, unlike the data of Pujol et al. [2002a], does not suggest gender‐specific asymmetry toward the right ACC. Rather, our data suggests a subregion‐specific asymmetry pattern within the ACC, that is, the left rostral ACC exhibited a leftward and the caudal ACC a rightward asymmetry. ACC is the region where sulcogyral variations are the most prominent [Fornito et al., 2006], thus, the discrepancy among the asymmetry studies should be further investigated, applying multiple methodologies of surface area calculation and subregion definitions. Lyttelton et al. [2009] found leftward asymmetry in the supramarginal gyrus, which we observed as, although not significantly, lateralized to the left, a rightward asymmetry in the OFC, which we could replicate for the medial part, as well as an asymmetry in the temporal parts of the brain, excluding the inferior temporal gyrus. Finally, authors showed a rightward asymmetry for the parietal parts of the brain, which we could demonstrate for the inferior parietal lobules. A rightward asymmetry in the occipital lobes we could not replicate. While we found a significant leftward asymmetry of the postcentral gyrus, Hutsler et al. [1998] could not detect a lateralization of GM surface area in this region.
Most noticeable in our study are the differences in the overall asymmetry patterns between thickness and surface area (Figs. 2 and 3), which suggest that separate consideration of both aspects of cortical asymmetry is important [see e.g. Winkler et al., 2010]. A similar pattern of the contribution of GM thickness and surface area has previously been shown for the auditory‐related cortex, including the HG, the PT, and the superior temporal gyrus [Meyer et al., in press]. The lateralization pattern of the HG (transverse temporal gyrus) we found was basically consistent with Meyer et al.'s results. In addition, we were able to identify an even more complex nature of the relationship between GM thickness and surface area by expanding the analyses to the whole‐brain level.
As mentioned in the introduction, GM thickness mirrors the number of cells [Rakic, 1988], the density of neurons, the glia, as well as regional myelination [Paus et al., 1996; Sowell et al., 2004], while neuron density [Sisodiya et al., 1996; Sisodiya and Free, 1997] and/or number of columns [Glantz et al., 2006] most probably impacts on GM surface area. Our current results indicate differential contribution of these microscopic processes on different cortical areas, resulting in macroscopic levels of cortical asymmetry. Thus, for example, the thickness of the caudal ACC (as part of the cognitive division of the ACC) [Bush et al., 2000] is lateralized to the right side, while the surface area rostral ACC (as the affective division) is lateralized to the left side. While WM microstructure has been linked to cognitive functioning [Metzler‐Baddeley et al., 2012], it might also be assumed that not only the asymmetry of GM structures in itself but also their architectonical structure might play a role in development and functional specialization.
Our analyses revealed significant correlations between LI of GM thickness and that of surface area, and, intriguingly, the majority correlated negatively. As the lateralization pattern of GM thickness and surface area seems complex and region‐specific, it is, thus, difficult to identify a general principle. However, possible options to explain this differential asymmetrical pattern of GM thickness and surface area are the “tension‐based theory” [Van Essen, 1997] and the “balloon model” [Seldon, 2005]. According to these hypotheses, WM growth expands the cortex and causes the surface to fold, resulting in a larger surface area and reduced thickness. Regionally different patterns of thickness/surface ratios might thus arise from a variable growth of underlying WM.
Several limitations of the study need to be addressed. As IQ has been found to have an impact on GM asymmetries [Frangou et al., 2004; Narr et al., 2007], the comparably high mean IQ of the study group could have biased our results. However, IQ has been included as a covariate of no interest in our analyses, which showed no significant effect, a finding which has previously been reported by Yeo et al. [1987]. Also, we included only right‐handed subjects. Thus, the results are not applicable to left‐handed individuals.
In summary, we could show that widespread areas of the healthy brain are asymmetrical in their structure. We found different patterns of asymmetry between cortical thickness and surface area. This study not only contributes to the understanding of human brain asymmetry but also offers reference data in understanding the pathophysiology of some neuropsychiatric disorders, such as schizophrenia, in which abnormal brain asymmetry is considered to be a part of the pathogenesis.
REFERENCES
- Bilder RM, Wu H, Bogerts B, Degreef G, Ashtari M, Alvir JM, Snyder PJ, Lieberman JA (1994): Absence of regional hemispheric volume asymmetries in first‐episode schizophrenia. Am J Psychiatry 151:1437–1447. [DOI] [PubMed] [Google Scholar]
- Blackmon K, Barr WB, Kuzniecky R, Dubois J, Carlson C, Quinn BT, Blumberg M, Halgren E, Hagler DJ, Mikhly M, Devinsky O, McDonald CR, Dale AM, Thesen T (2010): Phonetically irregular word pronunciation and cortical thickness in the adult brain. Neuroimage 51(4):1453–1458. [DOI] [PMC free article] [PubMed] [Google Scholar]
- Bush G, Luu P, Posner MI (2000): Cognitive and emotional influences in anterior cingulate cortex. Trends Cogn Sci 4:215–222. [DOI] [PubMed] [Google Scholar]
- Campain R, Minkler J (1976): A note on the gross configurations of the human auditory cortex. Brain Lang 3:318–323. [DOI] [PubMed] [Google Scholar]
- Chee MW, Zheng H, Goh JO, Park D, Sutton BP (2011): Brain structure in young and old East Asians and Westerners: comparisons of structural volume and cortical thickness. J Cogn Neurosci 23:1065–1079. [DOI] [PMC free article] [PubMed] [Google Scholar]
- Crespo‐Facorro B, Roiz‐Santianez R, Perez‐Iglesias R, Mata I, Rodriguez‐Sanchez JM, Tordesillas‐Gutierrez D, Ortiz‐Garcia de la Foz V, Tabares‐Seisdedos R, Sanchez E, Andreasen N, Magnotta V, Vazquez‐Barquero JL (2011): Sex‐specific variation of MRI‐based cortical morphometry in adult healthy volunteers: the effect on cognitive functioning. Prog Neuropsychopharmacol Biol Psychiatry 35:616–623. [DOI] [PMC free article] [PubMed] [Google Scholar]
- Crow TJ (1998): Schizophrenia as a transcallosal misconnection syndrome. Schizophr Res 30:111–114. [DOI] [PubMed] [Google Scholar]
- Cykowski MD, Coulon O, Kochunov PV, Amunts K, Lancaster JL, Laird AR, Glahn DC, Fox PT (2008): The central sulcus: an observer‐independent characterization of sulcal landmarks and depth asymmetry. Cereb Cortex 18:1999–2009. [DOI] [PMC free article] [PubMed] [Google Scholar]
- Cykowski MD, Kochunov PV, Ingham RJ, Ingham JC, Mangin JF, Rivière D, Lancaster JL, Fox PT (2008): Perisylvian sulcal morphology and cerebral asymmetry patterns in adults who stutter. Cereb Cortex 18(3):571–583. [DOI] [PubMed] [Google Scholar]
- Dale AM, Fischl B, Sereno MI (1999): Cortical surface‐based analysis. I. Segmentation and surface reconstruction. Neuroimage 9:179–194. [DOI] [PubMed] [Google Scholar]
- Desikan RS, Segonne F, Fischl B, Quinn BT, Dickerson BC, Blacker D, Buckner RL, Dale AM, Maguire RP, Hyman BT, Albert MS, Killiany RJ (2006): An automated labeling system for subdividing the human cerebral cortex on MRI scans into gyral based regions of interest. Neuroimage 31:968–980. [DOI] [PubMed] [Google Scholar]
- Deutsch D (1985): Dichotic listening to melodic patterns and its relation to hemispheric specialization of functions. Music Perception 3:127–154. [Google Scholar]
- Dos Santos Sequeira S, Woerner W, Walter C, Kreuder F, Lueken U, Westerhausen R, Wittling RA, Schweiger E, Wittling W (2006): Handedness, dichotic‐listening ear advantage, and gender effects on planum temporale asymmetry‐a volumetric investigation using structural magnetic resonance imaging. Neuropsychologia 44(4):622–636. [DOI] [PubMed] [Google Scholar]
- Ecker C, Ginestet C, Feng Y, Johnston P, Lombardo MV, Lai MC, Suckling J, Palaniyappan L, Daly E, Murphy CM, Williams SC, Bullmore ET, Baron‐Cohen S, Brammer M, Murphy DG, MRC AIMS Consortium (2013): Brain surface anatomy in adults with autism: the relationship between surface area, cortical thickness, and autistic symptoms. JAMA Psychiatry 70:59–70. [DOI] [PubMed] [Google Scholar]
- Eckert MA, Leonard CM, Possing ET, Binder JR (2006): Uncoupled leftward asymmetries for planum morphology and functional language processing. Brain Lang 98(1):102–111. [DOI] [PMC free article] [PubMed] [Google Scholar]
- Eckert MA, Lombardino LJ, Walczak AR, Bonihla L, Leonard CM, Binder JR (2008): Manual and automated measures of superior temporal gyrus asymmetry: concordant structural predictors of verbal ability in children. Neuroimage 41:813–822. [DOI] [PMC free article] [PubMed] [Google Scholar]
- First MB, Spitzer RL, Gibbon M, Williams JBW (2002): Structured Clinical Interview for DSM‐IV‐TR Axis I Disorders, Research Version, Non‐patient Edition (SCID‐I/NP). New York: Biometrics Research, New York State Psychiatric Institute. [Google Scholar]
- Fischl B, Sereno MI, Dale AM (1999): Cortical surface‐based analysis. II: inflation, flattening, and a surface‐based coordinate system. Neuroimage 9:195–207. [DOI] [PubMed] [Google Scholar]
- Fornito A, Whittle S, Wood SJ, Velakoulis D, Pantelis C, Yucel M (2006): The influence of sulcal variability on morphometry of the human anterior cingulate and paracingulate cortex. Neuroimage 33:843–854. [DOI] [PubMed] [Google Scholar]
- Fornito A, Yucel M, Wood S, Stuart GW, Buchanan JA, Proffitt T, Anderson V, Velakoulis D, Pantelis C (2004): Individual differences in anterior cingulate/paracingulate morphology are related to executive functions in healthy males. Cereb Cortex 14(4):424–431. [DOI] [PubMed] [Google Scholar]
- Frangou S, Chitins X, Williams SC (2004): Mapping IQ and gray matter density in healthy young people. Neuroimage 23:800–805. [DOI] [PubMed] [Google Scholar]
- Geschwind N, Lewitsky W (1968): Human Brain: left‐right asymmetries in temporal speech region. Science 161:186–187. [DOI] [PubMed] [Google Scholar]
- Glantz LA, Gilmore JH, Lieberman JA, Jarskog LF (2006): Apoptotic mechanisms and the synaptic pathology of schizophrenia. Schizophr Res 81:47–63. [DOI] [PubMed] [Google Scholar]
- Goldberg E, Roediger D, Kucukboyaci NE, Carlson C, Devinsky O, Kuzniecky R, Halgren E, Thesen T (2011): Hemispheric asymmetries of cortical volume in the human brain. Cortex 49(1):200–210. [DOI] [PubMed] [Google Scholar]
- Good CD, Johnsrude I, Ashburner J, Henson RN, Friston KJ, Frackowiak RS (2001): Cerebral asymmetry and the effects of sex and handedness on brain structure: a voxel‐based morphometric analysis of 465 normal adult human brains. Neuroimage 14:685–700. [DOI] [PubMed] [Google Scholar]
- Greve DN, Van der Haegen L, Cai Q, Stufflebeam S, Sabuncu MR, Fischl B, Brysbaert M (2013): A surface‐based analysis of language lateralization and cortical asymmetry. J Cogn Neurosci 25:1477–1492. [DOI] [PMC free article] [PubMed] [Google Scholar]
- Hammers A, Chen CH, Lemieux L, Allom R, Vossos S, Free SL, Myers R, Brooks DJ, Duncan JS, Koepp MJ (2007): Statistical neuroanatomy of the human inferior frontal gyrus and probabilistic atlas in a standard stereotaxic space. Hum Brain Mapp 28:34–48. [DOI] [PMC free article] [PubMed] [Google Scholar]
- Hutsler J, Galuske RA (2003): Hemispheric asymmetries in cerebral cortical networks. Trends Neurosci 26:429–435. [DOI] [PubMed] [Google Scholar]
- Hutsler JJ, Loftus WC, Gazzaniga MS (1998): Individual variation of cortical surface area asymmetries. Cereb Cortex 8:11–17. [DOI] [PubMed] [Google Scholar]
- Im K, Lee JM, Lyttelton O, Kim SH, Evans AC, Kim SI (2008): Brain size and cortical structure in the adult human brain. Cereb Cortex 18:2181–2191. [DOI] [PubMed] [Google Scholar]
- Kang X, Herron TJ, Cate AD, Yund EW, Woods DL (2012): Hemispherically‐unified surface maps of human cerebral cortex: reliability and hemispheric asymmetries. PLoS One 7:e45582. [DOI] [PMC free article] [PubMed] [Google Scholar]
- Kovalev VA, Kruggel F, von Cramon DY (2003): Gender and age effects in structural brain asymmetry as measured by MRI texture analysis. Neuroimage 19(3):895–905. [DOI] [PubMed] [Google Scholar]
- LeMay M (1976): Morphological cerebral asymmetries of modern man, fossil man, and nonhuman primate. Ann NY Acad Sci 280:349–366. [DOI] [PubMed] [Google Scholar]
- Luders E, Gaser C, Jancke L, Schlaug G (2004): A voxel‐based approach to gray matter asymmetries. Neuroimage 22:656–664. [DOI] [PubMed] [Google Scholar]
- Luders E, Narr KL, Thompson PM, Rex DE, Jancke L, Toga AW (2006): Hemispheric asymmetries in cortical thickness. Cereb Cortex 16:1232–1238. [DOI] [PubMed] [Google Scholar]
- Lyttelton OC, Karama S, Ad‐Dab'bagh Y, Zatorre RJ, Carbonell F, Worsley K, Evans AC (2009): Positional and surface area asymmetry of the human cerebral cortex. Neuroimage 46:895–903. [DOI] [PubMed] [Google Scholar]
- Metzler‐Baddeley C, Jones DK, Steventon J, Westacott L, Aggleton JP, O'Sullivan MJ (2012): Cingulum microstructure predicts cognitive control in older age and mild cognitive impairment. J Neurosci 32:17612–17619. [DOI] [PMC free article] [PubMed] [Google Scholar]
- Meyer M, Liem F, Hirsiger S, Jancke L, Hanggi J: Cortical surface area and cortical thickness demonstrate differential structural asymmetry in auditory‐related areas of the human cortex. [Epub ahead of print]. [DOI] [PubMed]
- Mountcastle VB (1997): The columnar organization of the neocortex. Brain 120:701–722. [DOI] [PubMed] [Google Scholar]
- Narr KL, Woods RP, Thompson PM, Szeszko P, Robinson D, Dimtcheva T, Gurbani M, Toga AW, Bilder RM (2007): Relationships between IQ and regional cortical gray matter thickness in healthy adults. Cereb Cortex 17:2163–2171. [DOI] [PubMed] [Google Scholar]
- Oertel‐Knochel V, Knochel C, Matura S, Prvulovic D, Linden DE, van de Ven V (2013): Reduced functional connectivity and asymmetry of the planum temporale in patients with schizophrenia and first‐degree relatives. Schizophr Res 147(2–3):331–338. [DOI] [PubMed] [Google Scholar]
- Oldfield RC (1971): The assessment and analysis of handedness: the Edinburgh inventory. Neuropsychologia 9:97–113. [DOI] [PubMed] [Google Scholar]
- Panizzon MS, Fennema‐Notestine C, Eyler LT, Jernigan TL, Prom‐Wormley E, Neale M, Jacobson K, Lyons MJ, Grant MD, Franz CE, Xian H, Tsuang M, Fischl B, Seidman L, Dale A, Kremen WS (2009): Distinct genetic influences on cortical surface area and cortical thickness. Cereb Cortex 19(11):2728–2735. [DOI] [PMC free article] [PubMed] [Google Scholar]
- Paus T, Otaky N, Caramanos Z, MacDonald D, Zijdenbos A, D'Avirro D, Gutmans D, Holmes C, Tomaiuolo F, Evans AC (1996): In vivo morphometry of the intrasulcal gray matter in the human cingulate, paracingulate, and superior‐rostral sulci: hemispheric asymmetries, gender differences and probability maps. J Comp Neurol 376:664–673. [DOI] [PubMed] [Google Scholar]
- Penhune VB, Zatorre RJ, MacDonald JD, Evans AC (1996): Interhemispheric anatomical differences in human primary auditory cortex: probabilistic mapping and volume measurement from magnetic resonance scans. Cereb Cortex 6:661–672. [DOI] [PubMed] [Google Scholar]
- Pujol J, Lopez A, Deus J, Cardoner N, Vallejo J, Capdevila A, Paus T (2002a): Anatomical variability of the anterior cingulate gyrus and basic dimensions of human personality. Neuroimage 15:847–855. [DOI] [PubMed] [Google Scholar]
- Pujol J, Lopez‐Sala A, Deus J, Cardoner N, Sebastian‐Galles N, Conesa G, Capdevila A (2002b): The lateral asymmetry of the human brain studied by volumetric magnetic resonance imaging. Neuroimage 17:670–679. [PubMed] [Google Scholar]
- Rakic P (1988): Specification of cerebral cortical areas. Science 241:170–176. [DOI] [PubMed] [Google Scholar]
- Seldon HL (2005): Does brain white matter growth expand the cortex like a balloon? Hypothesis and consequences. Laterality 10(1):81–95. [DOI] [PubMed] [Google Scholar]
- Sisodiya S, Free S, Fish D, Shorvon S (1996): MRI‐based surface area estimates in the normal adult human brain: evidence for structural organisation. J Anat 188:425–438. [PMC free article] [PubMed] [Google Scholar]
- Sisodiya SM, Free SL (1997): Disproportion of cerebral surface areas and volumes in cerebral dysgenesis. MRI‐based evidence for connectional abnormalities. Brain 120:271–281. [DOI] [PubMed] [Google Scholar]
- Sowell ER, Thompson PM, Leonard CM, Welcome SE, Kan E, Toga AW (2004): Longitudinal mapping of cortical thickness and brain growth in normal children. J Neurosci 24:8223–8231. [DOI] [PMC free article] [PubMed] [Google Scholar]
- Tanaka C, Matsui M, Uematsu A, Noguchi K, Miyawaki T (2012): Developmental trajectories of the fronto‐temporal lobes from infancy to early adulthood in healthy individuals. Dev Neurosci 34:477–487. [DOI] [PubMed] [Google Scholar]
- Toga AW, Thompson PM (2003): Mapping brain asymmetry. Nat Rev Neurosci 4:37–48. [DOI] [PubMed] [Google Scholar]
- Uylings HB, Jacobsen AM, Zilles K, Amunts K (2006): Left‐right asymmetry in volume and number of neurons in adult Broca's area. Cortex 42(4):652–658. [DOI] [PubMed] [Google Scholar]
- Van Essen DC (1997): A tension‐based theory of morphogenesis and compact wiring in the central nervous system. Nature 385(6614):313–318. [DOI] [PubMed] [Google Scholar]
- Wang L, Hosakere M, Trein JC, Miller A, Ratnanather JT, Barch DM, Thompson PA, Qiu A, Gado MH, Miller MI, Csernansky JG (2007): Abnormalities of cingulate gyrus neuroanatomy in schizophrenia. Schizophr Res 93:66–78. [DOI] [PMC free article] [PubMed] [Google Scholar]
- Wechsler D. 1981. Manual for the Wechsler Adult Intelligence Scale‐Revised. New York: Psychological Corporation. [Google Scholar]
- Winkler AM, Kochunov P, Blangero J, Almasy L, Zilles K, Fox PT, Duggirala R, Glahn DC (2010): Cortical thickness or grey matter volume? The importance of selecting the phenotype for imaging genetics studies. Neuroimage 53(3):1135–1146. [DOI] [PMC free article] [PubMed] [Google Scholar]
- Yeo RA, Turkheimer E, Raz N, Bigler ED (1987): Volumetric asymmetries of the human brain: intellectual correlates. Brain Cogn 6:15–23. [DOI] [PubMed] [Google Scholar]
- Zhou D, Lebel C, Evans A, Beaulieu C (2013): Cortical thickness asymmetry from childhood to older adulthood. Neuroimage 83C:66–74. [DOI] [PubMed] [Google Scholar]