

Abstract
Brain functional and cytoarchitectural maturation continue until adulthood, but little is known about the evolution of the regional pattern of cortical thickness (CT), complexity (CC), and intensity or gradient (CG) in young adults. We attempted to detect global and regional age‐ and gender‐related variations of brain CT, CC, and CG, in 28 healthy young adults (19–33 years) using a three‐dimensional T 1‐weighted magnetic resonance imaging sequence and surface‐based methods. Whole brain interindividual variations of CT and CG were similar to that in the literature. As a new finding, age‐ and gender‐related variations significantly affected brain complexity (P < 0.01) on posterior cingulate and middle temporal cortices (age), and the fronto‐orbital cortex (gender), all in the right hemisphere. Regions of interest analyses showed age and gender significant interaction (P < 0.05) on the temporopolar, inferior, and middle temporal‐entorrhinal cortices bilaterally, as well as left inferior parietal. In addition, we found significant inverse correlations between CT and CC and between CT and CG over the whole brain and markedly in precentral and occipital areas. Our findings differ in details from previous reports and may correlate with late brain maturation and learning plasticity in young adults' brain in the third decade. Hum Brain Mapp 35:2817–2835, 2014. © 2013 Wiley Periodicals, Inc.
Keywords: age differences, gender differences, cortical thickness, gyrification, magnetic resonance imaging, surface‐based method
INTRODUCTION
In the recent years, magnetic resonance imaging (MRI) three‐dimensional (3D) acquisition of the brain volume in vivo has allowed automatic segmentation of brain cortical and subcortical structures, using specific post‐processing methods and software, which become more and more sophisticated [Clarkson et al., 2011; Dale et al., 1999; Fischl, 2012; Fischl et al., 1999; Gronenschild et al., 2012; Kabani et al., 2001; Lerch and Evans, 2005; MacDonald et al., 1999; Van Essen et al., 1997]. The cortex has a complex geometry of a highly folded layer with spatially varying curvature and thickness. The cortical layer on a brain hemisphere can be represented as the inner space between: (i) an inner surface at the white matter (WM)/gray matter (GM) junction, and (ii) an outer or pial surface at the GM/CSF (cerebrospinal fluid) interface. Defining, with some simplification, each surface unit of the brain cortex as topologically equivalent to a 3D sphere helps in assessing its thickness (CT), folding pattern or complexity (CC), and the mean variation of MR signal intensity within the cortical ribbon and at its borders (reflecting the WM/GM transition) that we call gradient (CG) [Fischl, 2012].
Previous studies have shown that various factors may influence CT, gyrification or CC, and GM/WM signal intensity in normal human brains: age, gender, genetics, and epigenetics. These variations reflect brain development and maturation from new‐borns to late childhood and adolescence and, to some extent, aging‐related changes in older [Gogtay et al., 2004; Lemaitre et al., 2012; McGinnis et al., 2011; Shaw et al., 2006; Sowell et al., 2007; Westlye et al., 2010]. After a continued growth, up to the first decade, the global brain cortical CT declines during life span [Fjell et al., 2009; McGinnis et al., 2011; Magnotta et al., 1999; Raznahan et al., 2011; Salat et al., 2009; Tamnes et al., 2010]. This trajectory varies depending on the age group and the brain regions. As reported in quite all studies CT declines first and stabilizes between 20 and 40 years. However, CT has been reported to increase in rostral middle frontal and temporal regions in young adults [Salat et al., 2009; Sowell et al., 2007]. CT is described as thicker in women, mostly in frontal and parietal lobes [Im et al., 2006a; Luders and Toga, 2010; Lv et al., 2010; Sowell et al., 2007].
The gyral pattern is determined by the degree of sulcation during brain development and has been assessed using different calculation methods such as: fractal dimension, gyrification index (GI), and CC [Mustafa et al., 2012; Raznahan et al., 2011; Zilles et al., 1997]. CC increases in the early life, with regional differences in a caudo‐rostral gradient, and then undergoes a progressive decrease [Blanton et al., 2001; Magnotta et al., 1999; Zilles et al., 1988]. As reported, CC is greater in women frontal and parietal lobes [Awate et al., 2009, 2010; Luders et al., 2004, 2006,b, 2008; Nopoulos et al., 2000; Zilles et al., 1988].
The MR signal intensity of the cortex and subjacent areas also change over life as reflecting brain maturation as well as brain iron load. According to the literature, intracortical T 1 signals show an inverted U pattern with a peak between 8 and approximately 30 years of age, following a posterior anterior gradient [Salat et al., 2009; Westlyes et al., 2010]. Analyses of intracortical relaxation rate of T2* ( ) showed a similar pattern [Westlyes et al., 2010]. No significant gender effect on CG was found [Blackmon et al., 2011; Salat et al., 2009; Westlyes et al., 2010].
In studies mentioned above, results regarding young adults were not analyzed separately and, sometimes young adults were mixed with other age groups (younger or older). Therefore, the variations observed could not be applied specifically to individuals in the third decade. We wondered whether global and regional changes within the cortex in that period of late brain development and maturation could be demonstrated using surface‐based cortical analyses. In this study, we aimed at assessing cortical CT, CC, and CG age‐ and gender‐related variations over the entire brain and in specific regions of interest (ROIs) as well as correlations between these three parameters.
MATERIALS AND METHODS
Participants
Participants were recruited among students of our university and written informed consent was obtained from all. At the time of participation, subjects had no self or parent‐reported clinical history of mild cognitive impairment, dementia, general neurological or psychiatric illness, or general medical illness with potential impact upon cognitive status. They were all right‐handed, as reported in a structured interview, and known to speak French fluently (mother tongue), to have normal or corrected‐to‐normal hearing and vision, and to have no MRI contraindication. Images were obtained in 28 subjects aged 19.80 through 33.01 years (mean: 25.52; sd = 3.64). There were 16 males ranged from 19.8 through 33.01 years (mean: 26.23; sd = 4.27) and 12 females ranged from 22.32 to 30.78 years (mean: 24.57; sd = 2.44) (Table 1). No difference was found between both groups in age distribution (P = 0.397). All participants were in the first through third year of the school of Physiotherapy, having at least a high school education level and a minimum of 2 h physical training (fitness) a week. Their individual hobbies were not recorded.
Table 1.
Subjects' characteristics (N = 28)
| Total (n=28) | age range: 19‐33 years mean age: 25,5 years (sd=3,65) |
| Males (n=16) | mean age: 26,23 (sd=4,27) |
| Females (n=12) | mean age: 24,57 (sd=2,44) |
| ICV (n=28) | mean 1521779,93 mm3 (sd=195429, 37) |
| GMV (n=28) | mean 497731,84 mm3 (sd=49734,73) |
| WMV (n=28) | mean 497382, 97 mm3 (sd=64577,56) |
ICV: intracranial volume; GMV: gray matter volume; WMV: white matter volume. sd: standard deviation.
MR Acquisition
Sagittal 3D MR images were acquired on a 3T scanner (Achieva Philips, Best, The Netherlands) using a T 1‐fast field echo sequence (TR = 9.7 ms, TE = 4.6 ms, flip angle = 8°, matrix size = 256 × 256, FOV = 256 × 256), covering the entire brain with an isotropic voxel size of 1 mm3. All images underwent automated correction for intensity non‐uniformity and intensity standardization, automatic registration in a stereotactic space [MNI‐Collins et al., 1994] and were automatically skull stripped. The MRI scans were read out by two experienced neuroradiologists and reported upon a consensus as normal and free of artifacts that could partly or totally impair the segmentation.
Post‐Processing
Segmentation of the cortex was performed using FreeSurfer (FS) software version 5.0 (http://freesurfer.nmr.mgh.harvard.edu). Both hemispheres were separated and processed individually. We applied a mask on the diencephalon. An algorithmic procedure based on the geometric structure of gray white matter (GWM) interface that separate the outer or pial cortical surface from the inner cortical or WM surface was applied [Dale et al., 1999; Fischl et al., 1999]. Inner and outer surfaces were remodeled by a triangle‐based mesh and undergo a spherical inflation and a topological correction. An automated algorithm then parceled the surface in 33 gyrally‐based ROI [Desikan et al., 2006]. The total intracranial volume (ICV), the GM volume (GMV), and the WM volume (WMV) were extracted from the FS statistical output file.
CT measurements
They were obtained by reconstructing representations of the GM‐WM boundary and the pial surface and then calculating the distance between those surfaces using the t‐link method, defined as the Euclidean distance between linked vertices on the WM surface and pial surface [Fischl, 2012; Kabani et al., 2001; Lerch and Evans, 2005]. Procedures for the measurements of CT have been previously validated against histological analysis [Rosas et al., 2002] and manual measurements [Fischl et al., 2004]. GM‐WM boundary and cortical pial surface parcellations were verified by overlaying the boundaries on the 3DT 1 images on the three planes order to avoid or correct segmentation errors. Blurring of the features was applied using a 20 mm full width half max Gaussian surface kernel to minimize noise and increase statistical performance.
CC measurements
CC was estimated through the surface ratio SRx,r [Toro et al., 2008]. For every point (x) on the cortical surface, the area (Cx,r) contained in a small sphere of a given radius (r) centered at x, Sx,r was measured. Considering a lissencephalic area (no gyrus), the area inside the sphere of radius SRx,r would be approximately that of the disc Dr = πr2. The CC was estimated by the surface ratio SRx,r = Cx,r/Dr. We used r = 20 mm.
CG measurements
The blurred WM/GM interface was modeled with Sobel operator [Besson et al., 2008]. The operator calculates the gradient of the image intensity at each point, giving the direction of the largest possible increase from light to dark and the rate of change in that direction. The result, therefore, shows how “abruptly” or “smoothly” the intensity changes at that point. The gradient magnitude was interpolated at each vertex of the inner cortical surface to obtain the gradient surface map.
ROIs analyses
The ROIs were anatomically designed following the Desikan‐Killiany atlas [Desikan et al., 2006]. ROIs were chosen from previous studies findings as well as from our findings after the visual assessment of surface maps from whole brain analyses. Eight ROIs were automatically parceled as labeled: c1 = precentral, c2 = postcentral, t1 = superior temporal, t2 = temporopolar, inferior and middle temporal + entorrhinal, o1 = lateral occipital, o2 = lingual + pericalcarin + cuneus, p1 = inferior parietal, p2 = superior parietal, both for the right (rh) and left (lh) hemispheres.
Statistical Analyses
Statistical analyses were performed using Keith Worsley's SurfStat toolbox for MATLAB (http://www.math.mcgill.ca/keith/surfstat/), a MATLAB (7.10. 0 (R2010a)) toolbox. First, we conducted the cortical surface analyses. Global average CT, CC, and CG, as well as corresponding standard deviation (std) and auto z‐scores (differences between each surface unit and the average on the template) of the whole brain of all participants were mapped on the brain surface as template. The same analyses were performed assessing age‐ and gender‐related differences. T‐ and P‐values were mapped on the brain surface using a false discovery rate [FDR; Benjamini and Hochberg, 1995] correction (with significance at 0.05). A general linear model (GLM) was then applied to test age and gender effects on CC, CT, and CG. Because men as a group had a larger ICV than women, we used ICV as a covariate in that model. Consequently, for age effect the GLM model (M) was M = 1 + age + ICV and for gender effect, M = 1 + sex + ICV. To assess the gender effect on age‐related differences, the interaction term between age and sex was also included in the model: M = 1 + age + sex + age × sex + ICV.
Linear regressions were used to assess age and gender effects on CT, CC, and CG in each ROI. The effects of ICV, CV, and WMV for each ROI were also assessed. In addition, one‐way Manova (simple gender effect) and Mancova (gender effect with age as cofactor) were applied to assess intrasubject as well as between subjects effects using SPSS 20 (Statistical Package for the Social Sciences). The multivariate probability distributions were then assessed using the Hotelling's T‐squared test (Hotelling's Trace). We applied the FDR method to test for multiple comparisons. The results were rendered as graphs and P‐values in a table. Looking for the laterality effect, interhemispheric differences for CT, CC, and CG were analyzed using ANOVAs and represented as box plots for each label. CT/CC, CT/CG, and CC/CG correlations over the whole brain and in each ROI were assessed using linear regression analyses.
RESULTS
Whole Brain Analyses
Averaged CT, CC, and CG
In evaluating the common surface variations (within the template, average of the whole group) using auto z‐scores, we found the thickest cortex (zs > 2) in temporal poles, entorrhinal, and inferior frontal regions bilaterally, and the lowest in the precentral gyrus (zs < −2). CC was the highest (zs > 2) in calcarin, parieto‐occipital, and superior temporal sulci, and the lowest (zs < −2) in anterior cingulate and medial orbital frontal, bilaterally (Fig. 1A). The lowest CG (zs < −3) was found in temporal poles, temporal superior, entorrhinal and parahippocampal, inferior frontal, and precentral, bilaterally.
Figure 1.
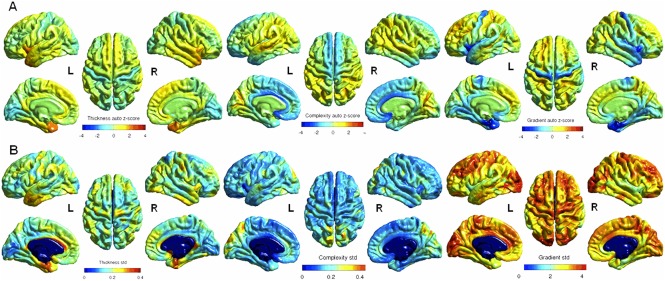
A. Auto‐z‐score maps on average CT, CC, and CG showing intraindividual variability. B. Standard deviation maps showing interindividual variability (The medial wall including the corpus callosum is excluded). (Left to right panel: CT, CC, and CG. Midsagittal, lateral and superior views are represented). L = left; R = right.
In assessing interindividual variations using standard deviations mapped on the common surface, we found the highest variability for CT (std > 0.3) in entorrhinal and parahippocampal cortices bilaterally, and the left cingulate gyrus, for CC (std > 0.3) in the precuneus, cuneus and superior parietal gyri, bilaterally, and for CG (std > 4) in the left superior and middle frontal, right paramedian precentral, left anterior cingulated, and occipital lobes (Fig. 1B).
Age effect
Age‐related variations corresponded to decreased CT (T < −2) in posterior cingulated, inferior and superior frontal, on the right and, postcentral, paracentral, and cingulate, on the left, while increased (T > 3) in right superior frontal and left postcentral (Fig. 2, upper row). CC was decreased (T < −2) in right superior parietal, left paracentral, and bilateral superior frontal sulci, while increased (T > 4) in right middle temporal, right posterior cingulate, and left lingual (Fig. 2, middle row). CG was decreased (T < −3) in lateral occipital, fusiform gyrus, and superior parietal, on the right and, lingual, anterior cingulated, on the left and, frontal superior bilaterally, whereas increased (T > 2) in the left inferior temporal gyrus (Fig. 2, lower row). Using the FDR method to extract significant T‐values (P‐values mapped on the cortical surface), we found significant age‐related changes as increased CC in the right posterior cingulate and middle temporal (P cluster < 0.01) (Fig. 3).
Figure 2.
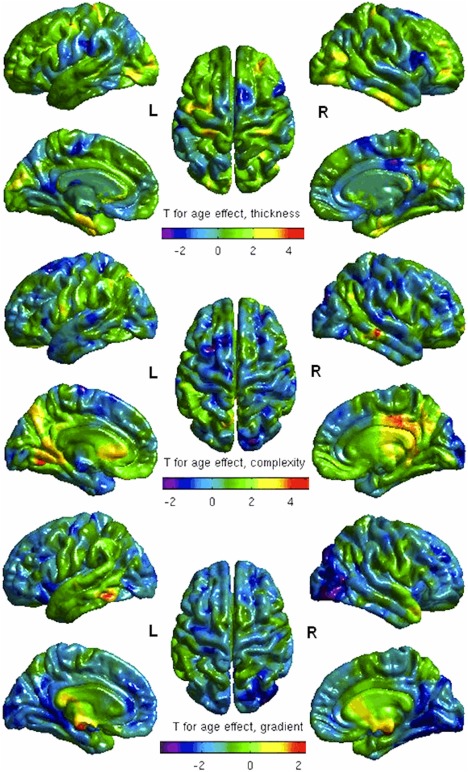
Age effect on CT, CC, and CG—covarying for ICV. Red clusters correspond to increased CT, CC, or CG, blue clusters correspond to decreased CT, CC, or CG with age. L = left; R = right.
Figure 3.
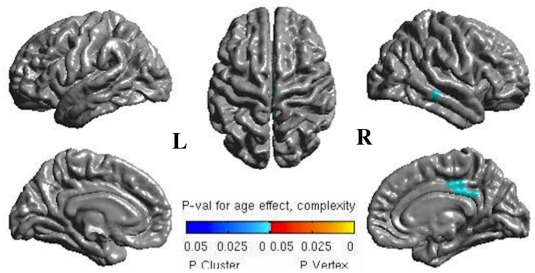
Surface mapping of P‐values after the FDR correction showing significant blue clusters of increased complexity with age in the right posterior cingulate and middle temporal cortices. L = left; R = right.
Gender effect
Common surface variations of men and women group were similar. Gender‐related variations corresponded to increased CT in men in right postcentral and superior parietal gyri and in women in left superior temporal sulci and right anterior cingulate (T > 4) (Fig. 4, upper row). CC was higher in men in left superior frontal and right medial orbitofrontal (T > 4) whereas higher in women in right superior parietal gyrus (T > 3) (Fig. 4, middle row). Men had higher CG in right precentral gyrus whereas women had higher CG in left inferior parietal (T > 2) (Fig. 4, lower row). Using the FDR method with significant P‐values mapped on the cortical surface, we found significant gender‐related changes as increased CC in the right medial fronto‐orbital cortex (P cluster < 0.01) (Fig. 5).
Figure 4.
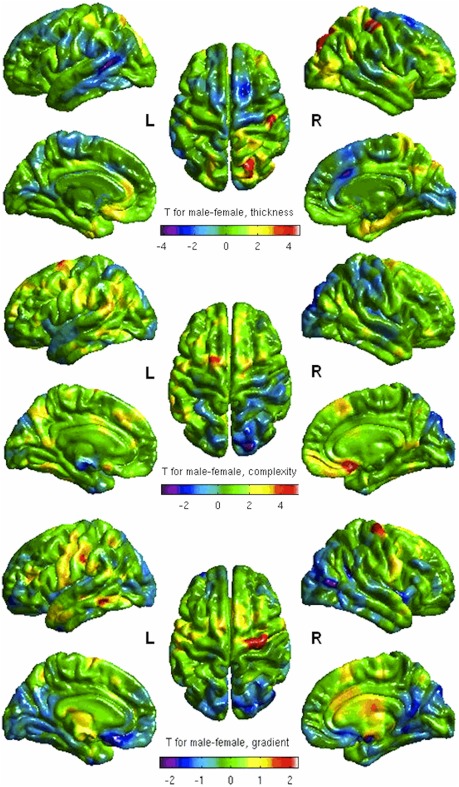
Gender effect on CT, CC, and CG—covarying for ICV. Red clusters correspond to increased CT, CC, or CG in men, blue clusters correspond to decreased CT, CC, or CG in women. L = left; R = right.
Figure 5.
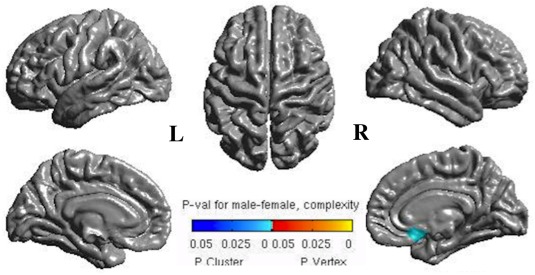
Surface mapping of P‐values after the FDR correction showing significant blue clusters of increased complexity in men in the right fronto‐orbital cortex. L = left; R = right.
Age‐gender interaction
Age effect was most pronounced for CT in the left supramarginal gyrus (T > 4) in men (Fig. 6, upper row), for CC in precentral, postcentral, frontal pole, superior and inferior parietal, and superior frontal regions in the right hemisphere (T > 3) in men and in left temporal pole, lingual, precentral, middle temporal regions, and right entorrhinal region (T > 2) in women (Fig. 6, middle row). Age‐effect on CG was most pronounced in right lateral occipital and left occipital lobe, left inferior temporal, middle frontal bilaterally (T > 1) in men and left supramarginal and precentral regions (T > 2) in women (Fig. 6, lower row).
Figure 6.
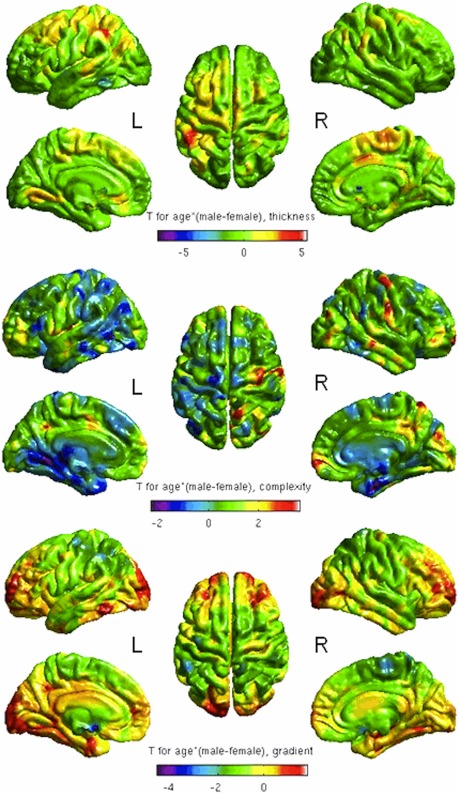
Age × gender interaction—covarying for ICV. Red clusters correspond to more pronounced age effect on CT, CC, or CG in men, blue clusters correspond to more pronounced age effect on CT, CC, or CG in women. L = left; R = right.
ICV, GMV, and WMV effects
There was no significant effect of ICV, GMV, and WMV on CT, CC, and CG. Nevertheless, a trend to a positive correlation was found between GMV versus CT and CC and between WMV and CG and, a trend to negative correlation between WMV versus CT (Fig. 7).
Figure 7.
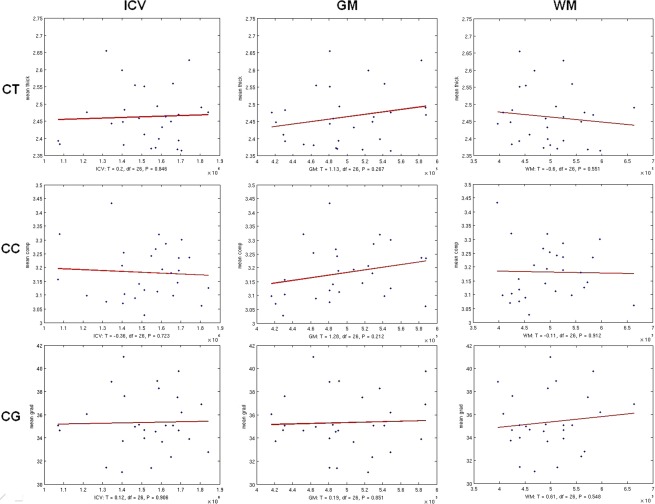
Scatter plots for ICV, GMV, and WMV effect on CT, (upper row) CC (middle row), and CG (lower row), over the entire brain. [Color figure can be viewed in the online issue, which is available at http://wileyonlinelibrary.com.]
ROIs Analyses
Table 2 summarizes T‐ and P‐values from linear regression analyses of separate age and gender effects, whereas Table 3 reports Manova (simple gender effect) and Mancova (gender with age as covariate) analyses.
Table 2.
ROIs analyses
| Left Hemisphere | Right Hemisphere | ||||||||||||||||||
|---|---|---|---|---|---|---|---|---|---|---|---|---|---|---|---|---|---|---|---|
| c1 | c2 | t1 | t2 | o1 | o2 | p1 | p2 | c1 | c2 | t1 | t2 | o1 | o2 | p1 | p2 | ||||
| Age | CT | t = 1.06 P = 0.301 | t = 1.28 P = 0.213 | t = 1.41P P = 0.17 | t = 0.7 P = 0.491 | t = 2.74 P = 0.011 | t = 0.84 P = 0.41 | t = 0.28 P = 0.783 | t = 0.85 P = 0.403 | Age | CT | t = 0.41 P =0.685 | t = 1.51 P = 0.144 | t = 0.14 P = 0.893 | t = 0.75 P = 0.459 | t = 2.19 d P = 0.037 | t = 0.84 P = 0.407 | t = 1.77 P = 0.088 | t = 1.61 P = 0.12 |
| CC | t = 1.05 P = 0.305 | t = 0.7 P = 0.492 | t = 0.38 P = 0.708 | t = 0.77 P = 0.447 | t = 0.19 P = 0.853 | t = 2.22 P = 0.036 | t = 0.92 P = 0.365 | t = 0.86 P = 0.398 | CC | t = 0.57 P = 0.573 | t = 0.51 P = 0.612 | t = −0.1 P = 0.919 | t = 1.0 P = 0.302 | t = −0.58 P =0.568 | t = 1.25 P = 0.224 | t = 0.79 P = 0.437 | t = −0.2 P = 0.839 | ||
| CG | t = −1.44 P = 0.163 | t = −1.45 P = 0.159 | t = −0.29 P = 0.775 | t = −0.34 P = 0.74 | t = −2.12 P = 0.044 | t = −2.08 P = 0.048 | t = −1.32 P = 0.2 | t = −1.6 P = 0.122 | CG | t = −1.26 P = 0.217 | t = −1.27 P = 0.214 | t = −0.8 P = 0.43 | t = −1.51 P = 0.144 | t = −2.7 P = 0.012* | t = −2.24 P = 0.034 | t = −2.07 P = 0.049 | t = −1.88 P = 0.071 | ||
| Gender | CT | f = 0 P = 0.996 | f = 0.04 P = 0.85 | f = 0.56 P = 0.461 | f = 0.01 P = 0.919 | f = 0.25 P = 0.624 | f = 0.58 P = 0.455 | f = 2.06 P = 0.163 | f = 1.14 P = 0.296 | Gender | CT | f = 0.01 P = 0.907 | f = 4.57 P = 0.042* | f = 0.93 P = 0.343 | f = 0.24 P = 0.632 | f = 2.48 P = 0.127 | f = 0.01 P = 0.924 | f = 2.22 P = 0.148 | f = 10.35 P = 0.003* |
| CC | f = 1.47 P = 0.237 | f = 3.03 P = 0.094 | f = 0.41 P = 0.527 | f = 4.21 P = 0.05* | f = 0.98 P = 0.332 | f = 2.68 P = 0.114 | f = 4.56 P = 0.042* | f = 0.8 P = 0.381 | CC | f = 0.41 P = 0.528 | f = 0.07 P = 0.798 | f = 0.28 P = 0.598 | f = 4.47 P = 0.044* | f = 0.36 P = 0.554 | f = 1.1 P = 0.305 | f = 1.06 P = 0.313 | f = 2.06 P = 0.163 | ||
| CG | f = 0.21 P = 0.653 | f = 0.06 P = 0.803 | f = 0.02 P = 0.882 | f = 0.05 P = 0.833 | f = 0.26 P = 0.611 | f = 0.76 P = 0.393 | f = 0.14 P = 0.71 | f = 0 P = 0.979 | CG | f = 0.32 P = 579 | f = 0.22 P = 0.646 | f = 0.01 P = 0.932 | f = 0.05 P = 0.828 | f = 0.88 P = 0.358 | f = 0.44 P = 0.515 | f = 0.13 P = 0.719 | f = 0.33 P = 0.571 | ||
| ICV | CT | t = 0.68 P = 0.501 | t = 1.19 P = 0.245 | t = 0.4 P = 0.692 | t = 0.29 P = 0.777 | t = 0.2 P = 0.84 | t = 1.1 P = 0.279 | t = −0.98 P = 0.337 | t = −0.53 P = 0.603 | ICV | CT | t = 1.64 P = 0.112 | t = 1.61 P = 0.12 | t = 0.95 P = 0.651 | t = 0.55 P = 0.589 | t = 0.75 P = 0.459 | t = 1.4 P = 0.174 | t = 0.25 P = 0.806 | t = 0.88 P = 0.387 |
| CC | t = −0.44 P = 0.667 | t = 0.26 P = 0.797 | t = 0.25 P = 0.802 | t = −0.15 P = 0.882 | t = 0.25 P = 0.808 | t = 0.77 P = 0.45 | t = 0.5 P = 0.619 | t = 0.37 P = 0.717 | CC | t = −071 P = 0.487 | t = −1.14 P = 0.263 | t = 0.17 P = 0.869 | t = 0.29 P = 0.773 | t = −0.03 P = 0.977 | t = −0.25 P = 0.804 | t = −0.06 P = 0.955 | t = −0.95 P = 0.349 | ||
| CG | t = −0.21 P = 0.837 | t = −0.46 P = 0.647 | t = −0.06 P = 0.952 | t = 0.37 P = 0.718 | t = 0.16 P = 0.873 | t = −0.16 P = 0.876 | t = 0.73 P = 0.471 | t = 0.42 P = 0.676 | CG | t = −0.8 P = 0.433 | t = −0.85 P = 0.404 | t = 0.09 P = 0.928 | t = 0.55 P = 0.588 | t = −0.4 P = 0.693 | t = −0.27 P = 0.79 | t = 0.39 P = 0.699 | t = −0.04 P = 0.966 | ||
| GMV | CT | t = 0.69 P = 0.497 | t = 1.46 P = 0.157 | t = 1.59 P = 0.124 | t = 0.44 P = 0.664 | t = 1.56 P = 0.131 | t = 1.59 P = 0.123 | t = −0.84 P = 0.408 | t = 0.31 P = 0.761 | GMV | CT | t = 0.54 P = 0.591 | t = 2.73 P = 0.011 | t = 1.89 P = 0.07 | t = 0.83 P = 0.414 | t = 2.37 P = 0.026 | t = 1.42 P = 0.169 | t = 1.41 P = 0.171 | t = 2.24 P = 0.034 |
| CC | t = 1 P = 0.327 | t = 1.81 P = 0.083 | t = 1.33 P = 0.196 | t = 1.54 P = 0.136 | t = 0.26 P = 0.796 | t = 2.22 P = 0.035 | t = 1.81 P = 0.082 | t = 1.11 P = 0.275 | CC | t = 0.45 P = 0.66 | t = 0.47 P = 0.643 | t = 0.95 P = 0.353 | t = 2.25 P = 0.033 | t = −0.54 P = 0.592 | t = 1.21 P = 0.238 | t = 1.07 P = 0.294 | t = −076 P = 0.454 | ||
| CG | t = 0.32 P = 0.754 | t = −0.09 P = 0.929 | t = 0.38 P = 0.709 | t = 0.89 P = 0.381 | t = −0.44 P = 0.664 | t = −0.71 P = 0.482 | t = 0.68 P = 0.505 | t = 0.21 P = 0.833 | CG | t = 0.13 P = 0.898 | t = −0.59 P = 0.558 | t = 0.52 P = 0.606 | t = 0.42 P = 0.681 | t = −1.05 P = 0.305 | t = −0.73 P = 0.471 | t = 0.12 P = 0.908 | t = −0.22 P = 0.83 | ||
| WMV | CT | t = −0.6 P = 0.551 | t = 0.32 P = 0.748 | t = 0.04 P = 0.966 | t = −0.73P = 0.473 | t = 0.44 P = 0.663 | t = 0.43 P = 0.671 | t = −2.36 P = 0.026 | t = −0.9 P = 0.377 | WMV | CT | t = 0.44 P = 0.666 | t = 1.36 P = 0.186 | t = 0.44 P = 0.665 | t = −0.2 P = 0.845 | t = 1.18 P = 0.249 | t = 0.61 P = 0.547 | t = −0.33 P = 0.747 | t = 0.83 P = 0.415 |
| CC | t = −025 P = 0.807 | t = 0.36 P = 0.723 | t = 0.84 P = 0.409 | t = 0.25 P = 0.802 | t = −0.67 P = 0.509 | t = 227 P = 0.032 | t = 0.64 P = 0.531 | t = 0.46 P = 0.648 | CC | t = −0.5 P = 0.618 | t = −0.64 P = 0.53 | t = 0.71 P = 0.482 | t = 0.13 P = 0.9 | t = −0.69 P = 0.494 | t = 0.26 P = 0.796 | t = 0.32 P = 0.754 | t = −0.98 P = 0.337 | ||
| CG | t = 0.33 P = 0.742 | t = 0.07 P = 0.942 | t = 0.65 P = 0.522 | t = 0.98 P = 0.338 | t = 0.44 P = 0.662 | t = 0.07 P = 0.943 | t = 1.2 P = 0.242 | t = 0.92 P = 0.365 | CG | t = −0.25 P = 0.805 | t = −0.32 P = 0.749 | t = 0.83 P = 0.414 | t = 0.92 P = 0.365 | t = −0.08 P = 0.937 | t = 0.05 P = 0.959 | t = 0.92 P = 0.367 | t = 0.49 P = 0.627 | ||
| CT vs CC | t = −1.45 P = 0.158 | t = −0.74 P = 0.464 | t = −2.54 P = 0.018 | t = −2 P = 0.056 | t = −2.68 P = 0.013 | t = −2.04 P = 0.051 | t = −0.54 P = 0.597 | t = −1.3 P = 0.204 | CT vs CC | t = −3.61 P = 0.001 | t = −0.95 P = 0.351 | t = −2.7 P = 0.012 | t = −1.37 P = 0.182 | t = −5.37 P = 0 | t = −1.86 P = 0.074 | t = −1.76 P = 0.091 | t = −2.4 P = 0.024 | ||
| CT vs CG | t = −2.98 P = 0.006 | t = −1.84 P = 0.078 | t = −0.53 P = 0.602 | t = −2.24 P = 0.034 | t = −4.52 P = 0 | t = −2.69 P = 0.012 | t = −1.41 P = 0.17 | t = −0.98 P = 0.334 | CT vs CG | t = −3.09 P = 0.005 | t = −2.07 P = 0.049 | t = 0.5 P = 0.62 | t = −1.79 P = 0.084 | t = −3.78 P = 0.001 | t = −1.95 P = 0.62 | t = −0.58 P = 0.57 | t = −0.98 P = 0.337 | ||
| CC vs CG | t = 2.14 P = 0.042 | t = 1.73 P = 0.096 | t = 1.73 P = 0.096 | t = 1.55 P = 0.134 | t = 0.79 P = 0.439 | t = 0.68 P = 0.501 | t = 1.37 P = 0.182 | t = 0.73 P = 0.475 | CC vs CG | t = 1.03 P = 0.314 | t = 1.27 P = 0.217 | t = 0.3 P = 0.764 | t = 0.45 P = 0.659 | t = 2.71 P = 0.012 | t = 0.71 P = 0.487 | t = 0.75 P = 0.461 | t = 0.84 P = 0.406 | ||
Linear regressions show relationship between age, gender, ICV, GMV, WMV, and CT, CC, CG as well as correlations between CT/CC, CT/CG, and CT/CG. (*) Significant values.
Table 3.
Age‐ and gender‐related effects on CT, CC and CG in ROIs. Gender predominantly affects CC regionally (P=0.014) and its effect is mildly influenced by Age (P=0.027). NS=not significant.
| CT (Pval) | CC (Pval) | CG (Pval) | |
|---|---|---|---|
| MANOVA (Gender effect) | c2‐rh (0.042) p2‐rh (0.003) | t2‐lh (0.045) t2‐rh (0.044) p1‐lh (0.042) | NS |
| MANOVA Hotelling's Trace (Gender) | (0.170) | (0.014) | (0.152) |
| MANCOVA (Gender removing Age) | p2‐rh (0.008) | NS | NS |
| MANCOVA Hotelling's Trace (Gender/Age) | (0.209/0.215) | (0.027/0.542) | (0.240/0.359) |
Significant results included: (i) simple age effect on thickness in lateral occipital lobes (o1) bilaterally and on complexity in medial occipital lobe (o2), while CG was affected in occipital lobes (o1 and o2 bilaterally) and inferior parietal lobe (p2), (ii) Gender‐related variations on CT involved right postcentral (c2‐rh) and superior parietal (p2‐rh) gyri, and on CC, inferior parietal (p2‐rh) and temporal gyri (t2) bilaterally. After applying the FDR correction, we found no significant result.
No significant effect of ICV on CT, CC, and CG was found. CT was positively correlated with GMV in postcentral (c2), superior parietal (p1‐rh), and lateral occipital (o1‐rh) regions, as well as CC in medial occipital (o2‐lh) and temporal (t2‐rh) regions. CT was negatively correlated with WMV in superior parietal area (p2‐lh).
CT, CC, and CG Correlations
CT and CC showed a trend to negative correlation over the entire brain (Fig. 8), becoming significant in the precentral (c1‐rh) and superior parietal (p1‐rh) regions, bilateral superior temporal (t1), and lateral occipital (o1and o2) areas (Fig. 9, Table 3). CT and CG were significantly negatively correlated over the entire brain (P = 0.022 ‐lh; P = 0.117 ‐rh) (Fig. 8) and in many ROIs (c1; c2‐rh; t2‐lh; o1 and o2) (Fig. 9). CG and CC showed a very weak positive correlation over the entire brain, but significant in precentral (c1‐lh; P = 0.04) and lateral occipital (o1‐rh; P = 0.012) regions (Figs. 8 and 9, Table 3).
Figure 8.
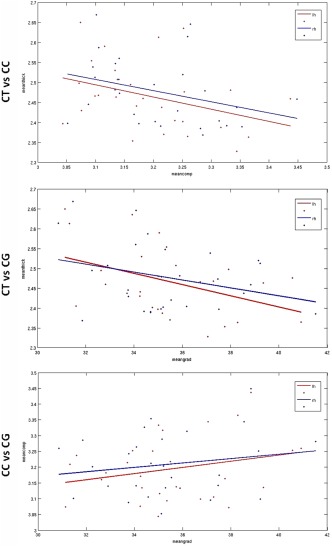
Scatter plots for correlations between CT and CC (upper row), CT and CG (middle row), CG and CC (lower row) over the entire brain. Dots and lines: red (left hemisphere) and blue (right hemisphere).
Figure 9.
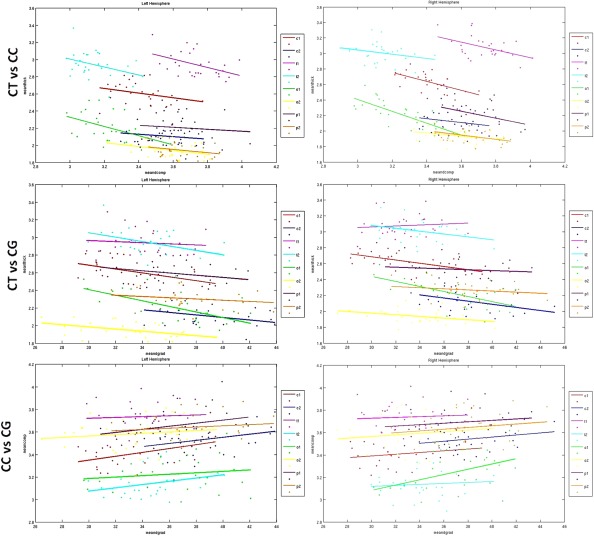
Scatter plots for correlations between CT and CC (upper row), CT and CG (middle row), CG and CC (lower row) in ROIs.
CT, CC, and CG Hemispheric Differences
No significant left‐right difference was found for averaged CT, CC, and CG. Nevertheless, CT and CC showed a trend to be higher in the right hemisphere (Fig. 10). ROIs analyses showed significantly increased CT in t1‐rh (P = 0.005) and CG in t1‐lh (P = 0.008) (Table 4; Fig. 11).
Figure 10.
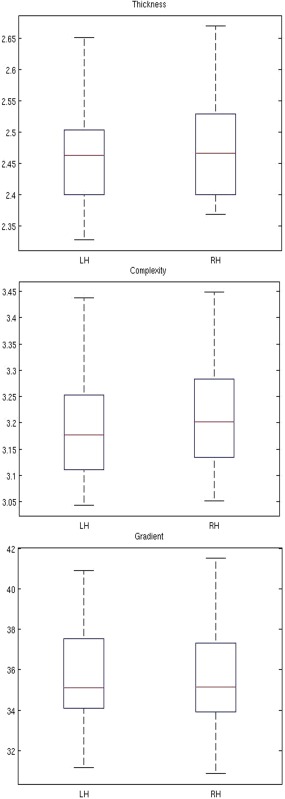
Box plots showing hemispheric differences for average CT (upper row), CC (middle row), and CG (lower row). [Color figure can be viewed in the online issue, which is available at http://wileyonlinelibrary.com.]
Table 4.
Interhemispheric differences using ANOVAs. p values are displayed. t1 appears as the most asymetrical area for CT and CG (values in bold).
| ROIs | CT | CC | CG |
|---|---|---|---|
| c1 | 0.4441 | 0.9834 | 0.2603 |
| c2 | 0.7191 | 0.816 | 0.4833 |
| t1 | 0.0005 | 0.9951 | 0.0087 |
| t2 | 0.0821 | 0.8949 | 0.4864 |
| o1 | 0.5882 | 0.8297 | 0.4697 |
| o2 | 0.8113 | 0.6977 | 0.4209 |
| p1 | 0.3435 | 0.0817 | 0.3187 |
| p2 | 0.918 | 0.2427 | 0.7143 |
Figure 11.
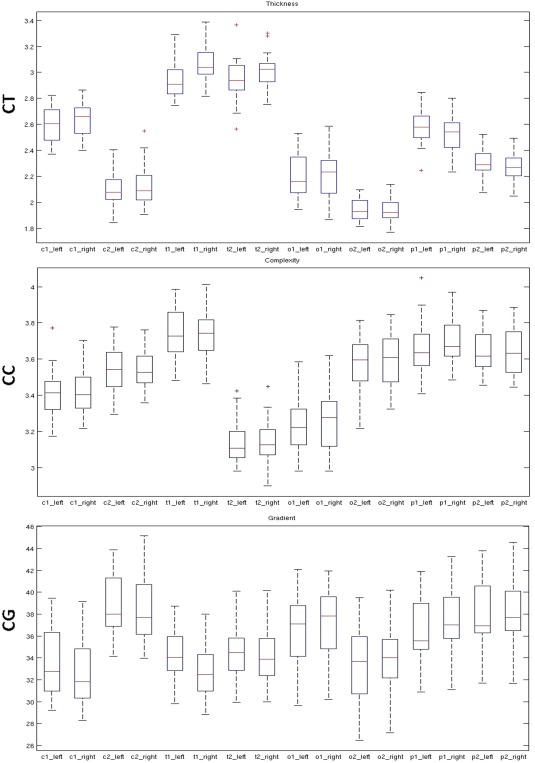
Box plots showing hemispheric differences for CT (upper row), CC (middle row), and CG (lower row) in selected ROIs. [Color figure can be viewed in the online issue, which is available at http://wileyonlinelibrary.com.]
DISCUSSION
Overall Results
Our study was carried out on a population of young adults in the third decade to extract age‐ and gender‐related differences within the cortical GM. None of the previous studies have focused on this age group and the findings in those studies which could be attributable to individuals in the third decade were part of the results from global analyses involving a wider range of subjects age [Fjell et al., 2009; Lemaitre et al., 2005, 2012; Lv et al., 2010; McGinnis et al., 2011; Tamnes et al., 2010; Westlye et al., 2010]. Moreover, studies reporting age groups comparisons [McGinnis et al., 2011; Salat et al., 2009] did not mention differences occurring in the age group that we investigated. According to the time course of the normal brain development described as having an inverted U pattern [Wesltye et al., 2010], we expected to find some variations, even subtle, which could relate to late brain maturation or early physiological decline. Another interest of our study was to approach the cortical variations using its three major parameters that are physiologically correlated with human brain development and maturation processes, namely: thickness (CT), complexity/gyrification + sulcation (CC), and inner surface intensity (CG) variations. ROI analyses added some information, which showed that analyzing the whole brain may occult some details assessable only by ROI analyses and reciprocally. Our major findings, from both whole brain and ROIs analyses, are the followings: (1) the common template (auto z‐score) showed the same surface distribution of CT, CC, and CG as reported by previous studies [Armstrong et al., 1993; Blackmon et al., 2011; Blanton et al., 2001; Fischl and Dale, 2000; Fischl et al., 2004; Fjell et al., 2009; Hutton et al., 2008; Luders et al., 2004, 2006,b; Salat et al., 2009; Sowell et al., 2003; Thompson et al., 1996; Zilles et al., 1997, 1988], (2) interindividual variations (among the whole group) of CT and CG were similar to that in the literature [Blackmon et al., 2011; Fischl and Dale, 2000], but age‐ and gender‐related variations significantly affected brain complexity (P < 0.01) in the right hemisphere, on posterior cingulate and middle temporal cortices (age), and the fronto‐orbital cortex (gender), finding never reported before, (3) age‐related significant variations included increased CT and decreased CC and CG, in the lateral occipital cortices, but also increased CC in the right middle temporal, cingulate, and left medial occipital areas, (4) gender‐related differences mostly were marked on bilateral temporopolar, inferior and middle temporal‐entorrhinal cortices, and left inferior parietal cortex, (5) different sensitivity of men and women on age‐effect with CC most affected in women and CG in men, (6) CT/CC and CT/CG negative correlations and, finally (7) right‐left hemispheric asymmetries in favor of increased CT and decreased CG in the right superior temporal gyrus.
Age Effect
We found age‐related significant variations with increased CT and decreased CC and CG in the occipital cortices, and increased CC in middle temporal and cingulate gyri (Table 2). As described in the literature, most authors found decreased CT in occipital lobes since childhood throughout life [Hogstrom et al., in press; Salat et al., 2009; Shaw et al., 2008; Tamnes et al., 2010] while others described preserved CT in lateral occipital cortices, in young and middle adults (18–59 years) [McGinnis et al., 2011] and in larger samples (19–94 years) [Fjell et al., 2009]. Some studies also showed increased CT in entorrhinal and frontal pole cortices from 8 to 30 years [Tamnes et al., 2010], medial frontal and anterior cingulate gyri from 19 to 94 years [Fjell et al., 2009; Salat et al., 2009] and temporal superior from 4 to 21 years [Gogtay et al., 2004], or stable in temporal regions from 7 to 97 years [Sowell et al., 2003]. The GWM ratio was described as preserved in the occipital lobes with aging [Salat et al., 2009]. According to Westlyes et al. [2010], the cortical GM signal intensity and peaks first in occipital lobes at 8 years while the earliest signal deterioration is seen in the cingulate and medial occipital cortices after 50 years. Thus, none of the previous studies is reporting our findings related to CT and CG variations in the third decade.
CT is determined by its composition in terms of neuronal cells, arranged in columns perpendicular to the ontogenetic pial surface of the brain, which migrated from a common origin to their final position in the cortex [Haug et al., 1984; Mountcastle, 1997; Rakic, 2007]. The thickness of the six cortical layers varies in different parts of the cortex, between hemispheres of the same brain and between brains of different individuals [Haug et al., 1984; Mountcastle, 1997]. Priors studies have shown that CT development is influenced by genetic [Chee et al., 2011; Im et al., 2008; Panizzon et al., 2009; Rimol et al., 2010; Van Soelen et al., 2012] and environmental factors [Chee et al., 2011; Karama et al., 2009, 2011; Wenger et al., 2012]. Neuronal density so as synaptic density are high in the neonatal brain, decrease rapidly during the first year of life and then decelerate [Welker, 1990; Huttenlocker, 1979; Pakkenberg and Gundersen, 1997; Rakic, 1995]. Increase in water content, neuronal loss and GM myelinisation are responsible for signal changes within the GM [Magnaldi et al., 1993; Salat et al., 2009]. Moreover, neuronal plasticity involves changes in cytoarchitecture of the cortical ribbon [Trachtenberg et al., 2002] even in elderly, as demonstrated by MRI. Some authors have shown that learning can induce significant regional changes in CT [Lazar et al., 2005; Wenger et al., 2012]. As CT, age‐effect on CG is conditioned by neuronal loss, increase water content and myelination, and genetic factors [Panizzon et al., 2012]. Iron load also influences absolute T 1 intensity values leading to modifications of CG vectors within the cortex and CG is subject to learning induced plasticity as well [Blackmon et al., 2011].
Regional increased CT (and decreased CC and CG) in some brain areas, as we found, could be explained by neuronal plasticity induced by learning at an age where functional connectivity maturation is still in progress with the refinement of neuronal connections [Dosenbach et al., 2010]. Occipital regions are likely more sensitive to these changes as we observed, and may reflect neuronal plasticity due to adaptive changes in visual function [Blackmon et al., 2011; Driemeyer et al., 2008]. In some other regions, such as right superior and middle frontal, cingulate, and left postcentral, we found decreased CT with age, findings also reported by Salat et al. [2009], Tamnes et al. [2010], and Shaw et al. [2008] in wider age groups, and assumed to correspond to early signs of physiological cortical decline.
We found significantly increased CC in the right middle temporal gyrus, cingulate, and left medial occipital cortex, with aging. Many discrepancies about age‐related changes in cortical gyrification are found in the results of various studies [Armstrong et al., 1995; Su et al., 2013; Toro et al., 2008; Zilles et al., 1988]. The cortical folding starts in the 16th gestational week and progresses in an exponential fashion until the 5th or 6th month postnatal, as the GI reaches its maximum value, then decreases gradually until 23 years of age, where it stabilizes [Armstrong et al., 1995]. Raznahan et al. [2011], Hogstrom et al. [in press], and Shaw et al. [2012] described a slowly GI decrease over the entire brain with a deceleration from approximately 14 years. White et al. [2010] and Su et al. [2013] described significant increase of GI in right parietal and cingulate cortices between 8 and 19 years. These differences may be due to different measurement methods and studied populations of various age‐groups [Luders et al., 2004, 2006,b; Su et al., 2013; Van Essen and Drury, 1997]. White et al. [2010] and Su et al. [2013] proposed a 3D GI new intrinsic and geometric technique to compute global and local gyrification indices in 3D. To estimate CC, we used the method described by Toro et al. [2008], which defines the regional 3D GI directly on the pial surface. Using that method, the results depend on the specified radius of the sphere. Middle temporal gyrus, cingulate, and medial occipital cortex are functionally implicated respectively in perceptual and mnemonic integration, learning, and memory tasks (limbic system), as well as visual functions [Wandell et al., 2007]. CC (increased) is likely the best parameter to reflect in those regions brain plasticity in young adults [Paus et al., 2001]. Correlations with the other cortical parameters (CT and CG) are discussed further.
We then observed that age‐related variations of the brain cortex in the third decade encompass both increased and decreased thickening and gyrification processes, as well as intracortical signal intensity variations, in different areas of the brain.
Gender Effect
We found marked gender differences in precentral, parietal, and occipital cortices, mostly in the rh. Men showed thicker cortex in the right superior parietal and postcentral areas, while women had thicker cortex in the anterior cingulate and superior frontal areas (Table 2). Gender‐related cortical differences have been assessed in several studies with very heterogeneous results [Rademacher et al., 2001; Chee et al., 2011; Im et al., 2006a; Luders et al., 2006,b; Lv et al., 2010; Sowell et al., 2007]. Similar to Raznahan et al. [2011] who investigated subjects aged 6–22 years, we found average CT lower in women than men and significantly increased in right precentral and superior parietal gyri in men. Other authors investigating a wider age‐range including elderly found the contrary [Im et al., 2006a; Luders et al., 2006,b; Lv et al., 2010; Sowell et al., 2007]. Im et al. [2006a] and Luders et al. [2006,b] who studied populations of young adults found thicker cortices (parieto‐occipital, precentral and postcentral, medial superior frontal and anterior cingulated) predominating in the left hemisphere in women. These studies were performed at 1.5T MRI while ours at 3T. On average, brain CT is slightly higher at 3T than at 1.5T due to the fact that the underlying tissues nuclear magnetic resonance tissue properties change with field strength, and that leads to changes in the intensity and contrast [Han et al., 2006]. In addition to the type of magnet used for MRI acquisition and the age of subjects, the smoothing level at image post‐processing, scaling technique, varied across studies and may account for various, and even contradictory results as seen in the literature [Fjell et al., 2009].
CC was more pronounced in men in left superior frontal and right medial orbitofrontal whereas marked in right parieto‐occipital areas in women. Raznahan et al. [2011] also reported average CC to be increased in men. Our results contrast with some previous examinations that found increased GI in females in frontal and parietal lobes bilaterally [Awate et al., 2009; Luders et al., 2004] and in occipital lobes [Luders et al., 2006,b]. Zilles [1997] and Nopoulos et al. [2000] failed to detect significant gender differences in GI or fissuration indices but found weakly higher gyrification in left hemisphere in men. Methodological considerations mentioned above may also account in these results differences.
CG was higher in men in the right precentral and left postcentral and middle temporal cortices, but more marked in the right inferior parietal and left medial orbitofrontal and temporopolar regions. Salat et al. [2009] found weak gender differences in GWM ratio in young adults, whereas they were stronger in middle adults. In Blackmon et al. [2011] study, no significant difference in GWM contrast between men and women was found.
Sex‐related dimorphic differences in CT, CC, and CG might develop as differences in the underlying cytoarchitecture of the cortex, neural connectivity and function of specific brain regions [Kimura, 2000; Lustig, 1998]. Most studies did not find significant difference in neuronal density [Alonso‐Nanclares et al., 2008; Pakkenberg and Gundersen, 1997] or in spatial distribution of densities of different cell populations [Stark et al., 2007b] over the brain. Regional differences have been found in temporal and occipital lobes with higher neuronal density in women [Witelson et al., 1995] and in frontal and temporal regions with different cytological constitution of neurons [Stark et al., 2007a]. However, this cytoarchitectural differences were not accompanied by CT changes and could not explain sex‐related CT variations [Rabinowicz et al., 1998, 2002; Stark et al., 2007a,b]. Sex differences may also be due to differences in cortical cell metabolism and chemistry [Cosgrove et al., 2007]. Also, the fact that men and women develop different cognitive skills unrelated to any level of intelligence explains the differences between them. Moreover, differences between both groups could be attributed to differences in emotional, environmental, and genetic factors [Chee et al., 2011]. Several authors have suggested that the difference in brain size between men and women could explain gender differences in CC and CT [Im et al., 2008; Leonard et al. 2008] Armstrong et al. [1995], Van Essen et al. [1997], and Toro et al. [2008] showed that the gyrification process was correlated to brain size and intracranial cavity volume, mainly during the first trimester of pregnancy. ICV does not account in our results since all analyses were carried out after normalization to this factor. Neuroendocrine theories have been addressed in discussing gender‐related cortical differences and plasticity, mentioning the roles of estrogens and testosterone [Bailey et al., 2011; Goldstein, 2001; Lustig, 1998; McEwen et al., 2001].
In evaluating age × sex interaction, we found different sensitivity of men and women on age‐effect. CC was most affected in women (temporoparietal and occipital areas) and CT (left supramarginal gyrus) and CG (frontopolar and occipital areas) in men (Table 2). In addition, we found marked age‐gender interaction in temporopolar, inferior and middle temporal‐entorrhinal, and left inferior parietal cortices (Table 3). Sowell et al. [2007] found that men and women differed in aging pattern of changes with posterior frontal and temporal cortices thickness more affected in men. Early in life, average age‐related CT and CC changes already differ between males and females [Blanton et al., 2001; Raznahan et al., 2011]. According to our findings, the human brain in the third decade might exhibit different regional gender sensitivity to age changes.
Other Findings
We found a significant negative correlation between CT and CC. These results are similar to others [Hogstrom et al., in press; Im et al., 2006a,b; Jiang et al., 2008; Sigalovsky et al., 2006; Toro and Burnod, 2005] and reflect the well known intrication of cortical development and gyrification processes. This tight relation is well demonstrated by the frequent association of anomalies of gyration with cortical maldevelopment [Rakic, 2007]. The gyrification is the result of complex active and passive processes. Its value depends initially on the cortical surface, which is determined by the number of radial units along the ventricular zone while CT depends on the number of neurons [Rakic, 1988, 1995]. CT was significantly negatively correlated with CG over the entire brain and in precentral gyri and occipital lobes. Panizzon et al. [2012] reported similar findings. Since CG evolves linearly with the inner cortical blurring toward the WM surface, the more the thickness increases, the shorter the gradient vectors will be.
We found a significant rightward asymmetry in CT in superior temporal gyri only. CG showed significant leftward asymmetry and no difference for CC in the same area. Studies from Luders et al. [2006,b] in young adult, Kim et al. [2012] in old subjects and, Shaw et al. [2009] in children, found a leftward hemispheric asymmetry CT in right‐handed. Sigalovsky et al. [2006] did not found any hemispheric difference in CT in temporal lobes but found greater longitudinal relaxation rate in the left superior temporal lobe attributed to heavily myelinated area. The left planum temporale including the superior temporal gyrus is well known to be predominant in auditory and language functions since very early in life and latter shows a higher GM myelination as compared to the right side [Sigalovsky et al., 2006]. Therefore, we expected to find greater thickness on the left side, which is not the case. We have no hypothesis to explain our opposite finding.
LIMITATIONS AND PERSPECTIVES
Our study included a limited number of participants mainly due to the high difficulty or recruiting healthy volunteers at our institution. A major limitation of this study is the lack of neuropsychological evaluation and records of education level, social habits, and hobbies. The results of cognitive evaluations could have partly explained the differences in cortical features. Regarding surface‐based methods, the images post‐processing including automatic segmentation procedures still show some limitations, whatever technique is used, because of biological CT non‐uniformity across the cortex and areas with low GWM contrast and higher variability in certain areas such as precentral, occipital, and temporal cortices. Moreover, the position of dura tangential to the cortex and close to the proximity of the hemispheres may cause errors, as does the narrow separation between putamen and hippocampus and the adjacent cortical [Han et al., 2006; Lerch and Evans, 2005]. Formation of holes and bridges as « cortical defects » also could be at the origin of mistakes in segmentation [Fischl, 2012; Glasser and Van Essen, 2011]. Thus, some substantial improvements are still to be made in algorithms used for brain automatic segmentation and will help in better defining brain cortical variations across ages and between genders.
Despite these limitations, in this specific age‐group of young adults, in the third decade, we found valuable results, reaching significance for several analyses, either on the whole brain or within ROIs, which may express concomitant late maturation and early decline in different brain areas. Our results add some new information in the field of investigations on the human brain cortex complex morphology and evolution. Other studies involving wider samples of restricted age‐range are required to support our hypotheses.
REFERENCES
- Alonso‐Nanclares L, Gonzalez‐Soriano J, Rodriguez JR, DeFelipe J (2008): Gender difference in human cortical synaptic density. PNAS 105:14615–14619. [DOI] [PMC free article] [PubMed] [Google Scholar]
- Andreason PJ, Zametkin AJ, Guo AC, Cohen RM (1994): Gender‐related differences in regional cerebral glucose metabolism in normal volunteers. Psychiatry Res 51:175–183. [DOI] [PubMed] [Google Scholar]
- Armstrong E, Schleicher A, Omran H, Curtis M, Zilles K (1995): The ontogeny of human gyrification. Cereb Cortex 1:56–63. [DOI] [PubMed] [Google Scholar]
- Awate SP, Yushkevich PA, Licht DJ, Gee JC (2009): Gender differences in cerebral cortical folding: Multivariate complexity‐shape analysis with insights into handling brain‐volume differences. Med Image Comput Assist Interv 12:200–207. [DOI] [PubMed] [Google Scholar]
- Awate SP, Yushkevich PA, Song Z, Licht DJ, Gee JC (2010): Cerebral cortical folding analysis with multivariate modeling and testing: Studies on gender differences and neonatal development. Neuroimage 53:450–459. [DOI] [PMC free article] [PubMed] [Google Scholar]
- Bailey ME, Wang AC, Hao J, Janssen WG, Hara Y, Dumitriu D, Hof PR, Morrison JH (2011): Interactive effects of age and estrogen on cortical neurons: Implications for cognitive aging. Neuroscience 191:148–158. [DOI] [PMC free article] [PubMed] [Google Scholar]
- Benjamini Y, Hochberg Y (1995). Controlling the false discovery rate: A practical and powerful approach to multiple testing. J R Stat Soc Ser B (Methodological) 57:289–300. [Google Scholar]
- Blackmon K, Halgren E, Barr WB, Carlson C, Devinsky O, DuBois J, Quinn BT, French J, Kuzniecky R, Thesen T (2011): Individual differences in verbal abilities associated with regional blurring of the left gray and white matter boundary. J Neurosci 31:15257–15263. [DOI] [PMC free article] [PubMed] [Google Scholar]
- Blanton RE, Levitt JG, Thompson PM, Narr KL, Capetillo‐Cunliffe L, Nobel A, Singerman JD, McCracken JT, Toga AW (2001): Mapping cortical asymmetry and complexity patterns in normal children. Psychiatry Res 107:29–43. [DOI] [PubMed] [Google Scholar]
- Besson P, Bernasconi N, Colliot O, Evans A, Bernasconi A (2008): Surface‐based texture and morphological analysis detects subtle cortical dysplasia. Med Image Comput Assist Interv 11:645–652. [DOI] [PubMed] [Google Scholar]
- Chee MW, Zheng H, Goh JO, Park D, Sutton BP (2011): Brain structure in young and old east Asians and westerners: Comparisons of structural volume and cortical thickness. J Cogn Neurosci 23:1065–1079. [DOI] [PMC free article] [PubMed] [Google Scholar]
- Clarkson MJ, Cardoso MJ, Ridgway GR, Modat M, Leung KK, Rohrer JD, Fox NC, Ourselin S (2011): A comparison of voxel and surface based cortical thickness estimation methods. Neuroimage 57:856–865. [DOI] [PubMed] [Google Scholar]
- Collins DL, Neelin P, Peters TM, Evans AC (1994): Automatic 3D intersubject registration of MR volumetric data in standardized Talairach space. J Comput Assist Tomogr 18:192–205. [PubMed] [Google Scholar]
- Cosgrove KP, Mazure CM, Staley JK (2007): Evolving knowledge of sex differences in brain structure, function and chemistry. Biol Psychiatr 62:847–885. [DOI] [PMC free article] [PubMed] [Google Scholar]
- Dale AM, Fischl B, Sereno MI (1999): Cortical surface‐based analysis. I. Segmentation and surface reconstruction. Neuroimage 9:179–194. [DOI] [PubMed] [Google Scholar]
- Dosenbach NUF, Nardos B, Cohen AL, Fair DA, Power J, Church JA, Nelson SM, Wig GS, Vogel AC, Lessov‐Schlaggar CN, Barnes KA, Dubis JW, Feczko E, Coalson RS, Pruett JR, Barch DM, Petersen SE, Schlaggar BL (2010): Prediction of individual brain maturity using fMRI. Science 329:1358–1361. [DOI] [PMC free article] [PubMed] [Google Scholar]
- Driemeyer J, Boyke J, Gaser C, Büchel C, May A (2008): Changes in gray matter induced by learning—Revisited. PLoS One e2669. [DOI] [PMC free article] [PubMed]
- Fischl B (2012): Freesurfer. Neuroimage 62:774–781. [DOI] [PMC free article] [PubMed] [Google Scholar]
- Fischl B, Sereno MI, Dale AM (1999): Cortical surface‐based analysis. II: Inflation, flattening, and a surface‐based coordinate system. Neuroimage 9:195–207. [DOI] [PubMed] [Google Scholar]
- Fischl B, Salat DH, van der Kouwe AJ, Makris N, Segonne F, Quinn BT, Dale AM (2004): Sequence‐independent segmentation of magnetic resonance images. Neuroimage 23:S69–S84. [DOI] [PubMed] [Google Scholar]
- Fjell AM, Westlye LT, Amlien I, Espeseth T, Reinvang I, Raz N, Agartz I, Salat DH, Greve DN, Fischl B, Dale AM, Walhovd KB (2009): High consistency of regional cortical thinning in aging across multiple samples. Cereb Cortex 19:2001–2012. [DOI] [PMC free article] [PubMed] [Google Scholar]
- Glasser MF, Van Essen DC (2011): Mapping human cortical areas in vivo based on myelin content as revealed by T1‐and T2‐weighted MRI. J Neurosci 31:11597–11616. [DOI] [PMC free article] [PubMed] [Google Scholar]
- Goldstein JM, Seidman LJ, Horton NJ, Makris N, Kennedy DN, Caviness VS Jr, Faraone SV, Tsuang MT (2001): Normal sexual dimorphism of the adult human brain assessed by in vivo magnetic resonance imaging. Cereb Cortex 11:490–497. [DOI] [PubMed] [Google Scholar]
- Gogtay N, Giedd JN, Lusk L, Hayashi KM, Greenstein D, Vaituzis AC, Nugent TF, Herman DH, Clasen LS, Toga AW, Rapoport JL, Thompson PM (2004): Dynamic mapping of human cortical development during childhood through early adulthood. Proc Natl Acad Sci USA 101:8174–8179. [DOI] [PMC free article] [PubMed] [Google Scholar]
- Gronenschild EH, Habets P, Jacobs HI, Mengelers R, Rozendaal N, Van Os J, Marcelis M (2012): The effects of FreeSurfer Version, workstation type, and Macintosh operating system version on anatomical volume and cortical thickness measurements. PLoS One 7:e38234. [DOI] [PMC free article] [PubMed] [Google Scholar]
- Han X, Jovicich J, Salat D, van der Kouwe A, Quinn B, Czanner S, Busa E, Pacheco J, Albert M, Killiany R, Maguire P, Rosas D, Makris N, Dale A, Dickerson B, Fischl B (2006): Reliability of MRI‐derived measurements of human cerebral cortical thickness: The effects of field strength, scanner upgrade and manufacturer. Neuroimage 32:180–194. [DOI] [PubMed] [Google Scholar]
- Haug H, Kuhl S, Mecke E, Sass N, Wasner K (1984): The significance of morphometric procedures in the investigation of age changes in cytoarchitectonic structures of the human brain. Int J Brain Res Neurobiol 25:353–374. [PubMed] [Google Scholar]
- Hogstrom LJ, Westlyes LT, Walhovd KB, Fjell AM: The structure of the cerebral cortex across adult life: Age‐related patterns of surface area, thickness, and gyrification. Cereb Cortex (in press). [DOI] [PubMed] [Google Scholar]
- Huttenlocker PR (1979): Synaptic density in human frontal cortex—Developmental changes and effects of aging. Brain Res 163:195–205. [DOI] [PubMed] [Google Scholar]
- Hutton C, De Vita E, Ashburner J, Deichmann R, Turner R (2008):Voxel‐based cortical thickness measurements in MRI. Neuroimage 40:1701–1710. [DOI] [PMC free article] [PubMed] [Google Scholar]
- Im K, Lee JM, Lee J, Shin YW, Kim IY, Kwon JS, Kim SI (2006a): Gender difference analysis of cortical thickness in healthy young adults with surface based‐methods. Neuroimage 31:31–38. [DOI] [PubMed] [Google Scholar]
- Im K, Lee JM, Yoon U, Shin YW, Hong SB, Kim IY, Kwon JS, Kim SI (2006b): Fractal dimension in human cortical surface: Multiple regression analysis with cortical thickness, sulcal depth, and folding area. Hum Brain Mapp 27:994–1003. [DOI] [PMC free article] [PubMed] [Google Scholar]
- Im K, Lee JM, Lyttelton O, Kim SH, Evans AC, Kim SI (2008): Brain size and cortical structure in the adult human brain. Cereb Cortex 18:2181–2191. [DOI] [PubMed] [Google Scholar]
- Jiang J, Zhu W, Shi F, Zhang Y, Lin L, Jiang T (2008): A robust and accurate algorithm for estimating the complexity of the cortical surface. J Neurosci Methods 172:122–130. [DOI] [PubMed] [Google Scholar]
- Kabani N, Le Goualher G, Mac Donald D, Evans AC (2001): Measurement of cortical thickness using an automated 3‐D algorithm: A validation study. Neuroimage 13:375–380. [DOI] [PubMed] [Google Scholar]
- Karama S, Ad‐Dab'bagh Y, Haier RJ, Deary IJ, Lyttelton OC, Lepage C, Evans AC, The Brain Development Cooperative Group (2009): Positive association between cognitive ability and cortical thickness in a representative US sample of healthy 6 to 18 year‐olds. Intelligence 37:145–155. [DOI] [PMC free article] [PubMed] [Google Scholar]
- Karama S, Colom R, Johnson W, Deary IJ, Haier R, Waber DP, Lepage C, Ganjavi H, Jung R, Evans AC, The Brain Development Cooperative Group (2011): Cortical thickness correlates of specific cognitive performance accounted for by the general factor of intelligence in healthy children aged 6 to 18. Neuroimage 55:1443–1453. [DOI] [PMC free article] [PubMed] [Google Scholar]
- Kim HJ, Lee JW, Kim GH, Roh JH, Kim MJ, Deo SW, Kim ST, Jeon S, Lee JM, Heilman KM, Na DL (2012): Cortical asymmetries in normal, mild cognitive impairment, and Alzheimer's disease. Neurobiol Aging 33:1959–1966. [DOI] [PubMed] [Google Scholar]
- Kimura D (2000): Sex and Cognition. Cambridge, MA: MIT Press. [Google Scholar]
- Lazar SW, Kerr CE, Wasserman RH, Gray JR, Greve DN, Treadway MT, McGarvey M, Quinn BT, Dusek JA, Benson H, Rauch SL, Moore CI, Fischl B (2005): Meditation experience is associated with increased cortical thickness. Neuroreport 16:1893–1897. [DOI] [PMC free article] [PubMed] [Google Scholar]
- Lemaitre H, Crivello F, Grassiot B, Alperovitch A, Tzourio C, Mazoyer B (2005): Age‐ and sex‐related effects on the neuroanatomy on healthy elderly. Neuroimage 26:900–911. [DOI] [PubMed] [Google Scholar]
- Leonard CM, Towler S, Welcome S, Halderman LK, Otto R, Eckert MA, Chiarello C (2008): Size matters: Cerebral volume influences sex differences in neuroanatomy. Cereb Cortex 18:2920–2931. [DOI] [PMC free article] [PubMed] [Google Scholar]
- Lerch JP, Evans AC (2005): Cortical thickness analysis examined through power analysis and a population simulation. Neuroimage 1:163–173. [DOI] [PubMed] [Google Scholar]
- Luders E, Toga AW (2010): Sex differences in brain anatomy. Prog Brain Res 186:3–12. [DOI] [PubMed] [Google Scholar]
- Luders E, Narr KI, Thompson PM, Rex DE, Woods RP, Deluca H, Jancke I, Toga AW (2006): Gender effects on cortical thickness and the influence of scaling. Hum Brain Mapp 27:314–324. [DOI] [PMC free article] [PubMed] [Google Scholar]
- Luders E, Thompson PM, Narr KL, Toga AW, Jancke L, Gaser C (2006): A curvature‐based approach to estimate local gyrification on the cortical surface. Neuroimage 29:1224–1230. [DOI] [PubMed] [Google Scholar]
- Luders E, Marr KL, Bilder RM, Szesko PR, Gurbani MN, Hamilton L, Togo A, Gaser C (2008): Mapping the relationship between cortical convolution and intelligence : Effects of gender. Cereb Cortex 18:2019–2026. [DOI] [PMC free article] [PubMed] [Google Scholar]
- Lustig RH (1998): Sex hormonal modulation of neural development in vitro: Implication for brain sex differenciation In: Ellis L, Ebertz L, editors. Males, Females and Behavior. Westport, CT. Praeger; pp 13–26. [Google Scholar]
- Lv B, Li J, He H, Li M, Zhao M, Likun A, Yan F, Xian J, Wang Z (2010): Gender consistency and difference in healthy adults revealed by cortical thickness. Neuroimage 53:373–382. [DOI] [PubMed] [Google Scholar]
- Mac Donald D, Kabani N, Avis D, Evans AC (1999): Automated 3‐D extraction of inner and outer surfaces of cerebral cortex from MRI. Neuroimage 12: 340–356. [DOI] [PubMed] [Google Scholar]
- McEwen BS (2001): Invited review: Estrogens effects on the brain: Multiple sites and molecular mechanisms. J Appl 91:2785–2801. [DOI] [PubMed] [Google Scholar]
- McGinnis SM, Brickhouse M, Pascual B, Dickerson BC (2011): Age‐related changes in the thickness of cortical zones in humans. Brain Topogr 24:279–291. [DOI] [PMC free article] [PubMed] [Google Scholar]
- Magnotta VA, Andreasen NC, Schultz SK, Harris G, Cizadlo T, Heckel D, Nopoulos P, Flaum M (1999): Quantitative in vivo measurement of gyrification in the human brain: Changes associated with aging. Cereb Cortex 9:151–160. [DOI] [PubMed] [Google Scholar]
- Magnaldi S, Ukmar M, Vasciaveo A, Longo R, Pozzi‐Mucelli RS (1993): Contrast between white and grey matter: MRI appearance with ageing. Eur Radiol 513–519. [Google Scholar]
- Mountcastle VB (1997): The columnar organization of the neocortex. Brain 120:701–722. [DOI] [PubMed] [Google Scholar]
- Mustafa N, Ahearn TS, Waiter GD, Murray AD, Whalley LJ, Staff RT (2012): Brain structural complexity and life course cognitive change. Neuroimage 61:694–701. [DOI] [PubMed] [Google Scholar]
- Nopoulos P, Flaum M, O'Leary D, Andreasen NC (2000): Sexual dismorphism in the human brain: Evaluation of tissue volume, tissue composition and surface anatomy using magnetic resonance Imaging. Psychiatry Res 98:1–13. [DOI] [PubMed] [Google Scholar]
- Pakkenberg B, Gundersen G (1997): Neocortical neuron number in humans: Effect of sex and age. J Comp Neurol 384:312–320. [PubMed] [Google Scholar]
- Panizzon MS, Fennema‐Notestine C, Eyler LT, Jernigan TL, Prom‐Wormley E, Neale M, Jacobson K, Lyons MJ, Grant MD, Franz CE, Xian H, Tsuang M, Fischl B, Seidman L, Dale A, Kremen WS (2009): Distinct genetic influences on cortical surface area and cortical thickness. Cereb Cortex 19:2728–2735. [DOI] [PMC free article] [PubMed] [Google Scholar]
- Panizzon MS, Fennema‐Notestine C, Kubarych TS, Chen C, Eyler LT, Fischl B, Franz CE, Grant MD, Hamza S, Jak A, Jernigan TL, Lyons MJ, Neale MC, Prom‐Wormley EC, Seidman L, Tsuang MT, Wu H, Xian H, Dale AM, Kremen WS (2012): Genetic and environmental influences of white and gray matter signal contrast: A new phenotype for Imaging genetics? Neuroimage 60:1686–1695. [DOI] [PMC free article] [PubMed] [Google Scholar]
- Paus T, Collins DL, Evans AC, Leonard G, Pike B, Zijdenbos A (2001): Maturation of the white matter in the human brain : A review of magnetic résonance studies. Brain Res Bull 54:255–266. [DOI] [PubMed] [Google Scholar]
- Rabinowicz T, Dean DE, Mc‐Donald‐Comber Petetot J, de Courten‐Myers GM (1998): Gender differences in the human cerebral cortex: More neurons in males; more process in females. J Child Neurol 14:98–107. [DOI] [PubMed] [Google Scholar]
- Rabinowicz T, Mac‐Donald‐Comber Petetot J, Gartside PS, Sheyn D, Sheyn T, de Courtens‐Myers GM (2002): Structure of the cerebral cortex in men and women. J Neuropathol Exp Neurol 61:46–47. [DOI] [PubMed] [Google Scholar]
- Rademacher J, Morosan P, Schormann T, Scheicher A, Werner C, Freund H, Zilles K (2001): Probabilistic mapping and volume measurement of human primary auditory cortex. Neuroimage 13:669–683. [DOI] [PubMed] [Google Scholar]
- Rakic P (1988): Specification of cerebral cortical areas. Science 24:170–176. [DOI] [PubMed] [Google Scholar]
- Rakic P (1995): A small step for the cell, a giant leap for mankind: A hypothesis of neocortical expansion during evolution. TINS 18:383–388. [DOI] [PubMed] [Google Scholar]
- Rakic P (2007): The radial edifice of cortical architecture: From neuronal silhouettes to genetic engineering. Brain Res Rev 55:204–219. [DOI] [PMC free article] [PubMed] [Google Scholar]
- Raznahan A, Shaw P, Lalonde F, Stockman M, Wallace GL, Greenstein D, Clasen L, Gogtay N, Giedd JN (2011): How does your cortex grow? J Neurosci 31:7174–7177. [DOI] [PMC free article] [PubMed] [Google Scholar]
- Rimol LM, Panizzon MS, Fennema‐Notestine C, Eyler LT, Fischl B, Franz CE, Hagler DJ, Lyons MJ, Neale MC, Pacheco J, Perry ME, Schmitt JE, Grant MD, Seidman LJ, Thermenos HW, Tsuang MT, Eisen SA, Kremen WS, Dale AM (2010): Cortical thickness is influenced by regionally specific genetic factors. Biol Psychiatry 67:493–499. [DOI] [PMC free article] [PubMed] [Google Scholar]
- Rosas HD, Liu AK, Hersch S, Glessner M, Ferrante RJ, Salat DH, van der Kouwe A, Jenkins BG, Dale AM, Fischl B (2002): Regional and progressive thinning of the cortical ribbon in Huntington's disease. Neurology 58: 695–701. [DOI] [PubMed] [Google Scholar]
- Salat DH, Lee SY, van der Kouwe AJ, Greve DN, Fischl B, Rosas HD (2009): Age‐associated alterations in cortical gray and white matter signal intensity and gray to white matter contrast. Neuroimage 48:21–28. [DOI] [PMC free article] [PubMed] [Google Scholar]
- Shaw P, Greenstein D, Lerch J, Clasen L, Lenroot R, Gogtay N, Evans A, Rapoport J, Giedd J (2006): Intellectual ability and cortical development in children and adolescents. Nature 440:676–679. [DOI] [PubMed] [Google Scholar]
- Shaw P, Kabani NJ, Lerch JP, Eckstrand K, Lenroot R, Gogtay N, Greenstein D, Clasen L, Evans A, Rapoport JL, Giedd JN, Wise SP (2008): Neurodevelopmental trajectories of the human cerebral cortex. J Neurosci 28:3586–3594. [DOI] [PMC free article] [PubMed] [Google Scholar]
- Shaw P, Lalonde F, Lepage C, Rabin C, Eckstrand BS, Sharp W, Greenstein D, Evans A, Giedd MD, Rapoport MD (2009): Development of cortical asymmetry in typically developing children and its disruption in attention‐deficit/hyperactivity disorder. Arch Gen Psychiatry 66:888–896. [DOI] [PMC free article] [PubMed] [Google Scholar]
- Shaw P, Malek M, Watson B, Sharp W, Evans A, Greenstein D (2012): Development of cortical surface area and gyrification in attention‐deficit/hyperactivity disorder. Biol Psychiatry 72:1–7. [DOI] [PMC free article] [PubMed] [Google Scholar]
- Sigalovsky IS, Fischl B, Melcher JR (2006): Mapping an intrinsic MR property of gray matter in auditory cortex of living humans: A possible marker for primary cortex and hemispheric differences. Neuroimage 32:1524–1537. [DOI] [PMC free article] [PubMed] [Google Scholar]
- Sowell ER, Peterson BS, Thompson PM, Welcome SE, Henkenius AL, Toga AW (2003): Mapping cortical change across the human life span. Nat Neurosci 6:309–315. [DOI] [PubMed] [Google Scholar]
- Sowell ER, Peterson BS, Kan E, Woods RP, Yoshii J, Bansal R, Xu D, Zhu H, Thompson PM, Toga AW (2007): Sex differences in cortical thickness mapped in 176 healthy individuals between 7 and 87 years of age. Cereb Cortex 17:1550–1560. [DOI] [PMC free article] [PubMed] [Google Scholar]
- Stark AK, Toft MH, Pakkenberg H, Fabricius K, Eriksen N, Pelvig DP, Moller M, Pakkenberg B (2007a): The effect of age and gender on the volume and size distribution of neocortical neurons. J Neurosci 150:121–130. [DOI] [PubMed] [Google Scholar]
- Stark AK, Petersen AO, Gardi J, Gundersen HJG, Pakkenberg B (2007b): Spatial distribution of human neocortical neurons and glial cells according to sex and age measured by the saucer method. J Neurosci Methods 164:19–26. [DOI] [PubMed] [Google Scholar]
- Su S, White T, Schmidt M, Kao CY, Sapiro G (2013): Geometric computation of human gyrification indexes from magnetic resonance images. Hum Brain Mapp 34:1230–1244. [DOI] [PMC free article] [PubMed] [Google Scholar]
- Tamnes CK, Ostby Y, Fjell AM, Westlye LT, Due‐Tonnessen P, Walhovd KB (2010): Brain maturation in adolescence and young adulthood: Regional age‐related changes in cortical thickness and white matter volume and microstructure. Cereb Cortex 20:534–548. [DOI] [PubMed] [Google Scholar]
- Thompson PM, Schwartz C, Lin RT, Khan AA, Toga A (1996): Three‐dimensional statistical analysis of sulcal variability in the human brain. J Neurosci 16:4261–4274. [DOI] [PMC free article] [PubMed] [Google Scholar]
- Toro R, Burnod Y (2005): A morphogenetic model for the development of cortical convolutions. Cereb Cortex 15:1900–1913. [DOI] [PubMed] [Google Scholar]
- Toro R, Perron M, Pike B, Richer L, Veillette S, Pausova Z, Paus T (2008): Brain size of the human cerebral cortex. Cereb Cortex 18:2352–2357. [DOI] [PubMed] [Google Scholar]
- Trachtenberg JT, Chen BE, Knott GW, Feng G, Sanes JR, Welker E, Svoboda K (2002): Long‐term in vivo imaging of experience‐dependent synaptic plasticity in adult cortex. Nature 420:788–794. [DOI] [PubMed] [Google Scholar]
- Van Essen DC, Drury HA, Joshi S, Miller MI (1997): Functional and structural mapping of human cerebral cortex: Solutions are in the surfaces. Proc Natl Acad Sci USA 95:788–795. [DOI] [PMC free article] [PubMed] [Google Scholar]
- Van Soelen IL, Brouwer RM, van Baal GC, Schnack HG, Peper JS, Collins DL, Evans AC, Kahn RS, Boomsma DI, Hulshoff Pol HE (2012): Genetic influences on thinning of the cerebral cortex during development. Neuroimage 59:3871–3880. [DOI] [PubMed] [Google Scholar]
- Wandell BA, Dumoulin SO, Brewer AA (2007): Visual field maps in human cortex. Neuron 56:366–383. [DOI] [PubMed] [Google Scholar]
- Welker W (1990): Why does cerebral cortex fissure and fold? A review of determinants of gyri and sulci. Cereb Cortex 8B:3–136. [Google Scholar]
- Wenger E, Schaefer S, Noack H, Kühn S, Mårtensson J, Heinze HJ, Düzel E, Bäckman L, Lindenberger U, Lövdén M (2012): Cortical thickness changes following spatial navigation training in adulthood and aging. Neuroimage 59:3389–3397. [DOI] [PubMed] [Google Scholar]
- Westlye LY, Walhovd KB, Dale MA, Bjornerud A, Due‐Tonnessen P, Engvig A, Grydeland H, Tamnes CK, Ostby Y, Fjell AM (2010): Differentiating maturational and aging‐related changes of the cerebral cortex by use of thickness and signal intensity. Neuroimage 52:172–185. [DOI] [PubMed] [Google Scholar]
- White T, Su S, Schmidt M, Kao CY, Sapiro G (2010): The development of gyrification in childhood and adolescence. Brain Cogn 72:36–45. [DOI] [PMC free article] [PubMed] [Google Scholar]
- Witelson SF, Glezer II, Kigar DL (1995): Women have greater density of neurons in posterior temporal cortex. J Neurosci 15:3418–3428. [DOI] [PMC free article] [PubMed] [Google Scholar]
- Zilles K, Schleicher A, Langemann C, Amunts K, Morosan P, Palomero‐Gallagher N, Schormann T, Mohlberg H, Bürgel U, Steinmetz H, Schlaug G, Roland PE (1997): Quantitative analysis of sulci in the human cerebral cortex: Development, gender difference, asymmetry, intersubject variability and cortical architecture. Hum Brain Mapp 5:218–221. [DOI] [PubMed] [Google Scholar]
- Zilles K, Armstrong E, Schleicher A, Kretschmann HJ (1988): The human pattern of gyrification in the cerebral cortex. Anat Embryol 179:173–179. [DOI] [PubMed] [Google Scholar]