

Abstract
Microstructural white matter deterioration is a frequent finding in mild cognitive impairment (MCI), potentially underlying default mode network (DMN) dysfunctioning. Thus far, microstructural damage in MCI has been attributed to Alzheimer's disease pathophysiology. A cerebrovascular role, in particular the role of cerebral small vessel disease (CSVD), received less interest. Here, we used diffusion tensor imaging (DTI) to examine the role of CSVD in microstructural deterioration within the normal appearing white matter (NAWM) in MCI. MCI patients were subdivided into those with (n = 20) and without (n = 31) macrostructural CSVD evidence on MRI. Using TBSS we performed microstructural integrity comparisons within the whole brain NAWM. Secondly, we segmented white matter tracts interconnecting DMN brain regions by means of automated tractography segmentation. We used NAWM DTI measures from these tracts as dependent variables in a stepwise‐linear regression analysis, with structural and demographical predictors. Our results indicated microstructural deterioration within the anterior corpus callosum, internal and external capsule and periventricular white matter in MCI patients with CSVD, while in MCI patients without CSVD, deterioration was restricted to the right perforant path, a tract along the hippocampus. Within the full cohort of MCI patients, microstructure within the NAWM of the DMN fiber tracts was affected by the presence of CSVD. Within the cingulum along the hippocampal cortex we found a relationship between microstructural integrity and ipsilateral hippocampal volume and the extent of white matter hyperintensity. In conclusion, we found evidence of CSVD‐related microstructural damage in fiber tracts subserving the DMN in MCI. Hum Brain Mapp 35:2836–2851, 2014. © 2013 Wiley Periodicals, Inc.
Keywords: mild cognitive impairment, cerebral small vessel disease, diffusion tensor imaging, default mode network
INTRODUCTION
Mild cognitive impairment (MCI) is a clinical construct that identifies individuals with cognitive impairment at high risk of dementia, in most cases Alzheimer's disease (AD) [Albert et al., 2011; DeCarli, 2003; Petersen, 2004]. Within the past decades, structural MRI has been used extensively to study this prodromal dementia stage, as it offers the opportunity to identify early structural brain changes in vivo. Numerous studies have identified MCI and ultimately AD related atrophy within the medial temporal lobe, temporal and parietal association regions, the cingulate gyrus and prefrontal cortex [Bozzali et al., 2006; Chetelat et al., 2005; Karas et al., 2004]. Other commonly encountered MRI findings in MCI are white matter hyperintensities (WMH) and lacunar infarcts [Targosz‐Gajniak et al., 2009; Yoshita et al., 2006], regarded as macrostructural MRI expressions of cerebral small vessel disease (CSVD). CSVD is a condition that affects the microvessels supplying the white matter and subcortical brain regions [Pantoni, 2010]. There is increasing evidence that CSVD and AD pathophysiological changes on MRI do not just coincide but may be interrelated [Bartzokis, 2004; Englund et al., 1988; Luchsinger et al., 2009; Nordahl et al., 2005; Targosz‐Gajniak et al., 2009; Villeneuve et al., 2011; Yoshita et al., 2006].
Initially, MRI studies largely focused on region of interest analysis [Dickerson et al., 2001; Jack et al., 2000], while the more current view is that widespread brain regions form interconnected neural networks encompassing multiple distinct brain regions. Research regarding neurodegeneration has therefore lately been more directed at these networks and network connectivity [Bai et al., 2008; Greicius et al., 2004]. A neural network often studied in MCI and AD is the default mode network [Buckner et al., 2008; Greicius et al., 2003; Raichle et al., 2001]. This network is known to be affected in several neurodegenerative conditions and thought to play a role in cognitive functions such as episodic memory [Greicius et al., 2004; Seeley et al., 2009]. Within functional networks, intact white matter representing structural connectivity, is very important for normal network functioning [Damoiseaux and Greicius, 2009; Greicius et al., 2009]. This implies that conditions affecting white matter structure can affect neural network functioning [Mayda et al., 2011; Rocca et al., 2010].
While an assessment of macrostructural white matter deterioration can be obtained by means of T2 weighted Fluid Attenuated Inversion Recovery (T2‐FLAIR) MRI, diffusion tensor imaging (DTI) can be used to non‐invasively examine white matter damage on a microstructural level. DTI is an MRI technique based on the diffusion properties of unbound water molecules. In the presence of physical boundaries or restrictions diffusion becomes anisotropic, directionally dependent, as water diffuses more rapidly in the direction aligned with an internal structure (axial diffusivity), instead of perpendicular to it (radial diffusivity). DTI measures are considered sensitive markers for white matter microstructural damage, as degradation of axons or demyelination will result in reduced restrictions, increased free diffusion of water, and consequently a decrease in anisotropy. Numerous previous studies have reported decreased fractional anisotropy (FA) and increased random or mean diffusivity (MD) in MCI and AD patients within a diversity of white matter regions, including (para)hippocampal white matter [Cherubini et al., 2010; Liu et al., 2011; Rogalski et al., 2009], posterior cingulate fasciculus/precuneus white matter [Bai et al., 2009; Liu et al., 2011; Kiuchi et al., 2009; Zhou et al., 2008], the cingulum [Bai et al., 2009; Bosch et al., 2012; Bozoki et al., 2012; Liu et al., 2011; Mielke et al., 2009], the corpus callosum [Bai et al., 2009; Bozoki et al., 2011; Chen et al., 2009; Zhuang et al., 2010], the uncinate fasciculus [Bosch et al., 2012; Kiuchi et al., 2009; Liu et al., 2011], and the inferior and superior longitudinal fasciculus [Bosch et al., 2012; Liu et al., 2011]. The nature of these microstructural white matter changes in MCI or AD patients is still a matter of debate. Some claim that microstructural deterioration is secondary to grey matter loss, so‐called Wallerian degeneration [Raff et al., 2002]. But the frequent co‐occurrence of CSVD in AD patients also points towards a role of vascular pathology [Zhuang et al., 2010]. Indeed, in MCI, microstructural white matter damage was found to correlate to macrostructural white matter changes such as WMH burden [Zhuang et al., 2010]. This relationship, however, was examined within the global white matter without controlling for WMH, like other DTI studies in MCI fail to control for the presence of WMH as well [Bai et al., 2009; Chua et al., 2009; Liu et al., 2011; Zhou et al., 2008; Zhuang et al., 2010]. This is an important issue, as we know that DTI measures differ within WMH regions [Horsfield and Jones, 2002], and in the normal appearing white matter (NAWM) in relationship to the presence and vicinity of WMH [Maillard et al., 2011; Vernooij et al., 2008].
In the present study we aim to gain more insight into mechanisms affecting white matter microstructural integrity in MCI, in particular examining the role of CSVD. For this purpose we used DTI, and to avoid WMH influencing our results as much as possible, we restricted our analyses specifically to the normal appearing white matter (NAWM). We compared NAWM DTI measures in MCI patients with and without CSVD and healthy controls globally, and furthermore examined the role of CSVD as well as structural AD changes in specific white matter tracts known to be important in default mode network functioning [Bai et al., 2009; Damoiseaux and Greicius, 2009; Teipel et al., 2010; van den Heuvel et al., 2008; van den Heuvel et al., 2009].
METHODS
Participants
We recruited MCI patients aged 65 years or older, from 2008 onwards, from outpatient clinics of the Departments of Neurology and Geriatrics of the Erasmus MC—University Medical Center Rotterdam, and 7 surrounding hospitals, on the basis of criteria by Petersen [2004]. These criteria include: (1) presence of cognitive complaint by patient or relatives; (2) impairment of one or more cognitive domains as determined by neuropsychological assessment; (3) preserved overall general functioning, with possible increased difficulty in the performance of activities of daily living; and (4) absence of dementia according to the DSM‐IV or NINCDS‐ADRDA criteria for dementia. In total 57 MCI patients were screened for study eligibility. We excluded patients with a previous neurological or psychiatric diagnosis negatively affecting cognition (e.g. major stroke, cerebral tumor, or depression) or contraindications for MRI (e.g. pacemaker or claustrophobia). After initial screening, 55 MCI patients underwent a structured interview, physical examination and brain MRI, including three‐dimensional T1‐weighted MRI, T2‐FLAIR MRI, and DTI. After MRI examinations we excluded four patients, two due to physical inability or refusal to undergo MRI when confronted with the MRI scanner, one due to incomplete DTI data collection, and one due to excessive head movement and consequently obvious blurring of the acquired data. Thus, for the present study, data of 51 MCI patients were available. Control subjects (n = 28), aged 65 years or older, were either relatives of MCI patients or were recruited by advertisement (e.g. posters and handouts) throughout the Erasmus MC. Controls did not meet any of the criteria for MCI, but were otherwise excluded on the basis of the same exclusion criteria as MCI patients. Controls underwent the exact same work up as MCI patients in this study. After MRI examinations we excluded two control participants on the basis of the quality of DTI imaging, caused by poor positioning of the head in the MRI head coil, and thus 26 controls were included in our study. All participants gave informed consent to the protocol of the study, which was approved by the medical ethics committee of the Erasmus MC, Rotterdam.
Structured Interview, Physical Examination
We collected data on demographics, medical history, and vascular risk factors during a structured interview. Level of education was assessed with a Dutch education scale, ranging from 1 (less than 6 years elementary school) to 7 (academic degree) [Verhage, 1964]. As measured twice during physical examination, we defined hypertension as systolic blood pressure ≥160 mm Hg or diastolic blood pressure ≥90 mm Hg, or the use of antihypertensive medication. We determined Apolipoprotein E (APOE) genotype in all participants. The mini mental state examination (MMSE) was employed as a global cognitive screening method, and indicator for disease severity [Perneczky et al., 2006].
Neuropsychological Assessment
Extensive neuropsychological assessment was used both in the definition and diagnosis of MCI patients. Trained neuropsychologists administered tests covering cognitive domains including episodic memory functioning (15‐word verbal learning test and the stories of the Rivermead Behavioural Memory Test), processing speed (Trail Making Test (TMT) part A and Stroop II), executive functioning (TMT part B and Stroop III), language (Boston Naming Test 60 items version and semantic fluency tasks, animals and occupations), visuospatial ability (Block Design of the Wechsler Adult Intelligence Scale III), and visuoconstructive ability (clock drawing, 14 points). For every neuropsychological test we calculated z‐scores, using the mean and standard deviation of the control group (z‐score = individual test score minus mean of controls, divided by standard deviation of controls), and subsequently constructed compound scores by averaging z‐scores for all cognitive domains. Visuospatial and visuoconstructive ability were represented by a single neuropsyhological test. The Stroop and TMT are cognitive tests in which a higher score indicates worse performance; therefore we multiplied all individual z‐scores for these tests with −1.
MRI Acquisition
We performed MR imaging on a 3.0 T MRI scanner with an 8‐channel head coil (HD platform, GE Healthcare, Milwaukee, WI). DTI data were acquired in the axial plane with a single shot echo‐planar imaging (EPI) sequence with 25 noncollinear directions and the following parameters: repetition time (TR) = 14,200 ms, echo time (TE) = 73.3 ms, acquisition matrix 128 × 64 (phase encoding, A‐P direction), field of view (FOV) 220 × 220 mm2, flip angle = 90°. Maximum b‐value was 1,000 s/mm2 and three volumes were acquired without diffusion weighting (b‐value = 0 s/mm2). We acquired 70 contiguous slices with a slice thickness of 2.0 mm in a total acquisition time of 7:06 min. High‐resolution three‐dimensional T1‐weighted structural MRI was acquired in the axial plane with the following parameters: TR = 10.4 ms, TE = 2.1 ms, TI = 300 ms, flip angle = 18°, acquisition matrix = 416 × 256, FOV = 250 × 175 mm2. In a total acquisition time of 4:57 min, we acquired 192 slices with a slice thickness of 1.6 mm and 0.8 mm overlap, resulting in an effective slice thickness of 0.8 mm. T2‐FLAIR MRI was obtained with the following parameters: TR = 8000 ms, TE = 120 ms, TI = 2,000 ms, acquisition matrix = 256 × 128, FOV = 210 × 210 mm2. We acquired 64 contiguous slices with a slice thickness of 2.5 mm in a total acquisition time of 3:13 min.
Visual Assessment of WMH and Lacunar Infarcts
Blinded for all clinical information, a neurologist (NDP), experienced in the assessment of CSVD on MRI, examined three‐dimensional T1‐weighted and T2‐FLAIR MRI images for the presence of lacunar infarcts and WMH. The extent of WMH was assessed using the semi‐quantitative rating scale of Fazekas et al. [2002]. This rating scale is used extensively in clinical practice. In line with the definition of CSVD on MRI used in previous studies [Frisoni et al., 2002], we defined the presence of CSVD as the presence of substantial WMH (Fazekas score 2 or higher) affecting both the posterior and anterior white matter regions and/or the presence of two or more lacunar infarcts. Based on these ratings we classified MCI patients as MCI patients with CSVD (n = 20) and MCI patients without CSVD (n = 31). In addition, we excluded three control subjects, as they met the criteria for CSVD on MRI, eventually including 23 controls without CSVD on MRI in our analyses. Although available (see below), we did not make use of automated brain tissue segmentation and volumetric analysis of WMH for this subdivision, as these ratings are highly dependent upon the studied cohort and therefore difficult to translate to clinical practice or compare to previous studies.
Automated MRI Brain Tissue Segmentation and Volumetric Analysis of WMH and Hippocampi
Based on the intensities of the three‐dimensional T1‐weighted and T2‐FLAIR MRI scans we used a validated k‐nearest neighbour classifier to automatically segment brain tissue into cerebrospinal fluid, grey matter, NAWM and WMH [de Boer et al., 2009; Vrooman et al., 2007]. We refer to Figure 1 for the distribution of WMH in all participants. We segmented hippocampi on the basis of the 3D T1‐weighted images by means of an automated method as described previously [den Heijer et al., 2010; van der Lijn et al., 2008]. Briefly, the two most important components of this method are a statistical intensity model and a spatial probability map. The intensity model describes the typical intensities of the hippocampus and the background. The spatial probability map is derived from the registration of multiple atlases and contains the probability of being part of the hippocampus for every voxel. In a comparison with manually traced hippocampal volumes, this method produced accurate results with a mean Dice similarity index of 0.867 [Van der Lijn et al., 2012]. Blinded for clinical information, all automated segmentations were visually inspected and if necessary, we manually corrected the segmentations using FSLview, part of FSL [Woolrich et al., 2009]. Finally, we assessed total intracranial volume (TIV).
Figure 1.
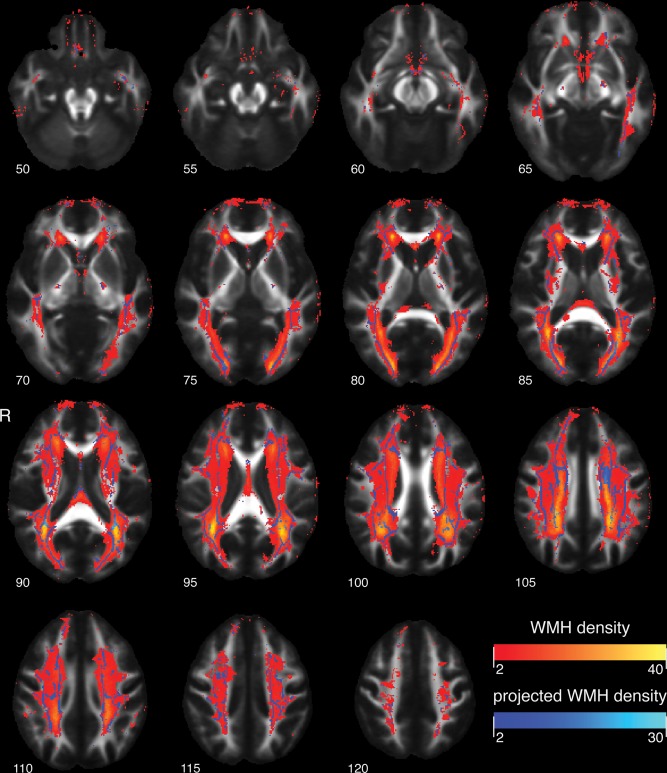
TBSS skeleton projections on white mater hyperintensity map in axial planes at different MNI 152 Z‐levels, overlaid on the mean FA image of the study participants. White matter hyperintensities range from red to yellow, indicating respectively voxelwise low to high prevalence of white matter hyperintensity. TBSS skeleton projections depicted in a range from dark blue to light blue, indicating respectively low to high prevalence of affected TBSS skeleton voxels. [Color figure can be viewed in the online issue, which is available at http://wileyonlinelibrary.com.]
DTI Data Processing
As a first step in DTI data processing, we corrected diffusion data for motion and Eddy currents by affine co‐registration of the diffusion weighted volumes to the average b = 0 s/mm2 volume. These registrations were performed using Elastix, an open source ITK based registration package [Klein et al., 2010]. The rotation component of each transformation was used to realign the gradient vector for each diffusion‐weighted volume to compensate for motion during the acquisition. Then, resampling of the transformed diffusion weighted images was performed at an isotropic resolution of 1.0 mm for the tensor fit, and 2.0 mm for the probabilistic tractography. For masking out non‐brain tissue, we used a multi‐atlas approach, which showed increased robustness against masking errors. This approach consists of three steps. First, we used the Brain Extraction Tool (BET) [Smith, 2002] from FSL 4.1.9, to identify brain tissue in three random subjects, and manually corrected the resulting masks using FSLview. Second, the corrected masks were transformed to individual subject space using a nonlinear co‐registration of the b = 0 s/mm2 volumes obtained with Elastix (three registrations per subject). Third, majority voting on the three transformed brain masks was used to obtain a final brain mask for each individual, which was then used to mask the diffusion data. We fitted diffusion tensors with a Levenberg‐Marquard non‐linear least squares optimization algorithm, available in ExploreDTI, on the 1.0 mm data. The eigenvalues of the fitted diffusion tensors were used to provide measures of FA, MD, λ ІІ (principal eigenvalue, axial diffusivity) and λ ⊥ (mean of the two smallest eigenvalues, radial diffusivity). The 2.0 mm data were used to fit a probabilistic model of fiber orientations for each voxel by means of Bedpostx [Behrens et al., 2007]. Afterwards, data quality was examined through visual inspection of axial FA slices 4 mm apart, combined with two coronal and two sagittal slices around the center of the brain.
DTI Data Analysis
To examine the role of CSVD in white matter microstructural damage in MCI, we used several DTI analysis techniques. All analyses were restricted to the NAWM by mapping the individual WMH segmentation masks, as obtained from automated tissue segmentation, to the DTI data and thus excluding voxels originating from WMH [Vernooij et al., 2008]. The first analysis technique involved examining DTI measures within the global NAWM (see DTI Data Analysis: Global NAWM Measurements). The second analysis technique included a whole brain explorative framework of Tract Based Spatial Statistics (TBSS, see DTI Data Analysis: Tract Based Spatial Statistics), to gain insight into the spatial distribution of white matter microstructural abnormalities related to CSVD in MCI patients. The third analysis technique we used was probabilistic tractography (see DTI Data Analysis: Probabilistic Tractography), by which we considered specific white matter tracts which are found to subserve normal default mode network functioning, i.e. the cingulum in the cingulate cortex (CGC), the cingulum along the hippocampal cortex (CGH) and the superior longitudinal fasciculus (SLF) [Damoiseaux and Greicius, 2009; Teipel et al., 2010; van den Heuvel et al., 2008, 2009]. In addition we included tracts that were found to be significantly affected in the whole brain TBSS analysis, as well as a control tract: the middle cerebellar peduncle (MCP). A control tract is a tract that remains unaffected by the disease process, in our case AD or CSVD [Kiuchi et al., 2009; Rose et al., 2000]. We extracted all tracts for every individual, and performed between group comparisons of DTI measures as well as regression analysis with DTI measurements within the NAWM of tracts as dependent variable. All of the above described between group analyses were corrected for the effects of age and sex.
DTI Data Analysis: Global NAWM Measurements
T1‐weighted images were co‐registered to the individuals' FA images using an affine registration with mutual information as similarity metric by means of FLIRT [Jenkinson and Smith, 2001]. We averaged DTI measures, FA, MD, λ ІІ, and λ ⊥ within the whole brain NAWM, using the tissue segmentation masks created in the automated MRI brain tissue segmentation in diffusion space, and subsequently compared these measures between groups.
DTI Data Analysis: Tract Based Spatial Statistics
For the TBSS analysis [Smith et al., 2006], we followed the default pipeline. In short, individual subjects' FA images were co‐registered to an FA template in standard MNI space. Next, a mean FA image was created and thinned to obtain a mean FA skeleton which represented the center of all tracts common to the entire group. We thresholded the white matter skeleton image at an FA value of 0.2 to constrain the analyses to those tracts that could reliably be identified. FA measurements were projected onto the white matter skeleton by searching the maximum FA value in a region perpendicular to the skeleton. This projection was performed in every skeleton voxel. MD, λ ⊥ and λ ІІ values and WMH status were then projected onto the white matter skeleton, using the same projection as for the FA. Hereafter, we performed voxelwise group comparisons while regressing out the linear effects of age and sex. All statistical analyses were corrected for multiple comparisons using 5,000 permutations in Randomise as available in FSL. We implemented the WMH exclusion by supplying voxelwise NAWM status masks per group to Randomise. Spatial clustering of results was performed with TCFE [Smith and Nichols, 2009].
DTI Data Analysis: Probabilistic Tractography
We performed automated probabilistic tractography in subject native space by means of Probtrackx, available in FSL. For these analyses we used standard space seed, target, stop and exclusion masks, which were based on protocols described by Mori et al. [2002], Stieltjes et al. [2001], Wakana et al. [2007], and Wakana et al. [2004]. The masks were transferred to subject‐native space using a nonlinear registration obtained with default settings for FA images in FNIRT. As mentioned before, tractography was performed for the CGC, CGH, SLF, and MCP. As the TBSS group statistics indicated that the genu of the corpus callosum was particularly affected in MCI patients with CSVD, we also extracted the forceps minor (FMI), the most prominent white matter tract within the genu of the corpus callosum, as an additional tract of interest. The tract density image for each tract was normalized by division with the total number of fiber paths recorded in the tract density image. These images were then thresholded at 0.005 to yield binary segmentations. Tracts that could not be identified using the automated protocols were treated as missing values. Individual diffusion measurements were averaged within the NAWM, i.e. excluding voxels that were classified as WMH. Mean FA, MD, λ ⊥ and λ ІІ resulting from the tractography‐based segmentations were compared between groups and used as dependent variables in a regression analysis.
Statistical Analysis
We compared demographics, neuropsychological data and imaging measures between groups using the statistical package SPSS (version 17.0 for Windows, Chicago, IL). Imaging and neuropsychological data comparisons were corrected for age, sex, and in case of neuropsychological data, education. Differences between groups on continuous variables were assessed with ANOVA or ANCOVA and post hoc two sample t‐tests. We compared non‐parametric data using Kruskal‐Wallis, followed by Mann‐Whitney U tests. Between‐group analyses of nominal variables were performed by means of Pearson χ 2 tests. To disentangle the role of CSVD in microstructural white matter damage in MCI, we performed a stepwise linear regression analysis within the full cohort of MCI patients, with DTI measures within the NAWM of (1) “tracts of interest” as obtained with probabilistic tractography, and (2) within the whole brain, as dependent variables. “Tracts of interest” were defined as the DTI measures within the segmented tracts that were found to show subtle differences between controls and the full cohort of MCI patients (p < 0.10, without correction for multiple comparisons, represented as bold and italic numbers in Table 3). Independent variables in the stepwise linear regression analysis were: WMH volume in ml (log transformed), presence of lacunar infarcts, TIV in ml, grey matter volume in ml, white matter volume in ml, left and right hippocampal volume in ml, age, sex, education, and the MMSE score as a measure of disease severity. We considered the model that predicted the most variance in the dependent variable. In all analyses a p value <0.05 was considered statistically significant.
Table 3.
Tract volumes and DTI measures within tracts of interest as extracted by means of probabilistic tractography
| FA | MD | λІІ | λ⊥ | |||||||||||||
|---|---|---|---|---|---|---|---|---|---|---|---|---|---|---|---|---|
| Tracts | Controls | Total MCI | MCI without CSVD | MCI CSVD | Controls | Total MCI | MCI without CSVD | MCI CSVD | Controls | Total MCI | MCI without CSVD | MCI CSVD | Controls | Total MCI | MCI without CSVD | MCI CSVD |
| CGC l | 0.51 (0.03) | 0.50 (0.04) | 0.51 (0.04) | 0.48 (0.03) | 1.53 (0.06) | 0.95 (0.06) | 0.94 (0.06) | 0.95 (0.06) | 1.53 (0.06) | 1.54 (0.10) | 1.55 (0.09) | 1.52 (0.13) | 0.63 (0.04) | 0.65 (0.06) | 0.64 (0.05) | 0.67 (0.05) |
| CGC r | 0.48 (0.04) | 0.47 (0.04) b | 0.48 (0.04) | 0.46 (0.04) | 1.51 (0.07) | 0.95 (0.07) | 0.96 (0.06) | 0.95 (0.09) | 1.51 (0.07) | 1.49 (0.11) | 1.51 (0.09) | 1.46 (0.13) | 0.66 (0.05) | 0.68 (0.06) | 0.68 (0.06) | 0.69 (0.07) |
| CGH l | 0.38 (0.03) | 0.36 (0.03) b | 0.37 (0.03) | 0.35 (0.03) | 1.44 (0.06) | 1.06 (0.08) a | 1.06 (0.09) | 1.07 (0.06) | 1.44 (0.06) | 1.49 (0.11) | 1.49 (0.12) | 1.48 (0.10) | 0.79 (0.06) | 0.85 (0.08) a | 0.84 (0.08) | 0.86 (0.06) |
| CGH r | 0.40 (0.03) | 0.38 (0.03) b | 0.38 (0.03) | 0.38 (0.04) | 1.46 (0.06) | 1.06 (0.08) a | 1.05 (0.08) | 1.08 (0.09) | 1.46 (0.06) | 1.51 (0.11) | 1.50 (0.11) | 1.53 (0.10) | 0.77 (0.06) | 0.83 (0.08) a | 0.82 (0.07) | 0.85 (0.09) |
| SLF l | 0.49 (0.02) | 0.48 (0.03) | 0.49 (0.03) | 0.47 (0.04) | 1.43 (0.05) | 0.92 (0.06) | 0.90 (0.06) | 0.95 (0.07) | 1.43 (0.05) | 1.44 (0.09) | 1.43 (0.08) | 1.46 (0.10) | 0.64 (0.03) | 0.66 (0.06) | 0.64 (0.05) | 0.69 (0.06) |
| SLF r | 0.48 (0.03) | 0.47 (0.03) | 0.48 (0.03) | 0.46 (0.03) | 1.44 (0.05) | 0.93 (0.07) | 0.92 (0.06) | 0.95 (0.07) | 1.44 (0.05) | 1.45 (0.10) | 1.44 (0.09) | 1.47 (0.11) | 0.65 (0.04) | 0.68 (0.06) | 0.66 (0.06) | 0.70 (0.05) |
| FMI | 0.55 (0.03) | 0.51 (0.04) a | 0.53 (0.03) | 0.49 (0.04) | 1.65 (0.05) | 1.01 (0.07) | 0.99 (0.07) | 1.02 (0.08) | 1.65 (0.05) | 1.66 (0.10) | 1.66 (0.10) | 1.65 (0.11) | 0.63 (0.05) | 0.68 (0.07) | 0.66 (0.06) | 0.71 (0.08) |
| MCP | 0.52 (0.04) | 0.53 (0.04) | 0.52 (0.05) | 0.54 (0.04) | 1.59 (0.11) | 1.00 (0.12) | 1.01 (0.13) | 0.98 (0.09) | 1.59 (0.11) | 1.63 (0.15) | 1.64 (0.15) | 1.61 (0.13) | 0.68 (0.07) | 0.69 (0.12) | 0.70 (0.13) | 0.66 (0.08) |
Values are unadjusted means (standard deviation). MD, λ ІІ, λ ⊥ shown as 10−3. Bold and italic numbers represent those tracts and DTI measures that were subsequently selected for stepwise regression analyses.
Differences between the total MCI patient group and controls were analyzed by means of ANCOVA corrected for age and sex: p <0.05 in comparison with controls.
Differences between the total MCI patient group and controls were analyzed by means of ANCOVA corrected for age and sex: p < 0.10 in comparison with controls.
RESULTS
Participant Characteristics and Neuropsychological Data
Characteristics and neuropsychological data of MCI patients and controls are presented in Table 1. In comparison with controls, MCI patients with CSVD were on average 4.8 years older (age range controls: 65.4–83.8 years; age range MCI patients without CSVD: 65.9‐81.0 years; age range MCI patients with CSVD: 68.4–88.1 years), and showed a higher prevalence of APOE4 genotyping (prevalence in 72% of MCI with CSVD cases, and in 25% of control cases). MCI patients with CSVD more often had hypertension compared with MCI patients without CSVD (respectively, prevalence in 85% and 42%). Summarizing the neuropsychological data, MCI patients with and without CSVD showed a cognitive profile of prominent memory impairment, dysexecutive functioning, and language problems, when compared with controls. In addition, MCI patients without CSVD showed impairment of processing speed. There were no differences in cognition between MCI patient groups.
Table 1.
Characteristics and neuropsychological test results of controls and MCI patients with and without cerebral small vessel disease
| Controls (n = 23) | Total MCI group (n = 51) | MCI without CSVD (n = 31) | MCI with CSVD (n = 20) | |
|---|---|---|---|---|
| Age (yr) | 70.9 (5.0) | 74.1 (4.9)a | 73.1 (4.3) | 75.7 (5.4)a |
| Sex, women (%) | 10 (0.43) | 14 (0.27) | 7 (0.23) | 7 (0.35) |
| Education | 5.4 (1.2) | 5.2 (1.3) | 5.0 (1.4) | 5.4 (1.2) |
| MMSE | 28.9 (1.1) | 27.2 (1.9)a | 27.0 (2.0)a | 27.4 (1.8)a |
| Hypertension, prevalence (%) | 15 (0.65) | 30 (0.58) | 13 (0.42) | 17 (0.85)b |
| Smoking, prevalence (%)c | 13 (0.57) | 34 (0.67) | 19 (0.61) | 15 (0.75) |
| APOE −/ε4, prevalence (%)d | 5 (0.25) | 27 (0.56)a | 14 (0.47) | 13 (0.72)a |
| APOE ε4/ε4, prevalence (%)d | 0 (0.00) | 5 (0.10) | 2 (0.07) | 3 (0.17) |
| Memory | 0.00 (0.72) | −1.73 (0.65)a | −1.70 (0.65)a | −1.76 (0.68)a |
| Processing speed | 0.00 (0.90) | −0.41 (0.84) | −0.40 (0.84) | −0.43 (0.88) |
| Executive function | 0.00 (0.92) | −0.92 (1.34)a | −0.83 (1.22) | −1.07 (1.55)a |
| Language | 0.00 (0.75) | −0.98 (1.09)a | −1.11 (1.26)a | −0.78 (0.76) |
| Visuospatial ability | 0.00 (1.00) | −0.36 (1.08) | −0.41 (1.03) | −0.28 (1.21) |
| Visuoconstructive ability | 0.00 (1.00) | −0.68 (1.54) | −0.56 (1.77) | −0.87 (1.11) |
Values are unadjusted means (standard deviation), number of participants (percentages), or in case of neuropsychological data unadjusted z‐score means (standard deviation).
MCI: mild cognitive impairment. CSVD: cerebral small vessel disease. MMSE: mini mental state examination. APOE: apolipoprotein E.
Differences between groups analyzed by means of independent sample t‐test, χ 2 test, or in case of neuropsychological data ANCOVA corrected for age, sex and education: p < 0.05 compared with controls.
Differences between groups analyzed by means of independent sample t‐test, χ 2 test, or in case of neuropsychological data ANCOVA corrected for age, sex and education: p <0.05 compared with MCI patients without CSVD.
Prevalence current and former smoking.
Missing data for two MCI patients with CSVD, one MCI patient without CSVD, and three healthy controls.
MRI Characteristics
After correction for age and sex, MCI patients with CSVD by definition more often had lacunar infarcts and more severe WMH burden, as reflected by higher Fazekas scores and higher WMH volume, compared with controls as well as MCI patients without CSVD (Table 2). Relative to controls, both MCI patient groups showed significant lower hippocampal volumes, with no differences between MCI patients with and without CSVD. MCI patients with CSVD showed significantly lower FA of the global NAWM compared with controls as well as MCI patients without CSVD (Table 2).
Table 2.
MRI characteristics for controls and MCI patients with and without cerebral small vessel disease
| Controls (n = 23) | Total MCI group (n = 51) | MCI without CSVD (n = 31) | MCI with CSVD (n = 20) | |
|---|---|---|---|---|
| WMH, Fazekas scorea | 1 (0; 1) | 1 (1; 2)b | 1 (0; 1) | 2 (2; 2)b, c |
| Lacunar infarcts, presence (%) | 2 (7.7) | 12 (23.5) | 3 (9.7) | 9 (45.0)b, c |
| TIV in ml | 1,085.6 (88.4) | 1,123.7 (134.3) | 1,131.7 (122.2) | 1,111.3 (153.7) |
| Grey matter (ml) | 445.9 (56.9) | 453.8 (69.2) | 462.7 (60.8) | 439.9 (80.5) |
| White matter (ml) | 415.9 (38.2) | 402.8 (51.4)b | 412.3 (49.2) | 387.9 (52.4)b |
| WMH (ml)a | 13.1 (10.6; 21.4) | 19.9 (14.1; 30.7)b | 16.0 (10.5; 19.9) | 33.8 (25.7; 50.4)b, c |
| Left hippocampus (ml) | 3.13 (0.40) | 2.78 (0.53)b | 2.76 (0.51)b | 2.80 (0.57) |
| Right hippocampus (ml) | 3.05 (0.41) | 2.80 (0.42)b | 2.80 (0.43)b | 2.81 (0.42)b |
| FA NAWM whole brain | 0.39 (0.02) | 0.38 (0.02) | 0.38 (0.02) | 0.37 (0.02)b, c |
| MD NAWM whole brain | 0.95 (0.03) | 0.99 (0.10) | 0.99 (0.12) | 0.99 (0.08) |
| λ ІІ NAWM whole brain | 1.37 (0.03) | 1.41 (0.16) | 1.42 (0.19) | 1.38 (0.09) |
| λ ⊥ NAWM whole brain | 0.74 (0.04) | 0.79 (0.08) | 0.78 (0.09) | 0.79 (0.07) |
Values are unadjusted means (standard deviation); or number of participants (percentages).
MCI: mild cognitive impairment. CSVD: cerebral small vessel disease. TIV: total intracranial volume. WMH: white matter hyperintensities. NAWM: normal appearing white matter. MD, λ ІІ, λ ⊥ measures in 10−3.
Median (interquartile range).
Differences between groups analyzed by means of ANCOVA corrected for age and sex, Mann‐Whitney U test or χ 2 tests: p < 0.05 compared with controls.
Differences between groups analyzed by means of ANCOVA corrected for age and sex, Mann‐Whitney U test or χ 2 tests: p < 0.05 compared with MCI patients without CSVD.
Tract Based Spatial Statistics
After correction for age and sex, analyses within the NAWM‐skeleton showed no differences for MD, λ ІІ or λ ⊥ in MCI patients relative to controls, but decreased FA in the right perforant path. This difference was driven by MCI patients without CSVD, as they showed a significant FA decrease in the same region in comparison with controls (Fig. 2A). Relative to controls, MCI patients with CSVD showed decreased FA and increased λ ⊥ in the genu of the corpus callosum (CC), the bilateral internal and external capsule as well as periventricular white matter regions (Fig. 2B). Compared with MCI patients without CSVD, MCI patients with CSVD showed even more pronounced decreased FA (Fig. 2C) and increased λ ⊥ (Fig. 2D) in these same regions.
Figure 2.

A) Significantly decreased FA in MCI patients without CSVD relative to controls. B) Significantly decreased FA in MCI patients with CSVD relative to controls. C) Significantly decreased FA in MCI patients with CSVD relative to MCI patients without CSVD. D) Significantly increased perpendicular diffusivity in MCI patients with CSVD relative to MCI patients without CSVD. [Color figure can be viewed in the online issue, which is available at http://wileyonlinelibrary.com.]
Automated Probabilistic Tractography
The automated segmented tracts are shown in Figure 3. Not all selected white matter tracts could be identified with the automated probabilistic tractography approach, as the left and right CGC were identified in 60 out of 74 participants. All other tracts were identified in all subjects. Tables 3 and 4 summarize the DTI measures within the extracted tracts' NAWM and the whole brain NAWM respectively. The primary goal of Table III was to use it as a signal detection tool to select those tracts and DTI measures that showed subtle differences between the total MCI patient group and controls (p < 0.10, without correction for multiple comparisons, represented as bold and italic numbers in Table 3). None of the comparisons between the control group and the total MCI group were significant using a Bonferroni multiple comparisons correction (32 comparisons for FA, MD, λ ІІ and λ ⊥; controls vs. total MCI group).
Figure 3.
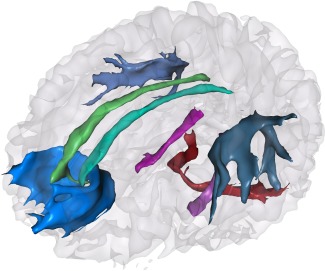
Probabilistic tractography of tracts of interest and control tract in a single subject, blue: forceps minor; light and dark green: left and right cingulum cingulate part; light and dark purple: left and right cingulum hippocampus part; light and dark grey: left and right superior longitudinal fasciculus; red: middle cerebellar peduncle. [Color figure can be viewed in the online issue, which is available at http://wileyonlinelibrary.com.]
Table 4.
Tract volumes and percentages of WMH per tract in controls and MCI patients
| Tracts | Tract volumes | % WMH per tract | ||||||
|---|---|---|---|---|---|---|---|---|
| Controls | Total MCI | MCI without CSVD | MCI CSVD | Controls | Total MCI | MCI without CSVD | MCI CSVD | |
| CGC l | 1,490.3 (302.4) | 1,474.4 (230.3) | 1,465.6 (263.2) | 1,492.0 (152.2) | 0.02 (0.06) | 0.06 (0.20) | 0.04 (0.18) | 0.10 (0.24) |
| CGC r | 1,392.8 (228.1) | 1,404.1 (262.3) | 1,412.3 (274.8) | 1,388.9 (246.4) | 0.01 (0.05) | 0.20 (0.82) | 0.01 (0.03) | 0.56 (1.34) |
| CGH l | 1,362.9 (225.4) | 1,367.8 (268.0) | 1,349.8 (244.7) | 1,395.8 (305.0) | 0.18 (0.27) | 0.41 (0.92) | 0.23 (0.48) | 0.70 (1.32) |
| CGH r | 1,345.0 (190.0) | 1,344.4 (235.7) | 1,308.4 (243.7) | 1,400.3 (216.8) | 0.09 (0.11) | 0.39 (0.70) | 0.22 (0.31) | 0.66 (1.01) |
| SLF l | 4,416.4 (478.4) | 4,279.7 (815.0) | 4,512.2 (760.4) | 3,919.4 (781.3) | 1.61 (1.95) | 5.69 (10.50) | 1.52 (1.67) | 12.16 (14.6) |
| SLF r | 4,087.6 (533.6) | 3,986.0 (795.5) | 4,096.1 (731.4) | 3,815.5 (877.8) | 1.68 (2.18) | 6.02 (11.3) | 1.41 (1.61) | 13.15 (15.67) |
| FMI | 6,813.9 (948.1) | 6,040.9 (1,184.8) | 6,235.3 (1,005.1) | 5,739.5 (1,393.5) | 0.73 (0.87) | 0.19 (0.40) | 0.61 (0.56) | 3.78 (5.84) |
| MCP | 4,102.9 (923.4) | 3,709.4 (1,044.8) | 3,585.1 (1,132.6) | 3,902.0 (885.0) | 0.00 (0.00) | 0.00 (0.00) | 0.00 (0.00) | 0.00 (0.00) |
Values are unadjusted means of tract volumes in mm3, or mean percentages (standard deviation).
Regression Analyses of Tracts of Interest and Whole Brain NAWM
We analyzed the predictive value of several determinants on white matter microstructure within the full cohort of MCI patients. The analyses for the tracts of interest were restricted to tracts and DTI measures that differed (p < 0.10) between the full cohort of MCI patients and controls (bold and italic numbers in Table 3). For the left and right CGH, left and right hippocampal volume respectively were the most important determinants for FA and λ ⊥, with WMH volume as second most important determinant in left CGH FA and λ ⊥ (Table 5). In these tracts lower hippocampal volume and higher WMH volume were associated with lower FA and higher λ ⊥ values (Table 5). Within the FMI, WMH volume was the most important determinant for FA, followed by age. In this tract, higher WMH volume and higher age were associated with lower FA values. The stepwise regression analyses within the whole brain NAWM showed that WMH volume and left hippocampal volume were significant predictors of FA within whole brain NAWM, and age at scan for λ ⊥ within whole brain NAWM.
Table 5.
Results of the stepwise regression model in tracts of interest and whole brain NAWM
| Dependent variable | Predictors | β value | Significance |
|---|---|---|---|
| FA CGC r | White matter volume | 0.638 | <0.001 |
| FA CGH l | Left hippocampal volume; WMH volume | 0.530; −0.327 | <0.001; 0.012 |
| FA CGH r | Right hippocampal volume | 0.392 | 0.005 |
| FA FMI | WMH volume; age at time of scan | −0.492; −0.343 | <0.001; 0.004 |
| MD CGH l | Age at time of scan | 0.385 | 0.006 |
| MD CGH r | — | ||
| λ(CGH l) | Left hippocampal volume; WMH volume | −0.521; 0.383 | <0.001; 0.003 |
| λ(CGH r) | White matter volume; TIV volume | −0.810; 0.597 | 0.003; 0.035 |
| FA whole brain NAWM | WMH volume; left hippocampal volume | −0.493; 0.260 | <0.001; 0.049 |
| MD whole brain NAWM | — | — | — |
| λ ІІ Whole brain NAWM | — | — | — |
| λ ⊥ whole brain NAWM | Age at time of scan | 0.328 | 0.019 |
Significant predictors in a stepwise regression model. Volumes in ml. Beta values are standardized coefficients.
WMH: white matter hyperintensity. TIV: total intracranial volume.
DISCUSSION
In the present study we examined the role of CSVD, represented by the extent of WMH and the presence of lacunar infarcts, in white matter microstructure deterioration in MCI. We found microstructural changes in several NAWM regions throughout the brain in MCI patients with CSVD as compared with controls and MCI patients without CSVD. Moreover, the presence of macrostructural manifestations of CSVD on MRI in patients with MCI was found to be one of the most important determinants of microstructural deterioration within the NAWM of fiber tracts interconnecting several brain regions involved in the default mode network, as well as within the whole brain NAWM.
Strengths of the present study are first, that all our analyses were restricted to the NAWM. As it is known that the white matter microstructure is affected in WMH regions [Horsfield and Jones, 2002], global white matter analyses would be biased by WMH load. Second, the subdivision of MCI patients into MCI patients with and without CSVD was based on a semi‐quantitative rating scale often used in clinical practice [Fazekas et al., 2002]. Therefore, our results can easily be translated to common clinical practice and other studies. While this is an important advantage of the use of this rating scale, it has to be noted that WMH on FLAIR MRI are recently found to represent the tail of a continuous distribution of white matter damage [de Groot et al., 2013; Maillard et al., 2011], and dichotomization of CSVD on the basis of visually appreciable WMH can therefore be questionable. A final strength of this study was the fact that we used several advanced DTI post processing techniques as well as automated MRI tissue segmentation. By using an automated tractography procedure based on standard masks, we avoided the subjectivity and reproducibility issues of manually drawing and placing ROIs as a starting point for tractography. A limitation of our study is the lack of information on biomarkers reflecting amyloid β in our MCI population, as suggested by Albert et al. [2011]. While this information may have aided in our knowledge of etiology in our clinical cohort of MCI patients, the use of particularly amyloid positron emission tomography in a clinical setting is hampered by the fact that it still requires further longitudinal research, and is not widely available for clinical practice. The information we have on APOE4 status in the MCI patient groups is difficult to interpret, as prevalence is higher in MCI patients with CSVD as compared with MCI patients without CSVD (respectively 72% and 47%). This can be explained by the fact that APOE4 status is associated with AD pathophysiology as well as arteriosclerosis [Yip et al., 2005] and cerebral infarction [Schneider et al., 2005]. The role of APOE4 in vascular or mixed (AD and vascular) conditions however, has yet to be further elucidated. Another limitation is the age difference between controls and MCI patients, as a result of our inclusion method. Although control subjects had to be at least 65 years of age, they were not specifically age or sex matched with MCI patients. While we expect that we have dealt with this potential problem by regressing out the effects of age and sex in all between group analyses, there is a possibility that there are still residual confounding effects of age. A final possible limitation is the use of relatively new analysis techniques like probabilistic tractography, as there are no gold standards yet available for these advanced methods. For example, we made use of a threshold of 0.005 on the basis of apparent similarity between the resulting masks and delineations as obtained with deterministic tractography protocols of Mori et al. [2002], Stieltjes et al. [2001], Wakana et al. [2007], and Wakana et al. [2004]. While we have to aknowledge that this may affect our segmentation results, it is important to note that probabilistic tractography is less constrained by thresholds on the diffusion measurements than deterministic tractography approaches, which adds to its robustness.
In MCI patients with CSVD we found damage of the NAWM microstructure in several WM regions throughout the brain, namely within the genu of the corpus callosum, the internal and external capsule bilaterally and periventricular white matter regions. These findings are in line with a recent DTI study of patients with subcortical ischemic vascular dementia, in which the same fiber tracts were found to be affected [Chen et al., 2009]. Our findings furthermore suggest that NAWM microstructural changes are associated with the presence of CSVD in MCI, which is in line with studies in healthy elderly [O'Sullivan et al., 2001; Vernooij et al., 2008], and in diseased elderly [Maillard et al., 2011]. Most previous DTI studies in MCI however failed to control for WMH load or any other expression of CSVD on MRI [Bai et al., 2009; Chua et al., 2009; Liu et al., 2011; Zhou et al., 2008; Zhuang et al., 2010], and subsequently attribute findings of widespread microstructural damage to AD‐related neurodegeneration [Bai et al., 2009; Sexton et al., 2011; Zhuang et al., 2010]. Even though it was shown that the widespread pattern of white matter deterioration cannot be explained by grey matter atrophy [Xie et al., 2006]. In line with a recent study of De Groot et al. [2013], we would suggest that the changes in the NAWM microstructure specifically found in MCI patients with CSVD and not in those without CSVD represent an early stage of vascular damage preceding the development of macrostructural lesions in the NAWM [O'Sullivan et al., 2001; Schmidtke and Hull, 2005; Maillard et al., 2011, 2013].
Relative to controls, MCI patients without CSVD showed microstructural deterioration within the right perforant path, a fiber tract connecting the entorhinal cortex and the hippocampus [Witter et al., 2000], thought to play an important role in the limbic system [Thal et al., 2000]. This finding within a group of MCI patients with a clinical, cognitive and pathophysiological profile of early AD without any macrostructural and clinical signs of vascular interference is in line with other DTI studies in MCI and AD, that reported either anterior temporal lobe microstructural damage, or specific perforant path deterioration [Damoiseaux et al., 2009; Kalus et al., 2006; Rogalski et al., 2009]. Moreover, Damoiseaux et al. [2009] found DTI changes in AD confined to the anterior temporal lobe in a whole brain TBSS analysis, when explicitly excluding subjects with macrostructural white matter abnormalities on MRI. Our results are furthermore consistent with current knowledge of neuropathological processes in AD [Braak and Braak, 1991], in which the entorhinal cortex, hippocampus and other regions in the medial temporal lobe are known to be affected early in the disease process.
There is much debate concerning the pathophysiology underlying white matter abnormalities in MCI. One theory states that microstructural changes occur as a process secondary to grey matter atrophy, so‐called Wallerian degeneration [Raff et al., 2002; Sexton et al., 2011]. Changes in CGH microstructural integrity were for example found to be related to atrophy of the hippocampal formation [Sydykova et al., 2007; Villain et al., 2008]. Another theory focuses on the role of microvascular changes in white matter pathology, i.e. a process directly affecting the white matter [Sexton et al., 2011]. Within the full cohort of MCI patients we found a relationship between CGH microstructure and ipsilateral hippocampal volume as well as the presence and extent of macrostructural manifestations of CSVD, in terms of WMH and lacunar infarcts. These results suggest that default mode network associated fiber tracts may be damaged in MCI as the consequence of both grey matter related Wallerian neurodegenerative and vascular effects. In the present study though, other fiber tracts thought to be important in default mode network functioning were found only to be affected in MCI patients with CSVD, even when compared with MCI patients without CSVD. Thus, although we did find evidence for grey matter related Wallerian related microstructure deterioration, vascular effects seem to be most prominent. The localization of a tract might be decisive here, as tracts nearby the ventricles are known and shown to be susceptible to vascular damage (the FMI) [de Reuck, 1971; Longstreth et al., 1996], while tracts connecting degenerating grey matter regions show influence of atrophy, i.e. Wallerian influence (the CGH, the perforant path), and white matter near the brain stem was not affected (the MCP). To examine the grey matter related Wallerian influence more closely, a voxel based morphometry (VBM) analysis, in which VBM measures within distinct brain regions are related to DTI measures will be particularly interesting.
We measured white matter microstructure not only in terms of FA and MD, but also with respect to the directional properties of diffusion, i.e. axial and perpendicular diffusivity. Studies in mice suggest that a difference in the pathophysiology underlies axial and perpendicular diffusivity, as axial diffusivity was found to relate to axonal injury while perpendicular diffusivity was linked to myelin damage [Song et al., 2005; Sun et al., 2006]. In the current study we found that axial diffusivity was less sensitive in distinguishing MCI patients from controls compared with the other DTI measures, suggesting little axonal injury in our MCI patient cohort. Perpendicular diffusivity increase was found primarily in MCI patients with CSVD compared to either controls or MCI patients without CSVD. This indicates that the underlying pathophysiology in our cohort of MCI patients with CSVD would primarily be myelin loss. Interestingly, myelin damage was found to be associated with transmission velocity reduction [Bartzokis, 2004], which might be the link between changes in myelin basic protein and the typical cognitive profile of decreased psychomotor speed in elderly with CSVD [Prins et al., 2005; Wang et al., 2004].
The pathological mechanisms of Alzheimer's disease and cerebral vascular damage have traditionally been considered separate, sometimes even mutually exclusive [Erkinjuntti and Gauthier, 2009; Frisoni et al., 2002]. The fact that in a large proportion of dementia cases underlying pathology was mixed, i.e. combined vascular and neurodegenerative pathology at autopsy, as well as on MRI [Englund et al., 1988; Reed et al., 2007; Targosz‐Gajniak et al., 2009], contradicts this view. In the present study we show that grey matter atrophy related to AD and vascular damage both affect the white matter. Whether the different pathological processes influence each other, as suggested by studies reporting a reciprocal effect of vascular insufficiency promoting neurodegenerative changes and vice versa [Iadecola, 2010], are synergistic or additive to the clinical and cognitive syndrome has yet to be further elucidated. We however think that where AD pathology affects mainly the grey matter, CSVD is responsible for the majority of white matter damage in MCI, thereby affecting the white matter interconnecting important grey matter regions, and interfering with neuronal network functioning.
CONCLUSION
This study indicates that in patients with MCI, CSVD affects the brain's white matter more extensively than the macrostructural findings visible on T2‐FLAIR imaging. We found evidence of vascular disease related microstructural damage in important fiber tracts that subserve the default mode network. We postulate that such damage interferes with the normal functioning of the default mode network and consequently cognitive functioning in MCI. Our results also highlight a probable role for atrophy driven degeneration of white matter microstructure and therefore point towards a neuropathological white matter substrate in MCI in which both direct vascular damage and grey matter atrophy related Wallerian degeneration play a role.
ACKNOWLEDGMENTS
The authors acknowledge Dr. E.A.C.M. Sanders, Amphia ziekenhuis, Dr. H.J. Gilhuis, Reinier de Graaf ziekenhuis; Dr. G. Ziere and A.J. Arends, Havenziekenhuis Rotterdam; Dr. G.J. Lighthart, LangeLand ziekenhuis, Dr. J. Schuuring, Groene Hart ziekenhuis, J.J.M. Driessen, Vlietland ziekenhuis, and Dr. S.L.M. Bakker, Sint Franciscus Gasthuis for the referral of MCI patients.
REFERENCES
- Albert MS, DeKosky ST, Dickson D, Dubois B, Feldman HH, Fox NC, Gamst A, Holtzman DM, Jagust WJ, Petersen RC, Snyder PJ, Carrillo MC, Thies B, Phelps CH (2011): The diagnosis of mild cognitive impairment due to Alzheimer's disease: Recommendations from the National Institute on Aging‐Alzheimer's Association workgroups on diagnostic guidelines for Alzheimer's disease. Alzheimers Dement 7:270–279. [DOI] [PMC free article] [PubMed] [Google Scholar]
- Bai F, Zhang Z, Watson DR, Yu H, Shi Y, Yuan Y, Qian Y, Jia J (2009): Abnormal integrity of association fiber tracts in amnestic mild cognitive impairment. J Neurol Sci 278:102–106. [DOI] [PubMed] [Google Scholar]
- Bai F, Zhang Z, Yu H, Shi Y, Yuan Y, Zhu W, Zhang X, Qian Y (2008): Default‐mode network activity distinguishes amnestic type mild cognitive impairment from healthy aging: A combined structural and resting‐state functional MRI study. Neurosci Lett 438:111–115. [DOI] [PubMed] [Google Scholar]
- Bartzokis G (2004): Age‐related myelin breakdown: A developmental model of cognitive decline and Alzheimer's disease. Neurobiol Aging 25:5–18; author reply 49–62. [DOI] [PubMed] [Google Scholar]
- Behrens TE, Berg HJ, Jbabdi S, Rushworth MF, Woolrich MW (2007): Probabilistic diffusion tractography with multiple fibre orientations: What can we gain?. Neuroimage 34:144–155. [DOI] [PMC free article] [PubMed] [Google Scholar]
- Bosch B, Arenaz‐Urquijo EM, Rami L, Sala‐Llonch R, Junqué C, Solé‐Padullés C, Peňa‐Gómez C, Bargalló N, Molinuevo JL, Bartrés‐Faz D (2012): Multiple DTI index analysis in normal aging, amnestic MCI and AD. Relationship with neuropsychological performance. Neurobiol Aging 33:61–74. [DOI] [PubMed] [Google Scholar]
- Bozoki AC, Korolev IO, Davis NC, Hoisington LA, Berger KL (2012): Disruption of limbic white matter pathways in mild cognitive impairment and Alzheimer's disease: A DTI/FDG‐PET study. Hum Brain Mapp 22:1792–1802. [DOI] [PMC free article] [PubMed] [Google Scholar]
- Bozzali M, Filippi M, Magnani G, Cercignani M, Franceschi M, Schiatti E, Castiglioni S, Mossini R, Falautano M, Scotti G, Comi G, Falini A (2006): The contribution of voxel‐based morphometry in staging patients with mild cognitive impairment. Neurology 67:453–460. [DOI] [PubMed] [Google Scholar]
- Braak H, Braak E (1991): Neuropathological stageing of Alzheimer‐related changes. Acta Neuropathol 82:239–259. [DOI] [PubMed] [Google Scholar]
- Buckner RL, Andrews‐Hanna JR, Schacter DL (2008): The brain's default network: Anatomy, function, and relevance to disease. Ann NY Acad Sci 1124:1–38. [DOI] [PubMed] [Google Scholar]
- Chen TF, Lin CC, Chen YF, Liu HM, Hua MS, Huang YC, Chiu MJ (2009): Diffusion tensor changes in patients with amnesic mild cognitive impairment and various dementias. Psychiatry Res 173:15–21. [DOI] [PubMed] [Google Scholar]
- Cherubini A, Péran P, Spoletini I, Di Paulo M, Di Iulio F, Hagberg GE, Scancesario G, Gianni W, Bossù P, Caltagirone C, Sabatini U, Spalletta G (2010): Structures of mild cognitive impiarment and Alzheimer's disease patients. J Alzheimers Dis 19:1273–1282. [DOI] [PubMed] [Google Scholar]
- Chetelat G, Landeau B, Eustache F, Mezenge F, Viader F, de la Sayette V, Desgranges B, Baron JC (2005): Using voxel‐based morphometry to map the structural changes associated with rapid conversion in MCI: a longitudinal MRI study. Neuroimage 27:934–946. [DOI] [PubMed] [Google Scholar]
- Chua TC, Wen W, Chen X, Kochan N, Slavin MJ, Trollor JN, Brodaty H, Sachdev PS (2009): Diffusion tensor imaging of the posterior cingulate is a useful biomarker of mild cognitive impairment. Am J Geriatr Psychiatry 17:602–613. [DOI] [PubMed] [Google Scholar]
- Damoiseaux JS, Greicius MD (2009): Greater than the sum of its parts: a review of studies combining structural connectivity and resting‐state functional connectivity. Brain Struct Funct 213:525–533. [DOI] [PubMed] [Google Scholar]
- Damoiseaux JS, Smith SM, Witter MP, Sanz‐Arigita EJ, Barkhof F, Scheltens P, Stam CJ, Zarei M, Rombouts SA (2009): White matter tract integrity in aging and Alzheimer's disease. Hum Brain Mapp 30:1051–1059. [DOI] [PMC free article] [PubMed] [Google Scholar]
- de Boer R, Vrooman HA, van der Lijn F, Vernooij MW, Ikram MA, van der Lugt A, Breteler MM, Niessen WJ (2009): White matter lesion extension to automatic brain tissue segmentation on MRI. Neuroimage 45:1151–1161. [DOI] [PubMed] [Google Scholar]
- de Groot M, Verhaaren BFJ, de Boer R, Klein S, Hofman A, van der Lugt A, Ikram MA, Niessen WJ, Vernooij MW (2013): Changes in normal‐appearing white matter precede development of white matter lesions. Stroke 44:1037–1042. [DOI] [PubMed] [Google Scholar]
- de Reuck J (1971): The human periventricular arterial blood supply and the anatomy of cerebral infarctions. Eur Neurol 5:321–334. [DOI] [PubMed] [Google Scholar]
- DeCarli C (2003): Mild cognitive impairment: Prevalence, prognosis, aetiology, and treatment. Lancet Neurol 2:15–21. [DOI] [PubMed] [Google Scholar]
- den Heijer T, van der Lijn F, Koudstaal PJ, Hofman A, van der Lugt A, Krestin GP, Niessen WJ, Breteler MM (2010): A 10‐year follow‐up of hippocampal volume on magnetic resonance imaging in early dementia and cognitive decline. Brain 133:1163–1172. [DOI] [PubMed] [Google Scholar]
- Dickerson BC, Goncharova I, Sullivan MP, Forchetti C, Wilson RS, Bennett DA, Beckett LA, deToledo‐Morrell L (2001): MRI‐derived entorhinal and hippocampal atrophy in incipient and very mild Alzheimer's disease. Neurobiol Aging 22:747–754. [DOI] [PubMed] [Google Scholar]
- Englund E, Brun A, Alling C (1988): White matter changes in dementia of Alzheimer's type. Biochemical and neuropathological correlates. Brain 111:1425–1439. [DOI] [PubMed] [Google Scholar]
- Erkinjuntti T, Gauthier S (2009): The concept of vascular cognitive impairment. Front Neurol Neurosci 24:79–85. [DOI] [PubMed] [Google Scholar]
- Fazekas F, Barkhof F, Wahlund LO, Pantoni L, Erkinjuntti T, Scheltens P, Schmidt R (2002): CT and MRI rating of white matter lesions. Cerebrovasc Dis 13(Suppl 2):31–36. [DOI] [PubMed] [Google Scholar]
- Frisoni GB, Galluzzi S, Bresciani L, Zanetti O, Geroldi C (2002): Mild cognitive impairment with subcortical vascular features: clinical characteristics and outcome. J Neurol 249:1423–1432. [DOI] [PubMed] [Google Scholar]
- Greicius MD, Krasnow B, Reiss AL, Menon V (2003): Functional connectivity in the resting brain: A network analysis of the default mode hypothesis. Proc Natl Acad Sci USA 100:253–258. [DOI] [PMC free article] [PubMed] [Google Scholar]
- Greicius MD, Srivastava G, Reiss AL, Menon V (2004): Default‐mode network activity distinguishes Alzheimer's disease from healthy aging: evidence from functional MRI. Proc Natl Acad Sci USA 101:4637–4642. [DOI] [PMC free article] [PubMed] [Google Scholar]
- Greicius MD, Supekar K, Menon V, Dougherty RF (2009): Resting‐state functional connectivity reflects structural connectivity in the default mode network. Cereb Cortex 19:72–78. [DOI] [PMC free article] [PubMed] [Google Scholar]
- Horsfield MA, Jones DK (2002): Applications of diffusion‐weighted and diffusion tensor MRI to white matter diseases—A review. NMR Biomed 15:570–577. [DOI] [PubMed] [Google Scholar]
- Iadecola C (2010): The overlap between neurodegenerative and vascular factors in the pathogenesis of dementia. Acta Neuropathol 120:287–296. [DOI] [PMC free article] [PubMed] [Google Scholar]
- Jack CR, Jr. , Petersen RC, Xu Y, O'Brien PC, Smith GE, Ivnik RJ, Boeve BF, Tangalos EG, Kokmen E (2000): Rates of hippocampal atrophy correlate with change in clinical status in aging and AD. Neurology 55:484–489. [DOI] [PMC free article] [PubMed] [Google Scholar]
- Jenkinson M, Smith S (2001): A global optimisation method for robust affine registration of brain images. Med Image Anal 5:143–156. [DOI] [PubMed] [Google Scholar]
- Kalus P, Slotboom J, Gallinat J, Mahlberg R, Cattapan‐Ludewig K, Wiest R, Nyffeler T, Buri C, Federspiel A, Kunz D, Schroth G, Kiefer C (2006): Examining the gateway to the limbic system with diffusion tensor imaging: the perforant pathway in dementia. Neuroimage 30:713–720. [DOI] [PubMed] [Google Scholar]
- Karas GB, Scheltens P, Rombouts SA, Visser PJ, van Schijndel RA, Fox NC, Barkhof F (2004): Global and local gray matter loss in mild cognitive impairment and Alzheimer's disease. Neuroimage 23:708–716. [DOI] [PubMed] [Google Scholar]
- Kiuchi K, Morikawa M, Taoka T, Nagashima T, Yamauchi T, Makinodan M, Norimoto K, Hashimoto K, Kosaka J, Inoue Y, Kichikawa K (2009) Brain Res 1287:184–191. [DOI] [PubMed] [Google Scholar]
- Klein S, Staring M, Murphy K, Viergever MA, Pluim JP (2010): elastix: A toolbox for intensity‐based medical image registration. IEEE Trans Med Imaging 29:196–205. [DOI] [PubMed] [Google Scholar]
- Liu Y, Spulber G, Lehtimaki KK, Kononen M, Hallikainen I, Grohn H, Kivipelto M, Hallikainen M, Vanninen R, Soininen H (2011): Diffusion tensor imaging and tract‐based spatial statistics in Alzheimer's disease and mild cognitive impairment. Neurobiol Aging 32:1558–1571. [DOI] [PubMed] [Google Scholar]
- Longstreth WT, Jr. , Manolio TA, Arnold A, Burke GL, Bryan N, Jungreis CA, Enright PL, O'Leary D, Fried L (1996): Clinical correlates of white matter findings on cranial magnetic resonance imaging of 3301 elderly people. The Cardiovascular Health Study. Stroke 27:1274–1282. [DOI] [PubMed] [Google Scholar]
- Luchsinger JA, Brickman AM, Reitz C, Cho SJ, Schupf N, Manly JJ, Tang MX, Small SA, Mayeux R, DeCarli C, Brown TR (2009): Subclinical cerebrovascular disease in mild cognitive impairment. Neurology 73:450–456. [DOI] [PMC free article] [PubMed] [Google Scholar]
- Maillard P, Fletcher E, Harvey D, Carmichael O, Reed B, Mungas D, DeCarli C (2011): White matter hyperintensity penumbra. Stroke 42:1917–1922. [DOI] [PMC free article] [PubMed] [Google Scholar]
- Maillard P, Carmichael O, Harvey D, Fletcher E, Reed B, Mungas D, DeCarli C (2013): FLAIR AND Diffusion MRI signals are independent predictors of white matter hyperintensities. AJNR Am J Neuroradiol 34:54–61. [DOI] [PMC free article] [PubMed] [Google Scholar]
- Mayda AB, Westphal A, Carter CS, DeCarli C (2011): Late life cognitive control deficits are accentuated by white matter disease burden. Brain 134:1673–1683. [DOI] [PMC free article] [PubMed] [Google Scholar]
- Mielke MM, Kozauer NA, Chan KCG, George M, Toroney J, Zerrate M, Bandeen‐Roche K, Wang MC, van Zijl P, Pekar JJ, Mori S, Lyketos CG, Albert M (2009): Regionally‐specific diffusion tensor imaging in mild cognitive impairment and Alzheimer's disease. Neuroimage 46:47–55. [DOI] [PMC free article] [PubMed] [Google Scholar]
- Mori S, Kaufmann WE, Davatzikos C, Stieltjes B, Amodei L, Fredericksen K, Pearlson GD, Melhem ER, Solaiyappan M, Raymond GV, Moser HW, van Zijl PC (2002): Imaging cortical association tracts in the human brain using diffusion‐tensor‐based axonal tracking. Magn Reson Med 47:215–223. [DOI] [PubMed] [Google Scholar]
- Nordahl CW, Ranganath C, Yonelinas AP, DeCarli C, Reed BR, Jagust WJ (2005): Different mechanisms of episodic memory failure in mild cognitive impairment. Neuropsychologia 43:1688–1697. [DOI] [PMC free article] [PubMed] [Google Scholar]
- O'Sullivan M, Summers PE, Jones DK, Jarosz JM, Williams SC, Markus HS (2001): Normal‐appearing white matter in ischemic leukoaraiosis: a diffusion tensor MRI study. Neurology 57:2307–2310. [DOI] [PubMed] [Google Scholar]
- Pantoni L (2010): Cerebral small vessel disease: from pathogenesis and clinical characteristics to therapeutic challenges. Lancet Neurol 9:689–701. [DOI] [PubMed] [Google Scholar]
- Perneczky R, Wagenpfeil S, Komossa K, Grimmer T, Diehl J, Kurz A (2006): Mapping scores onto stages: mini‐mental state examination and clinical dementia rating. Am J Geriatr Psychiatry 14:139–144. [DOI] [PubMed] [Google Scholar]
- Petersen RC (2004): Mild cognitive impairment as a diagnostic entity. J Intern Med 256:183–194. [DOI] [PubMed] [Google Scholar]
- Prins ND, van Dijk EJ, den Heijer T, Vermeer SE, Jolles J, Koudstaal PJ, Hofman A, Breteler MM (2005): Cerebral small‐vessel disease and decline in information processing speed, executive function and memory. Brain 128:2034–2041. [DOI] [PubMed] [Google Scholar]
- Raff MC, Whitmore AV, Finn JT (2002): Axonal self‐destruction and neurodegeneration. Science 296:868–871. [DOI] [PubMed] [Google Scholar]
- Raichle ME, MacLeod AM, Snyder AZ, Powers WJ, Gusnard DA, Shulman GL (2001): A default mode of brain function. Proc Natl Acad Sci USA 98:676–682. [DOI] [PMC free article] [PubMed] [Google Scholar]
- Reed BR, Mungas DM, Kramer JH, Ellis W, Vinters HV, Zarow C, Jagust WJ, Chui HC (2007): Profiles of neuropsychological impairment in autopsy‐defined Alzheimer's disease and cerebrovascular disease. Brain 130:731–739. [DOI] [PubMed] [Google Scholar]
- Rocca MA, Valsasina P, Absinta M, Riccitelli G, Rodegher ME, Misci P, Rossi P, Falini A, Comi G, Filippi M (2010): Default‐mode network dysfunction and cognitive impairment in progressive MS. Neurology 74:1252–1259. [DOI] [PubMed] [Google Scholar]
- Rogalski EJ, Murphy CM, deToledo‐Morrell L, Shah RC, Moseley ME, Bammer R, Stebbins GT (2009): Changes in parahippocampal white matter integrity in amnestic mild cognitive impairment: A diffusion tensor imaging study. Behav Neurol 21:51–61. [DOI] [PMC free article] [PubMed] [Google Scholar]
- Rose SE, Chen F, Chalk JB, Zelaya FO, Strugnell WE, Benson M, Semple J, Doddrell DM (2000): Loss of connectivity in Alzheimer's disease: An evaluation of white matter tract integrity with colour coded MR diffusion tensor imaging. J Neurol Neurosurg Psychiatry 69:528–530. [DOI] [PMC free article] [PubMed] [Google Scholar]
- Schmidtke K, Hull M (2005): Cerebral small vessel disease: how does it progress? J Neurol Sci 229:13–20. [DOI] [PubMed] [Google Scholar]
- Schneider JA, Bienias JL, Wilson RS, Berry‐Kavis E, Evans DA, Bennett DA (2005): The apolipoprotein E4 allele increases the odds of chronic cerebral infarction detected at autopsy in older persons. Stroke 36:954–959. [DOI] [PubMed] [Google Scholar]
- Seeley WW, Crawford RK, Zhou J, Miller BL, Greicius MD (2009): Neurodegenerative diseases target large‐scale human brain networks. Neuron 62:42–52. [DOI] [PMC free article] [PubMed] [Google Scholar]
- Sexton CE, Kalu UG, Filippini N, Mackay CE, Ebmeier KP (2011): A meta‐analysis of diffusion tensor imaging in mild cognitive impairment and Alzheimer's disease. Neurobiol Aging 32:e2325–e2318. [DOI] [PubMed] [Google Scholar]
- Smith SM (2002): Fast robust automated brain extraction. Hum Brain Mapp 17:143–155. [DOI] [PMC free article] [PubMed] [Google Scholar]
- Smith SM, Jenkinson M, Johansen‐Berg H, Rueckert D, Nichols TE, Mackay CE, Watkins KE, Ciccarelli O, Cader MZ, Matthews PM, Behrens TE (2006): Tract‐based spatial statistics: voxelwise analysis of multi‐subject diffusion data. Neuroimage 31:1487–1505. [DOI] [PubMed] [Google Scholar]
- Smith SM, Nichols TE (2009): Threshold‐free cluster enhancement: Addressing problems of smoothing, threshold dependence and localisation in cluster inference. Neuroimage 44:83–98. [DOI] [PubMed] [Google Scholar]
- Song SK, Yoshino J, Le TQ, Lin SJ, Sun SW, Cross AH, Armstrong RC (2005): Demyelination increases radial diffusivity in corpus callosum of mouse brain. Neuroimage 26:132–140. [DOI] [PubMed] [Google Scholar]
- Stieltjes B, Kaufmann WE, van Zijl PC, Fredericksen K, Pearlson GD, Solaiyappan M, Mori S (2001): Diffusion tensor imaging and axonal tracking in the human brainstem. Neuroimage 14:723–735. [DOI] [PubMed] [Google Scholar]
- Sun SW, Liang HF, Le TQ, Armstrong RC, Cross AH, Song SK (2006): Differential sensitivity of in vivo and ex vivo diffusion tensor imaging to evolving optic nerve injury in mice with retinal ischemia. Neuroimage 32:1195–1204. [DOI] [PubMed] [Google Scholar]
- Sydykova D, Stahl R, Dietrich O, Ewers M, Reiser MF, Schoenberg SO, Moller HJ, Hampel H, Teipel SJ (2007): Fiber connections between the cerebral cortex and the corpus callosum in Alzheimer's disease: A diffusion tensor imaging and voxel‐based morphometry study. Cereb Cortex 17:2276–2282. [DOI] [PubMed] [Google Scholar]
- Targosz‐Gajniak M, Siuda J, Ochudlo S, Opala G (2009): Cerebral white matter lesions in patients with dementia—From MCI to severe Alzheimer's disease. J Neurol Sci 283:79–82. [DOI] [PubMed] [Google Scholar]
- Thal DR, Holzer M, Rüb U, Waldmann G, Günzel S, Zedlick D, Schober R (2000): Alzheimer‐related tau‐pathology in the perforant path arget zone and in the hippocampal stratum oriens and radiatum correlates with onset and degree of dementia. Exp Neurol 163:98–110. [DOI] [PubMed] [Google Scholar]
- Teipel SJ, Bokde AL, Meindl T, Amaro E Jr, Soldner J, Reiser MF, Herpertz SC, Moller HJ, Hampel H (2010): White matter microstructure underlying default mode network connectivity in the human brain. Neuroimage 49:2021–2032. [DOI] [PubMed] [Google Scholar]
- van den Heuvel M, Mandl R, Luigjes J, Hulshoff Pol H (2008): Microstructural organization of the cingulum tract and the level of default mode functional connectivity. J Neurosci 28:10844–10851. [DOI] [PMC free article] [PubMed] [Google Scholar]
- van den Heuvel MP, Mandl RC, Kahn RS, Hulshoff Pol HE (2009): Functionally linked resting‐state networks reflect the underlying structural connectivity architecture of the human brain. Hum Brain Mapp 30:3127–3141. [DOI] [PMC free article] [PubMed] [Google Scholar]
- van der Lijn F, den Heijer T, Breteler MM, Niessen WJ (2008): Hippocampus segmentation in MR images using atlas registration, voxel classification, and graph cuts. Neuroimage 43:708–720. [DOI] [PubMed] [Google Scholar]
- Van der Lijn F, de Bruijne M, Klein S, den Heijer T, Hoogendam YY, van der Lugt A, Breteler MM, Niessen WJ (2012): Automated brain structure segmentation based on atlas registration and appearance models. IEEE Trans Med Imaging 31:276–286. [DOI] [PubMed] [Google Scholar]
- Verhage F (1964): Intelligentie en leeftijd: onderzoek bij Nederlanders van twaalf tot zevenenzeventig jaar [Intelligence and age: Research on Dutch People Aged Twelve to Seventy‐Seven Years Old]. Assen: Van Gorcum. [Google Scholar]
- Vernooij MW, de Groot M, van der Lugt A, Ikram MA, Krestin GP, Hofman A, Niessen WJ, Breteler MM (2008): White matter atrophy and lesion formation explain the loss of structural integrity of white matter in aging. Neuroimage 43:470–477. [DOI] [PubMed] [Google Scholar]
- Villain N, Desgranges B, Viader F, de la Sayette V, Mezenge F, Landeau B, Baron JC, Eustache F, Chetelat G (2008): Relationships between hippocampal atrophy, white matter disruption, and gray matter hypometabolism in Alzheimer's disease. J Neurosci 28:6174–6181. [DOI] [PMC free article] [PubMed] [Google Scholar]
- Villeneuve S, Massoud F, Bocti C, Gauthier S, Belleville S (2011): The nature of episodic memory deficits in MCI with and without vascular burden. Neuropsychologia 49:3027–3035. [DOI] [PubMed] [Google Scholar]
- Vrooman HA, Cocosco CA, van der Lijn F, Stokking R, Ikram MA, Vernooij MW, Breteler MM, Niessen WJ (2007): Multi‐spectral brain tissue segmentation using automatically trained k‐Nearest‐Neighbor classification. Neuroimage 37:71–81. [DOI] [PubMed] [Google Scholar]
- Wakana S, Caprihan A, Panzenboeck MM, Fallon JH, Perry M, Gollub RL, Hua K, Zhang J, Jiang H, Dubey P, Blitz A, van Zijl P, Mori S (2007): Reproducibility of quantitative tractography methods applied to cerebral white matter. Neuroimage 36:630–644. [DOI] [PMC free article] [PubMed] [Google Scholar]
- Wakana S, Jiang H, Nagae‐Poetscher LM, van Zijl PC, Mori S (2004): Fiber tract‐based atlas of human white matter anatomy. Radiology 230:77–87. [DOI] [PubMed] [Google Scholar]
- Wang DS, Bennett DA, Mufson EJ, Mattila P, Cochran E, Dickson DW (2004): Contribution of changes in ubiquitin and myelin basic protein to age‐related cognitive decline. Neurosci Res 48:93–100. [DOI] [PubMed] [Google Scholar]
- Witter MP, Wouterlood FG, Naber PA, Van Haeften T (2000): Anatomical organization of the parahippocampal‐hippocampal network. Ann NY Acad Sci 911:1–24. [DOI] [PubMed] [Google Scholar]
- Woolrich MW, Jbabdi S, Patenaude B, Chappell M, Makni S, Behrens T, Beckmann C, Jenkinson M, Smith SM (2009): Bayesian analysis of neuroimaging data in FSL. Neuroimage 45:S173–S186. [DOI] [PubMed] [Google Scholar]
- Xie S, Xiao JX, Gong GL, Zang YF, Wang YH, Wu HK, Jiang XX (2006): Voxel‐based detection of white matter abnormalities in mild Alzheimer disease. Neurology 66:1845–1849. [DOI] [PubMed] [Google Scholar]
- Yip AG, McKee AC, Green RC, Wells J, Young H, Cupples LA, Farrer La (2005): APOE, vascular pathology and the AD brain. Neurology 65:259–265 [DOI] [PubMed] [Google Scholar]
- Yoshita M, Fletcher E, Harvey D, Ortega M, Martinez O, Mungas DM, Reed BR, DeCarli CS (2006): Extent and distribution of white matter hyperintensities in normal aging, MCI, and AD. Neurology 67:2192–2198. [DOI] [PMC free article] [PubMed] [Google Scholar]
- Zhou Y, Dougherty JH Jr, Hubner KF, Bai B, Cannon RL, Hutson RK (2008): Abnormal connectivity in the posterior cingulate and hippocampus in early Alzheimer's disease and mild cognitive impairment. Alzheimers Dement 4:265–270. [DOI] [PubMed] [Google Scholar]
- Zhuang L, Wen W, Zhu W, Trollor J, Kochan N, Crawford J, Reppermund S, Brodaty H, Sachdev P (2010): White matter integrity in mild cognitive impairment: A tract‐based spatial statistics study. Neuroimage 53:16–25. [DOI] [PubMed] [Google Scholar]