

Abstract
Using diffusion tensor (DT) magnetic resonance imaging (MRI), damage to brain intrahemispheric and interhemispheric connections was assessed in 26 sporadic primary lateral sclerosis (PLS) patients compared with 28 sporadic amyotrophic lateral sclerosis (ALS) patients with similar disability and 35 healthy controls. DT MRI diagnostic accuracy in distinguishing the two motor neuron disease (MND) variants was tested. PLS and ALS patients showed a distributed pattern of abnormalities of the motor system, including the corticospinal tracts and corpus callosum (CC). PLS versus ALS patients showed a more severe damage to the motor CC fibers and subcortical white matter (WM) underlying the primary motor cortices. Both patient groups showed an extra‐motor damage, which was more severe in PLS. This did not appear to be driven by longer disease duration in PLS. In PLS patients, damage to the CC mid‐body correlated with the severity of upper motor neuron clinical burden. CC fractional anisotropy values had the highest accuracy in distinguishing PLS from controls and ALS. PLS and ALS share an overlapped pattern of WM abnormalities. This underscores that PLS, despite its distinct clinical phenotype and long survival, still lies within the wider MND spectrum. Whether CC diffusivity may be a novel marker to increase confidence in an early diagnostic separation of PLS from ALS still needs to be investigated. Hum Brain Mapp 35:1710–1722, 2014. © 2013 Wiley‐Periodicals, Inc.
Keywords: primary lateral sclerosis, amyotrophic lateral sclerosis, white matter damage, DT MRI, brain atrophy, VBM
INTRODUCTION
Primary lateral sclerosis (PLS) has a slower rate of progression and a more benign prognosis than the more common form of motor neuron disease (MND), amyotrophic lateral sclerosis (ALS) [Kuipers‐Upmeijer et al., 2001; Le Forestier et al., 2001a; Gordon et al., 2006]. The distinction between PLS and ALS relies primarily on recognition of symptoms and signs of upper (UMN) versus lower motor neuron (LMN) involvement and nonspecific, ancillary laboratory data [Gordon et al., 2006; Pringle et al., 1992].
Diffusion tensor (DT) magnetic resonance imaging (MRI) is currently unrivalled as a neuroimaging marker of UMN involvement and has the potential to provide an objective in vivo assessment of the extra‐motor brain damage in MND [Agosta et al., 2010; Turner et al., 2012]. To date, most studies included only typical patients with ALS, and only a few investigated small samples of other MND phenotypes [Ciccarelli et al., 2009; Unrath et al., 2010; Iwata et al., 2011; van der Graaff et al., 2011; Muller et al., 2012]. Similarly to what has been reported in ALS, white matter (WM) abnormalities in PLS were observed in subcortical WM areas of the motor system including the rostral corticospinal tracts (CST) and the corpus callosum (CC) [Ciccarelli et al., 2009; Unrath et al., 2010; Iwata et al., 2011; van der Graaff et al., 2011; Muller et al., 2012]. Two studies also showed an involvement of the projectional fiber system of the posterior limb of the internal capsule and brainstem in PLS [Unrath et al., 2010; van der Graaff et al., 2011]. However, only a few recent reports have compared directly PLS and ALS patients [Ciccarelli et al., 2009; Iwata et al., 2011; van der Graaff et al., 2011], but their results were inconclusive in terms of the relative involvement of the CST and CC in the two MND variants.
Aim of this study was to use DT MRI and a combined voxel‐based and tractography analysis to assess the topographical distribution of microstructural damage to intrahemispheric and interhemispheric connections in a relatively large group of patients with a clinically definite diagnosis of PLS, and to identify commonalities and differences in respect to patients with ALS and a matched disease severity. The diagnostic accuracy of individual DT MRI variables in distinguishing each MND variant from healthy controls and each other was also tested.
MATERIALS AND METHODS
Subjects
Patients with sporadic PLS [Pringle et al., 1992] were recruited at three tertiary referral MND Clinics in Northern Italy. All patients had no evidence of acute or chronic denervation on repeated electromyographical examinations and had their symptoms for at least 3 years. To be eligible, subjects had to meet the following criteria: no family history of MND; no clinical diagnosis of frontotemporal dementia (FTD) [Neary et al., 1998]; age at onset ≥ 40 years and no mutations of major genes related to hereditary spastic paraparesis (SPG3A, SPG4, SPG7, SPG11); no any other major systemic, psychiatric or neurological illnesses; no history of substance abuse; and no other causes of focal or diffuse brain damage, including strokes, lacunae and other evidence of cerebrovascular disease at routine MRI. Within 48 h from MRI, functional status was assessed using the ALS Functional Rating Scale (ALSFRS‐r) [Cedarbaum et al., 1999]. A quantitative assessment of clinical UMN involvement was based on a scale (i.e., the UMN score) assessing the number of pathologic reflexes elicited from 15 body sites [Turner et al., 2004]. The rate of disease progression at study entry was calculated as: (48—ALSFRS‐r score)/time from symptom onset [Ellis et al., 1999]. Patients with a diagnosis of definite, probable, or probable laboratory‐supported, sporadic ALS [Brooks et al., 2000] were recruited consecutively to match PLS patients for age, gender, and disease severity as measured by the ALSFRS‐r and the UMN score. Healthy controls were recruited among spouses of patients and by word of mouth, underwent a neurological evaluation, and were included only if this was normal. Twenty‐six PLS patients, 28 ALS patients and 35 healthy controls were studied (Table 1).
Table 1.
Sociodemographic, clinical and conventional MRI features of healthy controls and patients
| Healthy controls | ALS patients | PLS patients | P | |
|---|---|---|---|---|
| Number | 35 | 28 | 26 | – |
| Women | 19 (54%) | 13 (46%) | 14 (54%) | 0.86 |
| Number of patients with bulbar symptoms at onset | – | 5 (18%) | 3 (11%) | 0.71 |
| Revised El Escorial criteria (a/b/c) | – | 4/8/16 | – | – |
| Age at MRI (years) | 64 ± 9 [43–79] | 61 ± 8 [45–75] | 63 ± 9 [43–79] | 0.57 |
| Disease duration (months) | – | 22 ± 18 [6–69] | 102 ± 56 [38–247] | <0.001 |
| ALSFRS‐r | – | 38 ± 8 [11–47] | 36 ± 6 [22–42] | 0.12 |
| UMN score [maximum 16] | – | 10 ± 4 [2–16] | 14 ± 2 [10–16] | <0.001 |
| Disease progression ratea [units/month] | – | 0.68 ± 0.83 [0.06–4.10] | 0.15 ± 0.10 [0.03–0.43] | <0.001 |
| WM lesion load [ml] | 0.7 ± 1.0 [0–4.6] | 1.0 ± 1.1 [0–4.0] | 0.6 ± 0.9 [0–3.5] | 0.30 |
Values are mean ± standard deviation [range] or number (%). P values refer to Fisher exact test, Mann‐Whitney U‐test or the Kruskal–Wallis test, as appropriate. See text for further details. Revised El Escorial criteria: a = definite, b = probable, and c = probable laboratory‐supported.
Disease progression rate = (48‐ALSFRS‐r)/time from symptom onset.
Abbreviations: ALS = amyotrophic lateral sclerosis; ALSFRS‐r = ALS Functional Rating scale‐revised; MRI = magnetic resonance imaging; PLS = primary lateral sclerosis; UMN = upper motor neuron; WM = white matter.
Local Ethical Committee approval and written informed consent from all subjects were obtained prior to study initiation.
MRI Acquisition
Brain MRI scans were obtained using a 3.0 T scanner (Intera, Philips Medical Systems, Best, The Netherlands). The following sequences were acquired from all subjects: (i) T 2‐weighted spin echo (SE) (repetition time [TR] = 3,500 ms, echo time [TE] = 85 ms, echo train length = 15, flip angle = 90°, 22 contiguous, 5‐mm thick axial slices with a matrix size = 512 × 512, field of view [FOV] = 230 × 184 mm2); (ii) fluid‐attenuated inversion recovery (FLAIR) (TR = 11,000 ms, TE = 120 ms, flip angle = 90°, 22 contiguous, 5‐mm thick axial slices with a matrix size = 512 × 512, FOV = 230 mm2); (iii) 3D T1‐weighted fast field echo (TR = 25 ms, TE = 4.6 ms, flip angle = 30°, 220 contiguous axial slices with voxel size = 0.89 × 0.89 × 0.8 mm3, matrix size = 256 × 256, FOV = 230 × 182 mm2); and (iv) pulsed‐gradient SE echo planar with sensitivity encoding (acceleration factor = 2.5, TR = 8,986 ms, TE = 80 ms, 55 contiguous, 2.5‐mm thick axial slices, number of acquisitions = 2; after SENSE reconstruction, the matrix dimension of each slice was 256 × 256, with an in‐plane pixel size of 0.94 × 0.94 mm2 and a FOV = 240 × 240 mm2) and with diffusion gradients applied in 32 noncollinear directions, using a gradient scheme which is standard on this system (gradient over‐plus) and optimized to reduce TE as much as possible. The b factor used was 1,000 s/mm2. Fat saturation was performed to avoid chemical shift artifacts. All slices were positioned to run parallel to a line that joins the most infero‐anterior and infero‐posterior parts of the CC.
MRI Analysis
MRI analysis was performed by an experienced observer, blinded to subjects' identity. WM hyperintensities (WMHs), if any, were identified on T 2‐weighted and FLAIR scans. WMH load was measured using the Jim software package (Version 5.0, Xinapse Systems, Northants, UK, http://www.xinapse.com). Voxel‐based morphometry (VBM) was performed using SPM8 and the Diffeomorphic Anatomical Registration using Exponentiated Lie algebra registration method, as previously described (Agosta et al., 2012).
DT MRI preprocessing
DT MRI analysis was performed using the FMRIB software library (FSL) tools (http://www.fmrib.ox.ac.uk/fsl/fdt/index.html) and the JIM5 software. The diffusion‐weighted data were skull‐stripped using the Brain Extraction Tool (BET) implemented in FSL. Using FMRIB's Linear Image Registration Tool, the two diffusion‐weighted scans were coregistered by applying the rigid transformation needed to correct for position between the two b 0 images (T 2‐weighted, but not diffusion‐weighted). The rotation component was also applied to diffusion‐weighted directions. Eddy currents correction was performed using the JIM5 software. Then, the two acquisitions were concatenated. The DT was estimated on a voxel‐by‐voxel basis using DTIfit provided by the FMRIB Diffusion Toolbox. Maps of mean diffusivity (MD), fractional anisotropy (FA), axial diffusivity (axD) and radial diffusivity (radD) were obtained.
Voxel‐based analysis: tract‐based spatial statistics
Tract‐based spatial statistics (TBSS) version 1.2 (http://www.fmrib.ox.ac.uk/fsl/tbss/index.html) was used to perform the multisubject DT MRI analysis (Smith et al., 2006). FA volumes were aligned to a target image using the following procedure: (i) the FA template in standard space (provided by FSL) was selected as the target image, (ii) the nonlinear transformation that mapped each subject's FA to the target image was computed using the FMRIB's Nonlinear Image Registration Tool (FNIRT), and (iii) the same transformation was used to align each subject's FA to the standard space. A mean FA image was then created by averaging the aligned individual FA images, and thinned to create a FA skeleton representing WM tracts common to all subjects (Smith et al., 2006). The FA skeleton was thresholded at a value of 0.2 to exclude voxels with low FA values, which are likely to include gray matter (GM) or cerebrospinal fluid. Individual MD, FA, axD, and radD data were projected onto this common skeleton.
Tractography: definition of regions of interest
Seeds for tractography of the CC and CST were defined in the Montreal Neurological Institute (MNI) space on the FA template provided by FSL. Regions of interest (ROI) were defined manually on sagittal or axial slices based on a priori knowledge of the anatomy of the tracts. Seeds were drawn where these tracts pass through a bottleneck in order to include the highest number of fibers constituting the tract in the starting seed for tractography. Tractography was then performed using a single‐seed approach. Masks were used to exclude fibers from neighboring tracts. The seed for the CC was a sagittal ROI including the four median slices on which the CC is clearly visible. For the CST, an axial ROI was drawn at the top of the bulbar pyramids of each side and included four slices.
The CC was segmented into three portions to identify the callosal fibers linking the primary motor cortices (PMC), lateral premotor cortices and supplementary motor area (SMA). To this end, the same seed and exclusion masks of the entire CC were used, and, additionally, each of the following cortical areas were used as target ROIs: (a) the PMC, corresponding to the bilateral precentral gyrus as defined by the Harvard Oxford cortical atlas (http://www.cma.mgh.harvard.edu/); (b) the SMA, corresponding to the bilateral supplementary motor cortex as defined by the Harvard Oxford cortical atlas; (c) the premotor cortex, which was drawn manually and included the dorsolateral part of Broadmann area 6 from MNI y = 5 to MNI y = 29. This ROI corresponds to the posterior parts of the middle and inferior frontal gyri on the Harvard‐Oxford cortical atlas.
The seeds, targets and exclusion masks were first transformed to each subject's native diffusion space, using the inverse of the linear and nonlinear transformations obtained previously to align each subject's FA to the standard space, and then binarized. Transformed seeds, targets and exclusion masks were evaluated visually by an experienced observer. Manual editing was performed only if masks were found to be positioned inaccurately in the native space.
Tractography: fiber tracking
Fiber tracking was performed in native DT MRI space using a probabilistic tractography algorithm implemented in FSL (probtrackx), which is based on a Bayesian estimation of diffusion parameters (Bedpostx) [Behrens et al., 2007]. Fiber tracking was initiated from all voxels within the seed masks in the diffusion space to generate 5,000 streamline samples, with a step length of 0.5 mm and a curvature threshold of 0.2. Each CST tract was run separately for the right and left hemisphere. Tract maps were then normalized taking into consideration the numbers of voxels in the seed masks. To do so, the number of streamline samples present in the voxels of the tract maps was divided by the way‐total, which corresponds to the total number of streamline samples that were not rejected by the exclusion masks. The tract masks obtained were thresholded at a value equal to 40% of the 95th percentile of the distribution of the intensity values in the voxels included in the tracts. This normalisation procedure allowed us to correct for possible differences between tracts due to the different sizes of the starting seeds. In this way, we also excluded background noise and avoided a too restrictive thresholding when the maximum intensity value was an outlier.
Using a “single‐seed” approach, the reconstruction of the CC and bilateral CST was obtained. Group probability maps of each tract were produced to visually check the anatomical accuracy of the tracts of interest across the study subjects (Online Supporting Information. E‐Figs. 1 and 2). Using a “seed‐to‐target” approach, the three partitions of the CC were tracked, namely the CC‐PMC, CC‐premotor cortex (CC‐premotor), and CC‐SMA, and group probability maps produced (Fig. 1). For each tract, the average MD, FA, axD, and radD were calculated in the native space.
Figure 1.
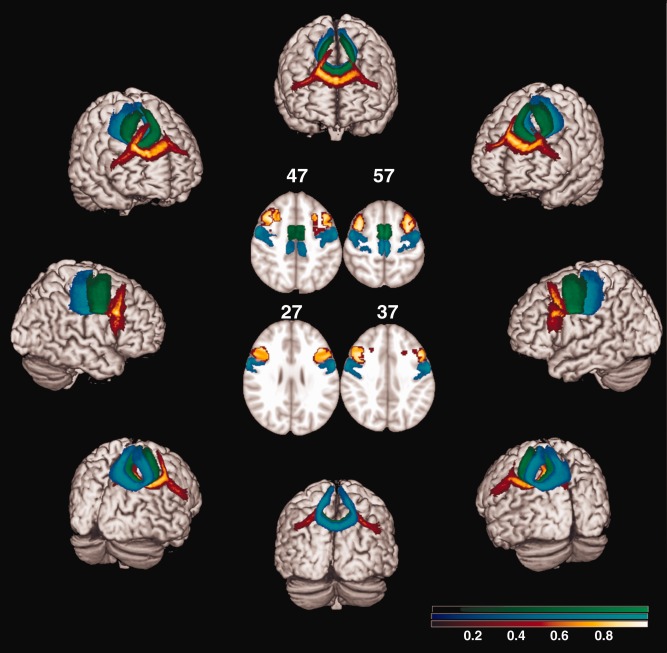
Probabilistic maps of the three partitions of corpus callosum (CC) from all subjects included in the study with an example of the target ROI in standard space (centre of the figure). The target ROIs are shown with the same colors of the corresponding tract, at the MNI coordinates of z = 57, 47, 37 and 27. The tracts are overlaid on a 3D rendering of the MNI standard brain. Only voxels present in at least 10% of the subjects are shown. The color scale indicates the degree of overlap among subjects. CC‐primary motor cortex is shown in blue‐light blue, CC‐SMA in green, CC‐premotor cortex in red‐yellow.
Figure 2.
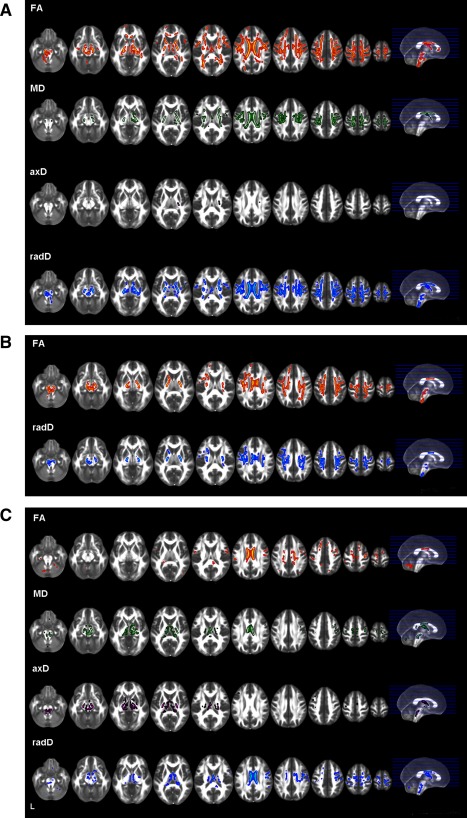
Tract based spatial statistics: areas of significant decreased FA and increased mean (MD), axial (axD) and radial (radD) diffusivity in primary lateral sclerosis (PLS) patients compared with healthy controls (A), amyotrophic lateral sclerosis (ALS) patients compared with healthy controls (B), and PLS patients compared with those with ALS (C). The results are overlaid on the axial sections of a FA template in the MNI standard space in neurological convention (left is left), and displayed at P < 0.05, Family Wise Error (FWE)‐corrected, for the comparisons between patients and controls, and P < 0.05, uncorrected, for the direct comparison between patient groups.
Statistical Analysis
TBSS
DT MRI voxelwise statistics were performed using a permutation‐based inference tool for nonparametric statistical thresholding (“randomize,” part of FSL [Nichols and Holmes, 2002]). The number of permutations was set at 5,000 [Nichols and Holmes, 2002]. MD, FA, axD, and radD values within the skeleton were compared between groups using permutation‐based two‐sample t tests, adjusting for subject's age. The patients versus controls statistical maps were thresholded at P < 0.05, corrected for multiple comparisons (family wise error, FWE) at a cluster level using the threshold‐free cluster enhancement option [Smith and Nichols, 2009]. For the direct comparison between patient groups, statistical threshold was set at P < 0.05 uncorrected to avoid false‐negatives that can occur given the likely similarity between ALS and PLS. The relationships between DT MRI metrics and clinical variables (disease duration, ALSFRS‐r score, UMN score, and disease progression rate) were tested using regression models, adjusted for age (P < 0.05, FWE‐corrected).
Tractography
Right and left CST DT MRI variables were averaged. Tract average MD, FA, axD, and radD were compared between groups using analysis of covariance models, adjusted for age. P values were corrected for multiple comparisons using the false discovery rate. Correlations with clinical measures were assessed using Spearman coefficients adjusting for age. For tract average FA values, the Concordance (C) index was estimated using univariable or multivariable logistic regression analyses. The C index quantifies the discrimination ability of a given variable in distinguishing groups of individuals. To minimize the number of analyses, other DT MRI metrics were not included in the discrimination analysis. These analyses were run using SAS Release 9.1 (P value <0.05).
VBM
Using SPM8, analyses of covariance, adjusted for age and total intracranial volume, were performed to assess GM and WM volume differences between groups. VBM results were tested at P < 0.05 FWE‐corrected and P < 0.001, uncorrected. Using MarsBaR toolbox implemented in SPM (http://sourceforge.net/projects/spmtools), we obtained the mean volume of the brain region that differentiated PLS from healthy subjects (Fig. 4). The C‐index of such variable in distinguishing groups of individuals was calculated.
Figure 4.
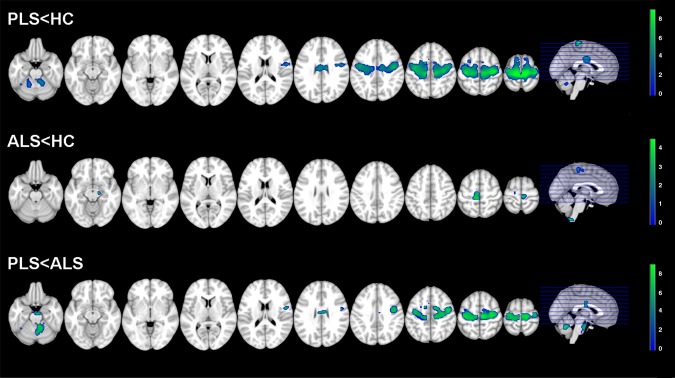
Voxel based morphometry (VBM): areas of brain tissue loss in primary lateral sclerosis (PLS) and amyotrophic lateral sclerosis (ALS) patients compared with healthy controls and each other. Results are overlaid on the axial sections of a T1‐weighted template in the MNI standard space in neurological convention (left is left). VBM results are displayed at P < 0.001, uncorrected. The color scale indicates T‐values.
RESULTS
PLS patients showed higher UMN scores compared with ALS patients (<0.001). The mean WMH load was 0.7 ml (standard deviation [SD] = 1.0) in controls, 0.6 ml (SD = 0.9) in PLS patients, and 1.0 ml (SD = 1.1) in ALS patients (P = 0.30).
TBSS
PLS versus controls (P < 0.05, FWE)
Compared with controls, PLS patients showed a decreased FA in the whole CST (from the bulbar pyramids, through the posterior limb of the internal capsule, to the corona radiata and the WM surrounding the PMC), CC mid‐body and genu, anterior limb of internal capsule, and prefrontal WM in regions belonging to the superior longitudinal fasciculus, bilaterally (Fig. 2A). PLS patients also had areas of decreased FA in the fornix, thalamic radiations, CC splenium and parietal lobes, bilaterally. In PLS, regions of increased MD and radD were found along the CST bilaterally and in the CC mid‐body. Small areas of increased MD and radD were also found in the anterior limb of the internal capsule, thalamic radiations and parietal lobes, bilaterally. PLS patients relative to controls also showed an increased axD in the left posterior limb of the internal capsule.
ALS versus healthy controls (P < 0.05, FWE)
Compared with controls, ALS patients had a decreased FA in the whole CST (from the bulbar pyramids, through the posterior limb of the internal capsule, to the corona radiata and WM surrounding the PMC), and the CC mid‐body, bilaterally (Fig. 2B). Regions of decreased FA were also found in the prefrontal and parietal WM, bilaterally. In these areas, ALS patients showed an increased radD when compared with controls. There was no difference in MD and axD between ALS patients and controls.
PLS versus ALS (P < 0.05, uncorrected)
When compared with ALS, PLS patients showed a decreased FA in the CC mid‐body, small regions of the motor, premotor, prefrontal and parietal WM, and cerebellum (Fig. 2C). Compared with ALS, PLS patients also showed increased MD and radD in the CC mid‐body, cerebral peduncles, thalamic radiations, fornix, bilaterally, right posterior limb of the internal capsule, and small regions located in the motor and premotor WM, as well as an increased axD in the cerebral peduncles, internal capsule, thalamic radiations, and fornix, bilaterally. No regions of decreased FA and increased diffusivities were found in ALS patients when compared with PLS.
Correlations (P < 0.05, FWE)
In PLS, disease duration correlated inversely with FA values of the prefrontal WM bilaterally, and right premotor and temporal WM (Fig. 3). In ALS, disease duration correlated inversely with the FA values of many WM regions, comprising the CST, CC mid‐body, cingulum, external capsule, prefrontal, orbitofrontal, temporal and occipital WM, fornix, and superior and inferior cerebellar peduncles, bilaterally. In PLS and ALS, the ALSFR‐r score, UMN score and disease progression rate did not correlate with DT MRI metrics at a voxel‐wise level.
Figure 3.
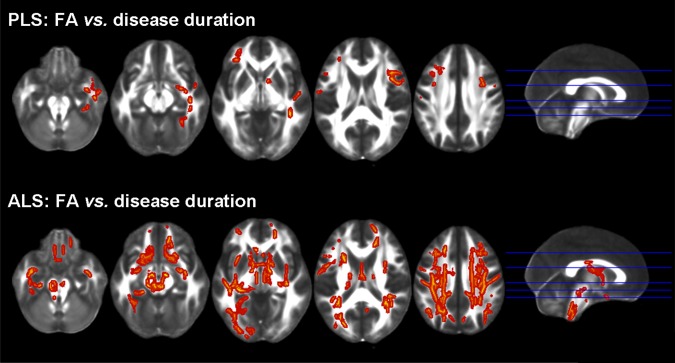
Tract based spatial statistics: FA versus disease duration and upper motor neuron (UMN) clinical score. Regions of significant correlations between FA and disease duration or UMN score in patients with primary lateral sclerosis (PLS) and amyotrophic lateral sclerosis (ALS) are overlaid on the axial sections of a FA template in the MNI standard space. Results are shown in neurological convention (left is left), at P < 0.05, Family Wise Error (FWE)‐corrected.
Tractography
Between‐group comparisons
Table 2 shows tractography results. When compared with healthy controls, PLS patients had abnormal DT MRI metrics of the CST, CC‐PMC, and CC‐SMA. Patients with ALS compared with healthy controls showed abnormal diffusivity values of the CST and CC‐PMC. Compared with ALS patients, patients with PLS showed abnormal DT MRI metrics of the CC‐PMC and CC‐SMA. No tract showed decreased FA and increased diffusivities in ALS compared with PLS patients.
Table 2.
Tractography results: DT MRI metrics in PLS, ALS, and healthy controls
| Tracts | Metrics | HC | ALS | PLS | P values | |||
|---|---|---|---|---|---|---|---|---|
| P a | ALS vs. HCb | PLS vs. HCb | PLS vs. ALSb | |||||
| CST | FA | 0.53 ± 0.03 | 0.51 ± 0.03 | 0.51 ± 0.03 | 0.01 | 0.03 | 0.005 | 0.38 |
| MD | 0.80 ± 0.04 | 0.82 ± 0.05 | 0.85 ± 0.06 | 0.001 | 0.04 | <0.001 | 0.06 | |
| axD | 1.31 ± 0.05 | 1.32 ± 0.06 | 1.35 ± 0.07 | 0.06 | 0.28 | 0.03 | 0.20 | |
| radD | 0.54 ± 0.05 | 0.57 ± 0.05 | 0.60 ± 0.06 | 0.001 | 0.02 | <0.001 | 0.08 | |
| CC | FA | 0.52 ± 0.03 | 0.52 ± 0.03 | 0.50 ± 0.02 | 0.22 | 0.99 | 0.15 | 0.15 |
| MD | 0.91 ± 0.05 | 0.91 ± 0.06 | 0.93 ± 0.07 | 0.19 | 0.30 | 0.14 | 0.48 | |
| axD | 1.48 ± 0.07 | 1.49 ± 0.09 | 1.49 ± 0.09 | 0.28 | 0.33 | 0.37 | 0.69 | |
| radD | 0.62 ± 0.05 | 0.63 ± 0.06 | 0.65 ± 0.07 | 0.16 | 0.39 | 0.09 | 0.30 | |
| CC‐PMC | FA | 0.47 ± 0.03 | 0.45 ± 0.04 | 0.41 ± 0.03 | <0.001 | 0.01 | <0.001 | <0.001 |
| MD | 0.88 ± 0.05 | 0.92 ± 0.06 | 0.96 ± 0.07 | <0.001 | 0.03 | <0.001 | 0.01 | |
| axD | 1.36 ± 0.06 | 1.38 ± 0.06 | 1.39 ± 0.07 | 0.13 | 0.23 | 0.08 | 0.42 | |
| radD | 0.65 ± 0.06 | 0.68 ± 0.07 | 0.75 ± 0.08 | <0.001 | 0.03 | <0.001 | 0.003 | |
| CC‐premotor | FA | 0.43 ± 0.03 | 0.44 ± 0.04 | 0.42 ± 0.03 | 0.28 | 0.71 | 0.28 | 0.28 |
| MD | 0.88 ± 0.05 | 0.87 ± 0.07 | 0.88 ± 0.05 | 0.91 | 0.86 | 0.86 | 0.86 | |
| axD | 1.32 ± 0.06 | 1.31 ± 0.08 | 1.31 ± 0.06 | 0.89 | 0.86 | 0.86 | 0.86 | |
| radD | 0.66 ± 0.05 | 0.65 ± 0.07 | 0.66 ± 0.05 | 0.72 | 0.74 | 0.74 | 0.74 | |
| CC‐SMA | FA | 0.50 ± 0.03 | 0.49 ± 0.05 | 0.44 ± 0.04 | <0.001 | 0.18 | <0.001 | <0.001 |
| MD | 0.84 ± 0.04 | 0.85 ± 0.06 | 0.92 ± 0.08 | <0.001 | 0.23 | <0.001 | <0.001 | |
| axD | 1.35 ± 0.05 | 1.36 ± 0.06 | 1.38 ± 0.08 | 0.28 | 0.52 | 0.26 | 0.45 | |
| radD | 0.59 ± 0.05 | 0.60 ± 0.08 | 0.69 ± 0.08 | <0.001 | 0.20 | <0.001 | <0.001 | |
Values are mean ± standard deviation.
P values refer to the age‐adjusted ANCOVA models testing mean equality between the three groups with false discovery rate (FDR) correction for multiple comparisons.
Post hoc comparisons of each metric of each tract were assessed using FDR correction.
Abbreviations: ALS = amyotrophic lateral sclerosis; axD = axial diffusivity; CC = corpus callosum; CC‐PMC = CC linking the primary motor cortex; CC‐premotor = CC linking the premotor cortex; CC‐SMA = CC linking the supplementary motor area; CST = corticospinal tract; FA = fractional anisotropy; HC = healthy controls; MD = mean diffusivity; PLS = primary lateral sclerosis; radD = radial diffusivity.
Correlations
In PLS patients, the ALSFRS‐r score correlated with FA (r = 0.56, P = 0.003) and radD (r = −0.46, P = 0.02) values of the CC‐SMA, the UMN score was associated with FA (r = −0.45, P = 0.02) and radD (r = 0.41, P = 0.04) values of the CC‐SMA and FA values of the CC‐precentral (r = −0.41, P = 0.04), whereas disease duration and progression rate did not correlate with any DT MRI variable. In ALS, no correlation was found between clinical and WM tract DT MRI variables.
Diagnostic value of DT MRI metrics
The highest patient classification accuracy when PLS patients were compared with controls were FA values of the CC‐PMC and CC‐SMA with a C index of 0.91 and 0.90, respectively (i.e., about 90% of patients were classified correctly; Table 3). CST FA values were able to classify correctly PLS patients versus controls with a C index of 0.72 (Table 3). CST and CC‐PMC FA values had a similar ability in distinguishing ALS patients from controls (C index of 0.66 and 0.68, respectively) (Table 3). When patient groups were contrasted to each other, the CC‐PMC and CC‐SMA FA measures provided the highest accuracy in distinguishing PLS from ALS cases (C index of 0.74 and 0.79, respectively) (Table 3).
Table 3.
Power (concordance indices) of CST and CC FA values to discriminate between diagnostic groups: patients vs. controls and primary lateral sclerosis vs. amyotrophic lateral sclerosis patients
| PLS vs. HC | ALS vs. HC | MND vs. HC | PLS vs. ALS | |
|---|---|---|---|---|
| CST FA | 0.72 | 0.66 | 0.69 | 0.58 |
| CC FA | 0.58 | 0.51 | 0.54 | 0.62 |
| CC‐PMC FA | 0.91 | 0.68 | 0.79 | 0.74 |
| CC‐SMA FA | 0.90 | 0.57 | 0.73 | 0.79 |
| CC‐premotor FA | 0.60 | 0.51 | 0.54 | 0.61 |
| Brain volume difference (VBM)a | 0.79 | 0.56 | 0.67 | 0.77 |
Values are concordance (C) indices. Abbreviations: ALS = amyotrophic lateral sclerosis; CC = corpus callosum; CC‐PMC = CC linking the primary motor cortex; CC‐premotor = CC linking the premotor cortex; CC‐SMA = CC linking the supplementary motor area; CST = corticospinal tract; FA = fractional anisotropy; HC = healthy controls; MND = motor neuron diseases; PLS = primary lateral sclerosis; VBM = voxel‐based morphometry.
Brain volume difference is the mean volume of those regions that differentiated PLS from healthy subjects (see Fig. 4 and text for further details).
Voxel‐Based Morphometry
No GM and WM volume differences were found between groups at P < 0.05 FWE‐corrected. Figure 4 shows VBM results at P < 0.001, uncorrected.
PLS versus controls
Compared with healthy controls, PLS patients showed an extensive brain tissue loss that involved the precentral gyrus, almost entirely, and the more cranial part of the superior frontal gyrus, bilaterally, as well as the surrounding WM. Significant tissue loss was detected also in the mid‐body of the CC and the cerebellum bilaterally.
ALS versus controls
ALS patients relative to healthy controls showed significant brain atrophy in the medial portion of the precentral gyri, bilaterally, left cerebral peduncle, and medulla.
PLS versus ALS
Compared to ALS, PLS patients showed a pattern of brain atrophy similar to that found when compared to healthy controls. In addition, they showed a cluster of tissue loss in the anterior pons. No GM and WM tissue loss was found in ALS compared to PLS patients.
Diagnostic accuracy of VBM findings
VBM findings showed the highest accuracy when PLS patients were compared to healthy controls (C‐index 0.79) and ALS patients (C‐index 0.77) (Table 3). When ALS patients were contrasted to controls, the accuracy was lower (C‐index 0.56). A model including both CC‐SMA FA values and VBM findings increased the C‐index to 0.85 in distinguishing PLS from ALS patients.
DISCUSSION
We found that PLS patients compared with controls had a damage to the CST and the mid‐body of the CC. The CST was impaired along its entire brain length from the WM underlying the PMC to the bulbar pyramids, through the posterior limbs of the internal capsulae. The tractography analysis of PLS patients relative to healthy subjects also detected abnormalities of the CST and callosal fibers linking the PMC and SMA.
PLS patients showed damage to both rostral and distal portions of the CST. Our TBSS findings are in line with the results of other studies [Ulug et al., 2004; Suh et al., 2006; Unrath et al., 2010; van der Graaff et al., 2011; Muller et al., 2012], since they showed that these patients experience a decreased FA along the CST, extending from the subcortical WM underneath the PMC to the cerebral peduncles. On the contrary, in two other studies, voxels with reduced FA were detected only in the subcortical WM in the vicinity of the PMC and premotor cortex, and not in more distal portions of the CST [Ciccarelli et al., 2009; Iwata et al., 2011]. The involvement of the full length of the CST in PLS patients, however, is in agreement with a number of pathological studies. The first pathologically verified cases of PLS showed pallor and loss of fibers of the CST from the internal capsule to the cord, with sparing of the anterior horn cells [Fisher, 1977; Beal and Richardson, 1981; Pringle et al., 1992]. After these pioneer studies, all more recent autopsy reports of PLS cases have shown consistently a loss of myelinated fibers throughout the entire length of the corticospinal pathway [Konagaya et al., 1998; Sugihara et al., 1999; Tan et al., 2003; Mochizuki et al., 2004].
TBSS showed that PLS patients had a decreased FA and an increased MD of the CC mid‐body. This central portion of CC was noted to be markedly involved in PLS in previous DT MRI studies [Ciccarelli et al., 2009; Unrath et al., 2010; Iwata et al., 2011; van der Graaff et al., 2011; Muller et al., 2012]. The fibers of the CC mid‐body link the motor and premotor cortices. The novelty of our study was the use of tractography to parcellate callosal fibers according to their cortical connectivity. The loss of mid‐body CC integrity in PLS, in particular CC‐PMC and CC‐SMA segments, might reflect secondary Wallerian degeneration following death of neurons located in the PMC and premotor cortices. On structural MRI, atrophy of the motor cortices is considered a finding highly suggestive of PLS [Kuipers‐Upmeijer et al., 2001; Butman and Floeter, 2007; Tartaglia et al., 2009], and it was observed also in the present study. VBM findings showed that there is focal atrophy in PLS patients compared with controls especially in the precentral cortex, in keeping with previous studies assessing cortical thickness in these patients [Butman and Floeter, 2007; Tartaglia et al., 2009]. Pathologic studies have shown a complete loss of Betz cells from layer 5 of the precentral gyrus, a decreased number of pyramidal neurons in layers 3 and 5, and an associated laminar gliosis [Fisher, 1977; Beal and Richardson, 1981; Pringle et al., 1992; Kiernan and Hudson, 1994; Konagaya et al., 1998; Sugihara et al., 1999; Tan et al., 2003; Mochizuki et al., 2004; Kosaka et al., 2012]. In a pathologic study of PLS [Kiernan and Hudson, 1994], the surface area of the precentral gyri and the underlying WM were shown to have a size which was 25% lower than the normal one.
TBSS revealed that our PLS and ALS patients have a similar involvement of the distal portions of the CST. However, patients with PLS showed a more severe damage to the rostral portions of the CST and the motor callosal fibers. Using tractography, we found that the two MND groups had a comparable degree of mean CST damage, but there was a more severe involvement of the CC‐PMC and CC‐SMA fibers in PLS relative to ALS patients. Three previous DT MRI studies compared PLS and ALS patients using a voxelwise analysis of the brain WM and/or tractography [Ciccarelli et al., 2009; Iwata et al., 2011; van der Graaff et al., 2011]. In the first study, six patients with PLS had a lower FA in the CC mid‐body and in the WM adjacent to the right PMC compared with 13 ALS patients [Ciccarelli et al., 2009]. A second study of 12 PLS patients detected a decreased FA in the CC mid‐body and cerebral peduncles compared with 12 limb‐onset ALS, and in the CC mid‐body and splenium compared with 12 bulbar‐onset ALS [van der Graaff et al., 2011]. In a study of 19 PLS and 18 ALS patients [Iwata et al., 2011], TBSS revealed that PLS patients had the greatest loss of FA in the subcortical WM underlying the PMC, while patients with ALS showed the greatest reduction of FA in the distal portions of the intracranial CST. Similarities and differences in the regional distribution of WM abnormalities that we observed between the patient groups are in line with the few pathologic studies which have compared PLS with ALS brains. PLS and ALS were shown to have similar degenerative changes in the CST, including pallor of the posterior limb of the internal capsule, descending fibers of the basis pontis, pyramids, dorsolateral half of the lateral funiculus, and medial and ventral parts of the ventral funiculus [Pringle et al., 1992; Hudson et al., 1993]. On the contrary, in two autopsy studies [Hudson et al., 1993; Pringle et al., 1992], the cortical motor neurons were more shrunk in PLS than in ALS cases, thus supporting the in vivo evidence for a more severe involvement of the rostral CST and motor callosal fibers in this phenotype relative to ALS. As callosal neurons are excitatory and their major targets are the inhibitory interneurons of the contralateral hemisphere, a callosal activation, for example, using transcranial magnetic stimulation, results in a contralateral inhibition of the cortex [Meyer et al., 1998]. As a consequence, the more severe microstructural damage to transcallosal motor fibers seen in PLS compared with ALS patients might be the structural correlate of the neurophysiological evidence of a reduced cortical excitability in PLS compared with ALS patients [Weber et al., 2002]. The biological interpretation of the different extent of WM damage seen in the two MND variants is, however, challenging. A potential confound is the longer disease duration in PLS compared with ALS, which is also the easiest explanation of the differences between the two MDN variants. However, in PLS patients we did not find a correlation between the duration of the disease and the extent of callosal involvement. Conversely, ALS patients appear to have a more widespread pattern of FA abnormalities with longer disease duration in keeping with the rapid decline of these patients. These findings suggest that the more profound WM abnormalities in PLS are not simply due to the longer disease duration per se, but possibly to a distinct pathological process, which is likely to occur early in the course of this condition. The notion that humans have direct corticomotoneuronal connections to anterior horns has been hypothesized as the reason for UMN involvement in ALS compared to LMN‐only degeneration seen in animal models [Eisen, 2009]. The greater involvement of the CC, together with the lack of clinical LMN involvement and the striking motor cortex atrophy, was used by some authors [Iwata et al., 2011] to sustain the “dying forward” as opposed to “dying back” model of degeneration in PLS. If PLS starts focally at the cortical level [Iwata et al., 2011], the CC might equally reflect secondary damage due to independent bilateral cortical processes (see above) or be a conduit for spread of pathology from one hemisphere to the other [Eisen, 2009; Filippini et al., 2010]. Future studies are needed to assess whether genetic and environmental factors may account for the greater vulnerability of motor callosal fibers in PLS relative to ALS. In PLS, CC mid‐body, but not CST, abnormalities were associated with the severity of the UMN clinical burden based on reflexes. Such a correlation in PLS patients supports the hypothesis of an active cortical process and/or interhemispheric spread of pathology.
We assessed whether FA values from “critical” WM tracts might contribute to distinguish MND variants from controls and each other. The most predictive variable to distinguish MND from controls was FA of the CC‐PMC, which was able to classify correctly 79% of MND patients versus controls, with the highest classification accuracy in PLS (∼90%). The accuracy of CC DT MRI variables in separating MND patients from controls was higher than that of VBM findings. That the CC is a key region in the pathological process of PLS is also supported by the finding that CC‐PMC and CC‐SMA FA had the highest accuracy among DT MRI metrics in distinguishing PLS from ALS cases (∼75%). Furthermore, a model including both CC DT MRI and VBM findings increased significantly the power to discriminate between patient groups. Whether these findings might translate into an early diagnostic separation of PLS from ALS still needs to be investigated. Nevertheless, these findings suggest that the future is likely to involve a multimodal approach including structural and DT MRI biomarkers to create a “signature” applicable to the range of MND phenotypes.
Our findings show that tissue damage in PLS extends beyond the motor system. PLS patients had areas of decreased FA and increased MD in the anterior limb of internal capsule, superior longitudinal fasciculus, fornix, thalamic radiations, genu and splenium of the CC and parietal lobes, bilaterally. Pathologically, the degeneration with ubiquitin inclusions in PLS has been found to extend anteriorly to the nonmotor frontal cortices, as well as ventrally to the temporal cortices [Konagaya et al., 1998; Tan et al., 2003; Mochizuki et al., 2004; Yoshida, 2004; Kosaka et al., 2012]. In PLS cases, phosphorilated TDP‐43 immunohistochemistry revealed the presence of many positively stained neuronal cytoplasmic inclusions and dystrophic neuritis/neuropil threads in the affected frontotemporal cortex and subcortical nuclei [Kosaka et al., 2012]. The thalamus, fornix and CC splenium were found to be damaged in 12 PLS patients in a previous DT MRI study [van der Graaff et al., 2011]. In addition to a pronounced tissue loss in the precentral gyrus, structural MRI studies of PLS showed atrophy extending into the parietal‐occipital regions [Kuipers‐Upmeijer et al., 2001]. Positron emission tomography of these patients detected a reduced regional density of benzodiazepine receptors (a putative index of cortical neuronal density and/or function) in the motor cortex, which also involved the anterior cingulate cortex as well as the parietal and temporal lobes [Le Forestier et al., 2001b; Turner et al., 2007]. In early studies, cognition was reported to be normal in PLS [Konagaya et al., 1998; Sugihara et al., 1999; Tan et al., 2003; Mochizuki et al., 2004]. However, other authors have reported a frontal lobe dysfunction syndrome in some PLS patients [Caselli et al., 1995; Le Forestier et al., 2001a; Piquard et al., 2006]. Future studies including formal neuropsychological testing should evaluate whether the WM extra‐motor abnormalities consistently seen in PLS patients are associated with cognitive impairment.
Given the differences in function and prognosis between PLS and ALS, it would be important to be able to identify as early as possible those patients who have a high probability to retain indefinitely only UMN signs and, conversely, those who will develop LMN signs. Longitudinal studies of patients with isolated UMN signs at onset are now warranted to assess whether diffusivity abnormalities can predict and monitor the subsequent clinical evolution.
REFERENCES
- Agosta F, Chio A, Cosottini M, De Stefano N, Falini A, Mascalchi M, Rocca MA, Silani V, Tedeschi G, Filippi M (2010): The present and the future of neuroimaging in amyotrophic lateral sclerosis. AJNR Am J Neuroradiol 31:1769–1777. [DOI] [PMC free article] [PubMed] [Google Scholar]
- Agosta F, Scola E, Canu E, Marcone A, Magnani G, Sarro L, Copetti M, Caso F, Cerami C, Comi G, Cappa SF, Falini A, Filippi M (2012): White matter damage in frontotemporal lobar degeneration spectrum. Cerebral Cortex 22:2705–2714. [DOI] [PubMed] [Google Scholar]
- Beal MF, Richardson EP, Jr. (1981): Primary lateral sclerosis: A case report. Arch Neurol 38:630–633. [DOI] [PubMed] [Google Scholar]
- Behrens TE, Berg HJ, Jbabdi S, Rushworth MF, Woolrich MW (2007): Probabilistic diffusion tractography with multiple fibre orientations: What can we gain? Neuroimage 34:144–155. [DOI] [PMC free article] [PubMed] [Google Scholar]
- Brooks BR, Miller RG, Swash M, Munsat TL (2000): El Escorial revisited: Revised criteria for the diagnosis of amyotrophic lateral sclerosis. Amyotroph Lateral Scler Other Motor Neuron Disord 1:293–299. [DOI] [PubMed] [Google Scholar]
- Butman JA, Floeter MK (2007): Decreased thickness of primary motor cortex in primary lateral sclerosis. AJNR Am J Neuroradiol 28:87–91. [PMC free article] [PubMed] [Google Scholar]
- Caselli RJ, Smith BE, Osborne D (1995): Primary lateral sclerosis: A neuropsychological study. Neurology 45:2005–2009. [DOI] [PubMed] [Google Scholar]
- Cedarbaum JM, Stambler N, Malta E, Fuller C, Hilt D, Thurmond B, Nakanishi A (1999): The ALSFRS‐R: A revised ALS functional rating scale that incorporates assessments of respiratory function. BDNF ALS Study Group (Phase III) . J Neurol Sci 169:13–21. [DOI] [PubMed] [Google Scholar]
- Ciccarelli O, Behrens TE, Johansen‐Berg H, Talbot K, Orrell RW, Howard RS, Nunes RG, Miller DH, Matthews PM, Thompson AJ, Smith SM (2009): Investigation of white matter pathology in ALS and PLS using tract‐based spatial statistics. Hum Brain Mapp 30:615–624. [DOI] [PMC free article] [PubMed] [Google Scholar]
- Eisen A (2009): Amyotrophic lateral sclerosis‐Evolutionary and other perspectives. Muscle Nerve 40:297–304. [DOI] [PubMed] [Google Scholar]
- Ellis CM, Simmons A, Jones DK, Bland J, Dawson JM, Horsfield MA, Williams SC, Leigh PN (1999): Diffusion tensor MRI assesses corticospinal tract damage in ALS. Neurology 53:1051–1058. [DOI] [PubMed] [Google Scholar]
- Filippini N, Douaud G, Mackay CE, Knight S, Talbot K, Turner MR (2010): Corpus callosum involvement is a consistent feature of amyotrophic lateral sclerosis. Neurology 75:1645–1652. [DOI] [PMC free article] [PubMed] [Google Scholar]
- Fisher CM (1977): Pure spastic paralysis of corticospinal origin. Can J Neurol Sci 4:251–258. [DOI] [PubMed] [Google Scholar]
- Gordon PH, Cheng B, Katz IB, Pinto M, Hays AP, Mitsumoto H, Rowland LP (2006): The natural history of primary lateral sclerosis. Neurology 66:647–653. [DOI] [PubMed] [Google Scholar]
- Hudson AJ, Kiernan JA, Munoz DG, Pringle CE, Brown WF, Ebers GC (1993): Clinicopathological features of primary lateral sclerosis are different from amyotrophic lateral sclerosis. Brain Res Bull 30:359–364. [DOI] [PubMed] [Google Scholar]
- Iwata NK, Kwan JY, Danielian LE, Butman JA, Tovar‐Moll F, Bayat E, Floeter MK (2011): White matter alterations differ in primary lateral sclerosis and amyotrophic lateral sclerosis. Brain 134:2642–2655. [DOI] [PMC free article] [PubMed] [Google Scholar]
- Kiernan JA, Hudson AJ (1994): Frontal lobe atrophy in motor neuron diseases. Brain 117 (Pt 4):747–757. [DOI] [PubMed] [Google Scholar]
- Konagaya M, Sakai M, Matsuoka Y, Konagaya Y, Hashizume Y (1998): Upper motor neuron predominant degeneration with frontal and temporal lobe atrophy. Acta Neuropathol 96:532–536. [DOI] [PubMed] [Google Scholar]
- Kosaka T, Fu YJ, Shiga A, Ishidaira H, Tan CF, Tani T, Koike R, Onodera O, Nishizawa M, Kakita A, Takahashi H (2012): Primary lateral sclerosis: Upper‐motor‐predominant amyotrophic lateral sclerosis with frontotemporal lobar degeneration—Immunohistochemical and biochemical analyses of TDP‐43. Neuropathology 373;–384. [DOI] [PubMed] [Google Scholar]
- Kuipers‐Upmeijer J, de Jager AE, Hew JM, Snoek JW, van Weerden TW (2001): Primary lateral sclerosis: Clinical, neurophysiological, and magnetic resonance findings. J Neurol Neurosurg Psychiatry 71:615–620. [DOI] [PMC free article] [PubMed] [Google Scholar]
- Le Forestier N, Maisonobe T, Piquard A, Rivaud S, Crevier‐Buchman L, Salachas F, Pradat PF, Lacomblez L, Meininger V (2001a): Does primary lateral sclerosis exist? A study of 20 patients and a review of the literature. Brain 124:1989–1999. [DOI] [PubMed] [Google Scholar]
- Le Forestier N, Maisonobe T, Spelle L, Lesort A, Salachas F, Lacomblez L, Samson Y, Bouche P, Meininger V (2001b): Primary lateral sclerosis: Further clarification. J Neurol Sci 185:95–100. [DOI] [PubMed] [Google Scholar]
- Meyer BU, Roricht S, Woiciechowsky C (1998): Topography of fibers in the human corpus callosum mediating interhemispheric inhibition between the motor cortices. Ann Neurol 43:360–369. [DOI] [PubMed] [Google Scholar]
- Mochizuki A, Komatsuzaki Y, Iwamoto H, Shoji S (2004): Frontotemporal dementia with ubiquitinated neuronal inclusions presenting with primary lateral sclerosis and parkinsonism: Clinicopathological report of an autopsy case. Acta Neuropathol 107:377–380. [DOI] [PubMed] [Google Scholar]
- Muller HP, Unrath A, Huppertz HJ, Ludolph AC, Kassubek J (2012): Neuroanatomical patterns of cerebral white matter involvement in different motor neuron diseases as studied by diffusion tensor imaging analysis. Amyotroph Lateral Scler 13:254–264. [DOI] [PubMed] [Google Scholar]
- Neary D, Snowden JS, Gustafson L, Passant U, Stuss D, Black S, Freedman M, Kertesz A, Robert PH, Albert M, Boone K, Miller BL, Cummings J, Benson DF (1998): Frontotemporal lobar degeneration: A consensus on clinical diagnostic criteria. Neurology 51:1546–1554. [DOI] [PubMed] [Google Scholar]
- Nichols TE, Holmes AP (2002): Nonparametric permutation tests for functional neuroimaging: A primer with examples. Hum Brain Mapp 15:1–25. [DOI] [PMC free article] [PubMed] [Google Scholar]
- Piquard A, Le Forestier N, Baudoin‐Madec V, Delgadillo D, Salachas F, Pradat PF, Derouesne C, Meininger V, Lacomblez L (2006): Neuropsychological changes in patients with primary lateral sclerosis. Amyotroph Lateral Scler 7:150–160. [DOI] [PubMed] [Google Scholar]
- Pringle CE, Hudson AJ, Munoz DG, Kiernan JA, Brown WF, Ebers GC (1992): Primary lateral sclerosis. Clinical features, neuropathology and diagnostic criteria. Brain 115 (Pt 2):495–520. [DOI] [PubMed] [Google Scholar]
- Smith SM, Nichols TE (2009): Threshold‐free cluster enhancement: Addressing problems of smoothing, threshold dependence and localisation in cluster inference. Neuroimage 44:83–98. [DOI] [PubMed] [Google Scholar]
- Smith SM, Jenkinson M, Johansen‐Berg H, Rueckert D, Nichols TE, Mackay CE, Watkins KE, Ciccarelli O, Cader MZ, Matthews PM, Behrens TE (2006): Tract‐based spatial statistics: Voxelwise analysis of multi‐subject diffusion data. Neuroimage 31:1487–1505. [DOI] [PubMed] [Google Scholar]
- Sugihara H, Horiuchi M, Kamo T, Fujisawa K, Abe M, Sakiyama T, Tadokoro M (1999): A case of primary lateral sclerosis taking a prolonged clinical course with dementia and having an unusual dendritic ballooning. Neuropathology 19:77–84. [DOI] [PubMed] [Google Scholar]
- Suh SI, Song IC, Koh SB (2006): Primary lateral sclerosis with MR diffusion tensor image and tract tracking. Am J Phys Med Rehabil 85:863–864. [DOI] [PubMed] [Google Scholar]
- Tan CF, Kakita A, Piao YS, Kikugawa K, Endo K, Tanaka M, Okamoto K, Takahashi H (2003): Primary lateral sclerosis: A rare upper‐motor‐predominant form of amyotrophic lateral sclerosis often accompanied by frontotemporal lobar degeneration with ubiquitinated neuronal inclusions? Report of an autopsy case and a review of the literature. Acta Neuropathol 105:615–620. [DOI] [PubMed] [Google Scholar]
- Tartaglia MC, Laluz V, Rowe A, Findlater K, Lee DH, Kennedy K, Kramer JH, Strong MJ (2009): Brain atrophy in primary lateral sclerosis. Neurology 72:1236–1241. [DOI] [PubMed] [Google Scholar]
- Turner MR, Agosta F, Bede P, Govind V, Lule D, Verstraete E (2012): Neuroimaging in ALS. Biomarkers Med 6:319–337. [DOI] [PubMed] [Google Scholar]
- Turner MR, Cagnin A, Turkheimer FE, Miller CC, Shaw CE, Brooks DJ, Leigh PN, Banati RB (2004): Evidence of widespread cerebral microglial activation in amyotrophic lateral sclerosis: An [11C](R)‐PK11195 positron emission tomography study. Neurobiol Dis 15:601–609. [DOI] [PubMed] [Google Scholar]
- Turner MR, Hammers A, Al‐Chalabi A, Shaw CE, Andersen PM, Brooks DJ, Leigh PN (2007): Cortical involvement in four cases of primary lateral sclerosis using [(11)C]‐flumazenil PET. J Neurol 254:1033–1036. [DOI] [PubMed] [Google Scholar]
- Ulug AM, Grunewald T, Lin MT, Kamal AK, Filippi CG, Zimmerman RD, Beal MF (2004): Diffusion tensor imaging in the diagnosis of primary lateral sclerosis. J Magn Reson Imaging 19:34–39. [DOI] [PubMed] [Google Scholar]
- Unrath A, Muller HP, Riecker A, Ludolph AC, Sperfeld AD, Kassubek J (2010): Whole brain‐based analysis of regional white matter tract alterations in rare motor neuron diseases by diffusion tensor imaging. Hum Brain Mapp 31:1727–17240. [DOI] [PMC free article] [PubMed] [Google Scholar]
- van der Graaff MM, Sage CA, Caan MW, Akkerman EM, Lavini C, Majoie CB, Nederveen AJ, Zwinderman AH, Vos F, Brugman F, van den Berg LH, de Rijk MC, van Doorn PA, Van Hecke W, Peeters RR, Robberecht W, Sunaert S, de Visser M (2011): Upper and extra‐motoneuron involvement in early motoneuron disease: A diffusion tensor imaging study. Brain 134:1211–1228. [DOI] [PubMed] [Google Scholar]
- Weber M, Stewart H, Hirota N, Eisen A (2002): Corticomotoneuronal connections in primary lateral sclerosis (PLS). Amyotroph Lateral Scler Other Motor Neuron Disord 3:190–198. [DOI] [PubMed] [Google Scholar]
- Yoshida M (2004): Amyotrophic lateral sclerosis with dementia: the clinicopathological spectrum. Neuropathology 24:87–102. [DOI] [PubMed] [Google Scholar]