

Abstract
Magnetic susceptibility differences at tissue interfaces lead to signal loss in conventional gradient‐echo (GE) EPI. This poses a problem for fMRI in language and memory paradigms, which activate the most affected regions. Two methods proposed to overcome this are spin‐echo EPI and dual GE EPI, where two EPI read‐outs are serially collected at a short and longer echo time. The spin‐echo method applies a refocusing pulse to recover dephased MR signal due to static field inhomogeneities, but is known to have a relatively low blood oxygenation level dependant (BOLD) sensitivity. In comparison, GE has superior BOLD sensitivity, and by employing an additional shorter echo, in a dual GE sequence, it can reduce signal loss due to spin dephasing. We directly compared dual GE and spin‐echo fMRI during a semantic categorization task, which has been shown to activate the inferior temporal region—a region known to be affected by magnetic susceptibility. A whole brain analysis showed that the dual GE resulted in significantly higher activation within the left inferior temporal fusiform (ITF) cortex, compared to spin‐echo. The inferior frontal gyrus (IFG) was activated for dual GE, but not spin‐echo. Regions of interest analysis was carried out on the anterior and posterior ITF, left and right IFG, and part of the cerebellum. Dual GE outperformed spin‐echo in the anterior and posterior ITF and bilateral IFG regions, whilst being equal in the cerebellum. Hence, dual GE should be the method of choice for fMRI studies of inferior temporal regions. Hum Brain Mapp 35:4118–4128, 2014. © 2014 Wiley Periodicals, Inc.
Keywords: dual echo, spin echo, EPI, magnetic susceptibility, inferior temporal lobe
INTRODUCTION
Single shot gradient‐echo (GE) echo planar imaging (EPI) is the method of choice for the majority of fMRI research. Although this method offers high contrast‐to‐noise ratio (CNR), it is affected by magnetic field inhomogeneity artifacts, which include signal loss, image blurring and geometric distortion. Signal loss is caused by phase dispersion within the voxel and is predominately due to the through‐plane (z‐direction) local susceptibility‐induced field gradients due to the interface of tissues with different magnetic susceptibilities such as brain and air. This is a particular problem in the inferior temporal lobes as the specific anatomy at the base of the brain results in larger field gradients in the z‐direction. Signal loss is exacerbated at higher field strengths [Deichmann et al., 2002; Jezzard et al., 2001; Schmithorst et al., 2001; Weiskopf et al., 2006]. The frequency shift of the MR signal by in‐plane local field gradients, however, results in pixel shift and hence distortion of the images. These distortion artifacts are more prominent in the phase‐encoding direction, because the data sampling rate is much lower than in the frequency‐encoding direction, and small frequency shifts will lead to larger shifts in distance in the eventual image [Deichmann et al., 2002]. Parallel imaging techniques such as SENSE [Pruessmann et al., 1999] can reduce, but not solve, distortion, and signal loss by reducing the time needed for data sampling.
Signal loss in inferior regions presents a particular problem for fMRI as these regions become inaccessible for statistical analysis and may be interpreted as false negative activation. There have been many attempts to overcome this problem for fMRI, using methods such as tailored radiofrequency pulses [Cho and Ro, 1992; Stenger et al., 2000], z‐shimming [Constable and Spencer, 1999; Cordes et al., 2000; Deichmann, et al., 2002; Frahm et al., 1988; Ordidge et al., 1994], optimization of the slice orientation [De Panfilis and Schwarzbauer, 2005; Deichmann et al., 2003], reduced slice thickness [Bellgowan et al., 2006], passive shimming using mouth inserts [Cusack et al., 2005], alternative k‐space sampling strategies [Glover and Law, 2001], dual gradient and spin‐echo acquisition [Schwarzbauer and Porter, 2010; Schwarzbauer et al., 2010], and multiecho acquisitions [Poser and Norris, 2007; Poser et al., 2006; Posse et al., 1999; Volz et al., 2009].
In contrast to a GE approach, a spin‐echo EPI is robust against signal loss caused by magnetic field inhomogeneities due to the 180° refocusing pulse. Image distortion problems remain but spin‐echo is also amenable to distortion correction of the recovered signal [Embleton et al., 2010]. A study using spin‐echo fMRI showed frontopolar and ventral frontomedial activity during a Stroop color‐word matching task, which could not be detected using GE [Norris et al., 2002]. Furthermore, a comparison of fMRI activation measured with GE and spin‐echo during visual perception of faces outlined similar regions related to face perception. However, only the spin‐echo method detected activity within the orbital‐frontal cortex, which is known to be affected by signal dropout [Schmidt et al., 2005]. The authors noted that within the regions that were detected by both methods, the size of the clusters and strength of activity was larger for the GE method. Indeed many studies have identified an approximate three‐fold blood oxygenation level dependant (BOLD) sensitivity reduction for spin‐echo in comparison to GE at 3T [Bandettini et al., 1994; Jezzard et al., 2001; Jones et al., 1998; Lowe et al., 2000; Norris et al., 2002; Parkes et al., 2005; Schmidt et al., 2005; Stroman et al., 2001]. For spin‐echo the trade‐off is to be able to detect signal in regions that are normally inaccessible by GE but at a lower detection sensitivity over the whole brain. There is also evidence that spin‐echo can provide better spatial localization than GE using 3T fMRI [Norris et al., 2002; Parkes et al., 2005; Thulborn et al., 1997], due to reduced sensitivity to large vessels [Boxerman et al., 1995; Kennan et al., 1994].
An alternative approach to reduce the signal dropout is to use a multi GE technique [Poser and Norris, 2007, 2009], where multiple gradient echoes are collected following each RF pulse. Maximum BOLD contrast is achieved with a long echo time (long_TE) that is equal to the T2* of a region [Bandettini et al., 1994]. However, a long_TE results in more time for spin dephasing and hence increased signal loss in regions of variable magnetic susceptibility. Therefore, one can combine this with a shorter TE (short_TE) to reduce signal dephasing, but at the cost of reduced contrast sensitivity. In addition, T2* varies across brain regions and between subjects, therefore sampling at only one echo time may not be optimal across the brain. Multiecho techniques can improve the fMRI data by reducing signal dropout, whilst improving or at least maintaining BOLD contrast sensitivity [Poser et al., 2006]. Furthermore, a substantial improvement was shown when comparing multiecho and standard GE methods at 7T, during a Stroop task [Poser and Norris, 2009]. The signal at different echo times can be combined, with the optimum strategy found to be weighted CNR [Poser et al., 2006]. These studies suggest that the multiecho method provides a viable alternative to the spin‐echo method. However, these approaches have not been directly compared, which is the principle aim of this work.
There is growing evidence that the anterior and inferior temporal regions, which are affected by signal dropout, are critical for semantic cognition; with evidence based on TMS [Pobric et al., 2007, 2010], MEG [Marinkovic et al., 2003], PET [Mummery et al., 2000; Tranel et al., 2005; Vandenberghe et al., 1996] and neuropsychology [Hodges et al., 1992; Patterson et al., 2007]. However, most fMRI research fails to identify these regions, and focuses mainly on posterior superior temporal sulcus (pSTS), posterior medial temporal gyrus (pMTG) and inferior frontal gyrus (IFG) regions [Devlin et al., 2000; Thompson‐Schill et al., 1997]. A recent meta analysis has suggested that this inconsistency between fMRI and other neuroimaging methods may lie in technical deficiencies of the standard fMRI acquisition protocol [Visser et al., 2009]. For example, they found three main factors that influence anterior temporal lobe (ATL) detection: (1) the modality, PET is more likely to find ATL activity than fMRI (no signal loss in anterior/inferior regions); (2) the field of view (studies with field of view <15 cm in the head‐foot axis may miss the edges of the brain space including the ATL); and (3) the control task used (low level control tasks or rest can allow subjects to generate inner speech during this period). The impact of signal dropout on the ability to detect ATL activations was demonstrated by a study that compared PET and fMRI [Devlin et al., 2000]. They used a semantic categorization task, and directly compared 3T GE fMRI with H2O15 PET. Both techniques found activity within the prefrontal regions for the semantic task over a control letter task, however, ATL activations (especially in the left anterior inferior temporal lobe) was only found using H2O15 PET. Therefore, PET offers one possible solution for investigating semantic cognition, but it does have a number of drawbacks in comparison to fMRI. Further support comes from work using spin‐echo fMRI on similar language tasks. Visser et al. [2010] replicated Devlin et al.'s [2000] paradigm and showed significant activity within inferior temporal fusiform cortex (ITF). Whereas Binney et al. [2010] used a synonym judgment task contrasted against a number judgement task to show activity within the ITF cortex. The conclusions from these studies point to this region being involved in semantic knowledge, and theories investigating semantic cognition would need to use an fMRI acquisition that allows for suitable detection of this critical region.
Our principle aim was to compare dual GE and spin‐echo fMRI for investigating the inferior temporal lobe. Specifically, the dual GE consisted of a short_TE (12 ms) to minimize signal loss and a long_TE (35 ms) to maximize BOLD sensitivity for the whole brain. The results of these individual echoes are presented for purposes of replication of the effects of field inhomogeneities. The echoes were combined using two methods; a linear summation (dual_sum) and CNR‐weighted average (dual_weighted). A spin‐echo acquisition was used based on parameters used in previous fMRI studies [Binney et al., 2010; Visser et al., 2010]. We used a semantic categorization task [Devlin et al., 2000; Visser et al., 2010], which allowed us to focus on particular regions of interest (the inferior temporal lobe and frontal lobe). The questions that we considered were: (1) which acquisition protocol is the method of choice for detecting activity within ITF and/or extra temporal regions? and (2) which method of combining the two gradient echoes is superior? The semantic contrast (words over letters) was compared using statistical parametric mapping on a voxel‐wise basis across the whole brain and within regions of interest (ITF, IFG, and cerebellum).
METHODS
Subjects
Seventeen participants (mean age = 24 years, SD = 3.4 years, 6 males) took part in the study. All subjects were right handed, scoring at least 85 in the Edinburgh Inventory [Oldfield, 1971], native English speakers and had normal or corrected‐to‐normal vision. The research was approved by a local National Health Service (NHS) ethics committee.
Experimental Paradigm
E‐PRIME software was used for the presentation of the stimuli. The participants completed semantic and letter categorization tasks as described by Devlin et al. [2000]. The task was an ABCX judgement task, where participants were presented with three words sequentially from a single semantic category and then had to decide if a fourth word was related to that category (e.g., taxi, boat, bicycle followed by AEROPLANE vs. taxi, boat, bicycle followed by SPOON). All concepts and categories were drawn from the manmade domain and controlled for psycholinguistic properties (such as word frequency, familiarity, and letter length). The semantic categorization task was contrasted with a control letter categorization task, in which subjects viewed a series of lower‐case, letter strings matched to the length of the words. Participants saw three strings of a specific letter sequentially and then had to decide if a fourth letter string (in capitals) was the same letter (e.g., rrrr, rrr, rrrrr followed by RRR or DDDD). The study was presented in a random block design, and was made up of experimental blocks and rest blocks each lasting 15 s. There were 15 semantic judgment blocks and 15 letter judgment blocks, and a rest block in between each task block, where subjects were presented with a fixation cross. Within each semantic and letter block there were 4 epochs. Each epoch lasted 3750 ms, where each item was present for 200 ms with an inter stimulus interval of 400 ms. The fourth item was presented in uppercase for 1750 ms and was underlined to indicate that a decision was required. A fixation was present for 200 ms after the target item, before the next epoch started. The participants were asked to respond by pressing one of two buttons held in the right hand.
Image Acquisition
All imaging was performed on a 3T Philips Achieva scanner using an eight element SENSE head coil with a SENSE factor of 2.5. The functional protocols were set to be replicable on basic clinical scanners, with emphasis on the FOV to cover the whole brain (sacrificing some resolution). The dual‐echo EPI acquisition used a short_TE and long_TE of 12 and 35 ms, respectively and a TR of 3680 ms. The short_TE (12 ms) serves as a compromise between reduced signal loss and sufficient contrast sensitivity. Poser et al. [2006] used 11 ms for the shortest echo in a functional study, which produced sensible results with reasonable CNR. A long_TE (35 ms) was used as it has been shown to be optimum for whole brain sensitivity [Poser et al., 2006]. The functional parameters were: 42 slices, 96 × 96 acquisition matrix, 240 × 240 × 126 mm FOV, in‐plane resolution 2.5 × 2.5 mm2, and slice thickness 3 mm (no gap) and an anterior‐posterior (A‐P) phase encoding direction; 249 volumes were collected giving an acquisition time of 15 min. The dual GE was not specifically optimized to reduce signal loss in terms of slice orientation or slice thickness (e.g., thinner slices; [Robinson et al., 2004]), but instead kept similar to the spin‐echo for comparison. In fact, use of thinner slices and a thicker slice gap could have been counter‐productive as this would have reduced the SNR and may not have achieved any greater reduction in signal loss than the use of the short GE. A relatively high in‐plane resolution was chosen in order to reduce in‐plane susceptibility‐induced signal losses, which can be problematic in the inferior temporal lobes [Weiskopf et al., 2007].
The spin‐echo sequence included 42 slices covering the whole brain with echo time (TE) = 75 ms (used previously by [Binney et al., 2010; Visser et al., 2010]), repetition time (TR) = 4150 ms, 96 × 96 acquisition matrix, 240 × 240 × 126 mm FOV, in‐plane resolution 2.5 × 2.5 mm2, and slice thickness 3 mm (no gap); 218 volumes were collected, giving a total duration of 15 min. The spin‐echo was collected in the left‐right (L‐R) phase encoding direction, as pilot data showed severe ghosting artefacts on the inferior temporal lobes when using an A‐P encoding. Previous studies have also used this encoding direction and demonstrated robust activation in the inferior temporal regions [Binney et al., 2010; Embleton et al., 2010; Visser et al., 2010]. Prior to the spin‐echo functional run, two identical spin‐echo images were acquired except that the phase encoding directions were reversed, to achieve sets of images matching the functional time‐series but with opposing direction distortions (left‐right and right‐left) for image distortion correction [Embleton et al., 2010].
A high resolution T1‐weighted structural image was acquired using a 3D MP‐RAGE pulse sequence, with in‐plane resolution of 0.94 mm and slice thickness 0.9 mm, TR = 8.4 ms, TE = 3.9 ms, and 200 slices. This was collected as a reference to provide a qualitative indication of distortion correction accuracy and for coregistration purposes. The order of the spin‐echo and dual‐echo acquisition was randomized across participants.
FMRI Data Analyses
Pre‐processing
First the spin‐echo images were corrected for distortion using the two prescans as has been described and used elsewhere [Binney et al., 2010; Embleton et al., 2010; Visser et al., 2010]. In brief, the prescans were used to compute a spatial remapping matrix that is then applied to the functional time‐series following registration. The dual‐echo data was not corrected for distortion as the reference scan for the spin‐echo was acquired in L‐R phase encoding direction, and no B0 map was collected prior to the GE scan. Pre‐processing steps were applied to the dual gradient echo images to extract and combine the short_TE and long_TE images for each TR, using in‐house MATLAB code (available upon request). We had two methods of combination, dual_sum and dual_weighted. The dual_sum volume was created by simply adding together the images at each echo‐time. The dual_weighted volume was created using the method of Poser et al. [2006], where the CNR at each voxel was determined as a product of the temporal SNR and TE. A weight was determined for the short_TE and long_TE at each voxel, and was used to combine the corresponding image volumes.
Subsequent processing and statistical analysis was carried out using statistical parametric mapping (SPM8) software (Wellcome Trust Centre for Neuroimaging). The same procedures were applied to short_TE, long_TE, dual_sum, dual_weighted, and the distortion‐corrected spin echo data. Functional image volumes were corrected for motion artifacts by registering to the first image volume using a rigid body spatial transformation (for the combined echo data, realignment was done after combining the short and long echo images). Functional image volumes were then transformed into standard stereotaxic space, according to the Montreal Neurological Institute (MNI) protocol. However, before this we considered the masking threshold that is imposed by default in SPM, to remove non‐brain and low signal voxels. The default mask is calculated per individual and only includes voxels whose mean signal is at least 80% of the global signal across all raw image volumes. For the long_TE, this results in voxels within the ITF and orbito‐frontal region being removed. Hence, we analyzed the long_TE data in two ways, one without application of a mask, and one using this default masking approach. The mean image for each technique was coregistered to the subjects' T1‐weighted image. The T1‐weighted image was then segmented (gray and white matter) and normalized to MNI space using a 12‐parameter affine transformation and a nonlinear discrete cosine transformation. The normalized gray matter image is converted into a binary mask and used as the statistical mask for analysis. The same MNI transformations were then used to normalize each functional volume to MNI space. The EPI volumes were re‐sampled to 3 × 3 × 3 mm voxel size using tri‐linear interpolation. Images were then smoothed with an 8 mm full‐width half maximum (FWHM) Gaussian filter. The relatively large width of the filter was chosen in order to ensure that any observed differences between the methods would not be due to interpolation artifacts. Images were temporally filtered using a high‐pass filter with a cut‐off of 90 s (0.01 Hz).
Statistical analysis
Data were analyzed using the general linear model approach. At the individual subject level each task was modeled as a boxcar function (resting blocks were modeled implicitly) and subsequently convolved with the canonical hemodynamic response function. Contrasts were calculated to assess differences in activations between the word and letter task. The whole brain multi‐subject analysis was carried out using a random effects model with a one sample t‐test. The group t‐map was assessed for cluster‐wise significance using a cluster defining threshold of P = 0.005, and the P = 0.05 FWE‐corrected cluster size was 150 voxels. An a priori ROI analysis was performed using the MarsBar toolbox (http://marsbar.sourceforge.net/). Anatomical region of interest masks for the left and right IFG and left anterior and posterior ITF were obtained from the Oxford centre for Functional MRI of the Brain (FMRIB; http://www.fmrib.ox.ac.uk/fsl/) based on the Harvard‐Oxford atlas. The anatomical mask for the cerebellum however is much larger than the activated region, so we instead used a sphere (10 mm radius) centred on the peak activation voxel from Visser et al. [2010]. MarsBar was used to extract mean z‐scores within the a priori regions for the words > letter contrast and each acquisition method. Methods were considered to be significantly different if their z‐scores differed by 2.58 or more, corresponding to P = 0.01.
RESULTS
Behavioral Measures
The behavioral data based on the semantic categorization task is summarized in Figure 1. A composite score (reaction time/accuracy) was used to determine if participants differed in behavior during dual‐echo and spin‐echo acquisition. A 2 (dual‐echo and spin‐echo) × 2 (word and letter) ANOVA showed no main effect of method (F(1,27) = 1.417, P = 0.244), but a main effect of condition type was shown (F(1,27) = 48.006, P < 0.001). Post‐hoc analysis showed that the word condition had a higher composite score (i.e., worse performance) in comparison to the control letter task (P < 0.001). No interaction effects were observed (F(1,27) = 0.346, P = 0.591). This shows that although the letter task was easier than the word task, participants were performing them equally during dual‐echo and spin‐echo, removing any potential performance bias between methods.
Figure 1.
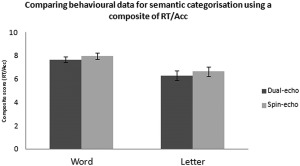
Behavioral composite scores (reaction time/accuracy) during the semantic categorization task for each acquisition method, dual‐echo and spin echo. Error bars represent standard error.
Whole Brain Analysis
Before group level analysis was carried out, three subjects were removed for excessive movement during the scan (>5 mm in any direction). The subsequent analysis was done on 14 subjects. Figure 2 shows the contrast “word > letter,” thresholded at a voxel height of P = 0.005 (FWE cluster corrected at P = 0.05). Figure 2a shows a replication of previous data [Devlin et al., 2000; Visser et al., 2010], where the spin‐echo activations (red) are compared with conventional long_TE (green). However, Figure 2b, shows the same comparison of spin‐echo (red) with long_TE without a masking threshold (green), which exposes the limitation of the default masking procedure in parts of the inferior temporal lobe. Figure 2c, shows the spin‐echo activation (red) compared to the short_TE (green), where large inferior temporal activity can be seen for the short_TE. Lastly, Figure 2d,e show the spin‐echo activations (red) compared to dual_sum and dual_weighted, respectively, where large activations can be seen in the inferior temporal lobe for the dual GE. Surprisingly, the spin‐echo activation does not extend anteriorally as far as the long_TE activation when the mask was removed. However, when using a masking procedure that removes the low‐signal voxels, the spin‐echo is comparatively better within this region. Interestingly, the spin‐echo shows activity within the cerebellum, with no GE method showing activity here surviving correction at the current threshold. However, cerebellum activity for dual GE methods is seen at less stringent threshold levels (voxel height threshold P = 0.005, FWE cluster corrected P = 0.08; figure not shown).
Figure 2.
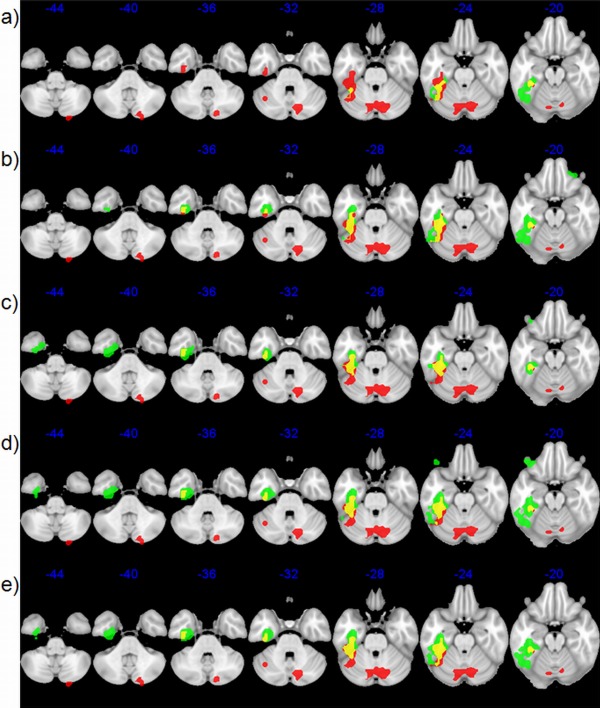
Significant fMRI activations, cluster corrected at FWE = 0.05, at a height threshold of P = 0.005 for semantic categorization using various acquisition methods in the temporal lobe. Each row shows the spin‐echo (red) clusters with different acquisition methods (green) and overlapping regions (yellow). (a) Default‐mask long GE; (b) modified‐mask long GE; (c) short GE; (d) dual GE SUM; and (e) dual GE wCNR. [Color figure can be viewed in the online issue, which is available at http://wileyonlinelibrary.com.]
Region of Interest (ROI) Analysis
Binary anatomical masks were used based on the Harvard‐Oxford atlas. Figure 3, shows where the IFG, ITF and cerebellum masks are located for the subsequent analysis. Although the main comparison is between the spin‐echo and dual GE, the results from the individual echoes from the dual GE are shown for illustration of how each echo contributes. Figure 3 also shows the averaged z‐scores within each ROI across methods (bar colors represent z‐scores within the ROIs). Table 1 shows the difference in z‐scores between the methods, where differences that are significant at P = 0.01 are marked in red (z‐score difference > 2.58), and P = 0.05 are marked in orange (z‐score difference > 1.96). For Figure 3 and Table 1, the long_TE refers to the analysis without a mask, as it produced better activations within the inferior temporal lobe than the long_TE with a default‐mask.
Figure 3.
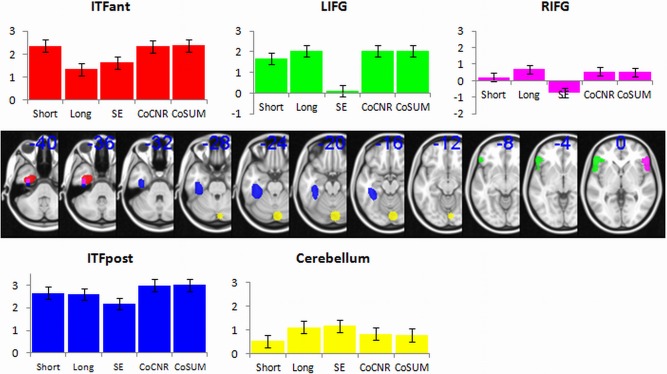
Regions of interest analysis comparing group level z‐scores. The ROI masks are shown in standard MNI space; left posterior inferior temporal fusiform (ITFpost, blue), left anterior inferior temporal fusiform (ITFant, red), left inferior frontal gyrus (LIFG, green), right inferior frontal gyrus (RIFG, purple) and cerebellum (yellow). The graph shows the average z‐scores within these ROIs, for each fMRI acquisition method. Error bars represent standard error across subjects. [Color figure can be viewed in the online issue, which is available at http://wileyonlinelibrary.com.]
Table 1.
Showing the difference between fMRI methods activity within each ROI in terms of statistical distance (z‐score)
| Long | SE | CoCNR | CoSUM | ||
|---|---|---|---|---|---|
| ITFant | Short | −3.76a | −2.70a | −0.09 | 0.06 |
| Long | 1.06 | 3.67a | 3.82a | ||
| SE | 2.61a | 2.76a | |||
| CoCNR | 0.15 | ||||
| ITFpost | Short | −0.22 | −1.79 | 1.23 | 1.30 |
| Long | −1.58 | 1.45 | 1.51 | ||
| SE | 3.03a | 3.09a | |||
| CoCNR | 0.06 | ||||
| LIFG | Short | 1.33 | −5.87a | 1.33 | 1.32 |
| Long | −7.20a | −0.01 | −0.01 | ||
| SE | 7.20a | 7.20a | |||
| CoCNR | −0.01 | ||||
| RIFG | Short | 1.78 | −3.53a | 1.26 | 1.11 |
| Long | −5.31a | −0.53 | −0.67 | ||
| SE | 4.79a | 4.64a | |||
| CoCNR | −0.15 | ||||
| Cerebellum | Short | 2.16b | 2.38b | 1.12 | 0.95 |
| Long | 0.22 | −1.04 | −1.21 | ||
| SE | −1.26 | −1.43 | |||
| CoCNR | −0.17 |
A positive value indicates that the method in the column is superior to the method in the row.
z‐differences greater than ±2.58 (P = 0.01).
Values greater than ±1.96 (P = 0.05).
In the anterior ITF the long_TE was no better than spin‐echo (Δz = 1.06). The short_TE was superior to the long_TE (Δz = 3.76) and spin‐echo (Δz = 2.70). Both dual‐echo methods (sum and wCNR) performed better than the long_TE (Δz = 3.82 and 3.67) and spin‐echo (Δz = 2.76 and 2.61). In summary, the dual‐echoes or the short_TE are superior for imaging this region.
For the posterior ITF portion, the results are similar to the anterior portion except that the dual‐echoes and the short_TE no longer have an advantage over the long_TE, making any of these methods suitable for imaging in this region.
The results in the IFG showed that spin‐echo produced little activation within these regions. All GE methods produced significantly higher values than spin‐echo in LIFG, but there were no differences between GE methods (see Table 1). The same pattern emerges from the RIFG, although it is noted that the overall values are lower than LIFG (see Fig. 3). Interestingly, at the whole brain analysis the short_TE did not show activation surviving cluster correction in the RIFG except at the ROI level. There were no differences between short_TE and long_TE, but there was a weak trend for short_TE to be worse than long_TE (Δz = 1.97). After further analysis, when testing whether the z‐score in the RIFG were significantly above zero, the short_TE was not (Δz = 0.80), but the other GE methods were greater than zero (long_TE Δz = 2.59, dual_sum Δz = 1.92, dual_weighted Δz = 2.06). On the contrary the spin‐echo shows a significant reduction in the RIFG (Δz = 2.73), when testing against no overall change.
In the cerebellum the comparison of z‐scores showed the spin‐echo signal trending to be higher than short_TE (Δz = 2.38). Furthermore, the long_TE showed a similar trend (Δz = 2.16). Therefore, there appears to be some detriment of using short_TE alone for activity within the cerebellum. However, there were no differences between spin‐echo and dual_sum (Δz = 1.43) or dual_weighted (Δz = 1.26).
In summary, taking all regions into account the dual‐echo approach is superior. The choice of combination method is not important as there was no significant difference between the two combined methods in any region.
DISCUSSION
The aim of this study was to compare dual GE and spin‐echo fMRI for investigating parts of the inferior temporal lobe that suffer signal loss. A semantic categorization paradigm was used that is known to activate the anterior/inferior temporal lobe when using PET [Devlin et al., 2000] or distortion corrected spin‐echo fMRI [Visser et al., 2010]. In the first instance, results from the long_TE acquisition replicated those from Devlin et al. [2000], whereby activation in the anterior inferior temporal lobe was not found due to signal loss. It is somewhat misleading to compare the activity from dual‐echo and spin‐echo methods to the long_TE as it was not optimized to reduce signal loss in inferior regions. However, this comparison does provide an illustration of how the two novel methods perform in comparison to a GE acquisition that is optimized for whole brain analysis. For example, the spin‐echo acquisition performed significantly better than the long_TE acquisition for detecting activity within inferior temporal regions. As reviewed earlier, the spin‐echo method has been used successfully to investigate these problematic regions [e.g., Binney et al., 2010; Embleton et al., 2010; Norris et al., 2002]. It should be noted however, when removing the mask for the long_TE data analysis there was no difference between this and the spin‐echo in the anterior ITF. Although, this post‐hoc masking method does seem to provide benefit in the current study, a long echo is unlikely to provide robust signal within the susceptible regions, and so a method designed to avoid signal loss during the data collection is preferred. However, this data does demonstrate that even in very low‐signal regions there may be important activations present. Therefore, careful attention should be paid to masking procedures within whichever imaging software is being used.
The dual GE outperformed the long_TE in the same region. This is due to the effect of the individual short_TE of the dual GE protocol, where a comparison of this echo with spin‐echo and long_TE shows superior detection of activity within the anterior ITF. It should be noted that the poor contrast sensitivity of the short_TE resulted in poor detection of activity within the cerebellum and right IFG, whereas the superior contrast sensitivity for the long_TE resulted in large activations in bilateral IFG and no difference in the cerebellum with spin‐echo. Therefore, the comparison of the individual echoes from the dual GE provides us with an illustration of how they both contribute to the dual method. Although the combination of these individual GE es (dual_sum and dual_weighted) did not differ, they performed better (or equally) than the spin‐echo method at the whole brain and ROI level of analysis. The spin‐echo detected little frontal activity, whereas the dual GE method had high bilateral activity. It should be noted that other studies using spin‐echo and similar paradigms have found IFG activity [Binney et al., 2010; Embleton et al., 2010; Visser et al., 2010].
There is evidence that spin‐echo can provide better spatial localization [Norris et al., 2002; Parkes et al., 2005; Thulborn et al., 1997]. Our data does show a smaller cluster within the anterior ITF for the spin‐echo in comparison to the GE methods, which could be the result of the spatial sensitivity towards smaller vessels. However, even when smaller frontal ROIs were used, based on peak activations from Visser et al. [2010] and Binney et al. [2010], the results did not change.
The results obtained were compared within the same participants in the same session. The behavioral scores for the semantic categorization task were not significantly different for the dual GE and spin‐echo methods, suggesting any differences in neural activity between methods are unlikely to be related to task performance. We note that the control letter task was easier than the word task (reflected in quicker accuracy for letters). However, this did not have a detrimental effect on the overall outcome of detecting activity within the inferior temporal lobe as also found in Devlin et al. [2000] study. It is possible that a control task that is more closely matched to the difficulty of the word category condition would exaggerate the effect seen in the anterior/posterior ITF. For example, Binney et al. [2010] used a number judgment task, which was matched behaviorally to a synonym judgment task and produced activity with large statistical significance.
The current dual GE method was implemented as modification of studies that have proposed a multi‐echo procedure to overcome signal loss in susceptible regions and obtain image volumes across a wider range of T2*‐weightings [Poser et al., 2006; Speck and Hennig, 1998; Yang et al., 1997]. There were a number of important factors that we considered when selecting the acquisition parameters. These choices were driven by three constraints: the limitations of the scanner; the need to minimize the TR; the desire to maintain reliable signal across the whole brain. The dual‐echo increases the TR due to the read‐out of the additional echo volume. We considered the possibility of including a third intermediate echo, but it was not possible to do so without greatly compromising TR. This was in part due to the age of our scanner, which like many scanners of that generation, suffers from gradient coil heating. The scanner software overcomes predicted gradient heating by lengthening the TR. The echo times were selected to be complimentary with the long echo providing optimum BOLD CNR across the whole brain, whilst the short echo minimized the signal loss in susceptible regions. TR is also affected by the image resolution. Thinner slices might be beneficial in reducing signal voids, but it would also lengthen TR, reduce coverage, or reduce SNR (if the slice gap is increased to maintain coverage). We used a relatively high in‐plane resolution to minimize in‐plane susceptibility induced signal loss [Weiskopf et al., 2007]. Reducing the in‐plane resolution by using a 64 × 64 acquisition matrix would allow smaller spacing between echoes and may allow acquisition of a third echo without greatly compromising TR on newer machines. In our view, the parameters we selected reflect the upper limits of dual‐echo on basic clinical scanners. The protocol used in this study ensured that we had whole brain coverage for a relatively high resolution volume. The TR was kept as short as possible for these parameters; however, future studies on more modern machines should hope to achieve shorter TRs, thinner slices, and/or additional echoes. If using more basic clinical scanners the protocol detailed here should be easy to implement.
There are also a couple of post‐acquisition processing choices, which could usefully be modified in future studies. This study did not apply a distortion correction to the GE images, as B0 maps were not acquired. However, it might be interesting for future studies to see if an even higher data quality can be achieved by using these techniques. We also used 8 mm smoothing to ensure that any comparison between the two methods would not be biased by interpolation artifacts. We would anticipate that in the absence of this requirement a smoothing of 6 mm might be a more optimal choice.
An alternative approach to the dual GE method has been explored by collecting a spin‐echo and GE in a single shot acquisition [Schwarzbauer et al., 2010] as well as a quicker variant; single shot partial dual echo (SPADE; [Schwarzbauer and Porter, 2010]). This method aims to accomplish the same task of reducing magnetic susceptibility artifacts and retain a high CNR across the whole brain. Although the current study cannot directly compare a dual GE with the dual gradient/spin‐echo, the comparison of the short_TE with spin‐echo in the magnetic susceptible region (anterior ITF) showed a benefit for the short_TE. This could suggest that a dual GE may outperform a dual gradient/spin‐echo method, although formal testing would be needed.
It is important to dissect the dual‐echo data further to determine how each echo performed alone and how they contributed after combining them together. As we know, the long_TE suffers from signal loss within ITF and orbitofrontal regions but has good CNR in general. Whereas the short_TE detects signal within these regions before it has had time to dephase, but does so at a relatively poor CNR compared to the long_TE. Each echo shows a distinct pattern of activity, which is capitalized on when used in combination. For example, in the anterior ITF, the short_TE produced higher z‐scores than the long_TE. In contrast, the long_TE showed a trend to higher z‐scores in the frontal regions and cerebellum than the short_TE. Interestingly, the whole brain analysis did not produce a cluster in the RIFG for the short_TE. The ROI analysis only pointed to a possible trend in favour of the long_TE and further analysis showed that activity in the RIFG using short_TE showed no change (i.e., not significantly different to zero), whereas the long_TE did. This demonstrates the necessity of combining the GE data to produce superior detection sensitivity within ITF (short_TE) and frontal regions (long_TE). The dual_sum and dual_weighted methods of combining the GEs were compared to determine which method was superior. There was no significant difference between these combinations in contrast to the findings by Poser and Norris [2006], where they found larger average gains for dual_weighted than dual_sum. The echo‐time dependence of BOLD contrast at 3T is higher than at 7T, therefore dual_weighted averaging is less important at 7T [Poser and Norris, 2009].
Multiple echoes can result in extending the TR, thus reducing the temporal resolution, which could be problematic for some applications such as functional connectivity. The spin‐echo method is not optimum for event‐related fMRI designs as it has low CNR and requires relatively long TR, hence one would have to scan for a considerably longer time to achieve the same statistical power in comparison to using a dual‐echo method.
CONCLUSIONS
Most fMRI studies have failed to report ITF activity in semantic memory tasks, even though there is converging evidence from neuropsychology, rTMS, PET, and MEG studies. However, multi‐echo EPI can be used as a powerful tool for investigating brain regions that are normally affected by magnetic susceptibility artifacts. In comparison to spin‐echo the dual GE EPI provides superior sensitivity within regions that are affected by magnetic susceptibility artifacts (i.e., ITF), as well as greater sensitivity within unaffected areas (i.e., IFG). The results shown here suggest that combining GE images collected at both a short and long echo time in a dual echo sequence is the method of choice for investigating whole brain, with specific attention to inferior temporal regions.
Acknowledgements
This study was supported by an MRC Capacity Buidling studentship (G0900195‐2/1) and the Biomedial Imaging Institute (BII), University of Manchester.
REFERENCES
- Bandettini PA, Wong EC, Jesmanowicz A, Hinks RS, Hyde JS. (1994): Spin‐echo and gradient‐echo epi of human brain activation using bold contrast: A comparative study at 1.5 T. NMR Biomed 7:12–20. [DOI] [PubMed] [Google Scholar]
- Bellgowan PSF, Bandettini PA, van Gelderen P, Martin A, Bodurka J. (2006): Improved BOLD detection in the medial temporal region using parallel imaging and voxel volume reduction. NeuroImage 29:1244–1251. [DOI] [PubMed] [Google Scholar]
- Binney RJ, Embleton KV, Jefferies E, Parker GJM, Lambon‐Ralph MA. (2010): The ventral and inferolateral aspects of the anterior temporal lobe are crucial in semantic memory: Evidence from a novel direct comparison of distortion‐corrected fMRI, rTMS, and semantic dementia. Cerebral Cortex 20:2728–2738. [DOI] [PubMed] [Google Scholar]
- Boxerman JL, Hamberg LM, Rosen BR, Weisskoff RM. (1995): MR contrast due to intravascular magnetic susceptibility perturbations. Magn Reson Med, 34:555–566. [DOI] [PubMed] [Google Scholar]
- Cho ZH, Ro YM. (1992): Reduction of susceptibility artifact in gradient‐echo imaging. Magn Reson Med 23:193–200. [DOI] [PubMed] [Google Scholar]
- Constable RT, Spencer DD. (1999): Composite image formation in z‐shimmed functional MR imaging. Magn Reson Med 42:110–117. [DOI] [PubMed] [Google Scholar]
- Cordes D, Turski PA, Sorenson JA. (2000): Compensation of susceptibility‐induced signal loss in echo‐planar imaging for functional applications. Magn Reson Imaging 18:1055–1068. [DOI] [PubMed] [Google Scholar]
- Cusack R, Russell B, Cox SML, De Panfilis C, Schwarzbauer C, Ansorge R. (2005): An evaluation of the use of passive shimming to improve frontal sensitivity in fMRI. NeuroImage 24:82–91. [DOI] [PubMed] [Google Scholar]
- De Panfilis C, Schwarzbauer C. (2005): Positive or negative blips? The effect of phase encoding scheme on susceptibility‐induced signal losses in EPI. NeuroImage 25:112–121. [DOI] [PubMed] [Google Scholar]
- Deichmann R, Josephs O, Hutton C, Corfield DR, Turner R. (2002): Compensation of susceptibility‐induced BOLD sensitivity losses in echo‐planar fMRI imaging. NeuroImage 15:120–135. [DOI] [PubMed] [Google Scholar]
- Deichmann R, Gottfried JA, Hutton C, Turner R. (2003): Optimized EPI for fMRI studies of the orbitofrontal cortex. NeuroImage 19:430–441. [DOI] [PubMed] [Google Scholar]
- Devlin JT, Russell RP, Davis MH, Price CJ, Wilson J, Moss HE, Matthews PM, Tyler LK. (2000). Susceptibility‐induced loss of signal: Comparing PET and fMRI on a semantic task. NeuroImage 11:589–600. [DOI] [PubMed] [Google Scholar]
- Embleton KV, Haroon HA, Morris DM, Lambon‐Ralph MA, Parker GJM. (2010): Distortion correction for diffusion‐weighted MRI tractography and fMRI in the temporal lobes. Hum Brain Mapp 31:1570–1587. [DOI] [PMC free article] [PubMed] [Google Scholar]
- Frahm J, Merboldt K‐D, Hänicke W. (1988): Direct FLASH MR imaging of magnetic field inhomogeneities by gradient compensation. Magn Reson Med 6:474–480. [DOI] [PubMed] [Google Scholar]
- Glover GH, Law CS. (2001): Spiral‐in/out BOLD fMRI for increased SNR and reduced susceptibility artifacts. Magn Reson Med 46:515–522. [DOI] [PubMed] [Google Scholar]
- Hodges JR, Patterson K, Oxbury S, Funnell E. (1992): Semantic dementia progressive fluent aphasia with temporal lobe atropy. Brain 115:1783–1806. [DOI] [PubMed] [Google Scholar]
- Jezzard P, Matthews PM, Smith SM. (2001): Functional MRI: An introduction to methods. Oxford: Oxford University Press. [Google Scholar]
- Jones RA, Schirmer T, Lipinski B, Elbel GK, Auer DP. (1998): Signal undershoots following visual stimulation: A comparison of gradient and spin‐echo BOLD sequences. Magn Reson Med 40:112–118. [DOI] [PubMed] [Google Scholar]
- Kennan RP, Zhong JH, Gore JC. (1994): Intravascular susceptibility contrast mechanisms iin tissues. Magn Reson Med 31:9–21. [DOI] [PubMed] [Google Scholar]
- Lowe MJ, Lurito JT, Mathews VP, Phillips MD, Hutchins GD. (2000): Quantitative comparison of functional contrast from BOLD‐weighted spin‐echo and gradient‐echo echoplanar imaging at 1.5 Tesla and H215O PET in the whole brain. J Cereb Blood Flow Metab 20:1331–1340. [DOI] [PubMed] [Google Scholar]
- Marinkovic K, Dhond RP, Dale AM, Glessner M, Carr V, Halgren E. (2003): Spatiotemporal dynamics of modality‐specific and supramodal word processing. Neuron 38:487–497. [DOI] [PMC free article] [PubMed] [Google Scholar]
- Mummery CJ, Patterson K, Price CJ, Ashburner J, Frackowiak RSJ, Hodges JR. (2000): A voxel‐based morphometry study of semantic dementia: Relationship between temporal lobe atrophy and semantic memory. Ann Neurol 47:36–45. [PubMed] [Google Scholar]
- Norris DG, Zysset S, Mildner T, Wiggins CJ. (2002): An investigation of the value of spin‐echo‐based fMRI using a stroop color‐word matching task and EPI at 3 T. NeuroImage 15:719–726. [DOI] [PubMed] [Google Scholar]
- Oldfield RC. (1971): The assessment and analysis of handedness: The Edinburgh Inventory. Neuropsychologia 9:97–113. [DOI] [PubMed] [Google Scholar]
- Ordidge RJ, Gorell JM, Deniau JC, Knight RA, Helpern JA. (1994): Assessment of relative brain iron concentrations using T2‐weighted and T2*‐weighted MRI at 3 Tesla. Magn Reson Med 32:335–341. [DOI] [PubMed] [Google Scholar]
- Parkes LM, Schwarzbach JV, Bouts AA, Deckers RhR, Pullens P, Kerskens CM, Norris DG. (2005): Quantifying the spatial resolution of the gradient echo and spin echo BOLD response at 3 Tesla. Magn Reson Med 54:1465–1472. [DOI] [PubMed] [Google Scholar]
- Patterson K, Nestor PJ, Rogers TT. (2007). Where do you know what you know? The representation of semantic knowledge in the human brain. Nat Rev Neurosci 8:976–987. [DOI] [PubMed] [Google Scholar]
- Pobric G, Jefferies E, Lambon‐Ralph MA. (2007): Anterior temporal lobes mediate semantic representation: Mimicking semantic dementia by using rTMS in normal participants. Proc Natl Acad Sci 104:20137–20141. [DOI] [PMC free article] [PubMed] [Google Scholar]
- Pobric G, Jefferies E, Lambon‐Ralph MA. (2010): Amodal semantic representations depend on both anterior temporal lobes: Evidence from repetitive transcranial magnetic stimulation. Neuropsychologia 48:1336–1342. [DOI] [PubMed] [Google Scholar]
- Poser BA, Norris D. (2007): Fast spin echo sequences for BOLD functional MRI. Magn Reson Mater Phys Biol Med 20:11–17. [DOI] [PMC free article] [PubMed] [Google Scholar]
- Poser BA, Norris DG. (2009): Investigating the benefits of multi‐echo EPI for fMRI at 7Â T. NeuroImage 45:1162–1172. [DOI] [PubMed] [Google Scholar]
- Poser BA, Versluis MJ, Hoogduin JM, Norris DG. (2006): BOLD contrast sensitivity enhancement and artifact reduction with multiecho EPI: Parallel‐acquired inhomogeneity‐desensitized fMRI. Magn Reson Med 55:1227–1235. [DOI] [PubMed] [Google Scholar]
- Posse S, Wiese S, Gembris D, Mathiak K, Kessler C, Grosse‐Ruyken M‐L, Elghahwagi B, Richards T, Dager SR, Kiselev VG. (1999): Enhancement of BOLD‐contrast sensitivity by single‐shot multi‐echo functional MR imaging. Magn Reson Med 42:87–97. [DOI] [PubMed] [Google Scholar]
- Pruessmann KP, Weiger M, Scheidegger MB, Boesiger P. (1999): SENSE: Sensitivity encoding for fast MRI. Magn Reson Med 42:952–962. [PubMed] [Google Scholar]
- Robinson S, Windischberger C, Rauscher A, Moser E. (2004): Optimized 3 T EPI of the amygdalae. NeuroImage 22:203–210. [DOI] [PubMed] [Google Scholar]
- Schmidt CF, Boesiger P, Ishai A. (2005). Comparison of fMRI activation as measured with gradient‐ and spin‐echo EPI during visual perception. NeuroImage 26:852–859. [DOI] [PubMed] [Google Scholar]
- Schmithorst VJ, Dardzinski BJ, Holland SK. (2001): Simultaneous correction of ghost and geometric distortion artifacts in EPI using a multiecho reference scan. Med Imaging IEEE Trans 20:535–539. [DOI] [PMC free article] [PubMed] [Google Scholar]
- Schwarzbauer C, Porter DA. (2010): Single shot partial dual echo (SPADE) EPI—an efficient acquisition scheme for reducing susceptibility artefacts in fMRI. NeuroImage 49:2234–2237. [DOI] [PubMed] [Google Scholar]
- Schwarzbauer C, Mildner T, Heinke W, Brett M, Deichmann R. (2010): Dual echo EPI ‐ The method of choice for fMRI in the presence of magnetic field inhomogeneities? NeuroImage 49:316–326. [DOI] [PubMed] [Google Scholar]
- Speck O, Hennig J. (1998): Functional Imaging by I0‐ and T2* ‐parameter mapping using multi‐image EPI. Magn Reson Med, 40:243–248. [DOI] [PubMed] [Google Scholar]
- Stenger VA, Boada FE, Noll DC. (2000): Three‐dimensional tailored RF pulses for the reduction of susceptibility artifacts in T*2‐weighted functional MRI. Magn Reson Med 44:525–531. [DOI] [PMC free article] [PubMed] [Google Scholar]
- Stroman PW, Krause V, Frankenstein UN, Malisza KL, Tomanek B. (2001): Spin‐echo versus gradient‐echo fMRI with short echo times. Magn Reson Imaging 19:827–831. [DOI] [PubMed] [Google Scholar]
- Thompson‐Schill SL, D'Esposito M, Aguirre GK, Farah MJ. (1997): Role of left inferior prefrontal cortex in retrieval of semantic knowledge: A reevaluation. Proc Natl Acad Sci 94:14792‐14797. [DOI] [PMC free article] [PubMed] [Google Scholar]
- Thulborn KR, Chang SY, Shen GX, Voyvodic JT. (1997): High‐resolution echo‐planar fMRI of human visual cortex at 3.0 tesla. NMR Biomed 10:183–190. [DOI] [PubMed] [Google Scholar]
- Tranel D, Grabowski TJ, Lyon J, Damasio H. (2005): Naming the same entities from visual or from auditory stimulation engages similar regions of left inferotemporal cortices. J Cogn Neurosci 17:1293–1305. [DOI] [PubMed] [Google Scholar]
- Vandenberghe R, Price C, Wise R, Josephs O, Frackowiak RSJ. (1996): Functional anatomy of a common semantic system for words and pictures. Nature 383:254–256. [DOI] [PubMed] [Google Scholar]
- Visser M, Jefferies E, Lambon‐Ralph MA. (2009): Semantic processing in the anterior temporal lobes: A meta‐analysis of the functional neuroimaging literature. J Cogn Neurosci 22:1083–1094. [DOI] [PubMed] [Google Scholar]
- Visser M, Embleton KV, Jefferies E, Parker GJ, Lambon‐Ralph MA. (2010): The inferior, anterior temporal lobes and semantic memory clarified: Novel evidence from distortion‐corrected fMRI. Neuropsychologia 48:1689–1696. [DOI] [PubMed] [Google Scholar]
- Volz S, Hattingen E, Preibisch C, Gasser T, Deichmann R. (2009): Reduction of susceptibility‐induced signal losses in multi‐gradient‐echo images: Application to improved visualization of the subthalamic nucleus. NeuroImage 45:1135–1143. [DOI] [PubMed] [Google Scholar]
- Weiskopf N, Hutton C, Josephs O, Deichmann R. (2006): Optimal EPI parameters for reduction of susceptibility‐induced BOLD sensitivity losses: A whole‐brain analysis at 3T and 1.5T. NeuroImage 33:493–504. [DOI] [PubMed] [Google Scholar]
- Weiskopf N, Hutton C, Josephs O, Turner R, Deichmann R. (2007): Optimized EPI for fMRI studies of the orbitofrontal cortex: Compensation of susceptibility‐induced gradients in the readout direction. Magn Reson Mater Phys Biol Med 20:39–49. [DOI] [PMC free article] [PubMed] [Google Scholar]
- Yang QX, Dardzinski BJ, Li S, Eslinger PJ, Smith MB. (1997): Multi‐gradient echo with susceptibility inhomogeneity compensation (MGESIC): Demonstration of fMRI in the olfactory cortex at 3.0 T. Magn Reson Med 37:331–335. [DOI] [PubMed] [Google Scholar]