Abstract
Symptoms of attention deficit hyperactivity disorder (ADHD) in children often persist into adulthood and can lead to severe antisocial behavior. However, to‐date it remains unclear whether neuro‐functional abnormalities cause ADHD, which in turn can then provide a marker of persistent ADHD. Using event‐related functional magnetic resonance imaging (fMRI), we measured blood oxygenation level dependent (BOLD) signal changes in subjects during a reversal learning task in which choice of the correct stimulus led to a probabilistically determined ‘monetary’ reward or punishment. Participants were diagnosed with ADHD during their childhood (N = 32) and were paired with age, gender, and education matched healthy controls (N = 32). Reassessment of the ADHD group as adults resulted in a split between either persistent (persisters, N = 17) or remitted ADHDs (remitters, N = 15). All three groups showed significantly decreased activation in the medial prefrontal cortex (PFC) and the left striatum during punished correct responses, however only remitters and controls presented significant psycho‐physiological interaction between these fronto‐striatal reward and outcome valence networks. Comparing persisters to remitters and controls showed significantly inverted responses to punishment (P < 0.05, family‐wise error corrected) in left PFC region. Interestingly, the decreased activation shown after punishment was located in different areas of the PFC for remitters compared with controls, suggesting that remitters might have learned compensation strategies to overcome their ADHD symptoms. Thus, fMRI helps understanding the neuro‐functional basis of ADHD related behavior differences and differentiates between persistent and remittent ADHD. Hum Brain Mapp 36:4648–4663, 2015. © 2015 Wiley Periodicals, Inc.
Keywords: ADHD, fMRI, medial orbitofrontal cortex, prefrontal cortex, reversal learning, denied reward response, probabilistic error trial
Abbreviations
- ADHD
attention deficit hyperactivity disorder
- BOLD
blood oxygenation level dependent
- fMRI
functional magnetic resonance imaging
- PFC
prefrontal cortex
INTRODUCTION
Attention deficit hyperactivity disorder (ADHD) is a psychiatric disorder characterized by impaired attention, hyperactivity, and impulsivity [Kooij et al., 2010; Lange et al., 2010]. Contrary to earlier assumptions, ADHD is no longer considered a disorder exclusive to childhood: about 50%–80% of cases have been found to persist into adulthood. Epidemiological studies indicate that 3% to 4% of adults suffer from ADHD [Kessler et al., 2005]. Chronic symptoms of ADHD in adults can significantly impair activities of daily living, such as academic, social, occupational, and family functioning, which over time can exacerbate problems, especially in the absence of adequate coping skills [Weiss and Weiss, 2004].
Structural and functional imaging studies have led to the view that ADHD patients suffer from a dysfunction of fronto‐striatal pathways which might be related to imbalances in dopaminergic and noradrenergic systems [Frodl, 2010]. In particular, frontal regional deficits across tasks and age groups are a consistent pattern of ADHD neural dysfunction [McCarthy et al., 2014]. The neuropsychological findings in ADHD patients reflect the assumed roles of these structures in cognition and attention [Manly et al., 2005].
In patients with ADHD, the prominent ventral striatal response has been found to be largest during the receipt of reward [Plichta and Scheres, 2014]. Abnormal reward processing in adults with ADHD compared with controls were reported to occur in the right orbitofrontal cortex (OFC) [Stroehle et al., 2008], consistent with the dual pathway theory of both motivational and executive dysfunction in ADHD [Sonuga‐Barke, 2002]. Stroehle et al. attributed group differences between ADHD patients and controls to ADHD patients presenting with larger reward activation versus punishment activation compared with controls showing no contrast in the OFC. In contrast, in another study, group differences between adult ADHD and control groups were reported also in the right medial OFC when comparing high and low incentive rewards directly. However, here controls showed larger differences between high incentive (reward) relative to low incentive (punishment) outcome compared with ADHD patients [Wilbertz et al., 2012].
More recently, Hauser et al. reported a group contrast between adolescent ADHDs and controls bilaterally in the medial prefrontal cortex (PFC), which is more dorsally located in the frontal cortex compared with the medial OFC. Controls showed a larger effect compared with ADHD patients. During anticipation, ADHD effect size was larger in the right mPFC compared with controls [Hauser et al., 2014].
The aim of this study was to investigate the differences in functional cerebral activation via a model free analysis approach of the event‐related time course data and effective connectivity during punished compared to rewarded correct responses in ADHD patients. The reversal learning task [Chantiluke et al., 2014; Cools et al., 2002] enables assessing whether participants process punishment as unexpected or whether they indeed fail to associate the punishment with denied reward potentially leading to different decisions thereafter. Our hypothesis is that subjects with ADHD have difficulties assessing the outcome and thus show reduced activation in mPFC after punishment, while remitters and controls present with strong connectivity between the frontal and striatal areas after punishment.
METHODS
Participants
Thirty‐two adults with combined‐type ADHD who underwent careful clinical assessment as children when taking part in genetic and neuropsychological studies [Brookes and Faraone, 2006; Johnson et al., 2008] were compared with 32 healthy controls matched for age, sex, handedness, and educational level. The IQ during childhood did not significantly differ between groups. Handedness was determined using the Edinburgh Inventory [Oldfield, 1971]. Educational and occupational attainments were based on the Hollingshead four factor index of social status [Hollingshead, 1975]. Full‐scale IQ was measured using the Wechsler Adult Intelligence Scale [Wechsler, 1940], Fourth Edition (WAIS‐IV, Pearson Education Inc., San Antonio, TX, USA); the subscales of Verbal Comprehension, Perceptual Reasoning, Working Memory, and Processing Speed were used to compute full‐scale composite IQ scores. Three patients with persisting ADHD and three previous patients in remission had never received any treatment for ADHD. All others were treated with methylphenidate during childhood and the majority of them stopped methylphenidate before youth. However, seven participants with persistent ADHD were being treated with methylphenidate hydrochloride (MPH) at the time of study participation and thus were required to undergo a washout period of 48 hours prior to study involvement, to exclude acute drug effects.
Exclusion criteria consisted of previous head injury with loss of consciousness, comorbid psychiatric disorder or disease, a history of hydrocortisone use, and current alcohol or substance abuse and/or dependency. All participants were interviewed and underwent diagnosis and screening for any potential comorbidity according to exclusion criteria using the structured clinical interview for DSM‐V (SCID‐Interview) (American Psychiatric Association, 2013) by either a Master's level PhD student with a degree in psychology or a psychiatrist trained in the application and interpretation of the SCID interview. A summary of the group characteristics and behavioral performance is listed in Table 1.
Table 1.
Demographic and clinical characteristics as well as behavioral data for ADHD persisters, ADHD remitters, and healthy controls. Shown are also the statistics after correction for multiple comparison using family wise error (FWE)
| Persisters | Remitters | Controls | P‐value | |||
|---|---|---|---|---|---|---|
| Persisters vs. remitters | Persisters vs. control | Remitters vs. controls | ||||
| Number of participants | 17 | 15 | 32 | |||
| Gender (male/female) | 15/2 | 12/3 | 27/5 | |||
| Handedness (right/left) | 14/3 | 13/2 | 28/4 | |||
| Age | 22 ± 4 | 21 ± 3 | 21 ± 4 | 0.30 | 0.37 | 0.80 |
| Child_IQ | 102 ± 8 | 104 ± 17 | 110 ± 7 | 0.74 | 0.27 | 0.66 |
| Adult‐WAIS‐IV – Full scale IQ | 103 ± 8 | 105 ± 16 | 114 ± 12 | 0.67 | 0.0024* | 0.051 |
| Adult‐WAIS‐IV ‐ working memory index | 98 ± 10 | 99 ± 16 | 111 ± 15 | 0.71 | 0.0032* | 0.026 |
| Adult‐WAIS‐IV ‐ verbal comprehension index | 104 ± 11 | 110 ± 16 | 112 ± 12 | 0.21 | 0.03 | 0.73 |
| Adult‐WAIS‐IV ‐ perceptual reasoning index | 105 ± 13 | 106 ± 18 | 112 ± 15 | 0.93 | 0.13 | 0.22 |
| Adult‐WAIS‐IV ‐ processing speed index | 101 ± 16 | 93 ± 13 | 106 ± 11 | 0.14 | 0.24 | 0.0017* |
| Child‐Wender Utah rating scale (WURS) sum of ADHD items | 64 ± 20 | 59 ± 13 | 13 ± 19 | 0.60 | 1.4 × 10⁻¹²* | 4.8 × 10⁻¹⁴* |
| Connor's adult ADHD rating scale (CAARS) | 67 ± 7 | 47 ± 6 | 43 ± 7 | 1.0.× 10−8* | 4.2 × 10⁻¹⁴* | 0.12 |
| Number of rewarded correct responses | 39 ± 9 | 43 ± 6 | 44 ± 9 | 0.15 | 0.038 | 0.53 |
| Number of punished correct responses | 15 ± 5 | 16 ± 4 | 17 ± 4 | 0.51 | 0.19 | 0.58 |
| Number of contingency reversals | 4 ± 2 | 4 ± 2 | 5 ± 2 | 0.59 | 0.018 | 0.093 |
*Indicated P‐values below significance threshold of 0.05, FWE corrected.
Reversal Learning Task
On each trial, subjects were presented with the same two abstract fractal images, randomly assigned to the left or right side of a central fixation cross. These stimuli were presented for 2.9s, during which time the subject was asked to choose between the two images and press the left or right button on a button box held in their right hand (Current Designs, Philadelphia, PA). The chosen image became brighter, followed by feedback for 2.9s, indicating whether the subject had won or lost a 20 cent Euro. Rewarding feedback was indicated with a picture of a 20 cent Euro coin in the center of the screen, while punishing feedback was indicated by a picture of 20 cent Euro coin with a red X across the image. A running total of subjects' earnings during this task were presented above the 20 cent Euro coin. Missed trials were indicated with a red X in the center of the screen and no change in the running total. The next trial immediately followed [O'Doherty, 2007].
The images were randomly assigned to be the correct or incorrect choice. Choosing the correct option was associated with the subsequent delivery of a monetary reward (gaining 20 cent Euro) on 70% of trials and a monetary punishment (losing 20 cent Euro) on 30% of trials. The incorrect choice was associated with 60% probability of punishment and 40% probability of reward. After subjects chose the correct stimulus on four consecutive occasions, the contingencies reversed with a probability of 25% on each successive trial. Subjects had to infer that the reversal took place and switch their choice, at which point the process was repeated.
Subjects practiced this task for 30 minutes outside the scanner during a pretraining session. Subjects were instructed to sample both choices to ascertain which was more rewarding (they were not told the exact probabilities but merely that one‐image delivered rewards more often). In the scanner, subjects performed a session that included 163 task trials with 56 null events (during which the fixation cross was presented for the duration of a normal trial) randomly interspersed for a duration of 20 mins 6 secs.
Image Acquisition
Magnetic resonance images from each participant were obtained with a Philips Achieva MRI scanner (Philips Medical System, Netherland BV, Veenphuis 4–6, 5684 PC Best, the Netherlands) operating at 3T. The functional images were collected in single runs using a gradient echo EPI (TE = 28 ms; TR = 2000 ms; field of view = 131 mm × 131 mm, flip angle = 90°) sensitive to blood oxygenation level‐dependent (BOLD) contrast (T2*‐weighting). A total of 37 contiguous 3.2 mm‐thick slices were acquired parallel to the anterior posterior commissure plane with (3 x 3) mm2 in‐plane resolution, providing complete brain coverage. The fMRI run included 600 volumes acquired continuously. Structural data (for definitive atlas transformation) included a high resolution sagittal, 3D T1‐weighted Turbo Gradient Echo Sequence (TE = 3.9 ms, TR = 8.5 ms, TI = 1060 ms, flip angle = 8°), 256 × 240 acquisition matrix, (1 × 1 × 1) mm3 voxels) scan.
Preprocessing of Functional Data
Using SPM8 (http://www.fil.ion.ucl.ac.uk/spm/software/spm8 [Friston, 2006]) functional MRI (fMRI) data were preprocessed using the following steps: compensation of systematic, slice‐dependent time shifts and systematic odd‐even slice intensity differences because of interleaved acquisition were eliminated; rigid body correction for interframe head motion within and across runs. Data were excluded if motion parameters exceeded 3 mm in any direction or 3.0° of any angular motion throughout the course of the scan. To account for group differences in movement, all six rotations and translation movement parameters were extracted for each participant. Next, coregistration of the structural T1 image to the functional scans was carried out. Spatial normalization to standard (3 × 3 × 3) mm3 Montreal Neurological Institute space was then applied to the functional images and to the structural image respectively to allow for inter‐subject analysis. Data were then spatially smoothed using a 3D Gaussian filter (smoothing full width at half maximum = 8 mm).
Log‐File Analysis and Conditions
The onsets for four contrasts were computed according to the contrasts reported elsewhere [Cools et al., 2002]. The hemodynamic response function was expected to be triggered by the onset of the responses, which co‐occurred with the presentation of the feedback. The following events were modeled (1) correct responses, co‐occurring with positive feedback, as a baseline; (2) probabilistic errors, on which negative feedback was given to correct responses (trials on which subjects reversed after a probabilistic error were not included in the model); (3) final reversal errors, resulting in the subject shifting their responding; and (4) the other preceding reversal errors, following a contingency reversal but preceding the final reversal errors. The amount of rewarded and punished correct responses and the amount of contingency reversals was computed and is presented in Table 1. For fMRI data analysis the probabilistic error trials (punished correct responses) were extracted and compared to rewarded correct responses.
Voxel‐Based Trend Correction
A sixth degree polynomial was fit to the time course data in each voxel. The fit result was used to normalize the voxel signal so that the resulting time course signal across 600 time steps was zero‐mean and normalized to the mean MRI signal in that voxel presented as the % mean MRI signal.
Atlas Based Voxel by Voxel Analysis
Analysis comprised 116 ROIs extracted using the wfu_pickatlas toolbox [Maldjian et al., 2003] in MATLAB® (2014a, Mathworks, Inc., Nattick, MA) with reference to the automated anatomical labeling (aal) atlas [Tzourio‐Mazoyer et al., 2002]. Masks were saved as nifti‐files and loaded into MATLAB® to compute the condition based event related trials for each voxel in each ROI. The ROI based analysis enabled concatenation of all trials for each group using an iMac personal computer (OS X Version 10.9.5, 2.9GHz Intel Core i5 processor, 8GB 1600MHz DDR3 memory).
Event‐Related Trial‐by‐Trial Analysis
The onsets for each contrast were used to extract the corresponding average BOLD responses for five volumes before and ten volumes after onset for each trial. The corresponding movement information was also recovered for each corresponding time point. Trials were discarded, if the movement variation across the five volumes before and after onset exceeded 0.3 mm. An example of discarded and considered trial data including movement and BOLD signal data is shown in Figure 1. The BOLD signal was saved in a global variable comprising all trials for each condition and group. To enhance the signal‐to‐noise ratio (SNR), the trials for each of the three groups (i.e. persisters, remitters, controls) were subdivided in five subgroups by choosing every fifth trial starting with the first trial for the first subgroup, every fifth trial starting with the second trial for the second subgroup, etc. The mean and standard deviation was computed for each sampling point. A graphical example of this procedure is presented in Figure 2. To determine significant differences between responses the P‐value was computed using the two‐sample t‐test from each time point data between the two investigated trials (i.e. rewarded and punished correct responses). The minimum P‐value was determined for the average of three consecutive time points at 5 to 11s after stimulus onset and the time point of the minimum P‐value was used for further analysis. This time point is further referred to as the time after onset.
Figure 1.
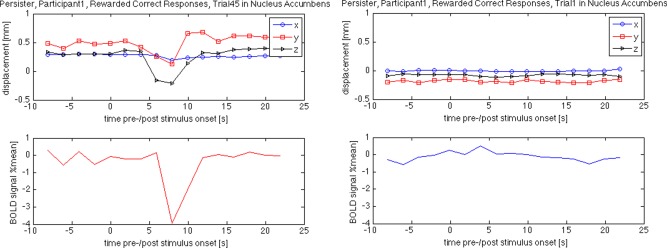
Excluded (left) and included (right) trial information as an example for the effect of large intratrial motion on the BOLD response measured via MRI. Please note the large negative response in the excluded trial measured (bottom left) in the nucleus accumbens while the generally recorded BOLD response in the same region is rather small during rewarded correct responses (bottom right). [Color figure can be viewed in the online issue, which is available at http://wileyonlinelibrary.com.]
Figure 2.
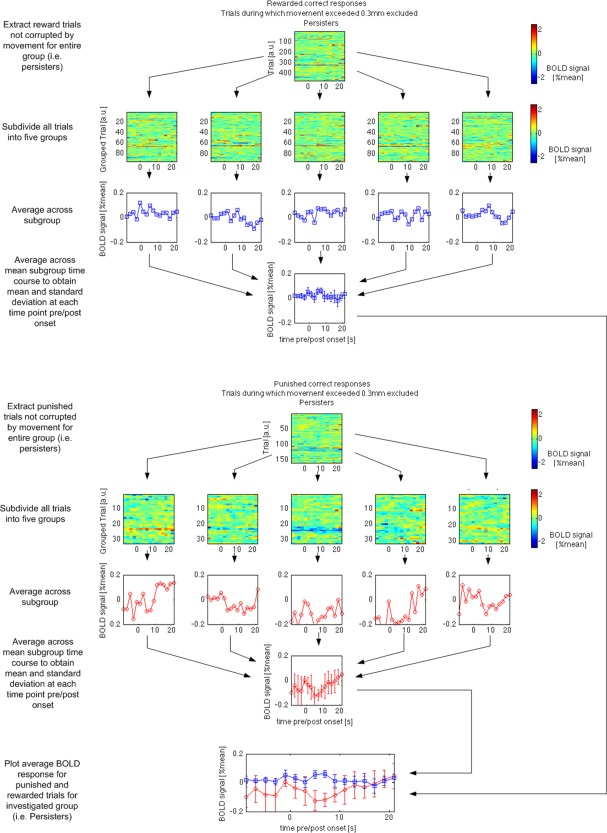
Trial‐by‐trial averaging approach taken to process the group data on the example observed in the left nucleus accumbens in persisters for rewarded and punished correct responses. Please note that the signal variations at approximately 5 to 9s after stimulus onset were significantly different for the two conditions. The difference was measured to be as small as 0.1% of the mean MRI signal measured in the same brain tissue while the variation in the single trial data is up to 2% of the mean MRI signal (trial‐by‐trial maps with color bar). [Color figure can be viewed in the online issue, which is available at http://wileyonlinelibrary.com.]
Preanalysis
The significance threshold was initially set to 0.001 to determine voxels that showed a significant difference between (1) rewarded and punished correct responses within groups, and (2) reward minus punishment responses between groups [(a) persisters vs remitters, (b) persisters vs controls, and (c) remitters vs controls] at 5 to 11s after onset. Clusters with more than 100 voxels were used for further analysis of family wise error (FWE) corrected significance levels and psycho‐physiological interaction.
Psycho–Physiological Interaction
Strong predictions about the involvement of the ventral striatum and OFC in reversal learning justified the application of a psycho physiological interaction analysis (PPI). The BOLD responses averaged across significant clusters (P < 0.001, uncor.) in striatal and frontal ROIs was analyzed for all three groups. All three groups presented with decreased activation for punished correct responses compared to reward in the fronto‐striatal ROIs. The correlation factor was computed for −1 to 13 s pre/poststimulus onset for each of the five trial subgroups and between each of the striatal and frontal cortex VOIs. The change in correlation factor from rewarded to punished correct responses between any of those combinations was then statistically assessed by computing the two‐sample t‐test of the change in correlation factor. A P‐value below 0.05 was considered as an indicator of significant psycho‐physiological interaction between the two investigated brain regions.
Statistical Analysis
For the analyzed mean BOLD signal measured, we report clusters with more than 100 voxels surviving a cluster‐level threshold of P<0.05 FWE corrected. The analysis was computed using MATLAB® (2014a, Mathworks, Inc., Nattick, MA).
RESULTS
Behavioral Analysis
The number of reversal trials as a function of contingency reversals for each group was analysed. A general tendency of decreasing number of reversals needed for increasing contingency reversals was detected for all groups. The number of reversal trials did not significantly differ between remitters, persisters, and controls.
Psycho–Physiological Interaction
The mOFC and the striatum were found to present with different BOLD responses between punishment and reward in all three groups (P < 0.001, uncorr.). The correlation coefficient between the fronto‐striatal BOLD responses was near zero for persisters (0.08 ± 0.24 [Rew] vs 0.10 ± 0.31 [Pun], P = 0.78) for both conditions. The correlation factor was positive for rewards for remitters (0.28 ± 0.29 [Rew] vs 0.56 ± 0.32 [Pun], P = 0.013) and controls (0.37 ± 0.37 [Rew] vs 0.69 ± 0.26 [Pun], P = 0.036) presenting with significantly increased correlation during punishment compared with reward. The bar graph of this result is shown in Figure 3 together with the averaged BOLD response in the investigated ROIs.
Figure 3.
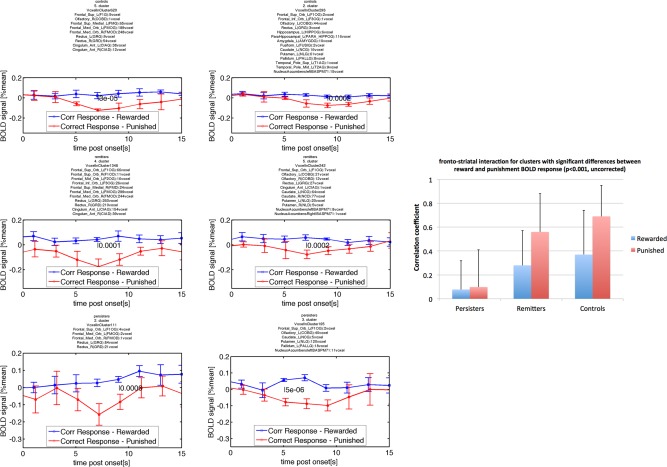
Testing fronto–striatal connection via changes in the correlation coefficient for BOLD responses measured (physiological) after reward and punishment (psychological). The P‐values indicating significant differences at P < 0.05, testing whether the correlation coefficient of the BOLD response measured in frontal and striatal regions had changed for rewarded and punished conditions were 0.78 for persisters, 0.013 for remitters, and 0.036 for controls. The time course data for persisters (third row), remitters (second row), and controls (first row) and frontal region (first column and striatal region (second column) are presented beside the bar graph. The lack of correlation of the blue and red time courses is obvious for persisters while the strong correlation of the red time courses for controls and remitters is apparent. [Color figure can be viewed in the online issue, which is available at http://wileyonlinelibrary.com.]
Within Group Analysis
Statistically significant effects (P < 0.05, FWE corrected) were observed in reward regions—the ventral and dorsal striatum—for persisters (Fig. 4a, Table 2). Significance test excluded striatal ROIs found previously with P < 0.001 for remitters (Table 3) and controls (Table 4). Remitters and controls showed decreased activation in the mOFC after punishment compared with rewarded correct responses. The mOFC region is responsible for processing denied rewards (Fig. 4b,c).
Figure 4.
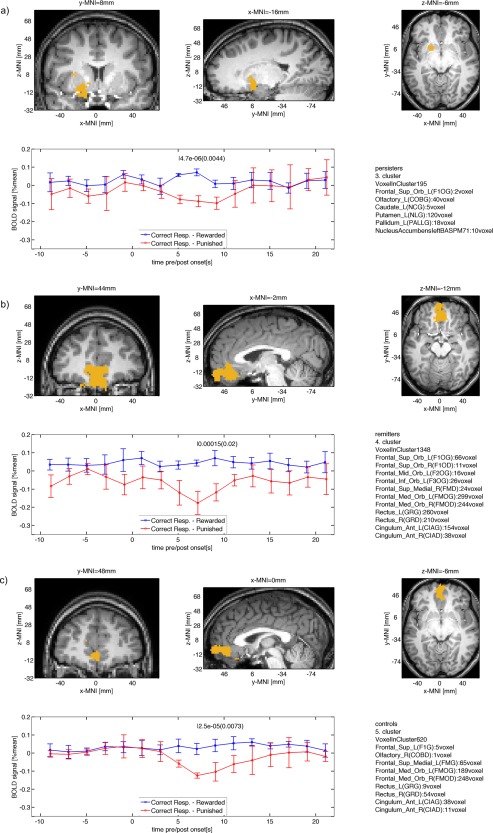
Clusters for within group differences between BOLD signals after reward and punishment (P < 0.05, cluster‐level FWE corrected) for (a) persisters, (b) remitters, and (c) controls. Note that remitters and controls show significant contrast in frontal cortex, while persisters show significant contrast in the striatum. [Color figure can be viewed in the online issue, which is available at http://wileyonlinelibrary.com.]
Table 2.
Within group results for persisters
| Main ROI (voxel/cluster size) | Rewarded mean | Rewarded STD | Punished mean | Punished STD | Time after onset | P‐value, uncorr. | P‐value, cluster level FWE corr. | MNI x | MNI y | MNI z |
|---|---|---|---|---|---|---|---|---|---|---|
| Putamen_L(NLG) (120/190) | 0.057 | 0.0087 | −0.078 | 0.023 | 5 | 4.7e‐06 | 0.0044 | −17 | 8.6 | −6.7 |
| Temporal_Inf_R(T3D) (104/104) | −0.066 | 0.023 | 0.051 | 0.014 | 11 | 2.6e‐05 | 0.046 | 55 | −46 | −21 |
Table 3.
Within group results for remitters
| Main ROI (voxel/cluster size) | Rewarded Mean | Rewarded STD | Punished mean | Punished STD | Time after onset | P‐value, uncorr. | P‐value, cluster level FWE corr. | MNI x | MNI y | MNI z |
|---|---|---|---|---|---|---|---|---|---|---|
| Frontal_Inf_Oper_R(F3OPD) (81/111) | 0.044 | 0.012 | −0.056 | 0.013 | 9 | 3.3e‐06 | 0.0055 | 60 | 16 | 6 |
| Temporal_Mid_R(T2D) (410/895) | 0.024 | 0.0076 | −0.035 | 0.012 | 11 | 3.6e‐05 | 0.0074 | 63 | −29 | −6.7 |
| Frontal_Inf_Tri_L(F3TG) (310/419) | 0.036 | 0.034 | −0.12 | 0.013 | 7 | 2e‐05 | 0.0088 | −48 | 35 | 1.3 |
| Cingulum_Mid_L(CINMG) (137/445) | 0.012 | 0.024 | −0.19 | 0.044 | 7 | 3.6e‐05 | 0.015 | 1.4 | −29 | 49 |
| Frontal_Med_Orb_L(FMOG) (299/1348) | 0.043 | 0.016 | −0.18 | 0.063 | 7 | 0.00015 | 0.02 | −1.4 | 43 | −13 |
| Temporal_Mid_L(T2G) (526/653) | 0.042 | 0.014 | −0.045 | 0.019 | 11 | 8.2e‐05 | 0.023 | −58 | −29 | −1.3 |
| Frontal_Mid_L(F2G) (102/102) | 0.049 | 0.013 | −0.078 | 0.026 | 7 | 2.3e‐05 | 0.04 | −45 | 28 | 41 |
Table 4.
Within group results for controls
| Main ROI (voxel/cluster size) | Rewarded mean | Rewarded STD | Punished mean | Punished STD | Time after onset | P‐value, uncorr. | P‐value, cluster level FWE corr. | MNI x | MNI y | MNI z |
|---|---|---|---|---|---|---|---|---|---|---|
| Precentral_L(FAG) (84/129) | −0.0096 | 0.011 | −0.082 | 0.005 | 11 | 1.7e‐06 | 0.0024 | −48 | 2.9 | 20 |
| Fusiform_R(FUSID) (352/1090) | 0.048 | 0.012 | −0.044 | 0.018 | 7 | 3.2e‐05 | 0.0054 | 28 | −29 | −20 |
| Frontal_Med_Orb_R(FMOD) (248/620) | 0.023 | 0.031 | −0.12 | 0.014 | 7 | 2.5e‐05 | 0.0073 | 0.86 | 48 | −6.9 |
| Cerebelum_Crus2_R(CERCRU2D) (248/466) | 0.026 | 0.013 | −0.058 | 0.016 | 7 | 3.4e‐05 | 0.013 | 31 | −75 | −38 |
| Occipital_Mid_L(O2G) (222/317) | −0.014 | 0.012 | −0.09 | 0.014 | 7 | 3.6e‐05 | 0.02 | −40 | −74 | 28 |
| Temporal_Mid_R(T2D) (70/118) | −0.015 | 0.0054 | −0.087 | 0.014 | 11 | 1.4e‐05 | 0.021 | 47 | −67 | −1.2 |
| ParaHippocampal_L(PARA_HIPPOG) (62/195) | 0.044 | 0.019 | −0.065 | 0.018 | 7 | 3.3e‐05 | 0.03 | −16 | −39 | −16 |
| Postcentral_R(PAD) (211/401) | 0.016 | 0.019 | −0.067 | 0.013 | 11 | 8.9e‐05 | 0.04 | 43 | −20 | 49 |
| Insula_L(ING) (70/129) | −0.012 | 0.017 | −0.091 | 0.0091 | 11 | 3.4e‐05 | 0.048 | −36 | −19 | 11 |
Group Comparison
The difference between reward and punishment (reward – punishment) was analysed for (1) persisters versus remitters, (2) persisters versus controls, and (3) remitters versus controls. The comparison between persisters and controls yielded the largest number of five clusters (Table 5). The right mOFC showed increased activation during punishment for persisters, but decreased activation for controls (Fig. 5). More predominantly, the dorsal medial and dorsal lateral PFC showed the same pattern (Fig. 6). The comparison of persisters versus controls yielded three more clusters, the right cuneus, the left precuneus, and the right fusiform with similarly characteristic signal inversions for both groups. Comparing persisters to remitters, the ventral lateral and ventral medial PFC showed increased activation after punished correct responses for persisters while remitters presented with decreased activation in this region (Fig. 7, Table 6). Remitters and controls significantly differed only in exceptionally ventral mOFC regions and inspection of the BOLD responses indicated that controls showed no activation in those ROIs after punishment while remitters showed decreased activation in those ROIs after punishment leading to a large response difference (Fig. 8, Table 7). Other significant ROIs included the right middle temporal pole with remitters presenting with negative response and controls remaining neutral.
Table 5.
Between group results for persisters (G1) versus controls (G2)
| Main ROI | G1 Dif Mean | G1 Dif Std | G2 Dif Mean | G2 Dif Std | Time after onset | P‐value, uncorr. | P‐value, cluster level FWE corr. | MNI x | MNI y | MNI z |
|---|---|---|---|---|---|---|---|---|---|---|
| Fusiform_R(FUSID) (174/293) | −0.11 | 0.017 | 0.09 | 0.02 | 11 | 4.2e‐07 | 0.00026 | 31 | −32 | −24 |
| Frontal_Sup_L(F1G) (171/336) | −0.2 | 0.038 | 0.11 | 0.034 | 11 | 1.6e‐06 | 0.00085 | −16 | 63 | 8.7 |
| Precuneus_L(PQG) (61/185) | −0.088 | 0.029 | 0.098 | 0.022 | 11 | 6.8e‐06 | 0.0067 | −0.88 | −43 | 54 |
| Frontal_Sup_Medial_R(FMD) (43/141) | −0.16 | 0.025 | 0.074 | 0.045 | 11 | 1.5e‐05 | 0.02 | 11 | 66 | −2.8 |
| Cuneus_R(QD) (95/125) | −0.046 | 0.019 | 0.051 | 0.0089 | 9 | 1.7e‐05 | 0.024 | 15 | −82 | 25 |
Figure 5.
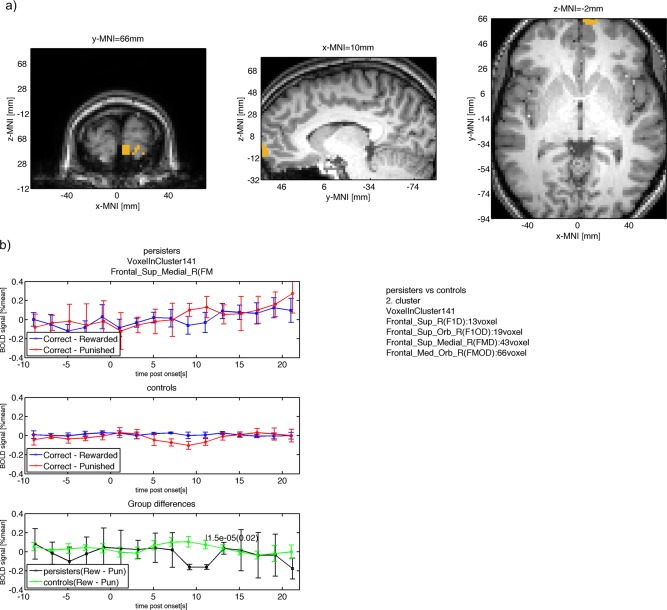
(a) Group difference between persisters and controls in right OFC (similar location as found by (Hauser et al., 2014; Stroehle et al., 2008; Wilbertz et al., 2012). (b) The mean BOLD signal measured in this cluster is shown for persisters (top row) with larger punishment response compared with reward response at 11s after onset. The mean BOLD response for controls is shown in the second row with smaller punishment response compared with reward at 11s after onset. The within group BOLD responses lead to a positive difference for controls (reward – punishment) and a negative difference for persisters with a significant (P < 0.05, cluster‐level FWE corrected) difference at 11s after onset. [Color figure can be viewed in the online issue, which is available at http://wileyonlinelibrary.com.]
Figure 6.
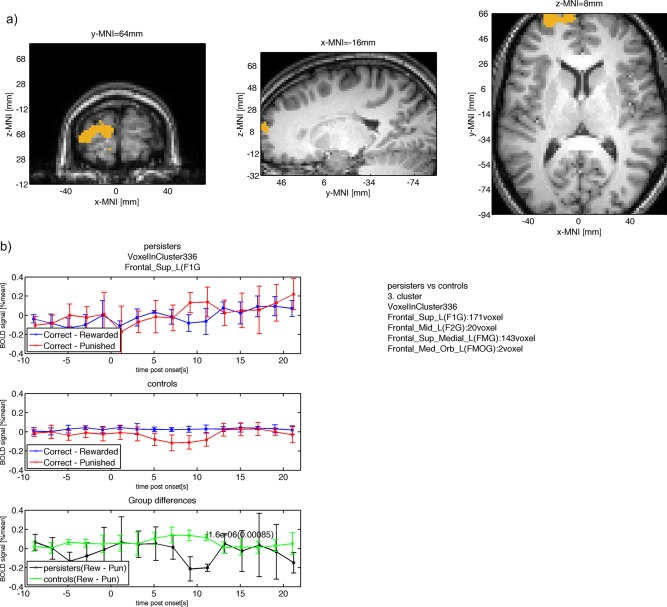
(a) Group difference between persisters and controls in dorsal medial and dorsal lateral frontal parts of the PFC. (b) The mean BOLD signal measured in this cluster is shown for persisters (top row) with larger punishment response compared with reward response at 11s after onset. The mean BOLD response for controls is shown in the second row with smaller punishment response compared with reward at 11s after onset. The within group BOLD responses lead to a positive difference for controls (reward – punishment) and a negative difference for persisters with a significant (P < 0.05, cluster‐level FWE corrected) difference at 11s after onset. [Color figure can be viewed in the online issue, which is available at http://wileyonlinelibrary.com.]
Figure 7.
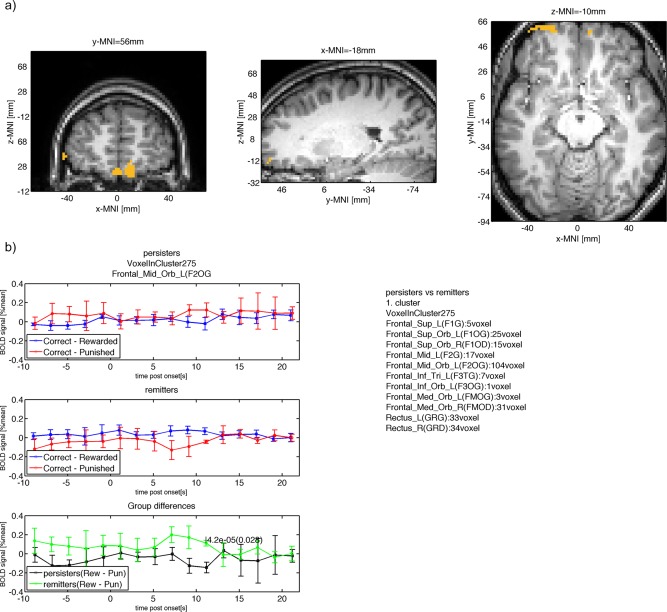
(a) Group difference between persisters and remitters in ventral medial and ventral lateral frontal parts of the PFC. (b) The mean BOLD signal measured in this cluster is shown for persisters (top row) with larger punishment response compared with reward response at 11s after onset. The mean BOLD response for remitters is shown in the second row with smaller punishment response compared to reward at 11s after onset. The within group BOLD responses lead to a positive difference for remitters (reward – punishment) and a negative difference for persisters with a significant (P < 0.05, cluster‐level FWE corrected) difference at 11s after onset. [Color figure can be viewed in the online issue, which is available at http://wileyonlinelibrary.com.]
Table 6.
Between group results for persisters (G1) versus remitters (G2)
| Main ROI | G1 Dif mean | G1 Dif STD | G2 Dif mean | G2 Dif STD | Time after onset | P‐value, uncorr. | P‐value, cluster level FWE corr. | MNI x | MNI y | MNI z |
|---|---|---|---|---|---|---|---|---|---|---|
| Frontal_Mid_Orb_L(F2OG) (104/275) | −0.14 | 0.056 | 0.11 | 0.03 | 11 | 4.2e‐05 | 0.028 | −19 | 56 | −10 |
Figure 8.
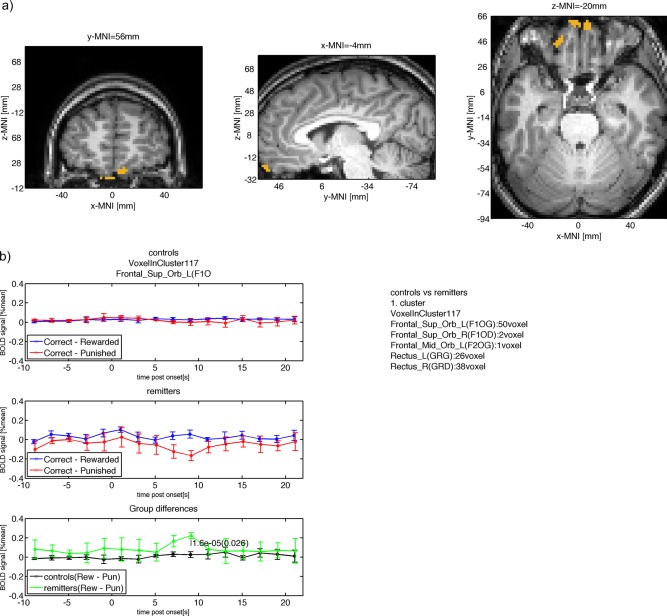
(a) Group difference between controls and remitters in the mOFC. (b) The mean BOLD signal measured in this cluster is shown for controls (top row) with neutral punishment response and reward response at 9s after onset. The mean BOLD response for remitters is shown in the second row with smaller punishment response compared to reward at 9s after onset. The within group BOLD responses lead to a positive difference for remitters (reward – punishment) and a neutral difference for controls with a significant (P < 0.05, cluster‐level FWE corrected) difference at 9s after onset. [Color figure can be viewed in the online issue, which is available at http://wileyonlinelibrary.com.]
Table 7.
Between group results for controls (G1) versus remitters (G2)
| Main ROI | G1 Dif mean | G1 DIF STD | G2 Dif mean | G2 Dif STD | Time after onset | P‐value, uncorr. | P‐value, cluster level FWE corr. | MNI x | MNI y | MNI z |
|---|---|---|---|---|---|---|---|---|---|---|
| Temporal_Mid_R(T2D) (78/107) | 0.0032 | 0.0096 | 0.12 | 0.021 | 7 | 7.1e‐06 | 0.012 | 64 | −24 | −12 |
| Frontal_Sup_Orb_L(F1OG) (50/117) | 0.025 | 0.03 | 0.22 | 0.031 | 9 | 1.6e‐05 | 0.026 | −4.4 | 55 | −20 |
DISCUSSION
To our knowledge, this study provides the first evidence that adolescents with persisting ADHD symptoms diagnosed with ADHD during childhood have functional neural alterations in the left PFC, but that these alterations are not present anymore in those who had remission of ADHD symptoms over time. Activation of mPFC during denied reward differed significantly between those in whom ADHD symptoms persisted and those in whom symptoms had improved or carefully matched healthy controls with no history of ADHD.
Interestingly, remitters and persisters performed equally well according to the reversal errors committed for each contingency. All groups showed a decreasing number of reversal errors with progressing number of contingency reversals, and thus the behavioral performance during the task can be assumed to have had no impact on above‐mentioned results. Comparing the BOLD responses for punished and rewarded responses showed unilateral left activations of the striatal region for all three groups. All three groups also presented with significant BOLD signal reduction after punished correct responses (P < 0.001, uncorr.) in mOFC and mPFC. The activation was more frontally located for remitters and controls showed more frontal dorsal activation compared with persisters.
Investigating the psycho‐physiological interaction between those ROIs in each group showed that only remitters and controls connected fronto‐striatal regions during denied reward. Also Hauser et al. reported correlation coefficient below 0.3 in ADHD, but above 0.3 for controls between mPFC and striatal regions when analyzing reward prediction errors after outcome presentation [Hauser et al., 2014]. Our result confirms their finding and refines the current knowledge clarifying that remitters are indeed capable to establish such connectivity.
Family‐wise error corrected clusters were located in striatal region for persisters, but not for remitters and controls. Finding significant clusters in striatal regions may have resulted from a hypersensitivity to rewards and hence more significantly arising differences between punished and rewarded BOLD responses (Fig. 2a, blue line presenting slight positive response during reward). This result coincided with findings of striatal hyperactivity in ADHD after reward reception [Stroehle et al., 2008]. Remitters and controls showed decreased activation of the mOFC with controls presenting decreased activation in more dorsal regions compared to remitters. Reward response was seemingly neutral for both groups. Bilateral activation of the mOFC for controls versus persisters had been reported previously [Wilbertz et al., 2012]. Remitters can indeed activate the mOFC in response to punishment, although activation occurred in ventral mOFC regions.
Group differences confirmed previous studies that found right mOFC region differences between persisters and controls [Hauser et al., 2014; Stroehle et al., 2008; Wilbertz et al., 2012]. These were reported for ADHD>controls after outcome [Stroehle et al., 2008], ADHD>controls during cue presentation of reward prediction errors [Hauser et al., 2014], but controls>ADHD during outcome [Wilbertz et al., 2012]. We can confirm that the difference between reward and punishment is larger for remitters and controls in this region while the difference between reward and punishment for persisters was inverted presenting with negative values. This finding would confirm results reported by Wilbertz et al. [Wilbertz et al., 2012]. More importantly, these differences arose at 9 to 11s after onset. A time delay between the within group cluster peaks (5 to 7s) and the between group cluster peaks is suggesting that both events are indeed separable sequentially—for instance the within group differences can hence relate to outcome assessment and the within group differences can represent decision making. Alternatively, such time delays may represent variations in neuronal firing rates in different cortical tissue structures [Rolls and Baylis, 1994].
We report significant differences between persisters and remitters in bilateral ventromedial PFC and left ventrolateral PFC (Fig. 3). The signal differences arose for similar reasons as reported in previous section. Persisters and controls differed between left dorsomedial and dorsolateral PFC with similarly inverted signal characteristics. Hauser et al. reported bilateral mPFC region providing contrast for controls > ADHD after outcome RPE and larger feedback negativity for controls as measured via EEG and source localization [Hauser et al., 2014]. Thus, we additionally demonstrated subtype differences between remitters and persisters in a similar region. Interestingly, the decreased activation during the task was located in different areas of the mPFC for controls and remitters. This might tentatively support the hypothesis that remitters learn to overcome their ADHD problems and thus might learn to activate a different part of the mPFC to compensate, since the normal area found amongst controls does not do this. Recent literature suggests that children can learn how to overcome ADHD symptoms [Guderjahn et al., 2013]. Our study provides first evidence that different brain regions present with functional activation after punishment. Please note here that we investigated learning using the reversal‐learning task. These ideas are hypothetical and thus require replication in future studies.
With regard to observing group differences, we analyzed the BOLD response after each trial for each group and found that the BOLD response after punishment was larger than for reward in persisters, while punishment resulted in lower BOLD response compared with reward in remitters and controls. Considering that persisters showed nearly no response in large parts of the mOFC, but a positive response in the very frontal parts of the mPFC leads to the assumption that persisters triggered switching after potentially having registered punishment during their last choice. Reviewing the literature revealed that mOFC BA 10 (anterior frontopolar cortex, MNI coordinates=[23;59;−9] [Bode et al., 2011]; MNI‐coordinates=[0;60;−3]) is temporally the first to carry intention‐related information [Bode et al., 2011; Soon et al., 2008] and hence is involved and showed decreased activation when a conscious decision of switching is made. A tentative explanation might be that negative response in frontopolar mOFC region represents an inhibition to switch for remitters and controls. Persisters more likely mistook the denied reward trials as punishment leading them to switch while remitters and controls stayed with their previously punished choice because they had learned that it was the correct response despite having been punished. This explanation is further supported by the fact that the clusters showing group differences occurred at 9 to 11s after onset, while the within group differences were mostly detected at 7 to 9s after onset. The delayed response may be a hint that frontopolar cortex increase in activation is a result of the thought process conducted in mPFC.
The detection of lowered BOLD response via fMRI after incorrectly punished trials —the denial of an anticipated reward—may provide an objective way for the assessment of ADHD patients in order to differentiate currently symptomatic ADHD patients from subjects recovered from ADHDs and controls.
Limitations arise from participants having been medicated in the past and having had a history of drug abuse. To overcome this influence of acute drug medication all participants refrained from taking their methylphenidate 48 hours before the scanning. With regards to number of patients who stopped methylphenidate; there were seven in the group of persisters out of 17 and zero in the group of remitters and thus we cannot rule out long‐term effects of methylphenidate. Furthermore, remitters and persisters consumed more reversal tasks during the first reversal contingency period compared to controls, which may be a hint that persisters and remitters had a lesser understanding of the task. Since remitters however showed significant activation differences compared to persisters it can be assumed that such behavioral differences had no significant impact on the functional MRI result.
To overcome some of the issues with functional MRI, we used some additional pre‐processing steps which are generally avoided because of the long computation times needed. Event‐related functional MRI is a promising method for computing subtle neuro‐functional changes during emotional or reward stimulation. However, in contrast to block‐design somatosensory paradigms where the BOLD signal change is large (up to 10% of the average MRI signal), reward related BOLD signal changes are extremely small (in the range of 0.1 to 0.2%). Assuming a static heamodynamic response function is furthermore challenging because of the significantly lower firing rates of neurons in the frontal lobe with 10‐15 spikes/s [Rolls and Baylis, 1994]) versus 60 to 120 spikes/s in the temporal lobe cortical viusual areas [Rolls and Tovee, 1995] and the sparseness of the representations found in OFC [Rolls and Tovee, 1995]. Hence, the time‐to‐peak of the heamodynamic response function (hrf) was reported later at approximately 10s after punishment compared to peak times observed after visual or somatosensory stimuli in the respective visual and somatosensory cortices [O'Doherty et al., 2001]. Using standard fit of heamodynamic response function can potentially disguise actual contrasts and may have lead to inconclusive fMRI results for adult and adolescent ADHD versus controls groups in the past.
In conclusion, we observed differences between controls and ADHD persisters and differences between remitters and persisters in their BOLD responses to punished and rewarded correct responses. While persisters showed no significant difference between the two conditions in mPFC, remitters and controls showed lower BOLD response to punished correct responses. Interestingly, the decreased activation was located in a different region of the PFC between remitters and controls.
ACKNOWLEDGMENT
The authors thank Dr. Diane Mullins and Dr. John Kelly for interviewing participants that underwent diagnosis and screening for any potential comorbidity.
REFERENCES
- American Psychiatric Association (2013): Diagnostic and Statistical Manual of Mental Disorders, 5th ed. (DSM‐5). Washington, DC: American Psychiatric Association. [Google Scholar]
- American Psychiatric Association (2013): Diagnostic and Statistical Manual of Mental Disorders 4th ed. Washington, DC: American Psychiatric Association. p. 280. doi: 10.1176/appi.books.9780890425596.744053 [DOI]
- Bode S, He AH, Soon CS, Trampel R, Turner R, Haynes JD (2011): Tracking the unconscious generation of free decisions using ultra‐high field fMRI. PLoS ONE 6: [DOI] [PMC free article] [PubMed] [Google Scholar]
- Brookes k, Faraone SV (2006): The analysis of 51 genes in DSM‐IV combined type\nattention deficit hyperactivity disorder: association\nsignals in DRD4, DAT1 and 16 other genes\n. Mol Psychiatry 11:934–953. [DOI] [PubMed] [Google Scholar]
- Chantiluke K, Barrett N, Giampietro V, Brammer M, Simmons A, Murphy DG, Rubia K (2015): Inverse effect of fluoxetine on medial prefrontal cortex activation during reward reversal in ADHD and autism. Cerebral Cortex 25:1757–1770. doi: 10.1093/cercor/bht365 [DOI] [PMC free article] [PubMed] [Google Scholar]
- Cools R, Clark L, Owen AM, Robbins TW (2002): Defining the neural mechanisms of probabilistic reversal learning using event‐related functional magnetic resonance imaging. J Neurosci 22:4563–4567). doi:20026435 [DOI] [PMC free article] [PubMed] [Google Scholar]
- Friston KJ (2006): Statistical Parametric Mapping: The Analysis of Functional Brain Images. Functional Neuroimaging: Technical. Academic Press; p. 656 Retrieved from http://store.elsevier.com/product.jsp?isbn=9780123725608&srccode=89660 [Google Scholar]
- Frodl T (2010): Comorbidity of ADHD and substance use disorder (SUD): A neuroimaging perspective. J Atten Disord, 14:109–120. doi: 10.1177/1087054710365054 [DOI] [PubMed] [Google Scholar]
- Guderjahn L, Gold A, Stadler G, Gawrilow C (2013): Self‐regulation strategies support children with ADHD to overcome symptom‐related behavior in the classroom. Atten Defic Hyperact Disord 5:397–407. [DOI] [PubMed] [Google Scholar]
- Hauser T, Iannaccone R, Ball J, Al E (2014): Role of the medial prefrontal cortex in impaired decision making in juvenile attention‐deficit/hyperactivity disorder. JAMA Psychiatry 71:1165–1173. Retrieved from http://dx.doi.org/ 10.1001/jamapsychiatry.2014.1093 [DOI] [PubMed] [Google Scholar]
- Hollingshead A (1975): Four factor index of social status. Yale J Sociol 8:21–52. Retrieved from http://elsinore.cis.yale.edu/sociology/yjs/yjs_fall_2011.pdf#page=21 [Google Scholar]
- Johnson KA, Kelly SP, Robertson IH, Barry E, Mulligan A, Daly M, Bellgrove MA (2008): Absence of the 7‐repeat variant of the DRD4 VNTR is associated with drifting sustained attention in children with ADHD but not in controls. Am J Med Genet B Neuropsychiatr Genet 147:927–937. [DOI] [PubMed] [Google Scholar]
- Kessler RC, Adler L, Ames M, Barkley RA, Birnbaum H, Greenberg P, Ustun TB (2005): The prevalence and effects of adult attention deficit/hyperactivity disorder on work performance in a nationally representative sample of workers. J Occup Environ Med 47:565–572. [DOI] [PubMed] [Google Scholar]
- Kooij S, Bejerot S, Blackwell A, Caci H, Casas‐Brugue M, Carpentier P, Asherson P (2010): European consensus statement on diagnosis and treatment of adult ADHD: The European Network Adult ADHD. BMC Psychiatry, 10:67 Retrieved from http://www.biomedcentral.com/1471-244X/10/67 [DOI] [PMC free article] [PubMed] [Google Scholar]
- Lange K, Reichl S, Lange K, Tucha L, Tucha O (2010): The history of attention deficit hyperactivity disorder. Atten Defic Hyperact Disord 2:241–255. doi: 10.1007/s12402-010-0045-8 [DOI] [PMC free article] [PubMed] [Google Scholar]
- Maldjian JA, Laurienti PJ, Kraft RA, Burdette JH (2003): An automated method for neuroanatomic and cytoarchitectonic atlas‐based interrogation of fMRI data sets. NeuroImage 19:1233–1239. [DOI] [PubMed] [Google Scholar]
- Manly T, Cornish K, Grant C, Dobler V, Hollis C (2005): Examining the relationship between rightward visuo‐spatial bias and poor attention within the normal child population using a brief screening task. J Child Psychol Psychiatry 46:1337–1344. [DOI] [PubMed] [Google Scholar]
- McCarthy H, Skokauskas N, Frodl T (2014): Identifying a consistent pattern of neural function in attention deficit hyperactivity disorder: a meta‐analysis. Psychol Med 44:869–880. [DOI] [PubMed] [Google Scholar]
- O'Doherty J, Kringelbach ML, Rolls ET, Hornak J, Andrews C (2001): Abstract reward and punishment representations in the human orbitofrontal cortex. Nat Neurosci 4:95–102. [DOI] [PubMed] [Google Scholar]
- O'Doherty JP (2007). Lights, camembert, action! The role of human orbitofrontal cortex in encoding stimuli, rewards, and choices. Ann N Y Acad Sci 1121:254–272. [DOI] [PubMed] [Google Scholar]
- Oldfield RC (1971): The assessment and analysis of handedness: The Edinburgh inventory. Neuropsychologia, 9:97–113. doi: 10.1016/0028-3932(71)90067-4 [DOI] [PubMed] [Google Scholar]
- Plichta MM, Scheres A (2014): Ventral‐striatal responsiveness during reward anticipation in ADHD and its relation to trait impulsivity in the healthy population: A meta‐analytic review of the fMRI literature. Neurosci Biobehav Rev 38:125–134. doi: 10.1016/j.neubiorev.2013.07.012 [DOI] [PMC free article] [PubMed] [Google Scholar]
- Rolls ET, Baylis LL (1994): Gustatory, olfactory, and visual convergence within the primate orbitofrontal cortex. J Neurosci 14:5437–5452. [DOI] [PMC free article] [PubMed] [Google Scholar]
- Rolls ET, Tovee MJ (1995): Sparseness of the neuronal representation of stimuli in the primate temporal visual cortex. J Neurophysiol 73:713–726. [DOI] [PubMed] [Google Scholar]
- Sonuga‐Barke, EJS (2002). Psychological heterogeneity in AD/HD—A dual pathway model of behaviour and cognition. Behav Brain Res 130:29–36. [DOI] [PubMed] [Google Scholar]
- Soon CS, Brass M, Heinze HJ, Haynes JD (2008): Unconscious determinants of free decisions in the human brain. Nat Neurosci 11:543–545. doi: 10.1038/nn.2112 [DOI] [PubMed] [Google Scholar]
- Stroehle A, Stoy M, Wrase J, Schwarzer S, Schlagenhauf F, Huss M, Heinz A (2008): Reward anticipation and outcomes in adult males with attention‐deficit/hyperactivity disorder. NeuroImage 39:966–972. [DOI] [PubMed] [Google Scholar]
- Tzourio‐Mazoyer N, Landeau B, Papathanassiou D, Crivello F, Etard O, Delcroix N, Joliot M (2002): Automated anatomical labeling of activations in SPM using a macroscopic anatomical parcellation of the MNI MRI single‐subject brain. NeuroImage 15:273–289. doi: 10.1006/nimg.2001.0978 [DOI] [PubMed] [Google Scholar]
- Wechsler D (1940): The measurement of adult intelligence. J Nerv Ment Dis p. 299. doi: 10.1097/00005053-194004000-00075 [DOI] [Google Scholar]
- Weiss MD, Weiss JR (2004): A guide to the treatment of adults with ADHD. J Clin Psychiatry 65:27–37. [PubMed] [Google Scholar]
- Wilbertz G, van Elst T, Delgado L, Maier MR, Feige S, Philipsen B, Blechert AJ (2012): Orbitofrontal reward sensitivity and impulsivity in adult attention deficit hyperactivity disorder. NeuroImage 60:353–361. [DOI] [PubMed] [Google Scholar]


