

Abstract
In Parkinson's disease (PD), iron elevation in specific brain regions as well as selective loss of dopaminergic neurons is a major pathologic feature. A reliable quantitative measure of iron deposition is a potential biomarker for PD and may contribute to the investigation of iron‐mediated PD. The primary purpose of this study is to assess iron variations in multiple deep grey matter nuclei in early PD with a novel MRI technique, quantitative susceptibility mapping (QSM). The inter‐group differences of susceptibility and R2* value in deep grey matter nuclei, namely head of caudate nucleus (CN), putamen (PUT), global pallidus (GP), substantia nigra (SN), and red nucleus (RN), and the correlations between regional iron deposition and the clinical features were explored in forty‐four early PD patients and 35 gender and age‐matched healthy controls. Susceptibility values were found to be elevated within bilateral SN and RN contralateral to the most affected limb in early PD compared with healthy controls (HCs). The finding of increased susceptibility in bilateral SN is consistent with work on a subgroup of patients at the earliest clinical detectable state (Hoehn and Yahr [1967]: Neurology 17:427–442; Stage I). However, increased R2* values were only seen within SN contralateral to the most affected limb in the PD group when compared with controls. Furthermore, bilateral SN magnetic susceptibility positively correlated with disease duration and UPDRS‐III scores in early PD. This finding supports the potential value of QSM as a non‐invasive quantitative biomarker of early PD. Hum Brain Mapp 36:4407–4420, 2015. © 2015 Wiley Periodicals, Inc.
Keywords: early Parkinson's disease, magnetic resonance imaging, quantitative susceptibility mapping, deep grey matter nuclei, iron deposition
INTRODUCTION
Parkinson's disease (PD) is a common neurodegenerative disorder characterized by an asymmetric onset of motor symptoms such as rest tremor, rigidity, bradykinesia, postural instability, and gait disorder. The major pathologic features of PD include the loss of dopaminergic neurons that project from the substantia nigra (SN) to the striatum [Braak et al., 2003; Damier et al., 1999], the presence of α‐synuclein containing Lewy bodies, and the elevation of iron deposition in PD‐related brain regions.
Controversial debate regarding whether observed iron accumulation is a cause or a consequence of neuronal cell death in PD is ongoing [Andersen, 2004; Dusek et al., 2012; Gille and Reichmann, 2011]. A pooled analysis of iron‐related genes in PD suggested that iron accumulation in PD‐related brain regions might contribute to PD etiology rather than a simple byproduct of neuronal cell death [Rhodes et al., 2014]. Iron elevation causes oxidative stress‐mediated cell death by altering the valence state between ferrous (Fe2+) and ferric (Fe3+) forms [Barnham et al., 2004]. Several previous studies have demonstrated the theoretical impact of iron on the aggregation of alpha synuclein [Bharathi and Rao, 2007; He et al., 2011; Li et al., 2010; Ostrerova‐Golts et al., 2000] and the induction of Lewy body deposition in PD [Castellani et al., 2000].
Nevertheless, the specific underlying mechanisms of iron elevation in PD remain unclear. Endogenous factors and metabolic dysregulation are primary causes of elevated iron, while environmental iron exposure is weakly associated with the development of PD [Logroscino et al., 1998; Monte et al., 2003]. Brain iron elevation in PD may result from increased cellular iron uptake or failure of iron export. For instance, ceruloplasmin is regarded as a potential contributor to iron elevation in PD [Ayton et al., 2013; Torsdottir et al., 1999]. In such case, the visualization and reliable quantitative evaluation of iron deposition may contribute to the investigation of iron‐mediated PD that can be targeted by iron chelation therapy, such as deferiprone, the first drug found to delay disease progression in a clinical trial [Devos et al., 2014].
The current diagnostic criteria for PD mainly rely on the presence of motor symptoms and a set of clinical assessments [Caslake et al., 2008; Hughes et al., 1992], which are normally detected in patients with advanced‐stage PD. The substantial effects of neuroprotective therapies including iron chelation may decrease at a relatively late stage. Therefore, early diagnosis of PD and stratification for therapy require objective, accessible and in vivo markers. MRI‐based estimation of brain iron load in vivo is particularly important for early PD patients, since direct measurement of brain histological iron stains or biochemical iron measurement is only possible post mortem. Conventional gradient‐echo (GRE) imaging approaches (magnitude, phase, R2*) have been used to characterize magnetic susceptibility changes in PD at different stages [Du et al., 2011; Kosta et al., 2006; Lewis et al., 2012; Martin et al., 2008b; Wallis et al., 2008]. A consistent observation is the elevation of iron in SN or subregions of SN [Du et al., 2011; Martin et al., 2008a], while consensus has not been established for other brain regions such as the red nucleus or the putamen [Jin et al., 2012; Kosta et al., 2006; Lewis et al., 2012]. However, there are limitations in conventional GRE approaches. Specifically, GRE magnitude maps are not quantitative, and R2* imaging can be affected by intravoxel spin dephasing in the vicinity of steep phase gradients [Fernandez‐Seara and Wehrli, 2000]. The nonlocal relation between phase and underlying magnetic susceptibility distribution prevents phase images from direct measurements of local tissue susceptibility [Schafer et al., 2009; Schweser et al., 2011].
To overcome the nonlocality of the magnetic field distribution, a novel post‐processing method, referred to as quantitative susceptibility mapping (QSM) [Li et al., 2011; Liu et al., 2009; Shmueli et al., 2009; Wu et al., 2012], has been introduced. In QSM, the pixel intensity directly reflects tissue susceptibility to enable quantitative investigation of iron concentration in certain brain regions where iron is the dominant source of magnetic susceptibility [Bilgic et al., 2012; Langkammer et al., 2012; Li et al., 2014a]. A recent postmortem study validated the high sensitivity and reliability of the QSM technique for the indication of brain iron accumulation in vivo [Langkammer et al., 2012]. Previous susceptibility studies in PD have indicated that susceptibility mapping may ultimately provide a more precise anatomic marker of PD than relaxometry based methods [Lotfipour et al., 2012], and QSM at 3 T MR imaging performs significantly better than current standard‐of‐care sequences in the depiction of the STN [Liu et al., 2013].
In the present work, QSM is performed to investigate the incidence of disturbed iron homeostasis, and the relationship between the observed modification and clinical futures in PD patients at the early stage. At the same time, a conventional MRI parameter used to examine iron changes in PD [Martin et al., 2008b; Peran et al., 2010], R2*, is calculated to explore group differences in this study. To our knowledge, this is the first QSM study to quantitatively investigate iron levels in early PD.
MATERIALS AND METHODS
Participants
Fourty‐nine right‐handed patients diagnosed with idiopathic PD according to the clinical diagnostic criteria of the UK Parkinson's Disease Society Brain Bank [Hughes et al., 1992] were investigated. The inclusion criteria were as follows: (1) a Hoehn & Yahr (H&Y) [Hoehn and Yahr, 1967] score not more than 2, without on‐off motor fluctuations; and (2) no presence of dementia according to their most recent clinical assessment, a score on the Clinical Dementia Rating Scale (CDR) [Hughes et al., 1982] equal to 0, and a total score no less than 24 for the mini‐mental state examination (MMSE) [Folstein et al., 1975]. The exclusion criteria included the following: (1) the presence of other neurological or psychiatric disorders, such as depression, evaluated using the Beck Depression Inventory‐II (BDI‐II) [Beck et al., 1996]; (2) the presence of clinically significant or unstable medical conditions, including a history of severe sleep disorders such as rapid eye movement sleep behavior disorder (RBD), a history of cerebral trauma, hyperthyroidosis, insulin‐dependent diabetes, or any other serious cardiovascular or cerebrovascular disease; and (3) alcohol or tobacco abuse or the consumption of anti‐depressants, anti‐cholinergic drugs, or hormonal contraceptives. Five patients were excluded due to poor image quality (n = 5) (see the Head Movement Evaluation section for details). Gradually, 44 patients (25 males and 19 females; 38–75 years of age; mean age 58 ± 8.76 years) with early PD were recruited in this study. A group of 35 age and gender matched right‐handed volunteers (21 males and 14 females; 46–77 years of age; mean age 60.49 ± 6.48 years) were recruited as healthy controls (HCs).
The side of motor symptoms was determined using subjective history and physical examination. Disease severity and movement symptom severity of PD were assessed using the H&Y stages and the Unified Parkinson's Disease Rating Scale‐III (UPDRS‐III) [Fahn et al., 1987] respectively by a movement disorder specialist (C.S.D). Twenty‐four (24 of 44) patients did not undergo dopaminergic replacement therapy prior to the study. For patients under dopaminergic medication, which consisted of a single drug or a combination of levodopa and dopamine agonists (piribedil or pramipexole), amantadine, monoamine oxidase B inhibitors and catechol‐O‐methyl transferase inhibitors, the imaging scans and the above tests were performed during the “ON phase” state or the optimal medication benefit of dopaminergic medication.
The present study was approved by the local ethics committee and conducted between March 2012 and August 2013. Written informed consent was submitted by each subject.
Data Acquisition
MRI scanning was performed on a 3.0 T MR system (Signa HDxt; GE Healthcare, Milwaukee, WI) equipped with an eight‐channel phased array head coil. For each participant, foam padding was applied to prevent head movement and earplugs were provided to reduce scanner noise. Conventional MR images, including T1‐weighted images and T2‐weighted fluid‐attenuated inversion recovery (FLAIR) were acquired for screening of cerebrovascular diseases and space‐occupying lesions in the basal ganglia and mesencephalon. Thereafter, a three‐dimensional multiecho GRE sequence was utilized to obtain T2*‐weighted images. Imaging parameters for the multiecho GRE sequence were as follows: repetition time (TR), 54.6 ms; number of echoes, eight; first echo time, 5.468 ms; echo time spacing, 6.408 ms; bandwidth, 41.67 Hz/pixel; flip angle, 20°; field of view, 24 cm; matrix, 416 × 384; resolution 0.47 × 0.47 × 2.0mm3; acceleration factor, 2; slices, 62; and a total acquisition time of 8 min 6 s. The whole brain was covered for all of the routine MR scans and the multiecho GRE sequence, which were achieved on the axial plane parallel to the anterior commissure‐posterior commissure line.
Head Movement Evaluation
Since PD is a movement disorder, we closely monitored and inspected the raw data, particularly in relation to head motion artifacts. As the multi‐echo GRE scan lasts more than 8 min, other standard measures to reduce patient movement during studies, such as scan repetition after patient involuntary head movement, seem infeasible to increase the rate of scans of diagnostic quality. Before the reconstruction of QSM and R2*, two neuroradiologists blindly graded the quality of magnitude raw data individually using the following grading system: 1 = very good (little or no artifact); 2 = good (visible artifacts); 3 = poor (considerable motion artifacts); 4 = very poor (significant motion artifacts), 5 = nondiagnostic scan. All disagreements were resolved by consensus reading of images. Subjects with a consensus grading score higher than 2 were excluded from further analysis. All gradient‐echo images of the remaining subjects were then registered to the corresponding magnitude image of the first echo using “realign” tool provided by SPM8 (http://www.fil.ion.ucl.ac.uk/spm/). The registration parameters were estimated based on the magnitude data. And this registration process corrected any potential misalignment among the echoes.
Image Reconstruction
Image reconstructions were performed as described in previous studies [Li et al., 2011]. Briefly, the phase image for each channel of the coil was calculated; receiver phase was estimated and subtracted for each coil. The resulting phase images from all coils were averaged. The background phase was then removed with the spherical mean value method and the filter radius was set as 8 [Schweser et al., 2011]. Finally, susceptibility maps were derived from the frequency map of brain tissue using an improved LSQR method (iLSQR) [Li et al., 2015, 2011] and the regularization threshold for Laplace filtering was set at 0.04. R2* mapping was reconstructed using the multiecho GRE data with a monoexponential fit. A Rician nonlocal means filter was used to reduce the Rician noise level of each echo prior to R2* quantification [Coupe et al., 2008]. The Levenberg‐Marquardt nonlinear algorithm was employed to fit eight echoes and R2*/T2* was estimated. Image denoising and R2* quantification were perfomed in MATLAB (The Math‐Works, Inc., Natick, MA) using home‐made scripts.
Image Analysis
Similar to previous studies [Li et al., 2014a, 2014b], susceptibility values obtained using the QSM method were directly used for comparison without reference to any selected structures, which essentially sets the susceptibility reference to the mean susceptibility of the whole brain. As mean susceptibility of the whole brain contains all contributing sources, it is less likely biased by variations in any single structure, thus providing the most stable available reference. The regions of interest (ROIs) of deep grey matter nuclei were drawn manually on the susceptibility maps using MRIcro software (http://www.mricro.com) by two neuroradiologists who were blinded to the diagnosis of each subject. The ROIs included the bilateral head of caudate nucleus (CN), globus pallidus (GP), putamen (PUT), substantia nigra (SN), and red nucleus (RN). The QSM values for each nucleus were obtained from all visible sections. The inter‐rater reliability for manual ROI segmentation was assessed (see the statistical section for further details). If “excellent agreement” was obtained between the raters, the common voxels of segmentation between two raters calculated using MRIcro software (http://www.mricro.com) were used as ROIs for subsequent analysis. The same set of ROIs was used to determine the values of R2* in each structure. In addition, the volume of the final set of ROIs was calculated by multiplying the sum of voxels within the entire structure by the size of each voxel (0.47 × 0.47 × 2 mm).
Previous studies have shown that the SN substructure nigrosome 1 (N1) is observable in SWI in healthy controls but absent in PD at 7 T [Blazejewska et al., 2013], which was later confirmed at 3 T [Schwarz et al., 2014]. These observations indicate that N1 may be a key substructure of the pathology of PD. Thus, special care is needed when drawing ROIs for SN to include the entire N1 structure. To investigate the possibility of visualizing nigrosome 1 at 3 T field in this study, two neuroradiologists blinded to the clinical conditions visually assessed the susceptibility maps and magnitude maps for absence or presence of an ovoid substructure (hypointense in QSM, hyperintense in magnitude maps) embedded within the dorsal/posterior SN, and overlaid the ROI of SN from susceptibility maps onto the magnitude image to check whether the N1 were fully included in the drawn SN structure in both susceptibility maps and magnitude maps. Consensus for subject data assessed differently by the two raters was sought in a final assessment.
Statistical Analysis
An independent two‐sample t‐test was performed to compare age, MMSE, UPDRS‐III, and BDI‐II scores between the PD and HC groups. The Chi‐square test was performed to assess the inter‐group gender heterogeneity between these groups.
To address the inter‐rater reliability of the two neuroradiologists segmenting ROIs on susceptibility maps, absolute intraclass correlation coefficients (ICC) were calculated. ICC provides a measure for agreement between the raters for segmentation of the ROIs. An ICC of 0.81 to 1.00 was considered to indicate excellent agreement; 0.61 to 0.80 for good agreement; 0.41 to 0.60 for moderate agreement; 0.21 to 0.40 for fair agreement; and 0.20 or less for poor agreement.
To observe whether bilateral differences of susceptibility exist in PD, paired‐sample t‐tests were performed. Bilateral susceptibility of the brain in the PD group was compared with pertinent mean values in controls using covariance (ANCOVA) analysis, adjusted for age, and Bonferroni correction was used for comparison between multiple groups. To investigate the correlation of QSM values in each brain region that showed group differences in duration of Parkinson's disease and UPDRS‐III score, partial correlation analysis was performed with age as a covariate. In addition, for further investigation of the influence of PD related medication on susceptibility values in ROIs, susceptibility of the subgroup of PD according to the consumption of medication was analyzed. To evaluate whether the group differences in susceptibility can be demonstrated using R2* maps, ANCOVA analysis of R2* values was conducted between patients and control groups using the same process as QSM analysis (described above). Group analyses of volume were performed using two‐sample t‐tests. Motion parameters of translation and rotation were also compared between patient and control groups, using the Mann‐Whitney U test. All statistical analyses were performed using SPSS software (ver. 18.0; SPSS, Inc., Chicago, IL) and MedCalc software (v.13.1; Ostend, Belgium). The threshold of statistical significance was regarded as p<0.05, except for the Bonferroni correction, where P < 0.005.
RESULTS
Demographic and Clinical Data Analyses
The patient and control groups displayed no differences in terms of age, gender, MMSE, or BDI‐II scores. The main demographic and clinical characteristics of the PD and HC groups are summarized in Table 1.
Table 1.
Demographic and clinical data of patients with Parkinson's disease and controls
| Sex (M/F) | Age (yrs) | Disease duration (yr) | Hoen and Yahr stage (I/II) | UPDRS‐III | MMSE | BDI‐II | Medication (yes/no) | |
|---|---|---|---|---|---|---|---|---|
| PD | 25/19 | 58.00 ± 8.76 | 2.82 ± 1.64 | 25/19 | 15.57 ± 6.22 | 28.93 ± 1.09 | 5.32 ± 2.71 | 20/24 |
| Controls | 21/14 | 60.49 ± 6.48 | / | / | / | 28.77 ± 1.24 | 5.51 ± 2.12 | / |
| P | 0.821 | 0.151 | 0.542 | 0.726 |
Values are given in means ± standard deviations.
UPDRS‐III, unified Parkinson's disease rating scale III (motor subscale); MMSE, mini‐mental state examination score; BDI‐II, Beck Depression Inventory‐II.
Head Movement Evaluation
Five PD patients were excluded for excessive head motion causing large artifacts in magnitude maps (see Supporting Information Fig. S1). There were no significant differences in potential misalignment estimated by SPM between patient and control groups (details see Supporting Information Fig. S2 and Table SI). There were no apparent eddy current induced distortions in magnitude maps of all the echoes within the included subjects (for an example case see Fig. S3 in Supporting Information).
Susceptibility Values of QSM Imaging Correlate with Brain Iron Levels
To determine the correlation between regional magnetic susceptibility and brain iron levels, Pearson's correlation analysis was applied between QSM susceptibility values in different brain regions of healthy individuals in this study and the previously published iron concentrations [Hallgren and Sourander, 1958]. The results confirmed a strong positive relationship between susceptibility values and iron concentrations previously determined by biochemical methods [Hallgren and Sourander, 1958] in each normal individual brain region under investigation (r 2 = 0.94, P = 0.0066, Fig. 1). The results indicate that QSM images are suitable for estimating regional iron levels in the human brain.
Figure 1.
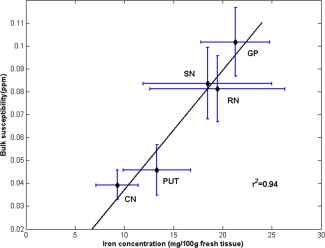
The correlation between bilateral mean susceptibility values in controls and iron content in the normal adult brain as published by Hallgren and Sourander [1958]. Error bar of the graph showed two standard errors from the mean: x‐axis, mean ± SD iron concentration (mg/10 g fresh weight) was determined postmortem in each ROI [Hallgren and Sourander, 1958]; y‐axis, mean ± SD QSM (ppm) in all 35 normal controls. CN, the head of caudate nucleus; PUT, putamen; GP, globus pallidus; SN, substantia nigra; RN, red nucleus.
Regional Magnetic Susceptibility Changes in Patients With Early Parkinson's Disease
All the ROIs appeared hyper‐intense on QSM images, which clearly reflected the shapes of the five targeted deep grey matter nuclei (Fig. 2). Identification and manual segmentation of the subcortical structures is feasible directly on the susceptibility maps.
Figure 2.
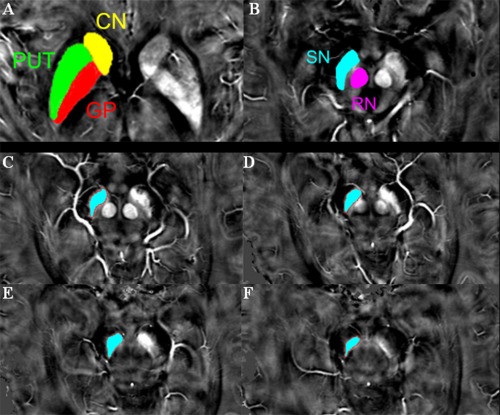
A typical susceptibility map from one single patient with early‐stage PD illustrates the regions of interest (A–B). (C–F) show the exact positions of SN. To minimize the possibility of including the subthalamic nucleus, the segmentation of the SN was started either at the level of the red nucleus showing the largest radius or one slice lower, depending on the slice in which the SN appeared most prominently, and a total of three to four slices (6–8 mm in height) were used. CN, the head of caudate nucleus; PUT, putamen; GP, globus pallidus; SN, substantia nigra; RN, red nucleus.
ICCs for absolute agreement between raters with respect to all the segmented structures were greater than 0.81, indicating excellent inter‐rater agreement (details see Supporting Information Table SII).
In early‐stage PD patients (all patients combined), the susceptibility of these observed regions in PD failed to demonstrate a statistically significant difference in paired t‐tests between bilateral sides (Table 2). However, due to the unilateral onset of PD, their measures were still grouped in terms of most affected and least affected side based on self‐report and physical examinations.
Table 2.
Paired t‐tests for susceptibility values in subcortical nuclei ipsilateral and contralateral to the most affected side of patients with early‐stage PD
| Susceptibility (ppm) | |||
|---|---|---|---|
| Ipsilateral | Contralateral | P | |
| Head of caudate | 0.038 ± 0.0095 | 0.040 ± 0.0102 | 0.129 |
| Putamen | 0.039 ± 0.0097 | 0.038 ± 0.0091 | 0.747 |
| Globus pallidus | 0.110 ± 0.0259 | 0.110 ± 0.0307 | 0.834 |
| Red necleus | 0.091 ± 0.0183 | 0.093 ± 0.0189 | 0.119 |
| Substantia nigra | 0.100 ± 0.0165 | 0.100 ± 0.0183 | 0.696 |
Data are presented as mean ±(SD).
In the PD group, susceptibility increased in the bilateral SN (P < 0.001, both) and the RN (P = 0.002) contralateral to the most affected side compared with bilateral means of control subjects (Fig. 3). Meanwhile, susceptibility values showed a tendency (P = 0.013, 0.006 respectively) to be decreased within the bilateral PUT when compared with bilateral means of control individuals. However, the intergroup difference was not observed in magnetic susceptibility values of any other brain region measured (Table 3). Given that bilateral SN and contralateral RN susceptibility was elevated in early‐stage PD (both Hoehn & Yahr Stage I and Stage II), we performed further ANCOVA analysis adjusted for age to investigate iron changes in the subgroup of patients (n = 25) at the earliest clinically detectable state (Hoehn & Yahr, Stage I). Bonferroni correction was used for multiple comparisons. It was found that this subgroup of PD patients already exhibited elevated susceptibility in both bilateral SN (P < 0.001, P = 0.001 respectively [Table 4]). Interestingly, the susceptibility value within contralateral PUT in PD patients at Hoehn & Yahr Stage I was significantly decreased compared with healthy controls (P = 0.003) (Table 4). There were no significant differences in susceptibility values between early PD patients with prior dopaminergic medication and the drug naïve PD subjects.
Figure 3.
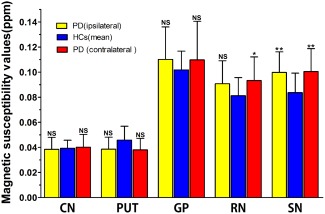
Comparison of susceptibility values between ipsilateral or contralateral subcortical nuclei in PD and pertinent mean values in bilateral sides of controls using covariance (ANCOVA) analysis, adjusted for age, and Bonferroni correction was used for comparison between multiple groups. Significant differences between PD and control subjects are represented as: * P < 0.005, ** P < 0.001. CN, the head of caudate nucleus; PUT, putamen; GP, globus pallidus; SN, substantia nigra; RN, red nucleus.
Table 3.
Regional QSM and R2* values for patients with early‐stage Parkinson's disease (all patients combined) and healthy controls
| Susceptibility (ppm) | R2* Value (sec−1) | ||||||
|---|---|---|---|---|---|---|---|
| PD | HCs | P | PD | HCs | P | ||
| Head of caudate | Ipsilateral | 0.038 ± 0.0095 | 0.039 ± 0.0065 | 1.000 | 28.2 ± 3.08 | 28.5 ± 2.76 | 1.000 |
| Contralateral | 0.040 ± 0.0102 | 0.971 | 28.4 ± 3.61 | 1.000 | |||
| Putamen | Ipsilateral | 0.039 ± 0.0097 | 0.046 ± 0.0111 | 0.013 | 33.0 ± 4.56 | 33.8 ± 4.42 | 1.000 |
| Contralateral | 0.038 ± 0.0091 | 0.006 | 33.1 ± 5.05 | 1.000 | |||
| Globus pallidus | Ipsilateral | 0.110 ± 0.0259 | 0.102 ± 0.0150 | 0.342 | 44.2 ± 4.92 | 42.6 ± 3.99 | 0.287 |
| Contralateral | 0.110 ± 0.0307 | 0.388 | 44.2 ± 5.08 | 0.294 | |||
| Red necleus | Ipsilateral | 0.091 ± 0.0183 | 0.081 ± 0.0145 | 0.018 | 34.7 ± 4.19 | 33.8 ± 4.47 | 1.000 |
| Contralateral | 0.093 ± 0.0189 | 0.002 | 35.3 ± 4.80 | 0.455 | |||
| Substantia nigra | Ipsilateral | 0.100 ± 0.0165 | 0.0837 ± 0.0156 | <0.001 | 38.1 ± 5.26 | 34.9 ± 4.41 | 0.026 |
| Contralateral | 0.100 ± 0.0183 | <0.001 | 38.9 ± 5.91 | 0.004 | |||
Data are presented as mean ±(SD).
Bold, P<0.005, significantly different from controls after the Bonferroni correction.
Table 4.
Regional QSM and R2* values for subgroup of PD patients (only those at H&Y Stage I) and healthy control group
| Susceptibility (ppm) | R2* Value (sec−1) | ||||||
|---|---|---|---|---|---|---|---|
| PD(H‐Y Stage I) | HCs | P | PD(H‐Y Stage I) | HCs | P | ||
| Head of caudate | Ipsilateral | 0.037 ± 0.0091 | 0.039 ± 0.0065 | 1.000 | 28.2 ± 2.87 | 28.5 ± 2.76 | 1.000 |
| Contralateral | 0.040 ± 0.0110 | 1.000 | 28.4 ± 3.57 | 1.000 | |||
| Putamen | Ipsilateral | 0.039 ± 0.0095 | 0.046 ± 0.0111 | 0.014 | 34.2 ± 5.09 | 33.8 ± 4.42 | 1.000 |
| Contralateral | 0.038 ± 0.0073 | 0.003 | 34.1 ± 5.85 | 1.000 | |||
| Globus pallidus | Ipsilateral | 0.115 ± 0.0301 | 0.102 ± 0.0150 | 0.240 | 45.4 ± 4.39 | 45.6 ± 3.99 | 0.45 |
| Contralateral | 0.114 ± 0.0375 | 0.267 | 45.3 ± 4.60 | 0.51 | |||
| Red necleus | Ipsilateral | 0.092 ± 0.0206 | 0.081 ± 0.0145 | 0.050 | 34.6 ± 3.42 | 33.8 ± 4.47 | 1.000 |
| Contralateral | 0.092 ± 0.0203 | 0.037 | 34.9 ± 4.35 | 0.949 | |||
| Substantia nigra | Ipsilateral | 0.100 ± 0.0145 | 0.084 ± 0.0156 | 0.000 | 38.4 ± 5.35 | 34.9 ± 4.41 | 0.036 |
| Contralateral | 0.099 ± 0.0159 | 0.001 | 38.9 ± 5.93 | 0.012 | |||
Data are presented as mean ±(SD).
Bold, P<0.005, significantly different from controls after the Bonferroni correction.
Increased R2* values were only seen within SN contralateral to the most affected limb in PD group when compared with bilateral means of control group (P = 0.004 [Fig. 4]). Any other brain region measured failed to demonstrate statistically different R2* values between patients and controls (Table 3, Fig. 4). Furthermore, when restricting the PD group to those at the earliest clinical detectable state (Hoehn & Yahr, Stage I), the R2* value difference in the contralateral SN of PD from controls was lost (P = 0.012) (Table 4).
Figure 4.

Comparison of R2* values between ipsilateral or contralateral subcortical nuclei in PD and pertinent mean values in bilateral sides of controls using covariance (ANCOVA) analysis, adjusted for age, and Bonferroni correction was used for comparison between multiple groups. Significant differences between PD and control subjects are represented as: * P<0.005. CN, the head of caudate nucleus; PUT, putamen; GP, globus pallidus; SN, substantia nigra; RN, red nucleus.
For the volume of measured ROI, there are no significant differences between PD patients and healthy controls group (see Supporting Information Table SIII for details).
Correlation Between Regional Magnetic Susceptibility and Clinical Features
Significant positive correlations were observed between QSM values of SN in the side either contralateral or ipsilateral to the most affected limb of early‐stage PD patients and illness duration (r = 0.391, P = 0.0094; r = 0.347, P = 0.0226,) or UPDRS‐III score (r = 0.386, P = 0.0105; r = 0.368, P = 0.0152) (Table 5; Fig. 5) without correction for multiple comparison.
Table 5.
Correlations of susceptibility values within bilateral RN and SN with clinical futures in early‐stage PD patients
| Clinical features | RN (ipsilateral) | RN (contralateral) | SN (ipsilateral) | SN (contralateral) |
|---|---|---|---|---|
| Disease Duration | 0.1689 | 0.0584 | 0.3915** | 0.3470* |
| UPDRS‐III | 0.2093 | 0.2914 | 0.3865* | 0.3678* |
Values are Pearson r correlations, partialed for the effects of age, without multiple comparison corrections. RN, red nucleus; SN, substantia nigra.
P<0.05; **P<0.01.
Figure 5.

Scatter plots and regression lines show the significant relationship between susceptibility values in bilateral SN and clinical measures in early‐stage PD. Correlations are partialed for age. The susceptibility value of ipsilateral SN is positively correlated with disease duration (upper‐left: r = 0.391, P = 0.0094) and UPDRS‐III score (bottom‐left: r = 0.386, P = 0.0105) in PD. The susceptibility value in SN contralateral to the most affected side in PD patients is positively correlated with disease duration (upper‐right: r = 0.347, P = 0.0226) and UPDRS‐III score (bottom‐right: r = 0.368, P = 0.0152). SN, substantia nigra.
Investigation Nigrosome 1 Observability at 3 T in the Present Study
We found N1 to be observable (bilateral/unilateral) in 10 control subjects and possibly observable (bilateral/unilateral) in three controls and two PD patients (details as displayed in Fig. 6 below and Table SIV in the Supporting Information). For all participants with observable or possibly observable N1, the drawn ROI of SN included the entire N1 both on susceptibility maps and magnitude maps.
Figure 6.
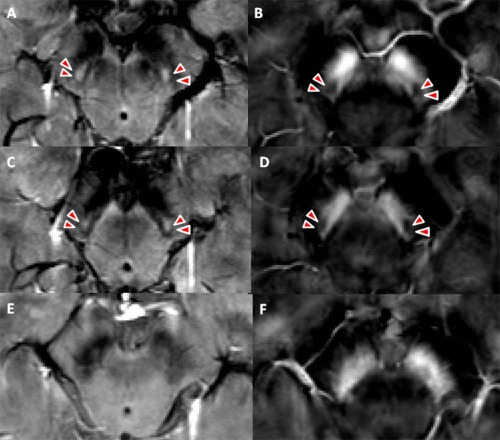
Comparison of SN anatomy in healthy controls and PD subjects on both magnitude maps and susceptibility maps. Example magnitude maps (left) and susceptibility maps (right) of a healthy control (A–D, 69 years old) and a patient with early‐stage Parkinson's disease (E and F, 65 years old). Nigrosome 1 is observable in the control subject (A–D, arrow head), which is not observable in the patient with early‐stage PD. The nigrosome 1 is hyperintense on magnitude maps and hypointense on susceptibility maps due to its low iron content.
DISCUSSION
In this study, QSM was utilized to quantify specific PD‐related regional iron deposition in deep grey nuclei structures of early PD patients. The observations indicated the presence of increased iron levels in the bilateral SN and contralateral RN, and a decreasing tendency of bilateral PUT iron deposition in early‐stage PD patients compared with healthy controls. Moreover, the observed increase of iron content in bilateral SN in early‐stage PD patients was positively associated with clinical measurements (disease duration, UPDRS‐III scores).
The susceptibility values were significantly positively correlated with iron concentrations [Hallgren and Sourander, 1958] in all the analyzed regions of normal adult brain in the current study. Consistent with this, a recent postmortem QSM study [Langkammer et al., 2012] demonstrated that ferritin‐bound iron represented the dominant source of magnetic susceptibility in deep grey matter as reported in the hallmark study by Hallgren and Sourander [1958]. The findings confirm the capability of QSM in assessing reliable and sensitive information on brain iron levels. Susceptibility maps can reflect the clear shape of the deep grey matter nuclei, consistent with previous research [Liu et al., 2013]. Furthermore, the inter‐rater agreement with respect to segmentation of all structures was all excellent in this study. Therefore, the current manual delineation approach for the ROIs is reliable.
Increased iron deposition in bilateral SN of early PD patients was observed in our study. Consistent elevated iron deposition of SN in PD has been reported by both postmortem [Dexter et al., 1991; Griffiths and Crossman, 1993; Griffiths et al., 1999] and in vivo studies [Berg, 2009; Martin et al., 2008a]. This observation is in agreement with previously published neuropathologic evidence of selective degeneration of neurons in PD. The first quantitative, in vivo susceptibility study of SN in PD [Lotfipour et al., 2012] demonstrated increased susceptibility values only in the SNc but not for the whole SN, and the effect in the SNc was lost when age was controlled for. However, only 9 PD patients were studied and limited volume of the SN was scanned in the previous study, which may be the source of this inconsistency. Normally, SN contains dopaminergic neurons, which are involved in the biosynthesis of neuroprotective neuromelanins. Neuromelanin has a high capability to chelate iron in its ferric form [Gerlach et al., 2003]. In PD patients, the SN shows a loss of dopaminergic neurons [Dexter et al., 1991] and an increase in iron levels [Riederer et al., 1989], particularly increased ferritin iron and neuromelanin iron load [Ben‐Shachar et al., 1991; Good et al., 1992; Jellinger et al., 1990]. Although the biochemical mechanisms causing this phenomenon in PD are still unclear, it is generally thought that neuromelanin breaks down in conditions of oxidative stress, releasing iron, which leads to further oxidative damage [Double et al., 2000; Fasano et al., 2006; Gerlach et al., 2006; Zecca et al., 2008].
Intriguingly, the subgroup of patients at H‐Y stage I also showed increased susceptibility values in bilateral SN, indicating a disturbance of iron deposition at the earliest clinical detectable stage. To our knowledge, this is the first MRI study that demonstrated elevated iron levels in PD patients at this stage. As a novel technique to directly quantify iron content, QSM is confirmed adequately sensitive to discriminate early PD from healthy individuals. This finding raises the possibility of the application of QSM in revealing iron deposition changes premorbidly or at the preclinical stage of PD. Further studies are required to investigate this possibility.
In this study, increased R2* values were only seen within SN contralateral to the most affected limb in PD group when compared with control group. And when comparing the subgroup of PD at the earliest clinical detectable state (H &Y Stage I) and healthy controls, the R2* value difference in the contralateral SN was lost. Previous R2* studies in PD demonstrated bilateral elevated R2* values [Du et al., 2011]. In the work by Du et al. [2011], part of the recruited PD patients were most likely at an advanced stage, as the mean UPDRS‐III motor score of the PD patients was 23.1 (±12.3). However, the mean UPDRS‐III motor score of early PD patients was 15.57 (±6.22) in the current study. The inhomogeneity of PD patients in these two studies could be the primary source of this discrepancy. In another aspect, it also indicated that R2* was less sensitive than susceptibility maps to pathologies in early‐stage PD brains. This is logical considering that R2* has lower contrast‐to‐noise ratio and is affected not only by iron but also by intravoxel spin dephasing in the vicinity of steep phase gradients [Fernandez‐Seara and Wehrli, 2000], which will degrade the sensitivity and accuracy of R2* in detecting iron induced susceptibility changes.
Increased bilateral SN susceptibility in early PD positively correlated with UPDRS‐III scores and disease durations. Consistently, previous studies have reported the positive correlation of increased SN iron reflected by phase values or R2* values in PD with motor scores [Jin et al., 2011; Lewis et al., 2013; Martin et al., 2008a]. Martin et al. [2008a] demonstrated that the iron levels in SN also correlated positively with disease duration in PD. These observations suggest the QSM values of SN as an acceptable biomarker for PD progression. However, some other studies [Jin et al., 2011; Martin et al., 2008a] failed to observe significant correlation between regional iron levels with disease duration of PD. In addition to the limitations of conventional GRE approaches mentioned above, this discrepancy may be partially due to the delineation of brain regions. In the majority of previous studies the ROIs were defined on T2‐weighted images or R2* maps. Technically speaking, this method is challenging because of unclear boundaries, especially between the subthalamic nucleus and the SN, which may introduce rater bias. To examine the possible role of susceptibility in diagnosing early‐stage PD, future investigation to address standardized SN ROI placement and substructure segmentations is warranted.
The development of ultra‐high field 7 Tesla (7 T) MRI provided the increase in spatial resolution, SNR and contrast needed to delineate SN more accurately and detect SN substructure and morphology changes [Blazejewska et al., 2013; Kwon et al., 2012]. In this study, we found that N1 could be observed (bilateral/unilateral) in 10 control subjects and possibly observed (bilateral/unilateral) in three controls and two PD patients. In contrast to previous studies [Blazejewska et al., 2013; Schwarz et al., 2014], the rate of N1 presence in controls is lower. Image acquisition in both the 7 T [Blazejewska et al., 2013] and later 3 T [Schwarz et al., 2014] studies was performed using a high resolution SWI sequence (e.g., voxel size 0.55 × 0.55 × 0.7 mm or 0.43 × 0.43 × 0.75 mm in 3 T, and 0.6 × 0.6 × 0.6 mm in 7 T) with substantially higher signal‐to‐noise ratio. The voxel size used in this study is 0.47 × 0.47 × 2 mm. The detection of N1 may therefore have been affected by the relatively high slice thickness used. Consequently, the absence N1 on this relatively low‐resolution susceptibility study does not mean N1 is completely lost. A voxel size of less than one millimeter may be more appropriate for reliable assessment of small SN substructures such as nigrosome‐1. It is interesting that N1 could possibly have been detected in two of the PD patients, as this is the first time that N1 has been investigated in patients at such an early stage of disease. More specific investigations of N1 with higher resolution multiecho GRE sequence in PD (especially at different stages of the disease) could be explored by future studies.
Susceptibility in the contralateral RN in early PD was also elevated, but failed to correlate significantly with clinical features. A recent study by Lewis et al. [2013] demonstrated higher R2* levels in both SN and RN. The RN, lies on the dorsal side of SN and is similarly iron rich [Drayer et al., 1986]. Through receiving significantly somatotopically organized input from ipsilateral motor cortex and contralateral cerebellum [Habas and Cabanis, 2007], the RN serves as an essential intersection between primary and cerebellar motor pathways [Bird and Shaw, 1978; Lapresle and Hamida, 1970]. Although the exact biochemical mechanism underlying this observed increased QSM values in RN remains unclear, it is speculated that it may reflect elevated iron deposition owing to PD‐related increased oxidative stress [Zukor et al., 2009] and neuromelanin oversaturation. The increased RN iron levels observed by QSM require independent confirmation from further imaging and histopathological studies to determine the role of RN iron deposition in PD pathophysiology.
In this study, the QSM values of the bilateral PUT in early‐stage PD patients (all patients combined) were lower than those of control subjects, although this tendency did not reach statistical significance. Interestingly, when the range of PD patients was narrowed to include only those at H&Y stage I, the effect of decreased susceptibility values in PUT contralateral to the most affected side of PD patients became statistically different from controls. A decrease of putaminal iron content was also reported in both histological and MRI studies [Dexter et al., 1991; Graham et al., 2000; Ryvlin et al., 1995]. However, other studies have demonstrated increased PUT iron deposition in PD [Chen et al., 1993; Griffiths and Crossman, 1993]. The controversy may arise as a result of variations of iron levels according to the subregions of PUT and the iron migration through unclear pathways between different brain regions during the progression of PD. The later explanation is a bold speculation which needs further investigation. Moreover, methodological differences in quantifying brain iron levels may also partially contribute to the inconsistency between PD and HC. These observations require cautious consideration, since PUT susceptibility values in PD did not show significant correlation with clinical features. Future QSM studies based on a monkey model of PD can be done using MPTP (1‐methyl‐4‐phenyl‐1,2,3,6‐tetrahydropyridine, a neurotoxin that induces PD‐like nigrostriatal pathway injury) intoxication [Hikishima et al., 2015] to observe changes in susceptibility values in subcortical nuclei. This model could then be used to compare differences in iron load modification after MPTP intoxication and early PD patients (e g., decreased susceptibility in PUT, increased susceptibility in SN and RN, respectively).
It is important to note that, besides tissue iron, susceptibility maps also reveal information about other sources of sufficient concentration and susceptibility, like tissue myelin, deoxyhaemoglobin content, venous oxygenation and calcifications. Regarding subcortical gray matter regions, iron may play a major role in determining susceptibility values [Schweser et al., 2011; Shmueli et al., 2009]. However, it has recently been shown that in addition to the tissue composition, susceptibility is also affected by tissue microstructure and compartmentalization; susceptibility in white matter has been found to be anisotropic [Lee et al., 2010; Li et al., 2012; Liu, 2010; Sukstanskii and Yablonskiy, 2014]. Further understanding of the relationship between susceptibility and microstructure of nigrostriatal structures in PD will further improve the accuracy of susceptibility as a diagnostic biomarker for PD.
LIMITATIONS
There are several limitations to the present study. First, the correlation between bilateral SN magnetic susceptibility and clinical features was relatively low without correction for multiple comparisons, which is most likely due to the selection of early‐stage PD patients and the relatively short disease duration of patients in the current study. We will enlarge the sample size of longitudinal follow‐up to verify the diagnostic value of brain regional susceptibility in the future. In this study we evaluated the SN as a whole without subdividing it into the pars compacta and pars reticulate. It remains difficult to evaluate the nigral subdivisions in patients with PD, even though previous studies with ultra‐high field 7 T [Eapen et al., 2011] have evaluated healthy controls on the basis of signal intensity and comparisons with recognized anatomic regions. As with all in vivo MRI studies of PD, our investigation is limited by the lack of pathological confirmation of the disease status. However, all clinically probable idiopathic PD patients undergo longitudinal clinical evaluation with reassessment of their diagnosis over time.
CONCLUSION
Overall, the results suggest that QSM is highly suitable for quantitative evaluation of iron deposition in early PD, and more sensitive to pathological changes in early PD than R2* maps. The disturbance of iron homeostasis reflected by QSM may be an early event in the progression of PD, and could serve as an in vivo biomarker for the early diagnosis of PD.
Supporting information
Supporting Information
ACKNOWLEDGMENTS
The authors acknowledge Prof. Shengdi Chen and Dr. Pei Huang for sharing their clinical database for evaluation for this study. The authors thank Dr. Zhenyu Zhou (GE Healthcare) for his support in the MRI analysis and carefully polishing the manuscript. The authors also thank Dr. Zheng Wang (Principal Investigator, Institute of Neuroscience Chinese Academy of Sciences) for his suggestions on revision. The authors thank all patients and healthy control subjects who participated in this study.
REFERENCES
- Andersen JK (2004): Oxidative stress in neurodegeneration: Cause or consequence? Nat Med 10(Suppl):S18–S25. [DOI] [PubMed] [Google Scholar]
- Ayton S, Lei P, Duce JA, Wong BX, Sedjahtera A, Adlard PA, Bush AI, Finkelstein DI (2013): Ceruloplasmin dysfunction and therapeutic potential for Parkinson disease. Ann Neurol 73:554–559. [DOI] [PubMed] [Google Scholar]
- Barnham KJ, Masters CL, Bush AI (2004): Neurodegenerative diseases and oxidative stress. Nat Rev Drug Discover 3:205–214. [DOI] [PubMed] [Google Scholar]
- Beck AT, Steer R, Brown G, Manual for the BDI-II (1996): San Antonio, TX: The Psychological Corporation. pp 1–38.
- Ben‐Shachar D, Riederer P, Youdim MB (1991): Iron‐melanin interaction and lipid peroxidation: implications for Parkinson's disease. J Neurochem 57:1609–1614. [DOI] [PubMed] [Google Scholar]
- Berg D (2009): Transcranial ultrasound as a risk marker for Parkinson's disease. Mov Disord 24(Suppl 2):S677–S683. [DOI] [PubMed] [Google Scholar]
- Bharathi, Rao KS (2007): Thermodynamics imprinting reveals differential binding of metals to alpha‐synuclein: relevance to Parkinson's disease. Biochem Biophys Res Commun 359:115–120. [DOI] [PubMed] [Google Scholar]
- Bilgic B, Pfefferbaum A, Rohlfing T, Sullivan EV, Adalsteinsson E (2012): MRI estimates of brain iron concentration in normal aging using quantitative susceptibility mapping. Neuroimage 59:2625–2635. [DOI] [PMC free article] [PubMed] [Google Scholar]
- Bird TD, Shaw CM (1978): Progressive myoclonus and epilepsy with dentatorubral degeneration: A clinicopathological study of the Ramsay Hunt syndrome. J Neurol Neurosurg Psychiatry 41:140–149. [DOI] [PMC free article] [PubMed] [Google Scholar]
- Blazejewska AI, Schwarz ST, Pitiot A, Stephenson MC, Lowe J, Bajaj N, Bowtell RW, Auer DP, Gowland PA (2013): Visualization of nigrosome 1 and its loss in PD: pathoanatomical correlation and in vivo 7 T MRI. Neurology 81:534–540. [DOI] [PMC free article] [PubMed] [Google Scholar]
- Braak H, Del Tredici K, Rub U, de Vos RA, Jansen Steur EN, Braak E (2003): Staging of brain pathology related to sporadic Parkinson's disease. Neurobiol Aging 24:197–211. [DOI] [PubMed] [Google Scholar]
- Caslake R, Moore JN, Gordon JC, Harris CE, Counsell C (2008): Changes in diagnosis with follow‐up in an incident cohort of patients with parkinsonism. J Neurol Neurosurg Psychiatry 79:1202–1207. [DOI] [PubMed] [Google Scholar]
- Castellani RJ, Siedlak SL, Perry G, Smith MA (2000): Sequestration of iron by Lewy bodies in Parkinson's disease. Acta Neuropathol 100:111–114. [DOI] [PubMed] [Google Scholar]
- Chen JC, Hardy PA, Kucharczyk W, Clauberg M, Joshi JG, Vourlas A, Dhar M, Henkelman RM (1993): MR of human postmortem brain tissue: correlative study between T2 and assays of iron and ferritin in Parkinson and Huntington disease. AJNR Am J Neuroradiol 14:275–281. [PMC free article] [PubMed] [Google Scholar]
- Coupe P, Yger P, Prima S, Hellier P, Kervrann C, Barillot C (2008): An optimized blockwise nonlocal means denoising filter for 3‐D magnetic resonance images. IEEE Trans Med Imaging 27:425–441. [DOI] [PMC free article] [PubMed] [Google Scholar]
- Damier P, Hirsch EC, Agid Y, Graybiel AM (1999): The substantia nigra of the human brain. II. Patterns of loss of dopamine‐containing neurons in Parkinson's disease. Brain 122: 1437–1448. [DOI] [PubMed] [Google Scholar]
- Devos D, Moreau C, Devedjian JC, Kluza J, Petrault M, Laloux C, Jonneaux A, Ryckewaert G, Garcon G, Rouaix N, Duhamel A, Jissendi P, Dujardin K, Auger F, Ravasi L, Hopes L, Grolez G, Firdaus W, Sablonnière B, Strubi-Vuillaume I, Zahr N, Destée A, Corvol JC, Pöltl D, Leist M, Rose C, Defebvre L, Marchetti P, Cabantchik ZI, Bordet R (2014): Targeting chelatable iron as a therapeutic modality in Parkinson's disease. Antioxid Redox Signal 21:195–210. [DOI] [PMC free article] [PubMed] [Google Scholar]
- Dexter DT, Carayon A, Javoy‐Agid F, Agid Y, Wells FR, Daniel SE, Lees AJ, Jenner P, Marsden CD (1991): Alterations in the levels of iron, ferritin and other trace metals in Parkinson's disease and other neurodegenerative diseases affecting the basal ganglia. Brain 114: 1953–1975. [DOI] [PubMed] [Google Scholar]
- Monte D, Tanner DA, Andersen CM, Quik J, Langston MJW (2003): Environmental and genetic determinants of PD. Neurotoxicology 24:293–294. [Google Scholar]
- Double KL, Gerlach M, Youdim MB, Riederer P (2000): Impaired iron homeostasis in Parkinson's disease. J Neural Transm 60:37–58. [DOI] [PubMed] [Google Scholar]
- Drayer B, Burger P, Darwin R, Riederer S, Herfkens R, Johnson GA (1986): MRI of brain iron. AJR Am J Roentgenol 147:103–110. [DOI] [PubMed] [Google Scholar]
- Du G, Lewis MM, Styner M, Shaffer ML, Sen S, Yang QX, Huang X (2011): Combined R2* and diffusion tensor imaging changes in the substantia nigra in Parkinson's disease. Mov Disord 26:1627–1632. [DOI] [PMC free article] [PubMed] [Google Scholar]
- Dusek P, Jankovic J, Le W (2012): Iron dysregulation in movement disorders. Neurobiol Dis 46:1–18. [DOI] [PubMed] [Google Scholar]
- Eapen M, Zald DH, Gatenby JC, Ding Z, Gore JC (2011): Using high‐resolution MR imaging at 7T to evaluate the anatomy of the midbrain dopaminergic system. AJNR Am J Neuroradiol 32:688–694. [DOI] [PMC free article] [PubMed] [Google Scholar]
- Fahn S, Elton RL, Committee UD (1987): Unified Parkinson's disease rating scale. Recent Dev Parkinson's Dis 2:153–163. [Google Scholar]
- Fasano M, Bergamasco B, Lopiano L (2006): Modifications of the iron‐neuromelanin system in Parkinson's disease. J Neurochem 96:909–916. [DOI] [PubMed] [Google Scholar]
- Fernandez‐Seara MA, Wehrli FW (2000): Postprocessing technique to correct for background gradients in image‐based R*(2) measurements. Magn Reson Med 44:358–366. [DOI] [PubMed] [Google Scholar]
- Folstein MF, Folstein SE, McHugh PR (1975): “Mini‐mental state”. A practical method for grading the cognitive state of patients for the clinician. J Psychiatr Res 12:189–198. [DOI] [PubMed] [Google Scholar]
- Gerlach M, Double KL, Ben‐Shachar D, Zecca L, Youdim MB, Riederer P (2003): Neuromelanin and its interaction with iron as a potential risk factor for dopaminergic neurodegeneration underlying Parkinson's disease. Neurotox Res 5:35–44. [DOI] [PubMed] [Google Scholar]
- Gerlach M, Double KL, Youdim MB, Riederer P (2006): Potential sources of increased iron in the substantia nigra of Parkinsonian patients. J Neural Transm 70:133–142. [DOI] [PubMed] [Google Scholar]
- Gille G, Reichmann H (2011): Iron‐dependent functions of mitochondria–Relation to neurodegeneration. J Neural Transm 118:349–359. [DOI] [PubMed] [Google Scholar]
- Good PF, Olanow CW, Perl DP (1992): Neuromelanin‐containing neurons of the substantia nigra accumulate iron and aluminum in Parkinson's disease: A LAMMA study. Brain Res 593:343–346. [DOI] [PubMed] [Google Scholar]
- Graham JM, Paley MN, Grunewald RA, Hoggard N, Griffiths PD (2000): Brain iron deposition in Parkinson's disease imaged using the PRIME magnetic resonance sequence. Brain 123:2423–2431. [DOI] [PubMed] [Google Scholar]
- Griffiths PD, Crossman AR (1993): Distribution of iron in the basal ganglia and neocortex in postmortem tissue in Parkinson's disease and Alzheimer's disease. Dementia 4:61–65. [DOI] [PubMed] [Google Scholar]
- Griffiths PD, Dobson BR, Jones GR, Clarke DT (1999): Iron in the basal ganglia in Parkinson's disease. An in vitro study using extended X‐ray absorption fine structure and cryo‐electron microscopy. Brain 122: 667–673. [DOI] [PubMed] [Google Scholar]
- Habas C, Cabanis EA (2007): Cortical projection to the human red nucleus: Complementary results with probabilistic tractography at 3 T. Neuroradiology 49:777–784. [DOI] [PubMed] [Google Scholar]
- Hallgren B, Sourander P (1958): The effect of age on the non‐haemin iron in the human brain. J Neurochem 3:41–51. [DOI] [PubMed] [Google Scholar]
- He Q, Song N, Xu H, Wang R, Xie J, Jiang H (2011): Alpha‐synuclein aggregation is involved in the toxicity induced by ferric iron to SK‐N‐SH neuroblastoma cells. J Neural Transm 118:397–406. [DOI] [PubMed] [Google Scholar]
- Hikishima K, Ando K, Komaki Y, Kawai K, Yano R, Inoue T, Itoh T, Yamada M, Momoshima S, Okano HJ, Okano H (2015): Voxel‐based morphometry of the marmoset brain: in vivo detection of volume loss in the substantia nigra of the MPTP‐treated Parkinson's disease model. Neuroscience 300:585–592. [DOI] [PubMed] [Google Scholar]
- Hoehn MM, Yahr MD (1967): Parkinsonism: onset, progression and mortality. Neurology 17:427–442. [DOI] [PubMed] [Google Scholar]
- Hughes AJ, Daniel SE, Kilford L, Lees AJ (1992): Accuracy of clinical diagnosis of idiopathic Parkinson's disease: A clinico‐pathological study of 100 cases. J Neurol Neurosurg Psychiatry 55:181–184. [DOI] [PMC free article] [PubMed] [Google Scholar]
- Hughes CP, Berg L, Danziger WL, Coben LA, Martin RL (1982): A new clinical scale for the staging of dementia. Br J Psychiatry 140:566–572. [DOI] [PubMed] [Google Scholar]
- Jellinger K, Paulus W, Grundke‐Iqbal I, Riederer P, Youdim MB (1990): Brain iron and ferritin in Parkinson's and Alzheimer's diseases. J Neural Transm Park Dis Dement Sect 2:327–340. [DOI] [PubMed] [Google Scholar]
- Jin L, Wang J, Jin H, Fei G, Zhang Y, Chen W, Zhao L, Zhao N, Sun X, Zeng M, Zhong C (2012): Nigral iron deposition occurs across motor phenotypes of Parkinson's disease. Eur J Neurol 19:969–976. [DOI] [PubMed] [Google Scholar]
- Jin L, Wang J, Zhao L, Jin H, Fei G, Zhang Y, Zeng M, Zhong C (2011): Decreased serum ceruloplasmin levels characteristically aggravate nigral iron deposition in Parkinson's disease. Brain 134:50–58. [DOI] [PubMed] [Google Scholar]
- Kosta P, Argyropoulou MI, Markoula S, Konitsiotis S (2006): MRI evaluation of the basal ganglia size and iron content in patients with Parkinson's disease. J Neurol 253:26–32. [DOI] [PubMed] [Google Scholar]
- Kwon DH, Kim JM, Oh SH, Jeong HJ, Park SY, Oh ES, Chi JG, Kim YB, Jeon BS, Cho ZH (2012): Seven‐Tesla magnetic resonance images of the substantia nigra in Parkinson disease. Ann Neurol 71:267–277. [DOI] [PubMed] [Google Scholar]
- Langkammer C, Schweser F, Krebs N, Deistung A, Goessler W, Scheurer E, Sommer K, Reishofer G, Yen K, Fazekas F, Ropele S, Reichenbach JR (2012): Quantitative susceptibility mapping (QSM) as a means to measure brain iron? A post mortem validation study. Neuroimage 62:1593–1599. [DOI] [PMC free article] [PubMed] [Google Scholar]
- Lapresle J, Hamida MB (1970): The dentato‐olivary pathway. Somatotopic relationship between the dentate nucleus and the contralateral inferior olive. Arch Neurol 22:135–143. [DOI] [PubMed] [Google Scholar]
- Lee J, Shmueli K, Fukunaga M, van Gelderen P, Merkle H, Silva AC, Duyn JH (2010): Sensitivity of MRI resonance frequency to the orientation of brain tissue microstructure. Proc Natl Acad Sci USA 107:5130–5135. [DOI] [PMC free article] [PubMed] [Google Scholar]
- Lewis MM, Du G, Kidachi M, Patel N, Shaffer ML, Mailman RB, Huang X (2012): Higher iron in the red nucleus marks Parkinson's dyskinesia. Ann Neurol 72:S97–S98. [DOI] [PMC free article] [PubMed] [Google Scholar]
- Lewis MM, Du G, Kidacki M, Patel N, Shaffer ML, Mailman RB, Huang X (2013): Higher iron in the red nucleus marks Parkinson's dyskinesia. Neurobiol Aging 34:1497–1503. [DOI] [PMC free article] [PubMed] [Google Scholar]
- Li W, Langkammer C, Chou YH, Petrovic K, Schmidt R, Song AW, Madden DJ, Ropele S, Liu C. (2014a): Association between increased magnetic susceptibility of deep gray matter nuclei and decreased motor function in healthy adults. Neuroimage 105:45–52. [DOI] [PMC free article] [PubMed] [Google Scholar]
- Li W, Wang N, Yu F, Han H, Cao W, Romero R, Tantiwongkosi B, Duong TQ, Liu C. (2015): A method for estimating and removing streaking artifacts in quantitative susceptibility mapping. Neuroimage 108:111–122. [DOI] [PMC free article] [PubMed] [Google Scholar]
- Li W, Wu B, Avram AV, Liu C (2012): Magnetic susceptibility anisotropy of human brain in vivo and its molecular underpinnings. Neuroimage 59:2088–2097. [DOI] [PMC free article] [PubMed] [Google Scholar]
- Li W, Wu B, Batrachenko A, Bancroft‐Wu V, Morey RA, Shashi V, Langkammer C, De Bellis MD, Ropele S, Song AW, Liu C (2014b): Differential developmental trajectories of magnetic susceptibility in human brain gray and white matter over the lifespan. Hum Brain Mapp 35:2698–2713. [DOI] [PMC free article] [PubMed] [Google Scholar]
- Li W, Wu B, Liu C (2011): Quantitative susceptibility mapping of human brain reflects spatial variation in tissue composition. Neuroimage 55:1645–1656. [DOI] [PMC free article] [PubMed] [Google Scholar]
- Li WJ, Jiang H, Song N, Xie JX (2010): Dose‐ and time‐dependent alpha‐synuclein aggregation induced by ferric iron in SK‐N‐SH cells. Neurosci Bull 26:205–210. [DOI] [PMC free article] [PubMed] [Google Scholar]
- Liu C (2010): Susceptibility tensor imaging. Magn Reson Med 63:1471–1477. [DOI] [PMC free article] [PubMed] [Google Scholar]
- Liu T, Eskreis‐Winkler S, Schweitzer AD, Chen W, Kaplitt MG, Tsiouris AJ, Wang Y (2013): Improved subthalamic nucleus depiction with quantitative susceptibility mapping. Radiology 269:216–223. [DOI] [PMC free article] [PubMed] [Google Scholar]
- Liu T, Spincemaille P, de Rochefort L, Kressler B, Wang Y (2009): Calculation of susceptibility through multiple orientation sampling (COSMOS): a method for conditioning the inverse problem from measured magnetic field map to susceptibility source image in MRI. Magn Reson Med 61:196–204. [DOI] [PubMed] [Google Scholar]
- Logroscino G, Marder K, Graziano J, Freyer G, Slavkovich V, Lojacono N, Cote L, Mayeux R. (1998): Dietary iron, animal fats, and risk of Parkinson's disease. Mov Disord 13(Suppl 1):13–16. [PubMed] [Google Scholar]
- Lotfipour AK, Wharton S, Schwarz ST, Gontu V, Schafer A, Peters AM, Bowtell RW, Auer DP, Gowland PA, Bajaj NP (2012): High resolution magnetic susceptibility mapping of the substantia nigra in Parkinson's disease. J Magn Reson Imaging 35:48–55. [DOI] [PubMed] [Google Scholar]
- Martin WR, Wieler M, Gee M (2008a): Midbrain iron content in early Parkinson disease: A potential biomarker of disease status. Neurology 70:1411–1417. [DOI] [PubMed] [Google Scholar]
- Martin WRW, Wieler M, Gee M (2008b): Midbrain iron content in early Parkinson disease ‐ A potential biomarker of disease status. Neurology 70:1411–1417. [DOI] [PubMed] [Google Scholar]
- Ostrerova‐Golts N, Petrucelli L, Hardy J, Lee JM, Farer M, Wolozin B (2000): The A53T alpha‐synuclein mutation increases iron‐dependent aggregation and toxicity. J Neurosci 20:6048–6054. [DOI] [PMC free article] [PubMed] [Google Scholar]
- Peran P, Cherubini A, Assogna F, Piras F, Quattrocchi C, Peppe A, Celsis P, Rascol O, Demonet J‐F, Stefani A, Pierantozzi M, Pontieri FE, Caltagirone C, Spalletta G, Sabatini U (2010): Magnetic resonance imaging markers of Parkinson's disease nigrostriatal signature. Brain 133:3423–3433. [DOI] [PubMed] [Google Scholar]
- Rhodes SL, Buchanan DD, Ahmed I, Taylor KD, Loriot M‐A, Sinsheimer JS, Bronstein JM, Elbaz A, Mellick GD, Rotter JI, Ritz B (2014): Pooled analysis of iron‐related genes in Parkinson's disease: Association with transferrin. Neurobiol Dis 62:172–178. [DOI] [PMC free article] [PubMed] [Google Scholar]
- Riederer P, Sofic E, Rausch WD, Schmidt B, Reynolds GP, Jellinger K, Youdim MB (1989): Transition metals, ferritin, glutathione, and ascorbic acid in parkinsonian brains. J Neurochem 52:515–520. [DOI] [PubMed] [Google Scholar]
- Ryvlin P, Broussolle E, Piollet H, Viallet F, Khalfallah Y, Chazot G (1995): Magnetic resonance imaging evidence of decreased putamenal iron content in idiopathic Parkinson's disease. Arch Neurol 52:583–588. [DOI] [PubMed] [Google Scholar]
- Schafer A, Wharton S, Gowland P, Bowtell R (2009): Using magnetic field simulation to study susceptibility‐related phase contrast in gradient echo MRI. Neuroimage 48:126–137. [DOI] [PubMed] [Google Scholar]
- Schwarz ST, Afzal M, Morgan PS, Bajaj N, Gowland PA, Auer DP (2014): The 'swallow tail' appearance of the healthy nigrosome ‐ A new accurate test of Parkinson's disease: A case‐control and retrospective cross‐sectional MRI study at 3T. PLos One 9:e93814. [DOI] [PMC free article] [PubMed] [Google Scholar]
- Schweser F, Deistung A, Lehr BW, Reichenbach JR (2011): Quantitative imaging of intrinsic magnetic tissue properties using MRI signal phase: An approach to in vivo brain iron metabolism? Neuroimage 54:2789–2807. [DOI] [PubMed] [Google Scholar]
- Shmueli K, de Zwart JA, van Gelderen P, Li TQ, Dodd SJ, Duyn JH (2009): Magnetic susceptibility mapping of brain tissue in vivo using MRI phase data. Magn Reson Med 62:1510–1522. [DOI] [PMC free article] [PubMed] [Google Scholar]
- Sukstanskii AL, Yablonskiy DA (2014): On the role of neuronal magnetic susceptibility and structure symmetry on gradient echo MR signal formation. Magn Reson Med 71:345–353. [DOI] [PMC free article] [PubMed] [Google Scholar]
- Torsdottir G, Kristinsson J, Sveinbjornsdottir S, Snaedal J, Johannesson T (1999): Copper, ceruloplasmin, superoxide dismutase and iron parameters in Parkinson's disease. Pharmacol Toxicol 85:239–243. [DOI] [PubMed] [Google Scholar]
- Wallis LI, Paley MNJ, Graham JM, Gruenewald RA, Wignall EL, Joy HM, Griffiths PD (2008): MRI assessment of basal ganglia iron deposition in Parkinson's disease. J Magn Reson Imaging 28:1061–1067. [DOI] [PubMed] [Google Scholar]
- Wu B, Li W, Guidon A, Liu C (2012): Whole brain susceptibility mapping using compressed sensing. Magn Reson Med 67:137–147. [DOI] [PMC free article] [PubMed] [Google Scholar]
- Zecca L, Casella L, Albertini A, Bellei C, Zucca FA, Engelen M, Zadlo A, Szewczyk G, Zareba M, Sarna T (2008): Neuromelanin can protect against iron‐mediated oxidative damage in system modeling iron overload of brain aging and Parkinson's disease. J Neurochem 106:1866–1875. [DOI] [PubMed] [Google Scholar]
- Zukor H, Song W, Liberman A, Mui J, Vali H, Fillebeen C, Pantopoulos K, Wu TD, Guerquin‐Kern JL, Schipper HM (2009): HO‐1‐mediated macroautophagy: a mechanism for unregulated iron deposition in aging and degenerating neural tissues. J Neurochem 109:776–791. [DOI] [PubMed] [Google Scholar]
Associated Data
This section collects any data citations, data availability statements, or supplementary materials included in this article.
Supplementary Materials
Supporting Information