

Abstract
Motor imagery (MI) is often used in combination with neuroimaging techniques to study the cognitive control of gait. However, imagery ability (IA) varies widely across individuals, potentially influencing the pattern of cerebral recruitment during MI. The aim of the current study was to investigate this effect of IA on the neural correlates of gait control using functional magnetic resonance imaging (fMRI). Twenty healthy young subjects were subdivided into a good and bad imagers group, on the basis of their performance on two mental chronometry tests. For the whole group, MI activated a bilateral network of areas highly consistent with previous studies, encompassing primary motor cortex (BA 4), supplementary motor area, and other frontal and parietal areas, anterior insula, and cerebellum. Compared to bad imagers, good imagers showed higher activation in the right BA 4, left prefrontal cortex (BA 10), right thalamus, and bilateral cerebellum. Good imagers thus appear better able to recruit motor areas during MI, but also activate a prefrontal executive area (BA 10), which integrates information from the body and the environment and participates in higher‐order gait control. These differences were found even though the two groups did not differ in other imagery abilities according to a standard questionnaire for vividness of motor and visual imagery. Future studies on MI should take into account these effects, and control for IA when comparing different populations, using appropriate measures. A better understanding of the neural mechanisms that underlie MI ability is crucial to accurately evaluate locomotor skills in clinical measures and neurorehabilitation techniques. Hum Brain Mapp 35:455–470, 2014. © 2012 Wiley Periodicals, Inc.
Keywords: motor imagery, gait, fMRI, imagery ability, mental chronometry
INTRODUCTION
Human gait is a complex behavior, involving coordinated muscle activation and balance control, as well as adaptation of movements according to bodily and environmental feedback [MacKay‐Lyons, 2002; Patla, 1998]. Moreover, it is increasingly recognized that gait also requires higher‐level cognitive control, such as attention and executive functions [Allali et al., 2010; Sheridan and Hausdorff, 2007]. One method to explore this higher‐order cognitive control of gait is through neuroimaging techniques, using motor imagery (MI) paradigms. MI is the mental simulation of an action without its actual execution [Jeannerod, 1994, 2006]. Two essential components of MI are visual imagery (VI) and kinesthetic imagery, the latter involving “feeling the movement,” or mentally perceiving muscle contractions and corresponding proprioceptive changes. The justification of using MI to study the cerebral control of gait rests on the documented neural overlap between movement planning and MI. The simulation of an action and preparation before execution have been attributed to the same motor representation system [Jeannerod, 1994]. Accordingly, there is now ample evidence from various imaging studies in humans to demonstrate a substantial overlap in the neural substrates for MI and motor performance [Decety, 1996; Decety et al., 1994; Gerardin et al., 2000; Porro et al., 1996; Stephan et al., 1995]. Thus, imagery of gait and actual gait execution have been found to recruit very similar cerebral networks [La Fougère et al., 2010; Miyai et al., 2001], involving fronto‐parietal areas, the basal ganglia, brainstem, and cerebellum.
A better understanding of the cerebral substrates for MI of gait, and of MI in general, is important because of the extensive use of MI in various clinical and professional contexts. MI techniques have been used in mental training leading to improvements in the performance of athletes [Driskell et al., 1994; Murphy, 1994], musicians [Meister et al., 2004; Pascual‐Leone et al., 1995], and highly skilled manual technicians such as surgeons [Rogers, 2006]. Imagery techniques are also used to aid the physical rehabilitation of patients with neurological disorders [Braun et al., 2006; Jackson et al., 2001; Johnson‐Frey, 2004; Sharma et al., 2006; review in Lotze and Halsband, 2006]. Furthermore, MI has been used in many neuroimaging studies to explore the cerebral mechanisms of different motor functions including gait [e.g., Iseki et al., 2008; Jahn et al., 2008; Wang et al., 2008] and gait control, such as precision gait [Bakker et al., 2008; Malouin et al., 2003; Wagner et al., 2008; Wang et al., 2009].
One caveat of using MI paradigms to study gait, however, is that the ability to imagine vividly and the mental processes involved in imagination can vary widely across subjects [Isaac and Marks, 1994; Marks, 1973; McKelvie, 1994; McKelvie and Demers, 1979]. Moreover, individual differences in imagery ability (IA) are associated with distinctive patterns of brain activation during imagery tasks. For example, some studies found a positive correlation between activity in visual and prefrontal cortex during VI and the subjective ratings of vividness of imagery [e.g., Amedi et al., 2005; Cui et al., 2007]. Another study investigated the effect of individual differences in visual IA (as measured with mental rotation tests) on brain activity during a VI task, using SPECT [Charlot et al., 1992], and found that “low imagers” showed a global increase in cerebral blood flow, whereas “high imagers” showed more regional increases. This was interpreted as a low differentiation of the cognitive control of imagery in poor imagers, and a more differentiated architecture for skilled imagers. With respect to MI, only one functional magnetic resonance imaging (fMRI) study looked directly at differences in brain activation during a finger sequence MI task between good and bad imagers [Guillot et al., 2008]. Contrary to the above, more focal activations were observed in poor imagers, attributed to a greater need to recruit mental resources in order to build a vivid representation of movements.
Despite some discrepancy in the pattern of differences, the above results suggest that individual differences in IA might influence brain activation during MI tasks. It is therefore important that studies on the neural basis of gait control also take this factor into account. Assessing MI ability is notoriously difficult because of its concealed nature. Most studies have used self‐rating questionnaires, designed to assess the subjectively experienced vividness of imagery. One problem with these is the variable inter‐rater calibration of subjective ratings. Another measure for MI ability is based on mental chronometry, which probes the temporal coupling between real and simulated movements, and thus reflects the ability to preserve the temporal characteristics of motor actions. Many studies have found a close relationship between the time it takes individuals to perform an action, and the time it takes them to imagine performing the same action [e.g., Decety and Michel, 1989]. This has been taken as evidence that the mental and actual temporal organization of movements share (at least in part) the same planning mechanisms [Decety and Michel, 1989]. Mental chronometry is thus regarded as a reliable method to evaluate individuals' MI ability [Guillot and Collet, 2005; Malouin et al., 2008a, 2008b].
The aim of the current study was to investigate the neural correlates of gait control using fMRI in a population of healthy subjects, which was subdivided according to MI ability, as assessed using a chronometry approach. The main mental chronometry test used here is based on the “Timed Up & Go” test [TUG, Podsiadlo and Richardson, 1991], which has been extensively used in the evaluation of gait and balance performance. We employed a validated paradigm that assesses the time difference between the executed version and an imagined version of the TUG [iTUG, Beauchet et al., 2010]. A second chronometry test is the Ten Meters (TM) test, which works similarly and is matched to our fMRI task. In addition to chronometry tests, we also administered two classic questionnaires assessing the vividness of MI, in order to compare different measures of IA. Our gait imagery fMRI task was based on prior paradigms that manipulated path length and difficulty [Bakker et al., 2007, 2008; Decety and Jeannerod, 1995; Stevens, 2005].
METHODS
Subjects
Twenty healthy young subjects (mean age 27.2 ± 3.3 years, 9 males) took part in this study. They were recruited from the community through advertising. The study was approved by the local ethics committee. All participants gave written informed consent. All participants were right‐handed, as verified with the Edinburgh Handedness Inventory [EHI, Oldfield, 1971] on which they obtained a mean score of 86.2 ± 16.3. All subjects had normal or corrected‐to‐normal vision, and no neurological, psychiatric, or orthopedic disturbances.
Based on MI ability (TUG and TM test, see section “Mental chronometry tests”), subjects were subsequently divided into two groups of 10 subjects each; a Good Imagers group (mean age 28.4 ± 3.2 years) and a Bad Imagers group (mean age 25.9 ± 3.1). There were no significant differences in age (F(1,19) = 3.21, P = NS), gender composition (z = −1.31, P = NS), or EHI score (F(1,19) = 0.52, P = NS) between groups.
Mental Chronometry Tests
MI ability was formally defined on the basis of the performance of our subjects on two mental chronometry tests, namely the Imagined “Timed Up and Go” (iTUG) test developed by Beauchet et al. 2010, and the ten meters (TM) test described below. Subjects were given standardized verbal instructions before each test.
A standard procedure was used for the TUG [Podsiadlo and Richardson, 1991]: subjects were seated on a chair in a large empty room without visual distractions. A mark was placed on the floor at 3 m distance in front of the chair. Subjects were first asked to stand up, walk around the mark, and sit back on the chair, at their self‐selected normal speed. Next, subjects were instructed to perform the same task, but imagined while sitting on the chair (iTUG). No instructions were given as to whether to open or close eyes, but participants generally kept their eyes open. All subjects completed two trials for both the TUG and the iTUG. An experimenter timed their performance, starting when the subject stood up and stopping when he/she was seated again. On the iTUG, the experimenter gave a verbal cue to start, and the subject was instructed to pronounce the word “stop” when he/she had mentally completed the task.
The TM test was similar in design to the TUG, but adapted to be more simple (without any turning, standing up, or sitting down) and more similar to the fMRI task (which also involved walking straight for 10 m). Subjects were asked to stand on a mark, with another mark on the floor at 10 m distance in front of them, in a long empty corridor. They were asked to walk at self‐selected normal speed from the first mark to the other mark. Immediately after returning to starting position, they were instructed to perform the same action, but now imagined, while standing on the mark, and to indicate verbally when they had finished this task. Again, no instructions were given as to whether to keep eyes open or closed. All subjects completed two trials for both the real and the imagined condition, while an experimenter timed their performance.
Imagery Ability Score
IA was quantified by using the mean performed (T real) and imagined times (T imag) for each of the two chronometry tests (TUG and TM), and then calculating the “delta time” according to the following formula: delta = ((T real – T imag)/(T real + T imag)) × 2. IA score was defined as the positive mean of the two delta times for the TUG and the TM test. Therefore, the smaller the IA score, the better IA. The IA score was used to subdivide our subjects into a Good and Bad Imagers groups using a median split procedure.
Imagery Questionnaires
As most studies employed standardized questionnaires to assess individual MI abilities, two rating scales were used as additional measures. This also allowed us to compare the different measures of IA.
Vividness of movement imagery questionnaire
We used a validated version of the vividness of movement imagery questionnaire (VMIQ) developed by Roberts et al. 2003, in which subjects have to rate the vividness of their MI on a five‐point scale (1 = as clear and vivid as normal; 5 = no imagery at all) for a series of 12 physical activities. The lower the score on this questionnaire, the higher the experienced vividness of imagery. Motor activities were imagined in three different conditions: (i) external VI, as if watching oneself performing the movement from an external point of view, (ii) internal VI, as if looking out through one's own eyes whilst performing the movement, and (iii) kinesthetic imagery, feeling oneself perform the activity.
Post‐scanner vividness questionnaire (PVQ)
Another measure was obtained immediately after the scanning session, when subjects were asked, retrospectively, to rate their vividness of imagery on the different conditions of the task. They did this by reference to the same five‐point scale as used in the VMIQ.
fMRI Procedure
Materials
Participants were scanned during a single fMRI session lasting about 40 min. All functional and structural MRI data were acquired on a 3 T MRI system (Trio TIM, Siemens, Germany) with a 12 channel head coil at the Brain & Behavior Laboratory (BBL) of the University of Geneva. Visual stimuli were presented on a projection screen inside the scanner using E‐prime (E‐prime 1.0, Psychology Software Tools, Pittsburgh). Responses were recorded with a response button box (HH‐2×4‐C, Current Designs, USA). Gaze direction and pupil diameter were logged with an MRI compatible long‐range eye‐tracker (EyeTrac 6, Applied Science Laboratories, USA).
Scanning protocol
Whole brain functional images were collected using a susceptibility weighted echo planar imaging sequence (Repetition time (TR)/Echo time (TE) = 2,100/30 ms; flip angle = 80°; parallel acquisition technique factor = 2; field of view = 205 mm; matrix size = 64 × 64 pixels). Thirty‐six transversal slices were acquired sequentially with a 3.2 mm thickness and an interslice gap of 0.64 mm, yielding a voxel size of 3.2 mm isotropic. High‐resolution whole brain anatomical scans were acquired with a T1‐weighted, 3D sequence (MPRAGE; TR/Inversion time (TI)/TE = 1,900/900/2.27 ms; flip angle = 9°; voxel dimensions = 1 mm isotropic; 256 × 256 × 192 voxels).
fMRI activation task
Stimuli were 12 color photos, consisting of six views of each of two different outdoor walkways, located in the garden of a rehabilitation hospital. Each of the six views was taken from a slightly different perspective, side or angle (Fig. 1). These walkways have been used in previous gait studies [e.g., Allet et al., 2009]. Both walkways were about 1 m wide. One walkway had a smooth tarred surface, while the other had a surface consisting of irregular cobble stones (4–30 cm in diameter). These two conditions were intended to manipulate the apparent difficulty of walking. Subjects performed three different tasks: MI, VI, and a perceptual control (C) condition.
Figure 1.
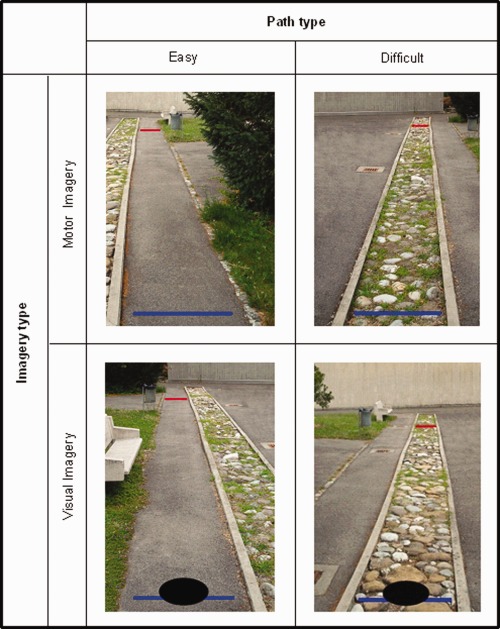
Visual stimuli used in the fMRI task. In the MI task, subjects imagined walking on the path from a first‐person perspective, from the blue (bottom) line to the red (top) line. In the VI task, they imagined the disk moving down the path. In a third control (C) condition subjects decided whether the two lines were blue or red. [Color figure can be viewed in the online issue, which is available at http://wileyonlinelibrary.com.]
In the MI task, participants were shown the photos of the different walkways with two colored horizontal lines drawn across the path: a blue line at the bottom to indicate the start of the trajectory, and a red line at a distance of 10 m (as measured on the actual path; see Fig. 1). Participants were asked to start imagine walking from the blue line to the red line as soon as the picture appeared, with their eyes open (as verified by eye‐tracking). They had to press a button with their right hand when they imagined that they had reached the red line on the walkway. They were instructed to try and imagine walking as vividly as possible, as if feeling their limbs moving (but without actually moving them), and from a first‐person perspective (i.e., a combination of internal VI and kinesthetic imagery).
In the VI task, participants were presented with the same photos as in the MI task, but this time a black disk (25 cm in diameter) was shown on each photo at the start of the trajectory (on the blue line) (see Fig. 1). Participants were asked to imagine this disk moving from the blue to the red line at a constant speed, similar to walking speed (i.e., external VI). They pressed a button when they imagined the disk to have arrived at the red line.
In the control task (C), participants were presented with the same pictures as in the MI task, but now the colored lines on the walkways were either both blue, or both red. Participants were instructed to simply inspect each photograph for a fixed period of time (6 s in half of the trials, 10 s in the other half). After offset of the picture, participants were cued to press either one button if the lines on the walkway were red, or a second button in case they were blue. This task was designed to control for the visual stimulation, as participants kept their eyes open in the two imagery conditions.
All participants received detailed training and explanations of the instructions for each condition, with the aid of examples and photographs, before the scanning session. It was thus ensured that all participants were comfortable with and able to engage in each type of imagery.
Procedure
The three different tasks were presented in a block‐wise fashion, with two blocks per task, and therefore six blocks in total. Presentation of the blocks was counterbalanced across participants. Each block consisted of 10 trials, with five easy (smooth paths) and five difficult (irregularly surfaced paths) trials randomized. A block design was used to make this paradigm administrable to elderly and patients, for whom task‐switching can be problematic. Each block started with the presentation of the task instructions. Upon appearance of the picture, the participant had to start performing the imagery task, and press a button when finished. As soon as the participant pressed the button, the picture disappeared and the picture for the next trial appeared after an interval of 3 s.
Behavioral Data Analysis
For each subject, the mean imagery time for the MI and VI conditions was calculated by averaging all trials from each condition. Imagery time was taken as the time between the picture onset and the button press. Task compliance was monitored by online observation of the eye‐tracker monitor. Moreover, following the procedure by Bakker et al. 2008, we also verified task adherence by investigating the effect of path surface (i.e., task difficulty) for the MI and the VI task. Task difficulty should have a larger effect on MI than on VI. Therefore, a 2 × 2 repeated measures ANOVA of imagery times was carried out, with task (MI vs. VI) and difficulty (easy vs. difficult) as within‐subject variables. Finally, electromyography (EMG) recording of the leg muscle was performed during scanning (see section “EMG recording/ analysis”).
fMRI Data Analysis
First‐level analysis
Functional images were preprocessed and analyzed using standard methods implemented in SPM5 (Wellcome Department of Imaging Neuroscience, London). First, all volumes were realigned, after which slice‐timing correction was used to resample all slices to the acquisition time of the middle slice. Next the data were spatially normalized to the Montreal Neurological Institute (MNI) EPI template image, resampled to 3 mm isotropic voxels, and smoothed with a Gaussian kernel (8 mm full‐width half‐maximum). The individual subject models included regressors for each experimental condition convolved with the canonical Hemodynamic Response Function (HRF), plus head movement parameters. For the regressors of interest, onsets of the square‐wave functions were taken as the onset of the picture (marking the onset of imagery), and offsets were taken as the button press time stamp for each trial. The button presses themselves were thus not included in the design matrix. A high‐pass filter (with a cut‐off period of 128 s) and a first order autoregressive function to account for temporal autocorrelation were applied. Statistical parametric maps were generated by contrasting the different conditions using standard t‐tests. The five conditions were motor imagery—easy (MIE), motor imagery—difficult (MID), visual imagery—easy (VIE), visual imagery—difficult (VID), and control (C).
Second‐level analysis
A first group analysis containing all 20 subjects together was carried out by entering the five contrast images (of the five conditions specified above) obtained in the individual analyses into a Flexible Factorial design, which included condition as a main factor. A separate model was created to compare the two subgroups of good and bad imagers (defined by median split of MI abilities), with a new Flexible Factorial design. In this model, we specified condition as a factor with five levels, group as a factor with two levels (resulting in a 5 × 2 ANOVA), and we modeled the interaction between group and condition. The contrasts of interest were the main effect of imagery type ((MIE + MID)>(VIE + VID), or simply MI > VI), the main effect of path difficulty ((MID + VID) > (MIE + VIE)), and their functional interaction (MID > MIE, exclusively masked by VID > VIE). Next to these, we also looked at a number of simple contrasts, namely MI > C, probing for global activation associated with MI, and MID > MIE, probing for an effect of path type during MI. Imagery times (button press RTs) were always added in the model as nuisance covariate, to ensure that any difference between conditions or groups did not reflect a difference in the time taken to perform the task. Statistical analyses were performed on a voxel‐wise basis across the whole brain. We report activations that survive a threshold of P < 0.05 family‐wise error (FWE) corrected for multiple comparisons across the whole brain, as well as those with P < 0.001 uncorrected with clusters of k > 20 voxels, since this latter combination of a strict threshold at the voxel level and large cluster size is considered to be appropriate when changes in blood oxygenation level dependent (BOLD) signal have relatively weak amplitudes and variable or slow onsets [e.g., see Lieberman and Cunningham, 2009], as typically expected for mental imagery processes. Other analyses were based on specific regions of interest (ROIs) with small volume correction (SVC). Anatomical labels of activated clusters were determined using the xjView toolbox (http://www.alivelearn.net/xjview) and the Anatomy Toolbox version 1.5 [Eickhoff et al., 2005].
Parametric analysis
An additional random‐effect group analysis including all subjects was carried out whereby the individual IA scores were added as a regressor to the MI > C, MI > VI, and MID > MIE contrasts. This served as a supplementary search of brain regions where there was a correlation between IA and brain activity during gait imagery.
ROI analysis
To examine activation of the primary motor cortex in more detail, an anatomical ROI for BA4, as well as a control ROI for BA17 (visual cortex) were defined using the WFU PickAtlas Toolbox [Maldjian et al., 2003]. Results viewed using this toolbox are restricted to the ROI, and thus include a small volume correction (SVC).
EMG Recording/Analysis
During the fMRI session, muscle activity of the right lower leg was recorded to control for overt muscle movements. EMG was recorded with a modular data acquisition system (MP150, BIOPAC Systems, USA), with a sampling rate of 10,000 Hz. A pair of carbon wired MRI compatible electrodes were placed 5 cm apart along the muscle bellies of the right tibialis anterior. The reference electrode was placed on the centre of the patella.
For analysis, MRI artifact correction was performed by applying a 17.14 Hz band filter. Low‐ (500 Hz) and high (20 Hz) bandpass filtering and filtering for line frequency were then also applied. After preprocessing of the signal, a mean signal intensity was calculated for each subject and each experimental condition (MI, VI, and C), by averaging the trials of each condition.
RESULTS
Behavioral Results
Mental chronometry tests
Table 1 presents the mean performed (T real) and imagined times (T imag) for the TUG and TM test, as well as the resulting delta times and mean IA scores. Separating participants in two groups based on a median split of IA scores allowed us to obtain very similar values for the real and imagined times (i.e., delta is small) in the good imagers, but much more dissimilar values (i.e., delta is greater) in the bad imagers. As expected, a direct comparison of the delta time between the two groups yielded a significant difference, both for the TUG (F(1,19) = 75.51, P < 0.001) and for the TM test (F(1,19) = 7.53, P < 0.05).
Table 1.
Means ± SDs of all behavioral data
| Good imagers (n = 10) | Bad imagers (n = 10) | All subjects (n = 20) | |
|---|---|---|---|
| Mental chronometry tests | |||
| TUG | |||
| T real | 8.6 ± 0.9 | 8.0 ± 1.3 | 8.3 ± 1.1 |
| T imag | 8.0 ± 0.9 | 5.6 ± 0.9 | 6.8 ± 1.5 |
| delta | 0.08 ± 0.06 | 0.35 ± 0.07 | 0.22 ± 0.15 |
| TM | |||
| T real | 7.6 ± 0.8 | 7.7 ± 0.9 | 7.7 ± 0.8 |
| T imag | 7.7 ± 0.7 | 6.1 ± 1.2 | 6.9 ± 1.3 |
| delta | 0.10 ± 0.09 | 0.25 ± 0.15 | 0.17 ± 0.14 |
| IA | 0.09 ± 0.05 | 0.31 ± 0.07 | 0.20 ± 0.13 |
| Imagery Questionnaires | |||
| VMIQ | |||
| EVI | 24.7 ± 8.1 | 29.2 ± 10.8 | 27.1 ± 9.7 |
| IVI | 23.0 ± 11.1 | 28.1 ± 8.9 | 25.7 ± 10.1 |
| KIN | 22.7 ± 7.7 | 26.6 ± 10.0 | 24.7 ± 9.0 |
| PVQ | |||
| MIE | 1.85 ± 0.47 | 2.10 ± 0.57 | 1.98 ± 0.53 |
| MID | 1.95 ± 0.76 | 2.10 ± 0.88 | 2.03 ± 0.80 |
| VIE | 2.20 ± 0.89 | 2.20 ± 0.63 | 2.20 ± 0.75 |
| VID | 2.10 ± 0.84 | 2.30 ± 0.48 | 2.20 ± 0.68 |
| fMRI task | |||
| MI | 9.1 ± 2.5 | 8.1 ± 1.9 | 8.6 ± 2.2 |
| Easy | |||
| Difficult | 10.7 ± 3.3 | 9.6 ± 2.3 | 10.2 ± 2.8 |
| VI | 8.8 ± 2.9 | 7.8 ± 2.6 | 8.3 ± 2.8 |
| Easy | |||
| Difficult | 9.4 ± 3.2 | 9.0 ± 3.1 | 9.2 ± 3.1 |
| EMG data | |||
| MI | 0.0029 ± 0.002 | 0.0025 ± 0.002 | 0.0027 ± 0.002 |
| VI | 0.0025 ± 0.002 | 0.0024 ± 0.002 | 0.0025 ± 0.002 |
| C | 0.0026 ± 0.002 | 0.0029 ± 0.003 | 0.0027 ± 0.002 |
TUG = Timed Up and Go test, TM = Ten Meters test, IA = imagery ability, T real = time to perform action in reality, T imag = time to perform action imagined, VMIQ = vividness of movement imagery questionnaire, PVQ = post‐scan vividness questionnaire, EVI = external visual imagery, IVI = internal visual imagery, KIN = kinaesthetic imagery, MIE = motor imagery easy, MID = motor imagery difficult, VIE = visual imagery easy, VID = visual imagery difficult, MI = motor imagery, VI = visual imagery, C = control.
Imagery questionnaires
Results from the two questionnaires, the VMIQ and the PVQ, can be found in Table 1. Even though scores of good imagers tended to be generally lower (i.e., their vividness of imagery was greater) than those of bad imagers, none of the scores differed significantly between groups (all P > 0.25). While these data indicate that MI ability assessed by chronometry is partly distinct from MI ability assessed by self‐report, the general trend observed across all questionnaires suggests some consistency for different measures of imagery.
fMRI gait imagery task
Mean imagery times during the different conditions of our task are summarized in Table 1. Responses in the control condition (deciding on the color of the lines) were 100% correct for all participants. A repeated measures ANOVA with task (MI and VI) and condition (easy and difficult) as within‐subject factors for the results of all 20 subjects together revealed a main effect of task (F(1,19) = 5.14, P < 0.05), a main effect of condition (F(1,19) = 44.01, P < 0.001) and an interaction effect (F(1,19) = 7.73, P < 0.05). This indicates that participants took longer to perform both tasks when the paths were difficult (irregular surface) than when they were easy (smooth surface). Furthermore, the difference in time between the easy and difficult paths was larger for the MI than for the VI condition. This specific effect of path difficulty on the MI task provides crucial evidence that participants did indeed engage in MI [Bakker et al., 2008], as path surface did affect movement of the disk in the VI task less than imagined self‐movements along the pathway.
When comparing the two subgroups of participants, we found no group difference for any of the task conditions separately. However, the pattern of effects of path difficulty on the MI and VI tasks was different for the two groups (see Table 1). For the good imagers, there were also a main effect of task (F(1,9) = 6.12, P < 0.05), a main effect of condition (difficulty) (F(1,9) = 16.17), P < 0.005), and an interaction (F(1,9) = 7.38, P < 0.05). For the bad imagers, however, there was only a main effect of condition (F(1,9) = 27.77), P < 0.001), but no main effect of task (F(1,9) = 1.04, P = ns), and no interaction (F(1,9) = 1.32, P = ns).
There were no significant correlations between our various behavioral measures (chronometry test results, questionnaire responses, and fMRI task performance).
EMG Results
The mean muscle activity values for the different task conditions during fMRI can be found in Table 1. A repeated measures ANOVA revealed no difference in EMG activity between the three conditions for the group as a whole (F(2) = 1.01, P = ns). Also for the two subgroups of participants, there were no differences in EMG activity between conditions (good imagers: F(2) = 1.18, P = ns, bad Imagers: F(2) = 0.98, P = ns). For none of the three conditions there was a difference between the two groups (MI: F(1,19) = 0.108, P = ns; VI: F(1,19) = 0.037, P = ns; C: F(1,19) = 0.082, P = ns). These data ensure that no differential muscular activity took place in the different conditions and different groups.
fMRI Results
All subjects
First, we analyzed brain activation of the entire group of 20 subjects, to verify that our task evokes activity in brain regions consistent with MI and thus validate our paradigm. The main effect of imagery type (MI > VI), searching for regions specifically involved in the kinesthetic aspect of MI, showed no significant activations using a strict threshold (P < 0.001 or FWE corrected). When thresholded at P(unc) < 0.005 (with cluster size k > 20), this contrast yielded selective activation in bilateral cerebellum, right precuneus, and right inferior parietal lobule (IPL) (Table 2, Fig. 2b). Based on a priori hypotheses, we also defined a ROI centered on the primary motor cortex (BA 4) in both hemispheres, and found significant activation in the left superior‐medial part of BA 4 (x = −3, y = −42, z = 72; Z = 1.77; k = 4) for this contrast (thresholded at P < 0.05, small‐volume‐corrected). No significant increase was seen in a control ROI placed in primary visual cortex (BA 17). Interestingly, the opposite contrast (VI > MI) revealed an effect in a left‐sided cluster in BA 17 (x = −12, y = −96, z = −15; Z = 1.89; k = 2, at a threshold of P < 0.05, small‐volume‐corrected), but there was no VI effect in BA 4. We also directly contrasted activation during MI with the control condition (MI > C, at P(unc) < 0.001 and a threshold of 20 contiguous voxels), and found widespread activation in a network of areas including the bilateral primary motor cortex (BA 4), bilateral supplementary motor area (SMA), several bilateral frontal and parietal areas, bilateral anterior insula, right caudate head, and bilateral cerebellum (Table 2, Fig. 2a). When FWE correction was applied, the clusters in the SMA, left BA4, and left inferior frontal cortex remained significant.
Table 2.
Peaks of clusters of activation in all 20 subjects, for the main contrasts of our task
| Area | BA | MNI | Z‐score | Cluster size | ||
|---|---|---|---|---|---|---|
| x | y | Z | ||||
| MI>VI (P(unc) < 0.005) | ||||||
| L cerebellum | −21 | −42 | −39 | 3.89 | 87 | |
| L mid cingulate gyrus | −9 | −15 | 36 | 3.60 | 21 | |
| R mid frontal gyrus | 9 | 33 | 18 | 36 | 2.95 | 39 |
| R precuneus | 7 | 12 | −75 | 36 | 3.53 | 36 |
| R inf parietal lobule | 40 | 57 | −48 | 45 | 3.26 | 20 |
| L cerebellum | −33 | −45 | −51 | 3.25 | 22 | |
| R cerebellum | 9 | −51 | −3 | 3.20 | 20 | |
| MI > C (P(unc) < 0.001) | ||||||
| L pre/postcentral gyrus | 9/2 | −60 | 9 | 27 | 5.19 | 712 |
| R sup medial frontal gyrus | 32 | 3 | 24 | 42 | 5.19 | 514 |
| L suppl. motor area | 0 | −6 | 69 | 4.49 | ||
| R inf frontal operculum | 60 | 12 | 24 | 5.16 | 878 | |
| R insula | 42 | 24 | −3 | 5.00 | ||
| L supramarginal gyrus | 40 | −60 | −21 | 15 | 5.06 | 161 |
| R mid frontal gyrus | 10 | 39 | 51 | 3 | 4.92 | 93 |
| R postcentral gyrus | 48 | −27 | 42 | 4.43 | 277 | |
| R inf parietal lobule | 40 | 51 | −42 | 51 | 4.28 | |
| L insula | −36 | −3 | 9 | 4.10 | 22 | |
| R pallidum | 12 | 9 | −3 | 3.96 | 23 | |
| L inf orbito‐frontal gyrus | −39 | 18 | −9 | 3.95 | 49 | |
| R cerebellum | 6 | −57 | −9 | 3.85 | 81 | |
| R inf frontal gyrus | 42 | 33 | 24 | 3.84 | 44 | |
| L cerebellum | −33 | −57 | −36 | 3.69 | 32 | |
| (MID + VID) > (MIE + VIE) (P(unc) < 0.001) | ||||||
| R middle occipital gyrus | 18 | 24 | −105 | 0 | 5.93 | 333 |
| R inferior occipital gyrus | 33 | −90 | −9 | 4.81 | ||
| R superior temporal gyrus | 41 | 54 | −12 | −6 | 5.29 | 1088 |
| L inferior occipital gyrus | −21 | −99 | −15 | 4.97 | 332 | |
| L middle occipital gyrus | 18 | −24 | −105 | −3 | 4.63 | |
| R paracentral lobule | 4 | 21 | −39 | 48 | 4.55 | 624 |
| R postcentral gyrus | 3 | 12 | −27 | 78 | 4.31 | |
| R inferior frontal gyrus | 42 | 36 | −15 | 4.43 | 58 | |
| L precentral gyrus | 4 | −30 | −30 | 69 | 4.32 | 206 |
| L postcentral gyrus | 3 | −45 | −30 | 63 | 4.19 | |
| L superior temporal gyrus | −42 | −27 | 6 | 4.25 | 606 | |
| L hippocampus | −24 | −36 | −3 | 3.32 | 32 | |
| MID > MIE (P(unc) < 0.001) | ||||||
| R mid occipital gyrus | 18 | 24 | −105 | 0 | 5.27 | 214 |
| R sup temporal gyrus | 41 | 51 | −21 | 6 | 4.57 | 379 |
| L inf occipital gyrus | −21 | −102 | −12 | 4.35 | 180 | |
| L sup temporal gyrus | −57 | −15 | 6 | 3.58 | 81 | |
| L postcentral gyrus | −45 | −30 | 63 | 3.94 | 142 | |
| L inf parietal gyrus | 2 | −54 | −21 | 45 | 3.46 | |
| R postcentral gyrus | 15 | −30 | 78 | 3.90 | 157 | |
| R precentral gyrus | 6 | 30 | −21 | 72 | 3.84 | |
| L insula | −39 | −9 | 3 | 3.55 | 93 | |
| L sup temporal gyrus | −45 | −27 | 3 | 3.80 | 57 | |
| R hippocampus | 30 | −18 | −12 | 3.71 | 40 | |
| R putamen | 27 | 3 | 9 | 3.39 | 22 | |
| MID > MIE, exclusively masked by VID > VIE (P(unc) < 0.001) | ||||||
| L postcentral gyrus | 4 | −51 | −30 | 51 | 3.46 | 25 |
| R precentral gyrus | 4 | 21 | −18 | 75 | 3.88 | 64 |
MI = motor imagery, C = control, VI = visual imagery, MID = motor imagery difficult, MIE = motor imagery easy.
Figure 2.
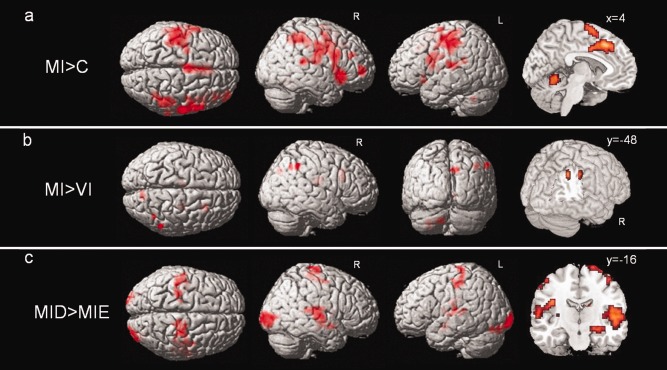
Activation in the whole subject group (n = 20) during: (a) MI versus control (C), displayed at a threshold of P(unc) < 0.001, k > 20. (b) MI versus VI, displayed at P(unc) < 0.005, k > 20. (c) Difficult (MID) versus easy (MIE) paths during MI, at P(unc) < 0.001, k > 20.
The main effect of path difficulty ((MID + VID) > (MIE + VIE), at P(unc) < 0.001, k > 20), identifying any area responding to irregular vs. smooth walking surfaces, showed widespread activations in cortical and subcortical structures (see Table 2). To test for apparent walking difficulty during MI more specifically, and thus identify areas presumably involved in the precise control of gait, we next computed the simple main contrast MID > MIE (at P(unc) < 0.001, k > 20). This comparison highlighted bilateral occipital, superior temporal, parietal and frontal areas (including primary motor cortex), as well as the left insula, right hippocampus, and right putamen (Table 2, Fig. 2c). None of these activations survived FWE correction.
Next to these main effects, we also formally tested the interaction between imagery type and path type, (MID > MIE) > (VID > VIE). This showed increases in the right primary motor cortex (BA 4; x = 36, y = −33, z = 66; Z = 2.87; k = 6, P(unc) < 0.005), confirmed by directly probing this contrast within a ROI of BA4 (x = 36, y = −33, z = 66; Z = 2.87; k = 30, P < 0.05, small‐volume corrected). To further highlight difficulty effects selective to MI, but not shared with VI, we also looked at the following contrast: (MID > MIE) masked exclusively by (VID > VIE), at P < 0.001. This revealed selective activations in the left postcentral gyrus and the right precentral gyrus, both partially overlapping with BA4 (Table 2).
Taken together, these findings at the whole group level indicate that MI produced selective recruitment of motor‐related areas in several cortical and subcortical brain structures, consistent with our predictions and previous work [e.g., Bakker et al., 2008]. Some of the weaker effects might reflect an important variability in the vividness of imagery across different individuals, as we specifically examined in the next section.
Good versus bad imagers
To assess the effect of IA on activation during our task, we compared good and bad imagers for the most relevant contrasts (in a separate model defined using a flexible factorial design, see methods). For the MI > C contrast, thresholded at P(unc) < 0.001, we found stronger activation in good imagers compared to bad imagers in the right primary motor cortex (BA 4), left prefrontal cortex (PFC) (BA 10), right thalamus, and bilateral cerebellum (Table 3, Fig. 3). For the opposite, bad versus good imagers, there were no significant clusters.
Table 3.
Peaks of clusters of stronger activation in good versus bad imagers for the main contrasts of our task
| Area | BA | MNI | Z‐score | Cluster size | ||
|---|---|---|---|---|---|---|
| x | y | z | ||||
| MI > C: good>bad (P(unc) < 0.001) | ||||||
| L sup frontal gyrus | 10 | −24 | 57 | 3 | 4.00 | 15 |
| L fusiform gyrus | −27 | −75 | −15 | 3.92 | 71 | |
| L cerebellum | −3 | −75 | −12 | 3.80 | 58 | |
| R thalamus | 3 | −12 | 3 | 3.77 | 14 | |
| L cerebellum | −42 | −54 | −45 | 3.69 | 15 | |
| R cerebellum | 45 | −45 | −42 | 3.55 | 17 | |
| R postcentral gyrus | 4 | 45 | −24 | 48 | 3.46 | 10 |
| MI > VI: good > bad, inclusively masked by MI > C_good (P(unc) < 0.005) | ||||||
| R inf temporal gyrus | 20 | 45 | −3 | −39 | 3.89 | 18 |
| R cerebellum | 39 | −45 | −27 | 3.39 | 25 | |
| R sup temporal gyrus | 54 | −18 | −3 | 2.87 | 18 | |
| L hippocampus | −21 | −36 | −3 | 3.20 | 20 | |
| R cerebellum | 9 | −66 | −18 | 3.15 | 27 | |
| L cerebellum | −24 | −72 | −24 | 3.04 | 14 | |
| MID > MIE: good > bad, inclusively masked by MID > MIE_good (P(unc) < 0.001) | ||||||
| R suppl. motor area | 24 | 6 | 0 | 45 | 3.78 | 12 |
| R suppl. motor area | 6 | 12 | −15 | 54 | 3.51 | 15 |
There were never significantly greater activations in bad than good imagers. MI = motor imagery, C = control, VI = visual imagery, MID = motor imagery difficult, MIE = motor imagery easy.
Figure 3.
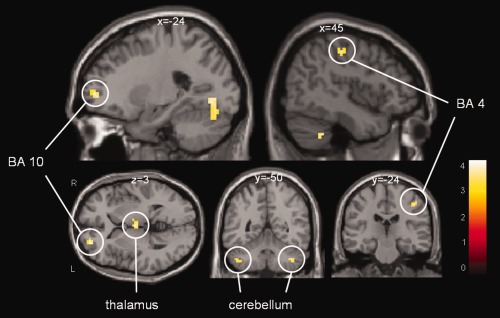
Good versus bad imagers for the MI versus Control contrast (displayed at P(unc) < 0.001). Clusters include right primary motor cortex (BA 4), left prefrontal cortex (BA 10), thalamus, and bilateral cerebellum. [Color figure can be viewed in the online issue, which is available at http://wileyonlinelibrary.com.]
The MI > VI contrast, comparing good versus bad imagers, showed no effect at P(unc) < 0.001, but selective activation in the right temporal lobe, left posterior hippocampus, and bilateral cerebellum at P(unc) < 0.005 (Table 3). For bad versus good imagers there were no significant clusters at either thresholds.
Finally, for the MID > MIE contrast, testing for the effect of gait difficulty, we found significantly greater activation in good than bad imagers in two clusters in the right SMA at P(unc) < 0.001 (Table 3, Fig. 4). Again, there was no difference for the opposite comparison of bad versus good imagers.
Figure 4.
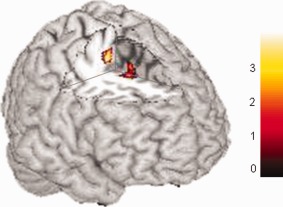
Good versus bad imagers, for the contrast targeting precise control of gait (MID > MIE), displayed at P(unc) < 0.001. Both clusters are in the right SMA (see Table 3). [Color figure can be viewed in the online issue, which is available at http://wileyonlinelibrary.com.]
Parametric analysis
As a supplementary search of brain regions showing a correlation between IA and brain activity during gait imagery, we also carried out a whole‐brain regression analysis with the MI > C contrast and individual IA scores of all 20 subjects. This analysis revealed a single cluster in the left PFC (BA 10, x = −21, y = 51, z = 0; Z = 4.50; k = 54, at threshold of P(unc) < 0.001), overlapping with the cluster found in the group comparison for MI > C. In this cluster, there was a linear negative correlation between activation and IA score, indicating that the better the IA, the higher the activation in BA 10 during MI (as shown in Fig. 5a). When looking at the parameter estimates of activity (beta values) extracted from the PFC cluster peak (Fig. 5b), it can be seen that the good imagers recruited this region roughly equally during both MI and VI (relative to the control condition). In the bad imagers, this cluster was relatively less activated during MI than during VI (P = ns).
Figure 5.
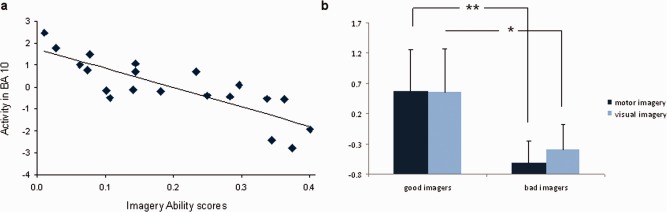
(a) Parameter estimates from the left PFC (BA 10) during MI and IA scores, of all subjects (n = 20). (b) Parameter estimates from BA 10 for good and bad imagers during MI versus control (MI > C, ▪) and VI versus control (VI > C, ▪).** P < 0.001, * P < 0.005. [Color figure can be viewed in the online issue, which is available at http://wileyonlinelibrary.com.]
The same parametric analysis was performed for the MI > VI contrast (at P(unc) < 0.001), again revealing a negative correlation with IA in the same cluster in the left PFC (BA10, x = −18, y = 51, z = −6, Z = 3.82, k = 7). This negative correlation was not found with the comparison of MID > MIE. None of these parametric analyses revealed any positive correlations between activation and IA score, indicating that there were no brain areas in which activity decreased with increasing IA.
DISCUSSION
In this study, our aim was to investigate the influence of individual differences in MI ability on brain activation during imagery of gait. Our gait imagery task was found to be effective in activating a network of sensori‐motor brain regions which was highly consistent with previous neuroimaging studies on gait imagery. More importantly, we were able to demonstrate some specific differences in brain activation depending on mental IA (as assessed by independent chronometry tests), with good imagers showing stronger activation than bad imagers in several regions critically involved in MI.
Motor Imagery of Gait
The brain regions activated during MI in the whole‐group analysis (regardless of IA) nicely overlapped with results of previous studies on gait imagery [Bakker et al., 2008; Iseki et al., 2008; Jahn et al., 2008; La Fougère et al., 2010; Wagner et al., 2008; Wang et al., 2008]. This network includes the primary (BA 4) and supplementary motor cortices (SMA and pre‐SMA), several bilateral parietal and frontal areas, and bilateral cerebellum. There has been some controversy on whether the primary motor cortex is involved in MI, as some imaging studies have failed to find activation in BA 4. However, BA 4 activation has already been found during gait imagery [Wang et al., 2008], as well as during imagery of limb movements [e.g., Cojan et al., 2009]. The discrepancy may be explained by methodological differences [Dechent et al., 2004; Sharma et al., 2008]. As no motor program is executed during MI, BA 4 activation in this condition may reflect covert encoding of spatial or directional information [Sharma et al., 2008], or sensory processing for the purpose of upcoming movement generation or simulation [Hanakawa et al., 2003]. Importantly, we can exclude the possibility that primary motor cortex activation was due to overt muscle movement, because our EMG data revealed no difference in leg muscle activity between the MI condition and the VI and control (C) conditions.
Other areas activated in this network are also compatible with motor control functions. The SMA and pre‐SMA are very consistently found in MI experiments. The SMA is involved in the programming and simulation of complex motor sequences. Activation in SMA has also been found in single‐photon emission computed tomography (SPECT) and near‐infrared spectroscopy (NIRS) studies of actual walking [Fukuyama et al., 1997; Miyai et al., 2001]. The pre‐SMA is involved in planning spatio‐temporal aspects of actions and in updating motor plans for temporally ordered movements [Roland et al., 1980; Shibasaki et al., 1993]. Their recruitment during MI is therefore consistent with their role in motor preparation. The anterior insula is involved in mental navigation along memorized routes [Ghaem et al., 1997], but also supports the feeling of agency, awareness of body parts, and self‐awareness [Craig, 2009; Karnath and Baier, 2010]. One possible function of the right inferior frontal gyrus (BA 9) may be response inhibition [Aron et al., 2004], arguably necessary during MI to prevent actual movement. Prefrontal areas (including right inferior frontal gyrus and left superior frontal gyrus activated here) may also contribute to MI through attentional processing and cognitive control of action production. This interpretation is strengthened by the fact that these frontal regions were not significantly activated when comparing MI versus VI, suggesting that they might have a more general role in mental imagery (including in the visual domain). Moreover, our task did not only involve gait as such, but also required other cognitive functions such as goal‐directed behavior (path integration), spatial orientation, and time estimation, which could potentially recruit these frontal regions. As we specifically aimed to study the higher‐order cognitive control of gait, we deliberately opted to include these different aspects of gait in the task and to manipulate difficulty of gait, which is likely to involve cortical (frontal) pathways [e.g., Bakker et al., 2008; Wang et al., 2009]. Different types of paradigms, for example those that are more focused on pure gait or use unrestricted steady‐state locomotion instructions, might yield less cortical but more subcortical, brainstem, and cerebellar activation [e.g., Jahn et al., 2008].
It should be noted that at least some part of our pre‐motor activation might be due to eye movements, as it partly overlapped with the frontal eye fields. Note that participants were instructed to keep their eyes open during MI, and eye tracker data did confirm that participants made eye movements consistent with the imagery instructions (e.g., moving along the pictures of the path). It has been shown that subjects tend to make more eye movements during imagery with the eyes open when visual stimuli are presented than without presentation [Heremans et al., 2009]. However, there is evidence that imagery with eyes open and eyes closed entail similar processes [Heremans et al., 2008]. Moreover, MI may be more accurate and vivid when external cues (such as visual stimuli) are given during imagery [Heremans et al., 2009], and MI with eyes open (with or without visual stimuli) has been successfully employed in previous neuroimaging studies on gait [e.g., Iseki et al., 2008; Wagner et al., 2008; Wang et al., 2008].
A selective activation of the motor aspects of mental imagery (MI > VI) was found in bilateral cerebellum, right precuneus, and right IPL, as well as in a medial portion of left BA 4 when using ROI analysis. These areas are likely to mediate the kinesthetic aspect of MI. The cerebellum is a major component of the motor system, with a key role in balance control [Morton and Bastian, 2004], sensory predictions based on motor commands [Blakemore and Sirigu, 2003], and regulation of movement speed and rhythm [Armstrong, 1988] The precuneus is believed to play an important role in visuo‐motor coordination and retrieval of visuo‐motor sequences [Nakamura et al., 2001], and in the imagination of motor actions in space [Ogiso et al., 2000] Moreover, this region is also involved in self‐processing operations, like first‐person perspective taking and experience of agency [Cavanna and Trimble, 2006], which is one of the differential characteristics of the MI task relative to the VI task. Likewise, inferior parietal areas (BA 3 and 40) are also consistently found in MI studies and implicated in somatosensory‐motor integration, as well as higher‐order analysis of visuo‐spatial and proprioceptive information such as location of body parts [Andersen, 1997; Blanke et al., 2010; Hanakawa et al., 2003; Wenderoth et al., 2006].
Finally, by contrasting MI in difficult (MID) and easy (MIE) conditions (irregular paths vs. smooth paths), we could determine brain regions involved in precise gait control. These included bilateral superior temporal lobes, bilateral parietal and frontal areas (including primary motor cortex), left insula, right hippocampus, and basal ganglia (right putamen/caudate and thalamus). The bilateral primary motor cortex was also specifically modulated by difficulty for the MI task and not for the VI task, as illustrated by the significant interaction between imagery type and path type (MID > MIE, masked exclusively by VID > VIE) in the whole‐brain analysis. These findings suggest that the primary motor cortex does not only play a role in the kinesthetic aspect of MI, but also in the more specific precision control of gait, presumably through its interconnections with the basal ganglia loops [Mink, 1996]. The hippocampus has also regularly been shown to be active during MI [Iseki et al., 2008; Jahn et al., 2004], probably reflecting its role in spatial navigation [e.g., Wolbers et al., 2007], and hence less specific to gait itself. Nonetheless, our difficult paths were likely to call for more precise visuo‐spatial navigation than easy paths (as the cobble stones require more precise foot placement and positioning on the paths), leading to stronger activation in the MID vs MIE condition.
Effect of Imagery Ability
The main outcome of our study was the finding of marked differences in brain activation patterns between participants with good and bad MI ability (IA). For the main effect of MI (MI > C), we found that good imagers compared to bad imagers showed greater activation of motor circuits such as the right primary motor cortex, right thalamus, and bilateral cerebellum (all generally recruited during MI, as discussed above), suggesting that good imagers were better able to recruit this network for this task. In addition, good imagers also exhibited significantly higher activity in the left PFC (BA 10). Moreover, this increase was confirmed by parametric analyses showing that the better the IA, the more active this cluster. Interestingly, this area receives information from different sensory systems about both internal body states and the external environment [Barbas, 1993; Carmichael and Price, 1995]. It has also long been associated with spatial working memory [D'Esposito et al., 1998; Ranganath et al., 2003]. In particular, the left BA 10 is involved in the integration of spatial and motor components of working memory during imagery and haptic exploration of spatial layouts, in order to guide motor preparatory processes [Kaas et al., 2007]. This area thus appears to participate in higher‐order control of MI, which is also confirmed by a correlation in the same cluster (albeit smaller) between activation during MI > VI and IA scores.
More specific motor effects of IA were observed when probing the effect of path difficulty (MID > MIE): stronger activation in good than bad imagers arose in the right SMA, a key component of the motor circuit. These findings clearly demonstrate that effective engagement of motor programming systems during MI depend on individual skills in imagery.
These fMRI data also nicely dovetail with the different behavioral patterns found in the two groups of subjects. For good imagers (or for all subjects when pooled together), response times (i.e., imagery times) indicated a significant interaction between task (MI > VI) and path difficulty (irregular versus smooth): the motor task was more influenced by path difficulty than the visual task, demonstrating a good adherence to the imagery task instructions [Bakker et al., 2008]. Bad imagers only showed a main effect of condition, no interaction: there was a similar effect of path difficulty in both the motor and VI task. This could point to the fact that bad imagers may have resorted to different strategies, such as more emphasis on visual than on kinesthetic processing even during MI. A more visual strategy in the latter condition would result in similar behavioral patterns in the MI and VI task, as observed here for the bad imagers. This would fit with the weaker activation in bad imagers in areas associated with motor programming, such as the SMA, when testing for the effect of path difficulty.
We note that no contrast revealed stronger activation in bad imagers relative to good imagers. This suggests that better IA is associated with a better ability to recruit relevant regions. This finding accords with a study by Sacco et al. 1980, who investigated the effect of locomotor training on brain activation during locomotor imagery. They found greater activation of the primary motor cortex, premotor cortex, SMA, and somatorsensory cortex after training, as compared with no training. Note, however, that our results do not speak as to whether good IA (i.e., accurate mental chronometry) allows for stronger recruitment of motor circuits during MI, or whether a stronger recruitment of areas associated with MI allows for a better performance during mental chronometry tasks. Our results are somewhat different from those of Guillot et al. 2008, who found increased activations in good imagers in parietal and ventrolateral premotor regions, but increased activations in bad imagers in the posterior cingulate cortex (PCC), orbitofrontal cortex (OFC), and cerebellum. However, Guillot et al. used a different type of MI and a different criterion for IA (partly based on vividness questionnaire scores and physiological measures), which could potentially explain these differences.
Finally, it should be noted that most of the activations reported here did not survive correction for multiple comparisons. Instead, most of our main results were obtained with a standard strict threshold of P < 0.001 at the voxel level, with a cluster threshold of k > 20. This combination of threshold and cluster criteria allows a selection of reliable effects when changes in BOLD have relatively weak amplitudes and imprecise onsets, as likely to be the case for imagery or other purely internal (non‐sensory) mental events [see e.g., Lieberman and Cunningham, 2009]. Importantly, all activations reported were selective and concerned areas well‐known to be involved in MI. Additionally, we found a significant correlation between activity in the prefrontal cortex and an independent behavioral measure (IA scores). Taken together, this strongly suggests that our effects were reliable and task‐related.
Mental Chronometry
In our study, subjects were defined as “good” or “bad” imagers based on their performance on two mental chronometry tests, independent of performance of MI during fMRI. The performance of good imagers on these tests indicates that they were able to maintain an accurate temporal coupling between real and imagined actions, whereas bad imagers had greater difficulty in representing actual duration during imagery. Bad imagers had imagery times that were generally shorter than good imagers: they consistently underestimated the time necessary to perform the task. This difference in imagery time was significant for both chronometry tasks. The same pattern emerged from behavioral data during fMRI: bad imagers again showed shorter imagery times than good imagers, for both the MI and VI tasks, and for both the easy and difficult paths. The underestimation of time in imagined walking is a known phenomenon, and different hypotheses might account for it: the target distance may be visually “underperceived,” walking speed may be overestimated, or imagined walking may be prone to anticipation errors (i.e., a tendency to terminate a response prematurely) [Yamamoto and Philbeck, 2009]. Our results do not allow us to support a specific hypothesis; future studies should test these and other possible hypotheses using specific paradigms. It would be especially interesting to see whether the underestimation of walking time could be explained by the use of more prominent visual rather than kinesthetic imagery strategies.
Remarkably, differences in activation between good and bad imagers in our study were found despite no reliable differences in IA according to the two vividness questionnaires. Group differences in fMRI data were selectively modulated by mental chronometry performance. Thus, performance on the chronometry tasks was independent of self‐reported vividness of imagery. Subjective vividness ratings did not have a significant influence on brain activation, as confirmed by an absence of correlation between fMRI patterns and questionnaire scores (data not shown). Given that many previous studies of MI ability have used vividness questionnaires, our study underscores the usefulness for future studies to add mental chronometry tests, which probe MI ability in a more quantifiable manner.
An obvious limitation of our study is that we classified subjects as good or bad imagers on the basis of a median‐split of their IA scores. This is arguably a somewhat arbitrary distinction. Another procedure might have been to predefine clear‐cut scores as “good” and “bad” and pre‐select subjects on the basis of these criteria. However, it is likely that the latter approach would show similar differences. Additionally, our definition of IA along a single dimension is somewhat oversimplified and other aspects are likely to be important besides chronometry performance. Mental chronometry is still only a semi‐objective measure, being dependent on subjective report of the subject. It probes MI in a rather indirect manner, and does only take into account the ability to preserve the temporal characteristics of the imagined movement, while it does not give any information about accuracy or vividness of MI. Differences in IA may also have reflected differences in strategy use: “good imagers” may have employed more efficient or versatile strategies than “bad imagers” in our particular task, resulting in the differing fMRI effects. Future studies should investigate this possibility by controlling for strategy use during the task.
CONCLUSIONS
With the improvement of neuroimaging techniques in the last decade, we have greatly advanced our understanding of the neural basis of higher‐order cognitive control of gait, through MI paradigms. This study is the first to investigate the effect of individual differences in MI ability on brain activations during MI of gait. Our results reveal greater activation in good than in bad imagers in several motor areas including primary and supplementary motor cortices, right thalamus, and bilateral cerebellum, all being part of a well‐known MI network. Good imagers also showed increased activation in a left PFC region (BA 10), which is known to integrate information from different sensory systems from the body and external environment.
These results have important implications for future studies on imagery of gait, firstly because they show that patterns of brain activity during gait imagery are influenced by individual differences in IA, and secondly, because they indicate that measures based on mental chronometry are different and possibly more sensitive than vividness questionnaires. Therefore, our study strongly advocates the use of mental chronometry tests (at least in addition to other measures) in future studies on imagery of gait or MI in general. A better understanding of the neural mechanisms underlying MI ability might also improve our comprehension of locomotor skills and their heterogeneity in the normal population, as well as the variable susceptibility to neurorehabilitation techniques.
REFERENCES
- Allali G, Van der Meulen M, Assal F (2010): Gait and cognition: The impact of executive function. Swiss Arch Neurol Psychiat 161:195–199. [Google Scholar]
- Allet L, Armand S, de Bie RA, Pataky Z, Aminian K, Herrmann FR, de Bruin ED (2009): Gait alterations of diabetic patients while walking on different surfaces. Gait Posture 29:488–493. [DOI] [PubMed] [Google Scholar]
- Amedi A, Malach R, Pascual‐Leone A (2005): Negative BOLD differentiates visual imagery and perception. Neuron 48:859–872. [DOI] [PubMed] [Google Scholar]
- Andersen RA (1997): Multimodal integration for the representation of space in the posterior parietal cortex. Philos Trans R Soc Lond B Biol Sci 352:1421–1428. [DOI] [PMC free article] [PubMed] [Google Scholar]
- Armstrong DM (1988): The supraspinal control of mammalian locomotion. J Physiol 405:1–37. [DOI] [PMC free article] [PubMed] [Google Scholar]
- Aron AR, Robbins TW, Poldrack RA (2004): Inhibition and the right inferior frontal cortex. Trends Cogn Sci 8:170–177. [DOI] [PubMed] [Google Scholar]
- Bakker M, de Lange FP, Stevens JA, Toni L, Bloem BR (2007): Motor imagery of gait: A quantitative approach. Exp Brain Res 179:497–504. [DOI] [PubMed] [Google Scholar]
- Bakker M, de Lange FP, Helmich RC, Scheeringa R, Bloem BR, Toni L (2008): Cerebral correlates of motor imagery of normal and precision gait. NeuroImage 41:998–1010. [DOI] [PubMed] [Google Scholar]
- Barbas H (1993): Organization of cortical afferent input to the orbitofrontal area in the rhesus monkey. Neuroscience 56:841–864. [DOI] [PubMed] [Google Scholar]
- Beauchet O, Annweiler C, Assal F, Bridenbaugh S, Herrmann FR, Kressig RW, Allali G (2010): Imagined Time “Up & Go” test: A new tool to assess higher‐level gait and balance disorders in older adults? J Neurol Sci 294:102–106. [DOI] [PubMed] [Google Scholar]
- Blakemore S‐J, Sirigu A (2003): Action prediction in the cerebellum and in the parietal lobe. Exp Brain Res 153:239–245. [DOI] [PubMed] [Google Scholar]
- Blanke O, Ionta S, Fornari E, Mohr C, Maeder P (2010): Mental imagery for full and upper human bodies: Common right hemisphere activations and distinct extrastriate activations. Brain Topogr 23:321–332. [DOI] [PubMed] [Google Scholar]
- Braun SM, Beurskens AJ, Borm PJ, Schack T, Wade DT (2006): The effects of mental practice in stroke rehabilitation: A systematic review. Arch Phys Med Rehab 87:842–852. [DOI] [PubMed] [Google Scholar]
- Carmichael ST, Price JL (1995): Limbic connections of the orbital and medial prefrontal cortex in macaque monkeys. J Comp Neurol 25:615–641. [DOI] [PubMed] [Google Scholar]
- Cavanna AE, Trimble MR (2006): The precuneus: A review of its functional anatomy and behavioural correlates. Brain 129:564–583. [DOI] [PubMed] [Google Scholar]
- Charlot V, Tzourio N, Zilbovicius M, Mazoyer B, Denis M (1992): Different mental imagery abilities result in different regional cerebral blood flow activation patterns during cognitive tasks. Neuropsychologia 30:565–580. [DOI] [PubMed] [Google Scholar]
- Cojan Y, Waber L, Carruzzo A, Vuilleumier P (2009): Motor inhibition in hysterical conversion paralysis. NeuroImage 47:1026–1037. [DOI] [PubMed] [Google Scholar]
- Craig BAD (2009): How do you feel now? The anterior insula and human awareness. Nat Rev Neurosci 10:59–70. [DOI] [PubMed] [Google Scholar]
- Cui X, Jeter CB, Yang D, Montague PR, Eaglemen DM (2007): Vividness of mental imagery: Individual variability can be measured objectively. Vision Res 47:474–478. [DOI] [PMC free article] [PubMed] [Google Scholar]
- D'Esposito M, Aguirre GK, Zarahn E, Ballard D, Shin RK, Lease J (1998): Functional MRI studies of spatial and nonspatial working memory. Cogn Brain Res 7:1–13. [DOI] [PubMed] [Google Scholar]
- Decety J (1996): The neurophysiological basis of motor imagery. Behav Brain Res 77:45–52. [DOI] [PubMed] [Google Scholar]
- Decety J, Michel F (1989): Comparative analysis of actual and mental movement times in two graphic tasks. Brain Cogn 11:87–97. [DOI] [PubMed] [Google Scholar]
- Decety J, Jeannerod M (1995): Mentally simulated movements in virtual reality: Does Fitt's law hold in motor imagery? Behav Brain Res 72:127–134. [DOI] [PubMed] [Google Scholar]
- Decety J, Perani D, Jeannerod M, Bertinardi V, Tadary B, Woods R, Mazziotta JC, Fazio F (1994): Mapping motor representations with positron emission tomography. Nature 371:600–602. [DOI] [PubMed] [Google Scholar]
- Dechent P, Berboldt K‐D, Frahm J (2004): Is the human primary motor cortex involved in motor imagery? Cogn Brain Res 19:138–144. [DOI] [PubMed] [Google Scholar]
- Driskell JE, Copper C, Moran A (1994): Does mental practice enhance performance? J Sport Psychol 79:481–492. [Google Scholar]
- Eickhoff SB, Stephan KE, Mohlberg H, Grefkes C, Fink GR, Amunts K, Zilles K (2005): A new SPM toolbox for combining probabilistic cytoarchitectonic maps and functional imaging data. NeuroImage 25:1325–1335. [DOI] [PubMed] [Google Scholar]
- Fukuyama H, Ouchi Y, Matsuzaki S, Nagahama Y, Yamauchi H, Ogawa M, Kimura J, Shibasaki H (1997): Brain functional activity during gait in normal subjects: A SPECT study. Neurosci Lett 228:183–186. [DOI] [PubMed] [Google Scholar]
- Gerardin E, Sirigu A, Lehéricy S, Poline J‐B, Gaymard B, Marsault C, Agid Y, Le Bihan D (2000): Partially overlapping neural networks for real and imagined hand movements. Cereb Cortex 10:1093–1104. [DOI] [PubMed] [Google Scholar]
- Ghaem O, Mellet E, Crivello F, Tzourio N, Mazoyer B, Berthoz A, Denis M (1997): Mental navigation along memorized routes activates the hippocampus, precuneus, and insula. NeuroReport 8:739–744. [DOI] [PubMed] [Google Scholar]
- Guillot A, Collet C (2005): Duration of mentally simulated movement: A review. J Motor Behav 37:10–20. [DOI] [PubMed] [Google Scholar]
- Guillot A, Collet C, Nguyen VA, Malouin F, Richards C, Doyon J (2008): Functional neuroanatomical networks associated with expertise in motor imagery. NeuroImage 41:1471–1483. [DOI] [PubMed] [Google Scholar]
- Hanakawa T, Immisch I, Toma K, Dimyan MA, van Gelderen P, Hallett M (2003): Functional properties of brain areas associated with motor execution and imagery. J Neurophysiol 89:989–1002. [DOI] [PubMed] [Google Scholar]
- Heremans E, Helsen WF, Feys P (2008): The eyes as a mirror of our thoughts: Quantification of motor imagery of goal‐directed movements though eye movement registration. Behav Brain Res 187:351–360. [DOI] [PubMed] [Google Scholar]
- Heremans E, Helsen WF, De Poel HJ, Alaerts K, Meyns P, Feys P (2009): Facilitation of motor imagery through movement‐related cueing. Brain Res 1278:50–58. [DOI] [PubMed] [Google Scholar]
- Isaac AR, Marks DF (1994): Individual differences in mental imagery experience: Developmental changes and specialization. Br J Psychol 85:479–500. [DOI] [PubMed] [Google Scholar]
- Iseki K, Hanakawa T, Shinozaki J, Nankaku M, Fukuyama H (2008): Neural mechanisms involved in mental imagery and observation of gait. NeuroImage 41:1021–1031. [DOI] [PubMed] [Google Scholar]
- Jackson PL, Lafleur MF, Malouin F, Richards C, Doyon J (2001): Potential role of mental practice using motor imagery in neurologic rehabilitation. Arch Phys Med Rehab 82:1133–1141. [DOI] [PubMed] [Google Scholar]
- Jahn K, Deutschländer A, Stephan T, Strupp M, Wiesmann M, Brandt T (2004): Brain activation patterns during imagined stance and locomotion in functional magnetic resonance imaging. NeuroImage 22:1722–1731. [DOI] [PubMed] [Google Scholar]
- Jahn K, Deutschländer A, Stephan T, Kalla R, Hüfner K, Wagner J, Strupp M, Brandt T (2008): Supraspinal locomotor control in quadrupeds and humanas. Prog Brain Res 171:353–362. [DOI] [PubMed] [Google Scholar]
- Jeannerod M (1994): The representing brain: neural correlates of motor intention and imagery. Behav Brain Sci 17:187–245. [Google Scholar]
- Jeannerod M (2006): Motor Cognition: What Actions Tell the Self. Oxford: Oxford University Press. [Google Scholar]
- Johnson‐Frey SH (2004): Stimulation through simulation? Motor imagery and functional reorganisation in hemiplegic stroke patients. Brain Cogn 55:328–331. [DOI] [PubMed] [Google Scholar]
- Kaas AL, van Mier H, Goebel R (2007): The neural correlates of human working memory for haptically explored object orientations. Cereb Cortex 17:1637–1649. [DOI] [PubMed] [Google Scholar]
- Karnath HO, Baier B (2010): Right insula for our sense of limb ownership and self‐awareness of actions. Brain Struct Funct 214:411–417. [DOI] [PubMed] [Google Scholar]
- La Fougère C, Zwergal A, Rominger A, Förster S, Fesl G, Dieterich M, Brandt T, Strupp M, Bartenstein P, Jahn K (2010): Real versus imagined locomotion: A [18F]‐FDG PET‐fMRI comparison. NeuroImage 50:1589–1598. [DOI] [PubMed] [Google Scholar]
- Lieberman MD, Cunningham WA (2009): Type I and type II error concerns in fMRI research: re‐balancing the scale. Soc Cogn Affect Neurosci 4:423–428. [DOI] [PMC free article] [PubMed] [Google Scholar]
- Lotze M, Halsband U (2006): Motor imagery. J Physiol 99:386–395. [DOI] [PubMed] [Google Scholar]
- MacKay‐Lyons M (2002): Central pattern generation of locomotion: A review of the evidence. Phys Ther 82:69–83. [DOI] [PubMed] [Google Scholar]
- Maldjian JA, Laurienti PJ, Burdette JB, Kraft RA (2003): An automated method for neuroanatomic and cytoarchitectonic atlas‐based interrogation of fMRI data sets. NeuroImage 19:1233–1239. [DOI] [PubMed] [Google Scholar]
- Malouin F, Richards C, Durand A, Doyon J (2008a): Clinical assessment of motor imagery after stroke. Neurorehabil Neural Repair 22:330–340. [DOI] [PubMed] [Google Scholar]
- Malouin F, Richards C, Durand A, Doyon J (2008b): Reliability of mental chronometry for assessing motor imagery ability after stroke. Arch Phys Med Rehabil 89:311–319. [DOI] [PubMed] [Google Scholar]
- Malouin F, Richards C, Jackson PL, Dumas F, Doyon J (2003): Brain activations during motor imagery of locomotor‐related tasks: A PET study. Hum Brain Mapp 19:47–62. [DOI] [PMC free article] [PubMed] [Google Scholar]
- Marks DF (1973): Visual imagery differences in the recall of pictures. Br J Psychol 64:17–24. [DOI] [PubMed] [Google Scholar]
- McKelvie SJ (1994): The vividness of visual imagery questionnaire as a predictor of facial recognition memory performance. Br J Psychol 85:93–104. [DOI] [PubMed] [Google Scholar]
- McKelvie SJ, Demers DG (1979): Individual differences in reported visual imagery and memory performance. Br J Psychol 70:51–57. [DOI] [PubMed] [Google Scholar]
- Meister IG, Krings T, Foltys H, Boroojerdi B, Müller M, Töpper R, Thron A (2004): Playing piano in the mind—An fMRI study on music imagery and performance in pianists. Cogn Brain Res 19:219–228. [DOI] [PubMed] [Google Scholar]
- Mink JW (1996): The basal ganglia: Focused selection and inhibition of competing motor programs. Prog Neurobiol 50:381–425. [DOI] [PubMed] [Google Scholar]
- Miyai I, Tanabe HC, Sase I, Eda H, Oda I, Konishi I, Tsunazawa Y, Suzuki T, Yanagida T, Kubota K (2001): Cortical mapping of gait in humans: A near‐infrared spectroscopic topography study. NeuroImage 14:1186–1192. [DOI] [PubMed] [Google Scholar]
- Morton SM, Bastian AJ (2004): Cerebellar control of balance and locomotion. Neuroscientist 10:247–259. [DOI] [PubMed] [Google Scholar]
- Murphy SM (1994): Imagery interventions in sport. Med Sci Sport Exerc 26:486–494. [PubMed] [Google Scholar]
- Nakamura T, Ghilardi MF, Mentis M, Dhawan V, Fukuda M, Hacking A, Moeller JR, Ghez C, Eidelberg D (2001): Functional networks in motor sequence learning: Abnormal topographies in Parkinson's disease. Hum Brain Mapp 12:42–60. [DOI] [PMC free article] [PubMed] [Google Scholar]
- Ogiso T, Kobayashi K, Sugishita M (2000): The precuneus in motor imagery: A magnetoencephalographic study. NeuroReport 11:1345–1349. [DOI] [PubMed] [Google Scholar]
- Oldfield RC (1971): The assessment and analysis of handedness: The Edinburgh inventory. Neuropsychologia 9:97–113. [DOI] [PubMed] [Google Scholar]
- Pascual‐Leone A, Nguyet D, Cohen LG, Brasil‐Neto JP, Cammarota A, Hallett M (1995): Modulation of muscle responses evoked by transcranial magnetic stimulation during the acquisition of new fine motor skills. J Neurophysiol 74:1037–1045. [DOI] [PubMed] [Google Scholar]
- Patla AE (1998): How is human gait controlled by vision. Ecol Psychol 10:287–302. [Google Scholar]
- Podsiadlo D, Richardson S (1991): The time “Up & Go”: A test of basic functional mobility for frail elderly persons. J Am Geriatr Soc 39:142–148. [DOI] [PubMed] [Google Scholar]
- Porro CA, Francescato MP, Cettolo V, Diamond ME, Baraldi P, Zuiani C, Bazzocchi M, di Prampero PE (1996): Primary motor and sensory cortex activation during motor performance and motor imagery: A functional magnetic resonance imaging study. J Neurosci 16:7688–7698. [DOI] [PMC free article] [PubMed] [Google Scholar]
- Ranganath C, Johnson MK, D'Esposito M (2003): Prefrontal activity associated with working memory and episodic long‐term memory. Neuropsychologia 41:378–389. [DOI] [PubMed] [Google Scholar]
- Roberts R, Callow N, Hardy L, Markland D, Bringer J (2008): Movement imagery ability: Development and assessment of a revised version of the vividness of movement imagery questionnaire. J Sport Exerc Psychol 30:200–221. [DOI] [PubMed] [Google Scholar]
- Rogers RG (2006): Mental practice and acquisition of motor skills: Examples from sports training and surgical education. Obstet Gyn Clin N Am 33:297–304. [DOI] [PubMed] [Google Scholar]
- Roland PE, Larsen B, Lassen NA, Skinhoj E (1980): Supplementary motor area and other cortical areas in organization of voluntary movements in man. J Neurophysiol 43:118–136. [DOI] [PubMed] [Google Scholar]
- Sacco K, Cauda F, Cerliani L, Mate D, Duca S, Geminiani GC (2006): Motor imagery of walking following training in locomotor attention. The effect of ‘the tango lesson’. NeuroImage 32:1441–1449. [DOI] [PubMed] [Google Scholar]
- Sharma N, Pomeroy VM, Baron J‐C (2006): Motor Imagery. A backdoor to the motor system after stroke? Stroke 37:1941–1952. [DOI] [PubMed] [Google Scholar]
- Sharma N, Jones PS, Carpenter TA, Baron J‐C (2008): Mapping the involvement of BA 4a and 4p during motor imagery. NeuroImage 41:92–99. [DOI] [PubMed] [Google Scholar]
- Sheridan P, Hausdorff J (2007): The role of higher‐level cognitive function in gait: Executive dysfunction contributes to fall risk in Alzheimer's disease. Dement Geriatr Cogn Disord 24:125–137. [DOI] [PMC free article] [PubMed] [Google Scholar]
- Shibasaki H, Sadato N, Lyshkow H, Yonekura Y, Honda M, Nagamine T, Suwazono S, Magata Y, Ikeda A, Miyazaki M, Fukuyama H, Asato R, Konishi J (1993): Both primary motor cortex and supplementary motor area play an important role in complex finger movement. Brain 116:1387–1398. [DOI] [PubMed] [Google Scholar]
- Stephan KM, Fink GR, Passingham RE, Silbersweig D, Ceballos‐Baumann AO, Frith CD, Frackowiak RSJ (1995): Functional anatomy of the mental representation of upper extremity movements in healthy subjects. J Neurophys 73:373–386. [DOI] [PubMed] [Google Scholar]
- Stevens JA (2005): Interference effects demonstrate distinct roles for visual and motor imagery during the mental representation of human action. Cognition 95:329–350. [DOI] [PubMed] [Google Scholar]
- Wagner J, Stephan T, Kalla R, Brückmann H, Strupp M, Brandt T, Jahn K (2008): Mind the bend: cerebral activations associated with mental imagery of walking along a curved path. Exp Brain Res 191:247–255. [DOI] [PubMed] [Google Scholar]
- Wang C, Wai Y, Kuo B, Yeh Y‐Y, Wang J (2008): Cortical control of gait in healthy humans: an fMRI study. J Neural Transm 115:1149–1158. [DOI] [PubMed] [Google Scholar]
- Wang J, Wai Y, Weng Y, Ng K, Huang Y‐Z, Ying L, Liu H, Wang C (2009): Functional MRI in the assessment of cortical activation during gait‐related imaginary tasks. J Neural Transm 116:1087–1092. [DOI] [PubMed] [Google Scholar]
- Wenderoth N, Toni I, Bedeleem S, Debaere F, Swinnen SP (2006): Information processing in human parieto‐frontal circuits during goal‐directed bimanual movements. NeuroImage 31:264–278. [DOI] [PubMed] [Google Scholar]
- Wolbers T, Wiener JM, Mallot HA, Büchel C (2007): Differential recruitment of the hippocampus, medial prefrontal cortex, and the human motion complex during path integration in humans. J Neurosci 27:9408–9416. [DOI] [PMC free article] [PubMed] [Google Scholar]
- Yamamoto N, Philbeck JW (2009): When imagined walking is inaccurate, what is misperceived? J Vision 9:1117. [Google Scholar]