

Abstract
Physical frailty has been recognized as a clinical syndrome resulting from declines in various physiological systems; however, the role of the central nervous system in the pathophysiology of frailty remains unclear. The I‐Lan Longitudinal Aging Study randomly sampled community‐dwelling people aged 50 or older for a brain magnetic resonance imaging study. All participants were assessed for frailty status (robust, prefrail, and frail) based on the presence of five frailty components: slow walking speed, muscle weakness, low physical activity, exhaustion and weight loss (Fried criteria). Gray matter volume (GMV) changes associated with frailty status and individual frailty components were examined. Overall, 456 participants (64.0 ± 8.5 years, 47.6% women) were included in this study. The prefrail (n = 178, 39.0%) and frail (n = 19, 4.2%) subjects were grouped for analysis. The prefrail–frail group showed reduced GMV, compared to the robust group (n = 259, 56.8%), in the cerebellum, hippocampi, middle frontal gyri, and several other cerebral regions (corrected P < 0.05). Each frailty component was associated with GMV changes in functionally related brain areas. Hierarchical cluster analysis categorized these components into three subsets. Motor‐related components, including weakness, low activity, and slowness, comprised one subset with a common cerebellar involvement. Exhaustion and weight loss were the other two subsets without cerebellar changes. To conclude, physical frailty is associated with a decreased reserve in specific brain regions, especially cerebellum. Further longitudinal studies are needed to explore if the cerebellum‐ and noncerebellum‐based frailty components reflect a distinctive future risk for developing frailty. Hum Brain Mapp 36:3666–3676, 2015. © 2015 Wiley Periodicals, Inc.
Keywords: physical frailty, magnetic resonance imaging, voxel‐based morphometry, walking speed, physical activity, muscle weakness
INTRODUCTION
Frailty refers to a vulnerable state that places older people at higher risk of unfavorable health outcomes [Fried et al., 2001; Gill et al., 2010]. It is highly prevalent in old age and may increase the risks of incident falls, disability, dementia, institutionalization, hospitalization, and mortality [Fried et al., 2001]. Considering the impacts of frailty on the health of older people, the health care system and even the global economy may benefit substantially if frailty can be successfully prevented and reversed [Clegg et al., 2013].
Fried et al. [2001] defined the phenotype of frailty in terms of five components: slow walking speed, muscle weakness, low level of physical activity, exhaustion, and body weight loss. Nevertheless, the pathophysiology of frailty remains unclear.
Loss of reserve in various physiological systems is considered to play an important mediating role in the pathogenesis of frailty [Clegg et al., 2013]. Evidence has been mounting that frailty may result from age‐related decline in some interactive physiological systems, especially the skeletal muscle (sarcopenia), the endocrine and the immune systems [Attaix et al., 2005; Oldenburg, et al., 1993; Schaap et al., 2006].
Few studies have addressed the role of the central nervous system (CNS) in the pathogenesis of frailty, despite the clear link between frailty and cognition. The Fried criteria defined frailty based on the physical condition of the older population; however, frailty is capable of predicting incident cognitive impairment or dementia within a few years [Aranda et al., 2011; Doba et al., 2012; Raji et al., 2010]. The five components of frailty proposed by Fried have all been linked to cognitive functions, especially walking speed [Robertson et al., 2013]. Walking speed is associated with executive‐attentional, visuospatial, and even memory functions [Amboni et al., 2013]. Some magnetic resonance imaging (MRI) studies have further correlated walking speed to regional brain volumes of the prefrontal area, corpus callosum, or indices of brain atrophy and ventricular dilatation [Palm et al., 2009; Rosano et al., 2010, 2012 2012; Ryberg et al., 2007]. However, none of the studies have explored the structural change of the whole brain that may underpin the overall phenotype of frailty.
The present community‐based cohort study used large imaging samples and whole brain analysis to explore the neural signatures linking physical frailty to the brain. It is hypothesized that brain morphology is altered to reflect the reduced brain reserve associated with frailty. To be specific, the study aims to (1) explore the structural changes of the brain correlated with the frailty phenotype and the five individual components of frailty; (2) elucidate the interrelationship of individual frailty components based on the associated cerebral structural change; (3) propose a link between the neuroanatomical changes and frailty based on clinical, functional, and pathophysiologic viewpoints.
METHODS
Study Subjects
The I‐Lan Longitudinal Aging Study (ILAS) is a community‐based aging cohort study in I‐Lan County of Taiwan, which aimed to evaluate the interrelationship between aging, frailty, and cognition [Lee et al., 2013]. In brief, community‐dwelling adults aged 50 or older from Yuanshan Township in I‐Lan County were invited to participate in the study through the household registrations of the government. This study used the clinical and brain MRI data from the initial subsample (n = 504) of the ILAS. These participants were enrolled from August 2011 to December 2012.
The inclusion criteria of the ILAS were: (1) inhabitants of I‐Lan County without a plan to move in the near future, and (2) aged 50 years or older. Any subject that met any one of the following conditions was excluded from the study: (1) unable to communicate and complete an interview, (2) unable to complete a simple motor task (e.g., a 6‐m walk) within a reasonable period of time due to functional disability, (3) suffering from any major illness with limited life expectancy (less than 6 months in general), (4) having any contraindication for MRI such as metal implants, and (5) having been institutionalized for any reason. In addition, subjects suffering from major neuropsychiatric diseases such as dementia, stroke, brain tumor, or major depression were excluded from this imaging study. The whole study was approved by the Institutional Review Board of the National Yang Ming University, Taipei, Taiwan. All participants provided the informed consent.
Trained interviewers in the study used a questionnaire to collect from each participant demographic data, medical histories, and comorbid conditions. The Charlson's Comorbidity Index was used to assess comorbid illness burden from a total of 19 diseases such as heart disease or cancer. Each disease was weighted on the basis of their association with mortality. The index score was then constructed by summing up the relative risk associated with each condition [Charlson et al., 1987]. All participants were assessed using the Mini–Mental State Examination (MMSE) for cognitive function [Folstein et al., 1975] and the Center for Epidemiologic Studies Depression Scale (CES‐D) for mood and depressive symptoms [Radloff, 1977]. Moreover, various anthropometric and laboratory data, such as body mass index (kg/m2), blood cell count and biochemistry, urine analysis and dual‐energy X‐ray absorptiometry, were collected.
Assessment of Frailty
This study assessed the phenotype of frailty according to the Fried criteria, which consisted of five components: weight loss, exhaustion, low physical activity, weakness, and slowness [Fried et al., 2001].
Weight loss was identified as unintentional weight loss >5% in the past year or >3 kg in the most recent 3 months. Exhaustion was defined by using the following two statements from CES‐D [Orme et al., 1986]: (a) I felt that everything I did was an effort; (b) I could not get going. Subjects rated the frequency of such feelings in the most recent week as 0 (rarely or <1 day), 1 (some of the time or 1–2 days), 2 (a moderate amount of the time or 3–4 days), or 3 (most of the time); those responding “2” or “3” to either of these statements were categorized as frail in terms of the exhaustion criterion. Physical activity was assessed by the International Physical Activity Questionnaire‐Taiwan edition [Liou et al., 2008; Qu and Li, 2004]. Low physical activity referred to the lowest quintile within the gender. Handgrip strength was evaluated by a digital dynamometer (Smedlay's Dynamo Meter; TTM, Tokyo, Japan) and the lowest quintile of handgrip strength within the gender was defined as weakness. Finally, a walking speed within the lowest quintile of the gender‐specific performance in a timed 6‐m walk was defined as slowness.
Using the number of criteria fulfilled (0–5 in range) as a basis, each participant was categorized as frail (presence of three or more frailty components), prefrail (presence of one or two components), or robust (none existed) [Fried et al., 2001].
MRI Data Acquisition
All participants were scheduled for an MRI study of the brain at National Yang‐Ming University, Taipei, Taiwan. All brain images were acquired on a 3T Siemens MRI scanner (Siemens Magnetom Tim Trio, Erlangen, Germany) with a sagittal three‐dimensional (3D) high‐resolution structural T1‐weighted (T1w) magnetization‐prepared rapid acquisition gradient echo sequence (3D‐T1w‐MPRAGE; repetition time (TR)/echo time (TE)/inversion time (TI) = 3,500/3.5/1,100 ms; flip angle = 7°; 192 slices; number of excitations (NEX) = 1; matrix size = 256 × 256; field of view = 256 mm; in‐plane resolution = 1.0 × 1.0 mm2; slice thickness = 1.0 mm without interslice gap). White matter (WM) lesion identification was performed with an axial T2‐weighted fluid‐attenuated inversion recovery multishot turbo spin echo sequence (2D‐T2w‐FLAIR BLADE; TR/TE/TI = 9,000/143/2,500 ms; flip angle = 130°; 63 slices; NEX = 1; echo train length = 35; matrix size = 320 × 320; field of view = 220 mm; in‐plane resolution = 0.69 × 0.69 mm2; slice thickness = 2.0 mm without interslice gap). All images were acquired parallel to the anterior commissure–posterior commissure line.
MR Image Processing and Analysis: Voxel‐Based Morphometry
All images were processed using Statistical Parametric Mapping software (SPM8, Wellcome Institute of Neurology, University College London, UK, http://www.fil.ion.ucl.ac.uk/spm/) running on Matlab R2010a (Mathworks, Natick, MA). Each T2w‐FLAIR image was coregistered with the corresponding T1w image for automatic white matter hyperintensities (WMH) quantification and further lesion filling using the Lesion Segmentation Toolbox (LST v1.2.3) [Schmidt et al., 2012]. The preprocessed T1w images were then analyzed with a Diffeomorphic Anatomical Registration Through Exponentiated Lie Algebra (DARTEL)‐based voxel‐based morphometry (VBM) [Ashburner, 2007; Ashburner and Friston, 2000] using a VBM8 toolbox (http://dbm.neuro.uni-jena.de). The pipeline for the DARTEL‐VBM has been described in detail elsewhere [Bezzola et al., 2011; Le Heron et al., 2014; Yang et al., 2013; Ziegler et al.,2012; ] and included the following steps: (1) the image origin of each individual's native space lesion‐filled T1w scan was automatically set using a center of mass approach to decrease variability of image positioning across participants; (2) all structural images were intensity‐bias corrected, tissue‐segmented (classified into gray matter [GM], WM, and cerebrospinal fluid [CSF] compartments) and registered using a linear (affine align) and nonlinear transformation (DARTEL) algorithm; (3) the resultant GM segments were modulated by nonlinear components of the DARTEL normalization procedure to preserve the actual volumetric information, and were interpolated to isotropic voxel size at 1.5 × 1.5 × 1.5 mm. This procedure made the following statistical comparison more sensitive to the regional volume measurements rather than tissue density (concentration), and also excluded the global difference in brain volume between participants; and (4) the resultant Montreal Neurological Institute (MNI) space‐modulated GM segments were smoothed using an 8‐mm full‐width at half‐maximum Gaussian Kernel, and a probability threshold of 0.2 was used to remove voxels with lower corresponding tissue probability from the analysis to avoid a possible edge effect. Finally, tissue volumes of GM, WM, and CSF were computed separately by counting the pertinent voxels in the native space. The sum of these three tissue volumes was regarded as the total intracranial volume (TIV) of the native space.
Statistical Analysis
Of the 504 subjects, 30 with dementia, 11 with intracranial lesions (tumor or stroke), and 7 with severe motion artifact on their brain MRI were excluded; 456 subjects remained for this study. Age and sex were controlled for all the analyses of clinical and imaging data.
Analysis of Covariance (ANCOVA) was performed to compare the demographic and clinical data and TIV between groups, with age and sex entered as covariates. Volumes of GM, WM, CSF, and WMH were divided by TIV to adjust the brain size, then converted to rank orders for further comparisons between groups using nonparametric statistics. Statistical Product and Service Solutions (SPSS) software version 18 (SPSS, Chicago, IL) was used and a P value < 0.05 was considered significant.
To identify brain structural change related to the frailty phenotype (frail, prefrail, robust) or the individual frailty component (presence of either weight loss, exhaustion, low physical activity, weakness or slowness vs. robust subjects), we assessed voxelwise GMV changes between groups using the ANCOVA design of the SPM8 software. Age and sex were also entered as covariates. Results were considered significant under the criteria of familywise error (FWE)‐corrected P value < 0.05, with a cluster size of at least 185 voxels, based on the results of the Monte Carlo simulation (3dClusterSim with the following parameters: single voxel P value < 0.005, FWHM = 8 mm with GM mask and 10,000 simulations). Statistical results for the identified clusters with significant between‐group main effects, including cluster sizes, maximum T‐values, corresponding locations of MNI coordinates and the names of anatomical structures, were reported using the Peak_nii toolbox (http://www.nitrc.org/projects/peak_nii).
To elucidate the interrelationship between the five frailty components based on their specific brain signatures, hierarchical clustering analysis for the GM changes of the corresponding five frailty components were conducted using Matlab R2010a (Mathworks, Natick, MA). This method computed the distance metric between the five frailty components by the configuration of GM change specific to each component [Johnson, 1967]. The average distance between frailty components was used as the linkage function to obtain the arrangement of these components that can be demonstrated by a dendrogram.
RESULTS
Clinical Characteristics of Frailty
Of the 456 subjects, 259 (56.8%) were classified as robust according to the Fried frailty criteria; 178 (39.0%) were prefrail; and 19 (4.2%) were frail (Table 1). All subjects were right handed.
Table 1.
Demographic, clinical and radiological characteristics in different frailty groups
| Total | Robust | Prefrail | Frail | P | Prefrail–fraila | P | |
|---|---|---|---|---|---|---|---|
| Number (%) | 456 | 259 (56.8) | 178 (39.0) | 19 (4.2) | 197 (43.2) | ||
| Age (year) | 64.0 ± 8.5 | 62.5 ± 7.7 | 65.2 ± 9.0 | 73.6 ± 7.4 | <0.001 | 66.0 ± 9.2 | <0.001 |
| Sex (female %) | 47.6 | 45.9 | 50.0 | 47.4 | 0.765 | 49.7 | 0.508 |
| BMI | 24.7 ± 3.4 | 24.7 ± 3.6 | 24.6 ± 3.2 | 25.3 ± 3.7 | 0.413 | 24.6 ± 3.2 | 0.816 |
| Educational years | 6.2 ± 4.8 | 7.0 ± 4.7 | 5.5 ± 5.0 | 2.7 ± 3.7 | 0.251 | 5.2 ± 4.9 | 0.098 |
| Frailty component (frequency) | |||||||
| Weight loss (%) | 8 | 0 | 17 | 32 | 19 | ||
| Exhaustion (%) | 6 | 0 | 12 | 32 | 14 | ||
| Low activity (%) | 15 | 0 | 29 | 79 | 34 | ||
| Weakness (%) | 15 | 0 | 30 | 74 | 34 | ||
| Slowness (%) | 20 | 0 | 40 | 100 | 46 | ||
| MMSE score | 26.3 ± 3.2 | 26.9 ± 2.9 | 25.8 ± 3.4 | 23.1 ± 3.8 | 0.064 | 25.5 ± 3.5 | 0.083 |
| CES‐D score | 3.4 ± 5.6 | 2.2 ± 3.2 | 4.1 ± 5.8 | 11.8 ± 14.7 | <0.001 | 4.9 ± 7.4 | <0.001 |
| Charlson's Comorbidity Index | 0.7 ± 1.2 | 0.6 ± 1.1 | 0.8 ± 1.2 | 1.4 ± 1.5 | 0.765 | 0.8 ± 1.2 | 0.829 |
| Biochemical parameters | |||||||
| Fasting blood sugar (mg/dl) | 104.1 ± 34.9 | 102.1 ± 31.6 | 107.3 ± 40.3 | 100.5 ± 18.0 | 0.185 | 106.7 ± 38.8 | 0.069 |
| Total cholesterol (mg/dl) | 193.9 ± 33.5 | 195.5 ± 34.9 | 191.4 ± 31.9 | 194.3 ± 29.0 | 0.436 | 191.7 ± 31.6 | 0.628 |
| LDL‐cholesterol (mg/dl) | 121.4 ± 34.7 | 121.6 ± 34.4 | 120.8 ± 35.1 | 124.3 ± 35.7 | 0.414 | 121.1 ± 35.1 | 0.558 |
| HDL‐cholesterol (mg/dl) | 53.4 ± 12.6 | 54.2 ± 12.6 | 52.3 ± 12.9 | 53.4 ± 9.9 | 0.206 | 52.4 ± 12.6 | 0.091 |
| Albumin (g/dl) | 4.5 ± 0.2 | 4.5 ± 0.2 | 4.4 ± 0.3 | 4.4 ± 0.2 | 0.701 | 4.4 ± 0.3 | 0.505 |
| Total protein (g/dl) | 7.4 ± 0.4 | 7.4 ± 0.4 | 7.4 ± 0.5 | 7.4 ± 0.3 | 0.616 | 7.4 ± 0.5 | 0.331 |
| Uric acid (mg/dl) | 5.9 ± 1.5 | 5.9 ± 1.5 | 6.0 ± 1.5 | 5.7 ± 1.6 | 0.297 | 6.0 ± 1.5 | 0.270 |
| Serum creatinine (mg/dl) | 0.8 ± 0.2 | 0.8 ± 0.2 | 0.8 ± 0.3 | 0.9 ± 0.2 | 0.917 | 0.8 ± 0.3 | 0.931 |
| Hs‐CRP (mg/dl) | 0.2 ± 0.4 | 0.2 ± 0.5 | 0.2 ± 0.4 | 0.2 ± 0.4 | 0.865 | 0.2 ± 0.4 | 0.590 |
| Dual‐energy X‐ray absorptiometry | |||||||
| RASM (kg/m2) | 7.1 ± 1.2 | 7.3 ± 1.2 | 7.0 ± 1.1 | 6.9 ± 0.9 | 0.430 | 7.0 ± 1.1 | 0.194 |
| Total fat mass (kg) | 19.0 ± 6.9 | 18.9 ± 7.1 | 19.0 ± 6.6 | 20.3 ± 7.5 | 0.257 | 19.1 ± 6.7 | 0.479 |
| Fat percentage (%) | 30.6 ± 8.8 | 30.0 ± 9.0 | 31.2 ± 8.7 | 32.6 ± 7.4 | 0.137 | 31.3 ± 8.5 | 0.140 |
| TIV (cm3) | 1,347.6 ± 127.4 | 1,356.7 ± 131.3 | 1,337.2 ± 122.5 | 1,320.7 ± 111.8 | 0.858 | 1,335.6 ± 121.4 | 0.621 |
| GM%b | 43.1 ± 2.3 | 43.3 ± 2.1 | 42.8 ± 2.4 | 41.9 ± 2.3 | 0.344 | 42.7 ± 2.4 | 0.157 |
| WM%b | 37.0 ± 2.1 | 37.3 ± 2.1 | 36.8 ± 2.2 | 36.0 ± 1.9 | 0.809 | 36.7 ± 2.2 | 0.523 |
| CSF%b | 19.9 ± 2.7 | 19.4 ± 2.4 | 20.4 ± 2.9 | 22.1 ± 2.3 | 0.021 | 20.6 ± 2.9 | 0.006 |
| WMH %b | 0.3 ± 0.6 | 0.2 ± 0.4 | 0.4 ± 0.7 | 0.5 ± 0.6 | 0.097 | 0.4 ± 0.7 | 0.062 |
BMI, body mass index; CES‐D, the Center for Epidemiologic Studies Depression Scale; CSF, cerebrospinal fluid; GM, gray matter; HDL, high‐density lipoprotein; Hs‐CRP, high‐sensitivity C‐reactive protein; LDL, low‐density lipoprotein; MMSE, Mini–mental state examination; RASM, the relative appendicular skeletal muscle mass index; TIV, total intracranial volume; WM, white matter; WMH, white matter hyperintensities.
† P values for three‐group comparison: Robust vs. Prefrail vs. Frail (ANCOVA adjusting for age and sex; education also adjusted for MMSE).
‡ P values for two‐group comparison: Robust vs. Prefrail–frail (ANCOVA adjusting for age and sex; education also adjusted for MMSE).
Frail and Prefrail groups merged together.
Volumes of GM, WM, CSF and WMH are divided by TIV to adjust brain size and compared using nonparametric statistics (see text for details).
As expected, the frail group was older than the prefrail and robust groups (Table 1). The distribution of sex, education, and MMSE scores did not differ across the frailty statuses, while the CES‐D score was higher among the frail participants (Table 1). Due to the small number of frail subjects, the prefrail and frail subjects were combined into a prefrail–frail group in subsequent data analysis and referred to as the “at‐risk” group or subjects in later use for simplicity.
Frailty and Global Brain Tissue Volumes
The CSF volume was significantly higher (P = 0.006) in the at‐risk subjects than in the robust subjects. However, the TIV, GM, WM volumes, and WMH quantification did not differ between at‐risk and robust subjects (Table 1).
Frailty and Regional GMV Changes
Using voxel‐based analysis of the whole brain, the at‐risk group showed reduced GMV, compared to the robust group, in 13 brain regions including the cerebellum, hippocampi, middle frontal gyri, right inferior parietal lobule, precentral gyrus, and left insula, anterior cingulate, and middle occipital gyrus (Fig. 1 and Table 2, FWE cluster corrected P < 0.05). The above results did not qualitatively change when education or MMSE or CES‐D scores was additionally entered as a covariate in data analyses (Supporting Information Figs. 1 and 2).
Figure 1.
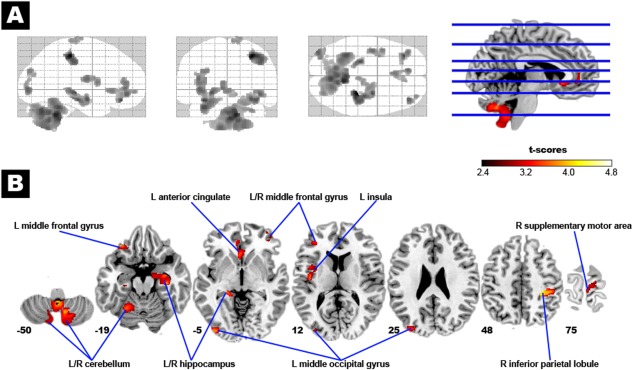
Brain structural changes associated physical frailty. In Panel A, the glass‐brain shows the spatial distribution of the group difference in regional gray matter volume (GMV) between the at‐risk (prefrail–frail) and robust subjects (corrected P < 0.05). The at‐risk subjects had reduced GMV in several specific brain regions, as indicated by the hot color map in Panel B. [Color figure can be viewed in the online issue, which is available at http://wileyonlinelibrary.com.]
Table 2.
Anatomical regions showing reduced GMV in prefrail–frail subjects (n = 197 vs. 259 robust subjects) and their association with individual frailty components
| MNI coordinates | Maximum t values | Frailty components with similar | ||||
|---|---|---|---|---|---|---|
| Cluster size | Anatomical region | x | y | z | within clusters | morphological changes |
| 6,161 | R cerebellum (vermis) | 6 | −71 | −36 | 4.31 | Slowness, weakness, low activity |
| L cerebellum (vermis) | −1 | −62 | −38 | |||
| R cerebellum (tonsil) | 12 | −60 | −50 | |||
| 1,345 | L cerebellum (hemisphere) | −33 | −48 | −30 | 3.95 | Slowness |
| 939 | L hippocampus | −26 | −26 | −15 | 3.87 | |
| 767 | R inferior parietal lobule | 44 | −29 | 44 | 4.64 | Exhaustion (L inferior parietal lobule) |
| 502 | L insula | −41 | −9 | 14 | 3.59 | Exhaustion |
| 498 | L anterior cingulate | −8 | 43 | 4 | 3.61 | Low activity |
| 285 | L middle occipital gyrus | −33 | −87 | 12 | 3.73 | Exhaustion |
| 268 | R hippocampus | 33 | −24 | −12 | 3.88 | |
| 237 | L middle frontal gyrus | −33 | 36 | −20 | 4.00 | Low activity |
| 227 | L middle occipital gyrus | −33 | −86 | 26 | 3.33 | Exhaustion |
| 215 | L middle frontal gyrus | −39 | 42 | 7 | 3.47 | Low activity |
| 188 | R middle frontal gyrus | 35 | 54 | −6 | 3.72 | Low activity |
| 186 | R supplementary motor area | 8 | −21 | 74 | 3.08 | Low activity |
R, right; L, left.
The Five Individual Components of Frailty and Regional GMV Changes
Subjects with an individual single component of frailty were compared with the robust group. Although four (slowness, weakness, low activity, and exhaustion) of the five frailty components were associated with GMV reduction in brain regions overlapped with the frailty‐related changes, the five components of frailty presented distinct patterns of brain structural changes (vs. the robust group; Fig. 2 and Table 3).
Figure 2.
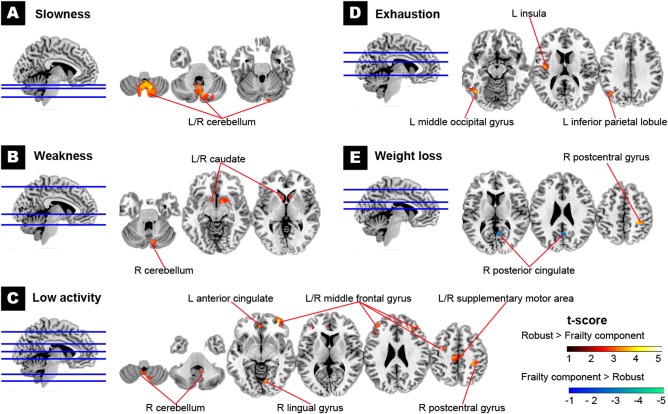
Brain structural changes associated with individual frailty components. Regional GMV was reduced in most frailty components, including slowness (Panel A), weakness (Panel B), low physical activity (Panel C), and exhaustion (Panel D) in different specific brain regions. However, weight loss was associated with both increased and decreased regional GMV (Panel E) (all corrected P < 0.05). The hot color map shows a significantly smaller regional GMV in the presence of frailty components. The cold color map otherwise indicates a larger regional GMV in the presence of the components. R, the right; L, the left. [Color figure can be viewed in the online issue, which is available at http://wileyonlinelibrary.com.]
Table 3.
The five frailty components and their associated changes in regional GMV
| MNI coordinates | Maximum t values | |||||
|---|---|---|---|---|---|---|
| Frailty component | Cluster size | Anatomical regiona | x | y | z | within clusters |
| Slowness | 5,623 | R cerebellum (vermis) | 2 | −55 | −38 | 4.40 |
| L cerebellum (vermis) | −3 | −55 | −38 | |||
| Weakness | 530 | R caudate | 8 | 8 | −2 | 3.40 |
| 275 | R cerebellum (vermis) | 9 | −76 | −23 | 3.41 | |
| 251 | L caudate | −9 | 11 | −5 | 3.12 | |
| Low activity | 1,137 | R cerebellum (tonsil) | 10 | −52 | −38 | 3.42 |
| 650 | R postcentral gyrus | 42 | −26 | 43 | 3.62 | |
| 551 | R middle frontal gyrus | 35 | 38 | 28 | 3.59 | |
| 545 | L middle frontal gyrus | −42 | 27 | 30 | 3.99 | |
| 385 | L anterior cingulate | −6 | 44 | 4 | 3.43 | |
| 354 | L supplementary motor area | −4 | −21 | 50 | 3.51 | |
| R supplementary motor area | 3 | −21 | 54 | |||
| 297 | R middle frontal gyrus | 34 | 56 | −8 | 4.02 | |
| 271 | L middle frontal gyrus | −29 | −1 | 45 | 3.34 | |
| 234 | R lingual gyrus | 11 | −73 | −1 | 3.83 | |
| Exhaustion | 757 | L middle occipital gyrus | −51 | −72 | −2 | 4.09 |
| 452 | L insula | −44 | −6 | 9 | 3.69 | |
| 281 | L inferior parietal lobule | −39 | −63 | 34 | 3.38 | |
| Weight loss | 367 | R posterior cingulateb | 5 | −56 | 22 | −3.59 |
| 204 | R postcentral gyrus | 31 | −34 | 50 | 4.10 | |
R, right; L, left.
All anatomical regions in this table showed decreased GMV in presence of the individual frailty component (vs. the robust group) except for the right posterior cingulateb showing increased GMV in presence of weight loss.
Slowness, weakness, and low activity involved reduced GMV in the cerebellum (Table 2). However, weight loss was associated with both GMV reduction (the right postcentral gyrus) and increase (the right posterior cingulate) topographically different from frailty‐related regions.
Based on the similarity of GMV changes, the interrelationship between the five frailty components was demonstrated in a dendrogram resulted from hierarchical clustering analysis (Fig. 3). Weakness and low activity had the most similar pattern in GMV reduction (distance: 0.643, a larger value indicates higher intergroup dissimilarity), followed by slowness (distance: 0.735). These three components could be grouped as the same subset, since all showed cerebellum‐based GMV reduction. In contrast, exhaustion (distance: 0.785) and weight loss (distance: 0.867) were the second and third subset, respectively, with distinct structural change (Table 3).
Figure 3.
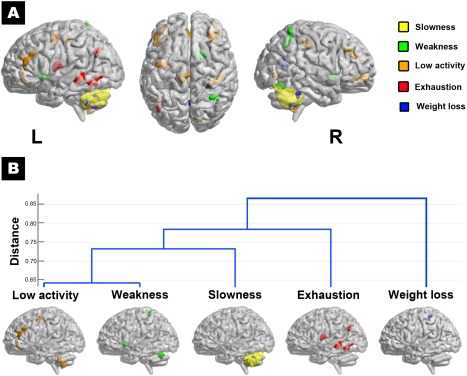
Cluster analysis of the brain structural changes associated with individual frailty components. The five individual frailty components are associated with heterogeneous patterns of regional GMV change (presence of a component vs. robust), as indicated by different component‐specific colors (Panel A). Based on the similarity of these GMV changes, the interrelationship between the five frailty components is demonstrated in a dendrogram resulted from hierarchical clustering analysis (Panel B). Weakness and low activity had the most similar pattern in GMV reduction (distance: 0.643, a larger value indicates higher intergroup dissimilarity), followed by slowness (distance: 0.735). These three components could be grouped as the same subset, since all showed cerebellum‐based GMV reduction. In contrast, exhaustion (distance: 0.785) and weight loss (distance: 0.867) were the second and third subset, respectively, with distinct structural change. R, the right; L, the left. [Color figure can be viewed in the online issue, which is available at http://wileyonlinelibrary.com.]
DISCUSSION
This community‐based study used whole brain voxel‐based analysis to demonstrate a decreased brain reserve associated with physical frailty. Significant GMV reductions were noted in the cerebellum, hippocampi, middle frontal gyri, and several other cerebral regions in the at‐risk subjects. Individual components of frailty demonstrated their distinct patterns of GMV changes. Weakness, slowness, and low activity shared characteristic cerebellar GMV atrophy. In contrast, exhaustion and body weight loss were associated with GM changes outside the cerebellum.
Cerebellar morphological change is compatible with the functional significance of frailty. Reduced GMV in the cerebellum has been linked to a slower walking speed among community‐dwelling elderly [Nadkarni et al., 2014]. Single‐photon emission computed tomography studies have identified cerebellum and other brain regions participate in the control of normal volitional walking [Fukuyama et al., 1997]. Moreover, patients with Parkinson disease showed lower walking‐related activity compared to healthy controls in the right cerebellum [Shibasaki et al., 2004]. Elderly with histories of falls also demonstrated a more reduced hemodynamic response of the right posterior cerebellum than those without [Liu‐Ambrose et al., 2008]. Therefore, cerebellar changes explain the predictability of the Fried frailty criteria for future falls. Conversely, cerebellar activation was associated with grip strength control [Schmitz et al., 2005]. In an animal study, surgical destruction of the cerebellar vermis reduced physical and social activities [Al‐Afif et al., 2013]. These observations were compatible with earlier neuroimaging and neuropsychiatric studies that incorporated the cerebellum into the distributed neural circuits subserving movement, cognition, emotion, and motivation [De Smet et al., 2013; Stoodley and Schmahmann 2010].
Based on our results, reduced GM in the cerebellum may be an important neural signature of frailty. Cerebellar atrophy is the common feature for up to three frailty components. By definition, the presence of three frailty components is acceptable for a diagnosis of frailty. In other words, cerebellar atrophy may be sufficient to develop necessary symptoms for diagnosing frailty. Of note, cerebellar atrophy seems not a chance complication of frailty. In the at‐risk group, a comparison of clinical profiles between subjects with cerebellum‐related components only (low activity, muscle weakness, and slowness, n = 133) and those with noncerebellum‐related components (including exhaustion and weight loss, n = 64) showed comparable clinical profiles listed in Table 1 except for CES‐D score (3.1 ± 4.3 for cerebellum‐related vs. 8.5 ± 10.6 for noncerebellum related frailty, P < 0.001).
In addition to the cerebellum, other brain areas were also linked to some specific frailty components. The caudate is involved in the predictive scaling of grip force control [Wasson et al., 2010], hence its atrophy was present in our subjects with weakness. Low physical activity involved cortical regions related to sensorimotor function (postcentral gyrus, supplementary motor area) and motivation (anterior cingulate, middle frontal gyrus). Exhaustion, as shown in an earlier study [Pavese et al., 2010], involved the left insula, a structure associated with interoception and emotion [Zaki et al., 2012]. The inferior parietal lobule and middle occipital gyrus (lateral occipital cortex) that showed GMV reduction associated with exhaustion have also been linked to fatigue in multiple sclerosis or chronic fatigue syndrome [Andreasen et al., 2010; Pellicano et al., 2010; Puri et al., 2012].
Unlike other frailty components associated only with GM atrophy, weight loss was linked to both GMV increase (posterior cingulate) and decrease (postcentral gyrus). Weight loss is always recognized to be deleterious to the survival outcomes of those aged over 65; however, the same condition may indicate better fitness in younger populations. A recent study has shown increased volume morphometry of the somatosensory network in overweight subjects [Gupta et al., 2015]. The intriguing finding may echo the present finding that weight loss is associated with reduced GMV in the postcentral gyrus. The GMV increase in the posterior cingulate may reflect an adaptation of the limbic system to body weight change. Weight loss by exercise or bariatric surgery in obese subjects has been shown to alter functional activity and metabolism of the posterior cingulate [Marques et al., 2014; McFadden et al., 2013].
It is assumed the five components of the Fried criteria for frailty could be organized into a self‐perpetuating cycle of naturally progressing events [Bandeen‐Roche et al., 2006; Fried et al., 2001]. However, the contribution of an individual component seems uneven in clinical observation [Xue et al., 2008]. Moreover, whether the underlying mechanism of each individual component develops conjointly or independently is unclear. In our study, hierarchical clustering analysis for the GMV changes in each component of frailty suggested the brain signatures of exhaustion and weight loss were distinct from the three motor‐related components, that is, weakness, slowness, and low level of activity. All of the three motor‐related components were associated with GMV reduction in the cerebellum, but the cerebellum was not involved in the nonmotor components, that is, exhaustion and weight loss. Our results implicate the presence of at least two different CNS pathways for frailty; one involves the cerebellum, and the other does not.
In the prospective cohort of the Women's Health and Aging Study II (WHAS II), Xue et al. [2008] suggested the nature of initial manifestations, such as weakness, exhaustion, and low level of activity, but not the number of initial manifestations distinguished the risk and rate of the onset of frailty. In contrast to the WHAS II data that failed to link weakness, slowness, and low physical activity into a single causal process in frailty, our imaging data suggest these three components may share a common pathway affecting the cerebellum. We will longitudinally follow up this ILAS cohort to discover if frailty initiating from different CNS‐based pathways in subjects may have different risks and rates of progression to frailty.
Despite an exclusion of patients with dementia from this study and comparable cognitive performance between groups, hippocampal atrophy was noted in the at‐risk group. Hippocampal atrophy is pathognomonic for Alzheimer disease [Mayeux, 2010]; thus, this finding highlights the interrelation between physical frailty and cognitive impairment, and may explain the predictability of the frailty phenotype for incident dementia [Robertson et al., 2013]. An earlier study also showed the association between physical frailty and the brain pathology of Alzheimer disease (plaques and tangles) [Buchman et al., 2008].
The strength of this study is its investigation of the neural basis of the frailty phenotype and all of its components using high‐resolution structural brain MRI in a large community sample. Moreover, our findings may serve as an early clinical marker of physical frailty, since the majority of the at‐risk subjects in this study group are still in the prefrail state.
Nevertheless, some caveats in the interpretation of the present data are in order. First, the structural change associated with each frailty component may not reflect the “pure” domain effect because the coexistence of other frailty domains was not excluded, due to the constraint of the subject number with “pure” frailty components. Nevertheless, frailty components usually coexist rather than exist independently in clinical practice. Second, due to the cross‐sectional design, we cannot conclude there is a causal relationship between frailty and the GMV changes found in this study. Third, the confounding effect from different age distributions between at‐risk and robust subjects may be of concern. However, a reanalysis in selected age‐matched at‐risk (n = 171, 85 M 86 F, age 64.4 ± 8.4 years) and robust subjects (n = 171, 85 M 86 F, age 64.3 ± 8.3 years) revealed similar voxelwise GMV changes between groups, including the present main finding of reduced cerebellar volume (Supporting Information Fig.3). In addition, we did a region of interest (ROI) analysis to confirm the volumetric differences between at‐risk and robust groups by 5‐year age groupings. All the 13 ROIs with volumetric group difference (Table 2) demonstrated a clear trend that the volumetric measure was lower in the at‐risk than in the robust subjects across different age groups (Supporting Information Fig. 4).
Also, we do not know whether the morphological change in the brain is reversible or not. However, evidence is emerging that frailty is a dynamic process and there exists opportunity to prevent it [Gill et al., 2006]. Balance training can promote plasticity and increase GMV of the cerebellum [Sehm et al., 2014]. Exercise interventions have been found to improve the mobility and functional ability of the frail elderly [de Vries et al., 2012; Theou et al., 2011]. In this view, the neural basis of frailty found here warrants further longitudinal studies to validate it as a clinical marker for monitoring the clinical course, predicting the prognosis, and evaluating the effect of intervention against frailty.
CONCLUSION
Our results support physical frailty as a syndrome associated not only with reduced physiological reserve but also with the brain. The GMV changes involve the cerebellum and many other brain regions closely linked to the pathophysiological and functional significance of physical frailty. Further longitudinal cohort studies are needed to investigate the contribution of these neural‐based mechanisms to the evolution of frailty.
Supporting information
Supporting Information Figure 1
Supporting Information Figure 2
Supporting Information Figure 3
Supporting Information Figure 4
REFERENCES
- Al‐Afif S, Staden M, Krauss JK, Schwabe K, Hermann EJ (2013): Splitting of the cerebellar vermis in juvenile rats–effects on social behavior, vocalization and motor activity. Behav Brain Res 250:293–298. [DOI] [PubMed] [Google Scholar]
- Amboni M, Barone P, Hausdorff JM (2013): Cognitive contributions to gait and falls: Evidence and implications. Mov Disord 28:1520–1533. [DOI] [PMC free article] [PubMed] [Google Scholar]
- Andreasen AK, Jakobsen J, Soerensen L, Andersen H, Petersen T, Bjarkam CR, Ahdidan J (2010): Regional brain atrophy in primary fatigued patients with multiple sclerosis. Neuroimage 50:608–615. [DOI] [PubMed] [Google Scholar]
- Aranda MP, Ray LA, Snih SA, Ottenbacher KJ, Markides KS (2011): The protective effect of neighborhood composition on increasing frailty among older Mexican Americans: A barrio advantage? J Aging Health 23:1189–1217. [DOI] [PMC free article] [PubMed] [Google Scholar]
- Ashburner J (2007): A fast diffeomorphic image registration algorithm. Neuroimage 38:95–113. [DOI] [PubMed] [Google Scholar]
- Ashburner J, Friston KJ (2000): Voxel‐based morphometry—The methods. Neuroimage 11:805–821. [DOI] [PubMed] [Google Scholar]
- Attaix D, Mosoni L, Dardevet D, Combaret L, Mirand PP, Grizard J (2005): Altered responses in skeletal muscle protein turnover during aging in anabolic and catabolic periods. Int J Biochem Cell Biol 37:1962–1973. [DOI] [PubMed] [Google Scholar]
- Bandeen‐Roche K, Xue QL, Ferrucci L, Walston J, Guralnik JM, Chaves P, Zeger SL, Fried LP (2006): Phenotype of frailty: Characterization in the women's health and aging studies. J Gerontol A Biol Sci Med Sci 61:262–266. [DOI] [PubMed] [Google Scholar]
- Bezzola L, Merillat S, Gaser C, Jancke L (2011): Training‐induced neural plasticity in golf novices. J Neurosci 31:12444–12448. [DOI] [PMC free article] [PubMed] [Google Scholar]
- Buchman AS, Schneider JA, Leurgans S, Bennett DA (2008): Physical frailty in older persons is associated with Alzheimer disease pathology. Neurology 71:499–504. [DOI] [PMC free article] [PubMed] [Google Scholar]
- Charlson ME, Pompei P, Ales KL, MacKenzie CR (1987): A new method of classifying prognostic comorbidity in longitudinal studies: Development and validation. J Chronic Dis 40:373–383. [DOI] [PubMed] [Google Scholar]
- Clegg A, Young J, Iliffe S, Rikkert MO, Rockwood K (2013): Frailty in elderly people. Lancet 381:752–762. [DOI] [PMC free article] [PubMed] [Google Scholar]
- De Smet HJ, Paquier P, Verhoeven J, Marien P (2013): The cerebellum: Its role in language and related cognitive and affective functions. Brain Lang 127:334–342. [DOI] [PubMed] [Google Scholar]
- de Vries NM, van Ravensberg CD, Hobbelen JS, Olde Rikkert MG, Staal JB, Nijhuis‐van der Sanden MW (2012): Effects of physical exercise therapy on mobility, physical functioning, physical activity and quality of life in community‐dwelling older adults with impaired mobility, physical disability and/or multi‐morbidity: A meta‐analysis. Ageing Res Rev 11:136–149. [DOI] [PubMed] [Google Scholar]
- Doba N, Tokuda Y, Goldstein NE, Kushiro T, Hinohara S (2012): A pilot trial to predict frailty syndrome: The Japanese Health Research Volunteer Study. Exp Gerontol 47:638–643. [DOI] [PubMed] [Google Scholar]
- Folstein MF, Folstein SE, McHugh PR. (1975): “Mini‐mental state”. A practical method for grading the cognitive state of patients for the clinician. J Psychiatr Res 12:189–198. [DOI] [PubMed] [Google Scholar]
- Fried LP, Tangen CM, Walston J, Newman AB, Hirsch C, Gottdiener J, Seeman T, Tracy R, Kop WJ, Burke G, McBurnie MA, Cardiovascular Health Study Collaborative Research Group (2001): Frailty in older adults: Evidence for a phenotype. J Gerontol A Biol Sci Med Sci 56:M146–M156. [DOI] [PubMed] [Google Scholar]
- Fukuyama H, Ouchi Y, Matsuzaki S, Nagahama Y, Yamauchi H, Ogawa M, Kimura J, Shibasaki H (1997): Brain functional activity during gait in normal subjects: A SPECT study. Neurosci Lett 228:183–186. [DOI] [PubMed] [Google Scholar]
- Gill TM, Gahbauer EA, Allore HG, Han L (2006): Transitions between frailty states among community‐living older persons. Arch Intern Med 166:418–423. [DOI] [PubMed] [Google Scholar]
- Gill TM, Gahbauer EA, Han L, Allore HG (2010): Trajectories of disability in the last year of life. N Engl J Med 362:1173–1180. [DOI] [PMC free article] [PubMed] [Google Scholar]
- Gupta A, Mayer EA, Sanmiguel CP, Van Horn JD, Woodworth D, Ellingson BM, Fling C, Love A, Tillisch K, Labus JS (2015): Patterns of brain structural connectivity differentiate normal weight from overweight subjects. Neuroimage Clin 7:506–517. [DOI] [PMC free article] [PubMed] [Google Scholar]
- Johnson SC (1967): Hierarchical clustering schemes. Psychometrika 32:241–254. [DOI] [PubMed] [Google Scholar]
- Le Heron CJ, Wright SL, Melzer TR, Myall DJ, Macaskill MR, Livingston L, Keenan RJ, Watts R, Dalrymple‐Alford JC, Anderson TJ (2014): Comparing cerebral perfusion in Alzheimer's disease and Parkinson's disease dementia: An ASL‐MRI study. J Cereb Blood Flow Metab 34:964–970. [DOI] [PMC free article] [PubMed] [Google Scholar]
- Lee WJ, Liu LK, Peng LN, Lin MH, Chen LK, Group IR (2013): Comparisons of sarcopenia defined by IWGS and EWGSOP criteria among older people: Results from the I‐Lan longitudinal aging study. J Am Med Dir Assoc 14:528 e521–e527. [DOI] [PubMed] [Google Scholar]
- Liou YM, Jwo CJ, Yao KG, Chiang LC, Huang LH (2008): Selection of appropriate Chinese terms to represent intensity and types of physical activity terms for use in the Taiwan version of IPAQ. J Nurs Res 16:252–263. [DOI] [PubMed] [Google Scholar]
- Liu‐Ambrose TY, Nagamatsu LS, Handy TC, Leghari A (2008): Does impaired cerebellar function contribute to risk of falls in seniors? A pilot study using functional magnetic resonance imaging. J Am Geriatr Soc 56:2153–2155. [DOI] [PubMed] [Google Scholar]
- Marques EL, Halpern A, Corrêa Mancini M, de Melo ME, Horie NC, Buchpiguel CA, Martins Novaes Coutinho A, Ono CR, Prando S, Santo MA, Cunha‐Neto E, Fuentes D, Cercato C (2014): Changes in neuropsychological tests and brain metabolism after bariatric surgery. J Clin Endocrinol Metab 99:E2347–2352. [DOI] [PubMed] [Google Scholar]
- Mayeux R (2010): Clinical practice. Early Alzheimer's disease. N Engl J Med 362:2194–2201. [DOI] [PubMed] [Google Scholar]
- McFadden KL, Cornier MA, Melanson EL, Bechtell JL, Tregellas JR (2013): Effects of exercise on resting‐state default mode and salience network activity in overweight/obese adults. Neuroreport 24:866–871. [DOI] [PMC free article] [PubMed] [Google Scholar]
- Nadkarni NK, Nunley KA, Aizenstein H, Harris TB, Yaffe K, Satterfield S, Newman AB, Rosano C, Health ABC Study (2014): Association between cerebellar gray matter volumes, gait speed, and information‐processing ability in older adults enrolled in the health ABC Study. J Gerontol A Biol Sci Med Sci 69:996–1003. [DOI] [PMC free article] [PubMed] [Google Scholar]
- Oldenburg HS, Rogy MA, Lazarus DD, Van Zee KJ, Keeler BP, Chizzonite RA, Lowry SF, Moldawer LL (1993): Cachexia and the acute‐phase protein response in inflammation are regulated by interleukin‐6. Eur J Immunol 23:1889–1894. [DOI] [PubMed] [Google Scholar]
- Orme JG, Reis J, Herz EJ (1986): Factorial and discriminant validity of the Center for Epidemiological Studies Depression (CES‐D) scale. J Clin Psychol 42:28–33. [DOI] [PubMed] [Google Scholar]
- Palm WM, Saczynski JS, van der Grond J, Sigurdsson S, Kjartansson O, Jonsson PV, Eiriksdottir G, Gudnason V, Admiraal‐Behloul F, Launer LJ, van Buchem MA, Age, Gene/Environment Susceptibility‐Reykjavik Study (2009): Ventricular dilation: Association with gait and cognition. Ann Neurol 66:485–493. [DOI] [PMC free article] [PubMed] [Google Scholar]
- Pavese N, Metta V, Bose SK, Chaudhuri KR, Brooks DJ (2010): Fatigue in Parkinson's disease is linked to striatal and limbic serotonergic dysfunction. Brain 133:3434–3443. [DOI] [PubMed] [Google Scholar]
- Pellicano C, Gallo A, Li X, Ikonomidou VN, Evangelou IE, Ohayon JM, Stern SK, Ehrmantraut M, Cantor F, McFarland HF, Bagnato F (2010): Relationship of cortical atrophy to fatigue in patients with multiple sclerosis. Arch Neurol 67:447–453. [DOI] [PubMed] [Google Scholar]
- Puri BK, Jakeman PM, Agour M, Gunatilake KD, Fernando KA, Gurusinghe AI, Treasaden IH, Waldman AD, Gishen P (2012): Regional grey and white matter volumetric changes in myalgic encephalomyelitis (chronic fatigue syndrome): A voxel‐based morphometry 3 T MRI study. Br J Radiol 85:e270–e273. [DOI] [PMC free article] [PubMed] [Google Scholar]
- Qu NN, Li KJ (2004): Study on the reliability and validity of international physical activity questionnaire (Chinese Vision, IPAQ). Zhonghua Liu Xing Bing Xue Za Zhi 25:265–268. [PubMed] [Google Scholar]
- Radloff LS (1977): The CES‐D Scale: A self‐report depression scale for research in the general population. Appl Psychol Meas 1:385–401. [Google Scholar]
- Raji MA, Al Snih S, Ostir GV, Markides KS Ottenbacher KJ (2010): Cognitive status and future risk of frailty in older Mexican Americans. J Gerontol A Biol Sci Med Sci 65:1228–1234. [DOI] [PMC free article] [PubMed] [Google Scholar]
- Robertson DA, Savva GM, Kenny RA (2013): Frailty and cognitive impairment—A review of the evidence and causal mechanisms. Ageing Res Rev 12:840–851. [DOI] [PubMed] [Google Scholar]
- Rosano C, Sigurdsson S, Siggeirsdottir K, Phillips CL, Garcia M, Jonsson PV, Eiriksdottir G, Newman AB, Harris TB, van Buchem MA, Gudnason V, Launer LJ (2010): Magnetization transfer imaging, white matter hyperintensities, brain atrophy and slower gait in older men and women. Neurobiol Aging 31:1197–1204. [DOI] [PMC free article] [PubMed] [Google Scholar]
- Rosano C, Studenski SA, Aizenstein HJ, Boudreau RM, Longstreth WT Jr, Newman AB (2012): Slower gait, slower information processing and smaller prefrontal area in older adults. Age Ageing 41:58–64. [DOI] [PMC free article] [PubMed] [Google Scholar]
- Ryberg C, Rostrup E, Stegmann MB, Barkhof F, Scheltens P, van Straaten EC, Fazekas F, Schmidt R, Ferro JM, Baezner H, Erkinjuntti T, Jokinen H, Wahlund LO, O'brien J, Basile AM, Pantoni L, Inzitari D, Waldemar G, LADIS study group (2007): Clinical significance of corpus callosum atrophy in a mixed elderly population. Neurobiol Aging 28:955–963. [DOI] [PubMed] [Google Scholar]
- Schaap LA, Pluijm SM, Deeg DJ, Visser M (2006): Inflammatory markers and loss of muscle mass (sarcopenia) and strength. Am J Med 119:526 e529517 [DOI] [PubMed] [Google Scholar]
- Schmidt P, Gaser C, Arsic M, Buck D, Förschler A, Berthele A, Hoshi M, Ilg R, Schmid VJ, Zimmer C, Hemmer B, Mühlau M (2012): An automated tool for detection of FLAIR‐hyperintense white‐matter lesions in multiple sclerosis. Neuroimage 59:3774–3783. [DOI] [PubMed] [Google Scholar]
- Schmitz C, Jenmalm P, Ehrsson HH, Forssberg H (2005): Brain activity during predictable and unpredictable weight changes when lifting objects. J Neurophysiol 93:1498–1509. [DOI] [PubMed] [Google Scholar]
- Sehm B, Taubert M, Conde V, Weise D, Classen J, Dukart J, Draganski B, Villringer A, Ragert P (2014): Structural brain plasticity in Parkinson's disease induced by balance training. Neurobiol Aging 35:232–239. [DOI] [PubMed] [Google Scholar]
- Shibasaki H, Fukuyama H, Hanakawa T (2004): Neural control mechanisms for normal versus Parkinsonian gait. Prog Brain Res 143:199–205. [DOI] [PubMed] [Google Scholar]
- Stoodley CJ, Schmahmann JD (2010): Evidence for topographic organization in the cerebellum of motor control versus cognitive and affective processing. Cortex 46:831–844. [DOI] [PMC free article] [PubMed] [Google Scholar]
- Theou O, Stathokostas L, Roland KP, Jakobi JM, Patterson C, Vandervoort AA, Jones GR (2011): The effectiveness of exercise interventions for the management of frailty: A systematic review. J Aging Res 2011:569194 [DOI] [PMC free article] [PubMed] [Google Scholar]
- Wasson P, Prodoehl J, Coombes SA, Corcos DM, Vaillancourt DE (2010): Predicting grip force amplitude involves circuits in the anterior basal ganglia. Neuroimage 49:3230–3238. [DOI] [PMC free article] [PubMed] [Google Scholar]
- Xue QL, Bandeen‐Roche K, Varadhan R, Zhou J, Fried LP (2008): Initial manifestations of frailty criteria and the development of frailty phenotype in the Women's Health and Aging Study II. J Gerontol A Biol Sci Med Sci 63:984–990. [DOI] [PubMed] [Google Scholar]
- Yang FC, Chou KH, Fuh JL, Huang CC, Lirng JF, Lin YY, Lin CP, Wang SJ (2013): Altered gray matter volume in the frontal pain modulation network in patients with cluster headache. Pain 154:801–807. [DOI] [PubMed] [Google Scholar]
- Zaki J, Davis JI, Ochsner KN (2012): Overlapping activity in anterior insula during interoception and emotional experience. Neuroimage 62:493–499. [DOI] [PMC free article] [PubMed] [Google Scholar]
- Ziegler G, Dahnke R, Jancke L, Yotter RA, May A, Gaser C (2012): Brain structural trajectories over the adult lifespan. Hum Brain Mapp 33:2377–2389. [DOI] [PMC free article] [PubMed] [Google Scholar]
Associated Data
This section collects any data citations, data availability statements, or supplementary materials included in this article.
Supplementary Materials
Supporting Information Figure 1
Supporting Information Figure 2
Supporting Information Figure 3
Supporting Information Figure 4