

Abstract
This study addresses the controversy over how motor maps are organized during action simulation by examining whether action simulation states, that is, motor imagery and action observation, run on either effector‐specific and/or action‐specific motor maps. Subjects had to observe or imagine three types of movements effected by the right hand or the right foot with different action goals. The functional magnetic resonance imaging results showed an action‐specific organization within premotor and posterior parietal areas of both hemispheres during action simulation, especially during action observation. There were also less pronounced effector‐specific activation sites during both simulation processes. It is concluded that the premotor and parietal areas contain multiple motor maps rather than a single, continuous map of the body. The forms of simulation (observation, imagery), the task contexts (movements related to an object, with usual/unusual effector), and the underlying reason for performing the simulation (rate your subjective success afterwards) lead to the specific use of different representational motor maps within both regions. In our experimental setting, action‐specific maps are dominant especially, during action observation, whereas effector‐specific maps are recruited to only a lesser degree. Hum Brain Mapp 35:1212–1225, 2014. © 2012 Wiley Periodicals, Inc.
Keywords: fMRI, motor simulation, action observation, motor imagery, action mapping, somatotopic mapping
INTRODUCTION
How actions are represented during action simulation is an intensely debated issue in the field of cognitive neuroscience. Although the underlying brain mechanisms for simulating body movements are considered to be based on motor representations within the core and broader motor system, the organization of the motor maps within these areas remains controversial [Aziz‐Zadeh et al., 2006; Buccino et al., 2002; Ehrsson et al., 2005; Filimon et al., 1999; Gazzola and Keysers, 2007; Hauk et al., 2010; Stippich et al., 2002; Wheaton et al., 2004; Wolfensteller et al., 2007; see, for a review, Fernandino and Iacoboni, 2007].
Up to now, many studies have delivered evidence for an effector‐specific somatotopic motor mapping during action simulation [action observation, motor imagery (MI)] within the premotor cortex (PMC), the primary motor cortex (M1), as well as posterior parietal regions [inferior parietal lobe (IPL); superior parietal lobe (SPL); Buccino et al., 2002; Ehrsson et al., 2005; Jastorff et al., 2001; Sakreida et al., 2003; Stippich et al., 2002; Wheaton et al., 2004]. For example, Buccino et al. 2002 conducted an functional magnetic resonance imaging (fMRI) study in which subjects observed transitive and intransitive actions performed by different effectors (hand, leg, and mouth). Their results revealed an effector‐specific mapping in the ventral and dorsal PMC as well as within the posterior parietal cortex of both hemispheres. Wheaton et al. 2004 also investigated motor maps in the premotor area during the observation of meaningless rhythmic actions, and found an effector‐specific somatotopic organization restricted to the right ventral PMC. In addition, Ehrsson et al. 2005 examined the MI of extension–flexion movements with different effectors (tongue, hand, and leg) and demonstrated that MI engages somatotopically organized maps within the M1, the supplementary motor area (SMA), and the PMC—especially of the contralateral hemisphere. Thus, these studies imply that actions relying on specific effectors are represented separately in a somatotopic effector‐specific manner within both the M1 and the PMC.
However, back in 1999, Rintjes et al. already proposed another form of action mapping that is more effector independent. Their study demonstrated that signing one's name with the hand is associated with activation of the same premotor regions as signing one's name with the foot. This suggests that there might be a special map for actions leading to a comparable consequence. Aziz‐Zadeh et al. 2006 also demonstrated overlapping activations for different effectors (mouth, foot, and hand) within the pars opercularis of the inferior frontal gyrus and the ventral precentral gyrus. Moreover, several studies have demonstrated a functional, motor‐act‐dependent organization of posterior parietal areas during action observation and motor planning processes [Heed et al., 2012; Jastorff et al., 2001]. All these findings strongly support the notion that action observation in particular might also depend on an action‐specific mapping with maps that are related to the action idea and its consequences rather than to the effector performing the action [Zentgraf et al., 2011].
Hence, any conclusion that the organization of frontal and parietal motor areas is purely effector‐specific or purely action‐specific may be false. Other, more complex or weighted organizational principles may be effective within these areas during action simulation processes—that is, during MI and action observation. Indeed, existing studies support the hypothesis that action simulation processes might use several representational action maps [see, for a review, Fernandino and Iacoboni, 2007].
Therefore, this study investigated whether MIagery and action observation are related to one or more different motor maps within both the PMC and posterior parietal areas (dPMC, vPMC, SMA, IPL, and SPL). Both action simulation states were examined within the same experiment. We applied a design in which three motor tasks had to be performed with two different effectors (hand vs. foot), and we asked subjects to either observe or imagine these motor acts. The three motor acts were a force production task (squeezing), an aiming task (aiming), and a rhythmic extension–flexion movement. Because the chosen tasks lead to different goals, we assume that action‐specific motor mapping will be seen. Our main aim was to elucidate whether both action simulation states run on either action‐specific or effector‐specific motor maps on the group as well as on the single‐subject level.
MATERIALS AND METHODS
Subjects
Eighteen right‐handed and right‐footed volunteers (nine female, mean age = 26 years, SD = 2.7) with normal or corrected‐to‐normal vision participated in this experiment. To verify handedness and footedness, all subjects had to complete the Edinburgh Handedness Inventory [Oldfield, 2001] as well as the revised version of the Waterloo Footedness Questionnaire [Elias et al., 2010]. Imagery ability was assessed with the Movement Imagery Questionnaire [Hall and Martin, 2004]. Average scores ranged from 1.19 to 3.31 (M = 2.02, SD = 0.55) on a scale from very easy to imagine (1) to very difficult to imagine (7), indicating that all subjects had good to very good imagery abilities. They reported no history of psychiatric or neurological disorders, and no history or current use of any psychoactive medication. The study was approved by the local ethics committee of Department Psychology and Sport Science of the Justus Liebig University Giessen, and all subjects gave their informed written consent in accordance with the Declaration of Helsinki. The study took place at the Bender Institute of Neuroimaging (Justus Liebig University).
Design and Stimulus Material
The experiment contained a total of 13 conditions. These were six imagery conditions, six observation conditions, and one rest condition. The same unilateral hand and unilateral foot movements were used for observation and imagery. Before the fMRI experimental phase, subjects learned to perform all conditions correctly in a training session that was also used to record electromyogram (EMG; see, for details, Training session section).
The stimulus material for the observation condition consisted of six 5‐s video sequences of hand and foot movements performed by male and female actors. Every video sequence depicted a hand or a foot as well as a blue bellows to make stimuli comparable between all conditions and to ensure that they differed only with respect to the movement and to the effector (Fig. 1). The hand stimuli showed the hand of the male or the female actor from a first‐person perspective performing either a force production task squeezing the bellows, an aiming task pointing with the index finger at five targets affixed to the bellows, or an extension–flexion movement with the right hand (i.e., the fingers) alongside the bellows. The aiming task required no memorizing of a special sequence of the targets, because subjects were instructed to simply point to the five affixed targets one after another. The foot stimuli showed a model from the first‐person perspective performing either a force production task squeezing the same bellows with the foot, an aiming task pointing with the big toe at five targets affixed to the bellows, or an extension–flexion movement with the right foot (i.e., the toes) alongside the bellows. For standardization purposes, all movements were paced at a frequency of 1 Hz. In the imagery conditions, subjects imagined the same six motor tasks.
Figure 1.
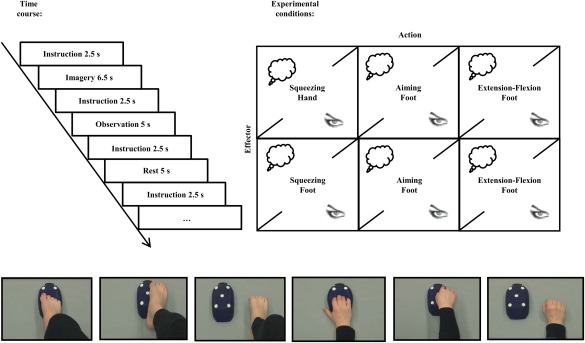
Temporal structure of the experiment and experimental conditions. [Color figure can be viewed in the online issue, which is available at http://wileyonlinelibrary.com.]
All video stimuli were presented by a posterior commissure (PC) running Presentation software (Neurobehavioral Systems, Albany) and projected onto a screen behind the scanner that could be viewed through a mirror attached to the head coil (visual field 188 mm in the horizontal and 168 mm in the vertical plane, rectangular aperture).
In total, subjects were scanned during the following 12 target conditions and the rest condition: (a) MI of a right‐hand squeezing task, (b) MI of a right‐foot squeezing task, (c) MI of a right‐hand aiming task, (d) MI of a right‐foot aiming task, (e) MI of a right‐hand extension–flexion movement, (f) MI of a right‐foot extension–flexion movement, (g) action observation of a right‐hand squeezing task, (h) action observation of a right‐foot squeezing task, (i) action observation of a right‐hand aiming task, (j) action observation of a right‐foot aiming task, (k) action observation of a right‐hand extension–flexion movement, (l) action observation of a right‐foot extension–flexion movement, and (m) the rest condition. In each condition, the movements were either imagined or observed. In the imagery condition, subjects closed their eyes during imagery. In the rest condition, subjects also closed their eyes in a baseline resting state.
All conditions were presented in a pseudorandomized order, counterbalanced across subjects. Each trial started with an instruction (“Imagine/Observe Squeezing Hand/Foot, Imagine/Observe Aiming Hand/Foot, Imagine/Observe Rhythmic Movement Hand/Foot” or “Close your eyes and rest”). Instruction presentation was followed by the respective imagery, observation, or rest phase. During imagery and rest, subjects kept their eyes closed, reopening them only when imagery and the rest phase were finished. Eye closure and opening were controlled with a video camera. After each imagery, observation, or rest trial, a sound signaled the end of a trial and that subjects could open their eyes again.
Each instruction was presented for 2.5 s. After a short delay (1 s), the video clip was presented for 5 s in the observation conditions. In the imagery conditions, the imagery phase started after a short delay (1 s) and lasted for 6.5 s. The next trial started after 1 s ± jitter (Fig. 1).
Altogether, subjects performed 260 trials (2[Simulation state: imagery vs. observation] × 2[Effector: hand vs. foot] × 3[Action: squeezing vs. aiming vs. extension–flexion] × 20replications + 20 × resting phase) during a total scanning time of approximately 52 min. After the fMRI phase, subjects were asked to rate the quality of their performance in each condition on a 7‐point scale ranging from very high (7) to very low (1). This rating tapped the mean performance impression over all trials per condition.
Training Session
Before the fMRI experiment, subjects attended a training session to familiarize themselves with the different experimental conditions and the experimental setting. After completing the Edinburgh Handedness Inventory [Oldfield, 2001], the revised version of the Waterloo Footedness Questionnaire [Elias et al., 2010], and the Movement Imagery Questionnaire [Hall and Martin, 2004], they were trained to imagine the different hand and foot movements (see Design and Stimulus Material). First, they observed and executed these movements. The training tasks were the same as in the fMRI experiment. For the imagery tasks, they had to report the beginning and the end of each imagery phase by giving a sign with their left hand. This served as a signal for the experimenter to control for imagery duration, which should be about the same as the execution duration. After each training trial, subjects rated the quality of each experimental trial on a 7‐point scale ranging from very high (7) to very low (1). While performing the tasks, surface EMG (Noraxon, Cologne, Germany) was recorded as a sum potential from several target muscles of the right forearm and the right foot (forearm: M. extensor carpi radialis, M. extensor carpi ulnaris, M. flexor carpi radialis, M. flexor carpi ulnaris; foot: M. extensor digitorum longus, M. extensor hallucis longus, M. flexor digitorum, M. flexor hallucis brevis) to ensure that subjects did not contract the respective muscles during imagery and observation. The EMG signals were stored and displayed online as visual feedback for the experimenter. If subjects showed increased EMG activity during imagery, observation, and rest, they received tactile feedback from the experimenter. The training session lasted a total of 60 min.
Data Acquisition and Preprocessing
The fMRI data were collected on a 1.5‐T whole‐body scanner (Siemens Symphony, Erlangen, Germany) with a standard head coil. Structural image acquisition consisted of 160 T1‐weighted sagittal images (1‐mm slice thickness).
For the run of functional imaging, a total of 1,350 volumes were registered using a T2*‐weighted gradient echo‐planar imaging sequence with 25 slices covering the whole brain (slice thickness = 5 mm; 1 mm gap, interleaved; time of acquisition = 2.4 s; time of repetition (TR) = 2.5 s; time of echo = 55 ms, flip angle = 90°; field of view = 192 mm × 192 mm; matrix size = 64 × 64). The orientation of the axial slices was parallel to the anterior commissure (AC)–PC line. Trial onsets were jittered within a range of ±1/2TR.
Image preprocessing was carried out using statistical parametric mapping SPM 8 (Wellcome Department of Imaging Neuroscience, London, UK). The correlation between head motion in the scanner and the experimental conditions ranged from cos φ = 0.0734 to 0.2536. Therefore, the head motion parameter did not correlate significantly with the experimental conditions. Origin coordinates were adjusted to the AC. Furthermore, slice time correction, realignment (sinc interpolation), and unwarping were performed along with normalization to the standard space of the Montreal Neurological Institute brain (MNI brain). Smoothing was executed with an isotropic three‐dimensional Gaussian filter with a full‐width‐at‐half‐maximum (FWHM) kernel of 9 mm.
A first‐level analysis was computed subjectwise using the general linear model (GLM). A boxcar function was convoluted with the hemodynamic response function. Boxcar function length covered the imagery and observation interval of each condition as well as the rest period. Moreover, six movement parameters of the rigid‐body transformation of the motion‐correction procedure were introduced into the GLM as covariates. The voxel‐based time series were filtered by a low‐pass (FWHM = 4 s) and a high‐pass filter (time constant = 256 s). Twelve experimental conditions (imagery/observation of hand/foot movements) and the rest condition were entered into the model.
The second‐level analysis was performed with SPM 8. Several t contrasts were computed to test whether MI and action observation of movements with different effectors or different movement types were associated with effector‐specific somatotopic or action‐specifically organized activation maps within the premotor and posterior parietal areas. To define sections that were specific for a respective effector or for actions within the regions of interest (ROIs), we first contrasted the imagery of foot movements with hand movements and vice versa (Imagery Foot vs. Imagery Hand; Imagery Hand vs. Imagery Foot). In a next step, we contrasted the different movement types (Imagery Squeezing vs. [Imagery Aiming + Imagery Extension–Flexion]; Imagery Aiming vs. [Imagery Squeezing + Imagery Extension–Flexion]; Imagery Extension–Flexion vs. [Imagery Squeezing+ Imagery Aiming]). The same contrasts were calculated for action observation. To correct for false‐positive results, in a first step, a voxelwise t threshold was set at P = 0.01, uncorrected. A small‐volume correction was conducted with a priori search volumes. These ROIs were selected on the basis of previous findings reported in the literature [Buccino et al., 2002; Ehrsson et al., 2005; Grèzes and Decety, 2007; Heed et al., 2012; Jeannerod, 2010; Wheaton et al., 2004]. They were the different sections of the premotor area (dPMC, vPMC, preSMA, SMA proper) and of the posterior parietal area (IPL and SPL). All ROIs were defined with maps based on cytoarchitectonic data with 50% probability [Eickhoff et al., 1998]. Masks for small‐volume correction were created using FSL software [Smith et al., 2011], and significance was tested on the voxel level [P = 0.05, familywise error (FWE) corrected].
Single‐Subject Analysis
Recent studies have indicated that a group analysis might underestimate the selectivity of neighboring areas because of smoothing and averaging across subjects [Jastorff et al., 2002]. Normally, the smoothing procedure is used to improve the signal‐to‐noise ratio and to increase the sensitivity of the dataset. Furthermore, smoothing also improves the validity of statistical tests by making the error distribution more normal. However, as mentioned, a drawback of spatial smoothing is the reduction of spatial resolution of the data leading to a possible mislocalization of activation peaks. Therefore, we decided to report also unsmoothed data to describe the localization of the individual activation peaks more accurately. We investigated the unsmoothed data on the single‐subject level to detect action‐ and effector‐specific activation sites for each subject within the premotor and the posterior parietal region. This analysis used the following contrasts: Imagery Squeezing versus (Imagery Aiming + Imagery Extension–Flexion); Imagery Aiming versus (Imagery Squeezing + Imagery Extension–Flexion); Imagery Extension–Flexion versus (Imagery Squeezing+ Imagery Aiming) for both effectors separately. The same contrasts were calculated for the observation conditions, again for both effectors. For the SPM T maps generated by these contrasts, the premotor area and the posterior parietal area were scanned for local maxima for each contrast and subject. The coordinates of these local maxima were plotted onto the human standard brain from FSL software [Smith et al., 2011] for each subject.
Behavioral Data Acquisition and Analysis
After each trial in the training session as well as after the fMRI session, subjects rated the success of each experimental trial on a 7‐point Likert scale. We calculated mean rating scores for each experimental condition, and computed a repeated measures analysis of variance (ANOVA) to examine the effects of the respective action simulation state (imagery, observation), the effector (hand, foot), and the respective action (aiming, squeezing, rhythmic extension–flexion) on each of these two subjective ratings (during training and after fMRI).
We analyzed EMG data collected in the training session by determining the area under the curve (duration of the averaged epoch: 5 s). These data were then averaged for each subject in each condition. The averaged data were subjected to multiple paired t tests comparing EMG activity for each imagery and observation condition with EMG activity in the rest condition. Because this was a multiple comparison procedure, we used the Bonferroni adjustment.
RESULTS
Subjective Ratings During Training
After each trial, subjects were asked to evaluate the quality of their imagery performance on a 7‐point scale ranging from very high (7) to very low (1). All subjects gave high ratings in all experimental conditions (mean ratings > 5.0). All means and standard deviations are reported in Table 1A. A repeated measures ANOVA revealed a significant main effect for the simulation state and the task, no main effect for the effector, and a significant interaction effect. Table 1B reports all ANOVA data for this analysis. Post hoc t tests revealed that subjects judged the imagery trials to be slightly more difficult than observation trials and the pointing task to be easier than the other tasks (Fig. 2).
Table 1.
Statistical data for the rating of imagery and observation performance during training: means and standard deviations (A); statistical data of the repeated measures ANOVA (B)
| (A) Condition | M | SD | ||
|---|---|---|---|---|
| Imagery | ||||
| Hand squeezing | 6.01 | 0.47 | ||
| Hand aiming | 6.27 | 0.61 | ||
| Hand extension–flexion | 5.89 | 0.53 | ||
| Foot squeezing | 6.04 | 0.59 | ||
| Foot aiming | 6.19 | 0.59 | ||
| Foot extension–flexion | 5.79 | 0.76 | ||
| Observation | ||||
| Hand squeezing | 6.63 | 0.45 | ||
| Hand aiming | 6.72 | 0.37 | ||
| Hand extension–flexion | 6.57 | 0.51 | ||
| Foot squeezing | 6.64 | 0.47 | ||
| Foot aiming | 6.67 | 0.4 | ||
| Foot extension–flexion | 6.69 | 0.37 | ||
| Rest | 6.65 | 0.5 | ||
| (B) Effect | df | F | η2 | P |
| Simulation state | 1 | 30.795 | 0.672 | 0 |
| Effector | 1 | 0.089 | 0.005 | 0.769 |
| Task | 2 | 4.236 | 0.199 | 0.023 |
| Simulation state × effector | 1 | 0.954 | 0.053 | 0.342 |
| Simulation state × task | 2 | 3.768 | 0.181 | 0.033 |
| Effector × task | 2 | 0.364 | 0.021 | 0.698 |
| Simulation state × effector × task | 2 | 0.998 | 0.055 | 0.379 |
Figure 2.
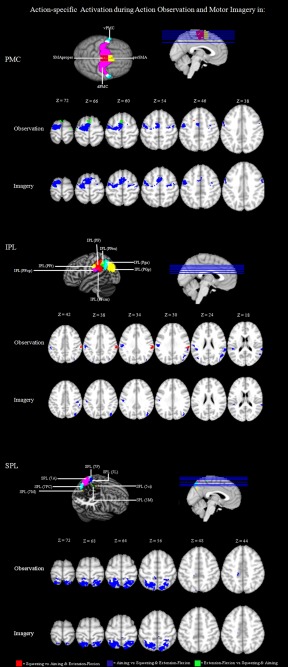
Action‐specific mapping in the PMC and the PPC: significantly activated voxels (P < 0.01 uncor.) of the within‐group comparisons Observation Squeezing versus (Observation Aiming + Observation Extension–Flexion); Observation Aiming versus (Observation Squeezing + Observation Extension–Flexion); Observation Extension–Flexion versus (Observation Squeezing + Observation Aiming); Imagery Squeezing versus (Imagery Aiming + Imagery Extension–Flexion); Imagery Aiming versus (Imagery Squeezing + Imagery Extension–Flexion); Imagery Extension–Flexion versus (Imagery Squeezing + Imagery Aiming).
Subjective Ratings After the fMRI Session
After the fMRI session, subjects were asked once again to evaluate the quality of their imagery performance on a 7‐point scale ranging from very high (7) to very low (1). All subjects gave high ratings in all experimental conditions (i.e., all mean rating values > 5.0; see Table 2A). A repeated measures ANOVA revealed a significant main effect of action state, no main effect of effector and task, and a significant interaction effect for simulation state and task. Table 2B reports all ANOVA data for this analysis. Post hoc t tests revealed that subjects judged the imagery trials to be slightly more difficult compared to observation trials (Fig. 2).
Table 2.
Statistical data for the rating of imagery and observation performance after fMRI: means and standard deviations (A); statistical data of the repeated measures ANOVA (B)
| (A) Condition | M | SD | ||
|---|---|---|---|---|
| Imagery | ||||
| Hand squeezing | 5.39 | 1.09 | ||
| Hand aiming | 6.33 | 0.91 | ||
| Hand extension–flexion | 5.44 | 1.29 | ||
| Foot squeezing | 5.44 | 1.19 | ||
| Foot aiming | 6.17 | 1.09 | ||
| Foot extension–flexion | 5.28 | 1.13 | ||
| Observation | ||||
| Hand squeezing | 6.39 | 0.85 | ||
| Hand aiming | 6.56 | 0.78 | ||
| Hand extension–flexion | 6.5 | 0.71 | ||
| Foot squeezing | 6.5 | 0.86 | ||
| Foot aiming | 6.56 | 0.62 | ||
| Foot extension–flexion | 6.5 | 0.71 | ||
| Rest | 6.61 | 0.85 | ||
| (B) Effect | df | F | η2 | P |
| Simulation state | 1 | 17.121 | 0.502 | 0.001 |
| Effector | 1 | 0.262 | 0.015 | 0.616 |
| Task | 2 | 3.323 | 0.16 | 0.052 |
| Simulation state × effector | 1 | 1.209 | 0.066 | 0.287 |
| Simulation state × task | 2 | 4.765 | 0.219 | 0.015 |
| Effector × task | 2 | 0.654 | 0.037 | 0.526 |
| Simulation state × effector × task | 2 | 0.1 | 0.006 | 0.905 |
EMG Data
Muscular activity during MI and action observation was controlled during the training session. Multiple pairwise t tests for each muscle and each imagery and observation condition revealed no significant differences (Bonferroni adjusted) compared to resting baseline (Supporting Information).
Neuroimaging Data
First, we tested for effector‐ and action‐specific mapping within the premotor area and the posterior parietal during imagery and observation of the hand and foot movements to examine the different concepts of motor mapping. In a second step, we investigated unsmoothed data on the single‐subject level to detect action‐ and effector‐specific activation sites.
Mapping of Actions?
Action observation
To detect whether hand and foot movements are mapped action‐specifically within the premotor area (preSMA, SMA proper, dPMC, vPMC) and the posterior parietal area (IPL, SPL), we contrasted the different action conditions for both simulation states (imagery and observation) to define action‐specific sections.
Calculating the above‐mentioned contrasts for action observation revealed clearly defined action‐specific sections associated specifically with aiming movements in an activation cluster that captured broad areas of the whole PMC within both hemispheres. More precisely, we found specific activation for aiming movements capturing the posterior parts of the preSMA, the adjoining SMA proper, as well as more posterior parts of the dPMC of both hemispheres and the vPMC of the left hemisphere. Regarding posterior parietal activation sites, we detected increased activation within the IPL and the SPL of both hemispheres. The activation cluster captured anterior sections of the IPL including areas PF, PFcm, PFop, PFt, PGp, and Pga. Within the SPL, the activation cluster captured the anterior and posterior areas of the SPL, that is, Areas 5Ci, 5L, 5M, 7A, 7PC, and 7P.
Looking at areas showing increased activation when subjects observed extension–flexion movements, we found activation clusters capturing the anterior part of the preSMA of both hemispheres as well as within the adjoining dorsal premotor area of the right hemisphere. In the parietal cortex, no activation cluster passed the threshold.
Furthermore, we found activation clusters for squeezing movements within the ventral section of the PMC of the left hemisphere that were more anterior than the activation cluster for the aiming movement (Fig. 2). Considering the parietal activation cluster, we found a prominent activation site within the IPL capturing the areas PF along with the adjacent areas PFcm and PFt that were more posterior than activation sites associated with precision movements. All results and the specific coordinates of the single activation clusters are summarized in Table 3.
Table 3.
Action‐specific brain activations for observation and imagery conditions
| Left/ right | Cluster size | Coordinates of max. | t Value | |||
|---|---|---|---|---|---|---|
| x | y | z | ||||
| Observation Squeezing vs. Observation Aiming and Extension–Flexion | ||||||
| vPMC | L | 6 | −15 | 11 | 49 | 3.49 |
| IPL (PF) | R | 35 | 60 | −31 | 34 | 5.18 |
| IPL (PFt) | R | 11 | 57 | −25 | 37 | 3.21 |
| Observation Aiming vs. Observation Squeezing and Extension–Flexion | ||||||
| SMA proper | L | 95 | −6 | −4 | 58 | 6.79 |
| SMA proper | R | 10 | 3 | −4 | 61 | 3.26a |
| preSMA | L | 37 | −6 | −1 | 55 | 5.60 |
| preSMA | R | 4 | 3 | −1 | 64 | 3.21a |
| dPMC | L | 304 | −24 | −7 | 67 | 8.64 |
| dPMC | R | 12 | 42 | −7 | 55 | 3.97a |
| vPMC | L | 50 | −42 | −7 | 46 | 5.83 |
| IPL (PF) | L | 21 | −54 | −31 | 43 | 4.86 |
| IPL (PF) | R | 52 | 60 | −37 | 25 | 4.40 |
| IPL (PFcm) | L | 36 | −45 | −34 | 19 | 4.91 |
| IPL (PFcm) | R | 4 | 54 | −37 | 22 | 4.01 |
| IPL (PFm) | R | 10 | 60 | −40 | 25 | 3.94 |
| IPL (PFop) | L | 21 | −48 | −25 | 28 | 4.42 |
| IPL (PFt) | L | 40 | −54 | −25 | 40 | 5.15 |
| IPL (PGp) | L | 4 | −27 | −85 | 40 | 4.13 |
| IPL (PGp) | R | 31 | 54 | −58 | 22 | 4.73 |
| IPL (Pga) | R | 14 | 57 | −58 | 19 | 3.98 |
| SPL (5L) | L | 31 | −24 | −46 | 64 | 7.93 |
| SPL (5L) | R | 43 | 21 | −52 | 61 | 6.92 |
| SPL (5M) | L | 6 | −6 | −43 | 55 | 3.49 |
| SPL (7A) | L | 270 | −24 | −55 | 61 | 13.47 |
| SPL (7A) | R | 138 | 18 | −61 | 55 | 7.78 |
| SPL (7PC) | L | 10 | −12 | −79 | 55 | 5.49 |
| SPL (7PC) | R | 84 | 18 | −67 | 58 | 5.79 |
| SPL (7P) | L | 14 | −33 | −49 | 58 | 11.68 |
| SPL (7P) | R | 43 | 27 | −49 | 55 | 7.16 |
| Observation Extension–Flexion vs. Observation Squeezing and Aiming | ||||||
| preSMA | L | 19 | −3 | 8 | 61 | 3.35 |
| preSMA | R | 12 | 6 | 8 | 70 | 3.59 |
| dPMC | R | 4 | 24 | −16 | 73 | 2.70a |
| Imagery Squeezing vs. Imagery Aiming and Extension–Flexion | ||||||
| No suprathreshold clusters in this contrast | ||||||
| Imagery Aiming vs. Imagery Squeezing and Extension–Flexion | ||||||
| SMA proper | L | 36 | −6 | −4 | 64 | 5.58 |
| SMA proper | R | 5 | 3 | −5 | 61 | 3.29a |
| preSMA | L | 85 | −6 | 2 | 55 | 6.35 |
| preSMA | R | 51 | 3 | 8 | 58 | 4.55 |
| dPMC | L | 285 | −12 | 2 | 64 | 7.33 |
| dMPC | R | 60 | 24 | −10 | 61 | 5.90 |
| vPMC | L | 54 | −57 | 5 | 31 | 5.57 |
| vPMC | R | 26 | 57 | 8 | 40 | 4.07 |
| IPL (PF) | R | 22 | 54 | −34 | 52 | 5.66 |
| IPL (PFcm) | L | 12 | −45 | −37 | 16 | 3.50 |
| IPL (PFm) | R | 42 | 48 | −46 | 52 | 4.22 |
| IPL (PFt) | L | 16 | −51 | −19 | 31 | 4.41 |
| IPL (PFt) | R | 19 | 51 | −31 | 49 | 6.17 |
| IPL (PGp) | R | 54 | 36 | −70 | 46 | 4.65 |
| SPL (5L) | L | 6 | −9 | −55 | 67 | 3.39 |
| SPL (5L) | R | 5 | 21 | −52 | 61 | 4.51 |
| SPL (7A) | L | 271 | −27 | −58 | 61 | 12.82 |
| SPL (7A) | R | 146 | 15 | −61 | 58 | 7.75 |
| SPL (7PC) | L | 10 | −9 | −70 | 58 | 5.30 |
| SPL (7PC) | R | 93 | 18 | −64 | 64 | 6.82 |
| SPL (7P) | L | 14 | −33 | −49 | 58 | 8.69 |
| SPL (7P) | R | 40 | 33 | −46 | 55 | 6.28 |
| Imagery Extension–Flexion vs. Imagery Squeezing and Aiming | ||||||
| No suprathreshold clusters in this contrast | ||||||
MNI coordinates; P < 0.05, FWE‐corrected ROI analysis.
*P < 0.01 uncor. wholehead analysis.
Motor imagery
There were also action‐specific activation sites when subjects performed MI. More precisely, we found aiming‐specific activation clusters within the more posterior section of the dorsal and ventral PMC and within the adjoining posterior parts of the preSMA and SMA proper of both hemispheres. Regarding posterior parietal activation sites, we detected increased activation within the IPL and the SPL of both hemispheres. The respective activation cluster captured broad sections of the IPL including Areas PF, PFcm, PFm, PFt, PGp, and Pga. Within the SPL, the activation cluster captured the anterior and posterior areas of the SPL, that is, Areas 5L, 5M, 7A, 7PC, and 7P.
For extension–flexion movements, we found a specific activation cluster capturing the left, more anterior section of the preSMA. For posterior parietal sections, we found no activation cluster passing the given threshold.
For MI, we did not find any activation sites within the premotor and the posterior parietal section specific for squeezing that passed the statistical threshold (Fig. 2). All results and the specific coordinates of the single activation clusters are summarized in Table 3.
Mapping of Effectors?
Action observation
To detect whether observation of hand and foot movements also showed an effector‐specific mapping within the premotor areas, we contrasted the specific effector conditions to define somatotopic sections. Calculating this contrast for action observation revealed activation of hand‐specific sections within the preSMA near the margio superior of the right hemisphere. Within the posterior parietal brain sections, no activation site passed the given threshold.
Looking at areas that have been associated specifically with observation of foot movements, there were activation clusters capturing the dPMC of the left hemisphere (Fig. 3). Regarding posterior parietal activation sites, foot‐specific activation clusters were detected within the IPL and the adjacent SPL of both hemispheres. More precisely, this activation cluster captured Areas PF, PFop, PFt, and PGp of the IPL as well as the anterior section of the SPL (Area 7A). All results and the specific coordinates of the single activation clusters are summarized in Table 4.
Figure 3.
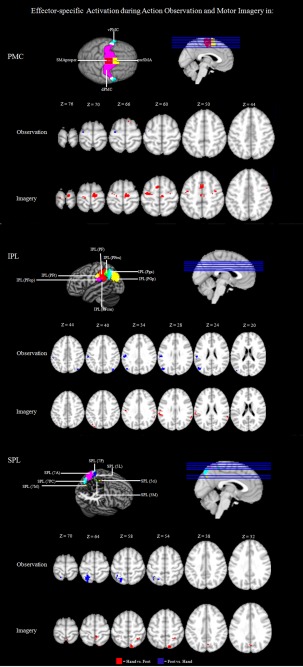
Effector‐specific mapping in the PMC and the PPC: Significantly activated voxels (P < 0.01 uncor.) of the within‐group comparisons Observation Hand > Observation Foot, Observation Foot > Observation Hand, Imagery Hand > Imagery Foot, and Imagery Foot > Imagery Hand.
Table 4.
Effector‐specific brain activations for observation and imagery conditions
| Left/right | Cluster size | Coordinates of max | z | |||
|---|---|---|---|---|---|---|
| x | y | t Value | ||||
| Observation Hand vs. Observation Foot | ||||||
| preSMA | R | 2 | 9 | 17 | 64 | 3.06a |
| Observation Foot vs. Observation Hand | ||||||
| dPMC | L | 3 | −27 | −13 | 64 | 2.69a |
| IPL (PF) | L | 10 | −57 | −28 | 40 | 4.14 |
| IPL (PFop) | L | 23 | −54 | −25 | 28 | 4.78 |
| IPL (PFt) | L | 34 | −54 | −25 | 37 | 4.73 |
| IPL (PGp) | L | 42 | −48 | −73 | 22 | 5.38 |
| IPL (PGp) | R | 18 | 42 | −76 | 43 | 3.55a |
| SPL (7A) | L | 71 | −24 | −55 | 64 | 4.99 |
| Imagery Hand vs. Imagery Foot | ||||||
| SMA proper | L | 15 | −6 | −22 | 52 | 3.29a |
| SMA proper | R | 61 | 9 | −19 | 70 | 4.39 |
| preSMA | L | 40 | −3 | 8 | 52 | 3.70 |
| preSMA | R | 20 | 3 | 11 | 49 | 3.13a |
| dPMC | L | 9 | −18 | −25 | 70 | 3.54a |
| dPMC | R | 16 | 30 | −13 | 55 | 4.26 |
| vPMC | L | 9 | −42 | −7 | 46 | 3.23 |
| IPL (PF) | L | 10 | −63 | −31 | 25 | 3.13* |
| IPL (PFm) | R | 13 | 60 | −46 | 31 | 3.00* |
| IPL (PFop) | L | 10 | −63 | −28 | 22 | 3.01 |
| IPL (PFt) | L | 6 | −51 | −19 | 34 | 3.19 |
| IPL (PFt) | R | 5 | 57 | −22 | 31 | 3.15 |
| IPL (PGp) | L | 7 | −30 | −85 | 40 | 2.91* |
| SPL (5M) | R | 11 | 6 | −43 | 64 | 3.41 |
| SPL (7M) | R | 5 | 6 | −67 | 37 | 2.80 |
| SPL (7PC) | R | 44 | 12 | −79 | 58 | 3.73 |
| SPL (7P) | R | 7 | 30 | −49 | 55 | 3.38 |
| Imagery Foot vs. Imagery Hand | ||||||
| No suprathreshold cluster for this contrast | ||||||
MNI coordinates; P < 0.05, FWE‐corrected ROI analysis.
P < 0.01 uncor. wholehead analysis.
Motor imagery
We also found effector‐specific activation sites for hand movements when subjects performed MI. The respective activations sites captured the dorsal PMC of both hemispheres and the ventral PMC of the left hemisphere as well as the adjoining preSMA and SMA proper of both hemispheres (Fig. 3). Regarding poster parietal activation sites, a broad activation cluster captured the IPL and the SPL of both hemispheres. This activation cluster included Areas PF, PFm, PFop, PFt, PGp, and Pga of the IPL and Areas 5L, 5M, 7M, 7PC, and 7P of the SPL (Fig. 3). For MI, however, we did not find any foot‐specific activation site within frontal motor areas. All results and the specific coordinates of the single activation clusters are summarized in Table 4.
Single‐Subject Data
Figure 4 depicts the activation peaks observed in individual subjects when comparing the different imagery and observation conditions. In this descriptive approach, we depict the peak t value for all subjects at the location of their peak voxel in the premotor as well as within the posterior parietal cortex. For all subjects, we inspected all the conditions on the single‐subject level presented in Figure 4. There were two main observations. First, we found that a minimum of 10 out of 18 subjects revealed an increased level of activity within the premotor region and a minimum of 16 out of 18 within the posterior parietal region (P < 0.05, uncorrected). More precisely, a minimum of 56% and a maximum of 94% (M = 71%) of the subjects revealed a significant activation within the premotor region and a minimum of 89% and a maximum of 100% of the subjects revealed a significant activation within the parietal region [probabilistic maps of the premotor and the posterior parietal region, Eickhoff et al., 1998] of either the left, right, or both hemispheres (Fig. 4). This rules out the possibility that the group finding results from a very few subjects exhibiting very strong effects within these areas [Friston et al., 1996]. Furthermore, an inspection of the subjects' individual activation maps revealed that activation peaks within the premotor and the parietal area of actions and effectors differed across individuals. This diversity in action and effector mapping explains why the group analysis sometimes revealed rather low activation peaks. However, an inspection of the single‐subject data revealed also that especially the aiming movement is associated with a more consistent activation pattern for all participants in the SPL. Thus, aiming movements seem to be represented more focused than other examined movements, especially within the parietal area.
Figure 4.
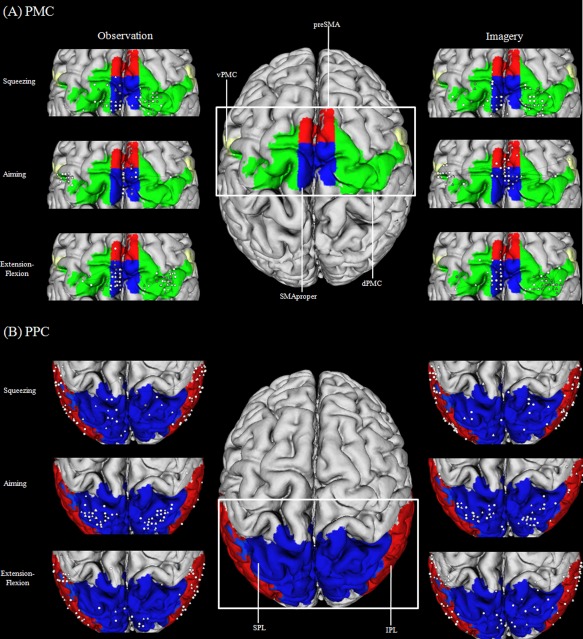
Illustration of the individual local maxima for hand and foot movements (squeezing, aiming, extension–flexion) in the PMC (A) and the PPC (B): triangles represent hand maxima, circles represent foot maxima. White indicates a t value above t = 1.96 and gray indicates a t value below t = 1.96.
One main conclusion of this analysis is that action‐ and effector‐specific activation sites exist within the ROIs. However, the activation overlap between the different subjects within both regions might be too small to observe significant activation peaks on the group level in every examined condition.
DISCUSSION
This study used fMRI to elucidate whether action simulation states, that is, MI and observation of different hand and foot movements, are associated with either an action‐specific or an effector‐specific activation pattern in the human premotor and posterior parietal cortex. The present data provided evidence for action‐specific activation within both regions, especially when observing hand and foot movements that differed with respect to their action goals. Furthermore, the present data also revealed effector‐specific activation sites within the premotor and the posterior parietal cortex for action observation. For MI, we observed only a hand‐specific activation site within the ROIs. We found no overlapping effector‐specific activation sites for MI and action observation. Our results suggest that the basic elements of functional organization in the premotor region and the posterior parietal cortex might be both action‐specific and effector‐specific [see, for a review, Fernandino and Iacoboni, 2007] also depending on the simulation task performed. The following sections will discuss these findings in more detail.
Premotor Cortex
Traditionally, the function of the premotor area is considered to be the preparation and organization of movements and actions [Wise, 1985]. Basic elements of functional organization in the PMC are motor acts, that is, movements with specific action goals. However, the same goal (e.g., grasping an object) can be achieved using different effectors and vice versa (e.g., pointing, squeezing, extension–flexion movements with the hand or the foot). During action simulation, especially during action observation of different action types, we found an action‐specific clustering responding to the simulated actions in the premotor region. More precisely, the specific cluster for squeezing movements was detected within the ventral section of the premotor region; the specific cluster for the extension–flexion movement was detected in the dorsal section of the PMC also spreading into the preSMA. Although the cluster predominately active during the simulation of aiming movements captured the broadest area of the PMC (dPMC, vPMC, SMA proper, and pre SMA), it was a more posterior sector of these areas that became active. These results are partly in line with data reported by Schubotz and von Cramon [2010, 2004, 2004] and Schubotz et al. 1985 who claimed that the dorsal PMC plays a role in spatial tasks and the ventral PMC plays a role in object‐related tasks.
There have been corresponding discussions in animal studies on whether the cortical motor system has evolved primarily for the organization of different actions rather than for movement control [Gallese et al., 2009; Graziano and Aflalo, 1997; Kohler et al., 1971; Rizzolatti et al., 2004; see, for a review, Fernandino and Iacoboni, 2007]. Looking at human data as in this study, Rintjes et al. 2002 also identified an effector‐independent activation map for actions leading to a comparable action consequence. Similarly, the results of this study showed effector‐independent activation sites for action simulation processes—that is, imagery and observation, of movements with the same goal. On a theoretical level, Schubotz 2002 and Schubotz and von Cramon 2004 have suggested a model supporting the notion that action maps in the context of action prediction tasks do not necessarily follow a somatotopic organization principle. This model associates the characteristic of a certain event, for example, an anticipated outcome of an action, with activation of the specific part of the PMC. It has been argued accordingly that the human PMC comprises an event‐related map rather than an effector‐related map for action prediction and especially for action prediction tasks [see, also, Wolfensteller et al., 2007].
A few neuroimaging studies have reported an effector‐specific mapping for the observation as well as for the imagery of motor acts within the premotor area [Buccino et al., 2002; Ehrsson et al., 2005; Jastorff et al., 2001; Sakreida et al., 2003; Stippich et al., 2002; Wheaton et al., 2004]—another very important organization form of motor maps. The data in the present design demonstrated, especially when considering the observation of movements performed with the hand or with the foot, that more medial parts of the premotor area represent hand movements. This is partly in line with the dorsal to ventral gradient for foot and hand movements reported by Graziano et al. 2001. However, effector specificity is less pronounced than in other studies, because we found no overlapping effector‐specific activation sites for observation and imagery and no foot‐specific activation site while subjects were imagining the respective movements.
With respect to the present and earlier findings, it seems reasonable to conceive of multiple motor maps lying in the PMC rather than of one single, continuous map of the human body. It might be also argued that the premotor regions contain a mixture of functional segregation and functional overlap [Schubotz et al., 1985]. Thus, different premotor regions contribute in a weighted fashion to different functional requirements of different tasks rather than being exclusive to one task. Additionally, different task contexts of simulation as well as the underlying reason for performing the simulation might lead to the usage of different representational motor maps within the premotor region [Schubotz, 2002; Schubotz and von Cramon, 2004; see, for a review, Fernandino and Iacoboni, 2007].
Posterior Parietal Cortex
A broad body of literature suggests that posterior parietal areas are strongly activated during actions that involve an object or are goal directed [e.g., Binkofski et al., 2001]. Similar to the findings for the premotor area, this study demonstrates an action‐specific clustering for this ROI during action observation for the squeezing and aiming movement. Thus, a spatially segregated activation clustering was found for the different movement types, especially when these movements involve an object. The specific cluster for the observation of squeezing movements lay in the IPL (PF, PFcm, and PFt). The cluster that was predominately active during the simulation of aiming movements (observation and imagery) captured broad sections of the inferior and superior lobe of the PPC. However, compared to the squeezing movement, the cluster captured a more posterior section of posterior parietal areas. For the observation and imagery of extension–flexion movement, we did not find any activation cluster that passed the threshold. One reason might be the fact that the extension–flexion movement was intransitive and involved no object manipulation [Buccino et al., 2002].
Thus, we observed that one mapping principle for posterior parietal areas is based on the functional meaning of actions: motor acts with similar goals activate similar anatomical regions regardless of which effector performs them. Jastorff et al. 2001 have reported a similar result for the IPL. They found that the observation of different types of hand motor acts produced a spatially segregated activation pattern in this area: the observation of motor acts with similar goals activated the same anatomical sectors regardless of the effector performing them. Similarly, Heed et al. 2012, for example, have inferred that posterior parietal regions follow functional rather than effector‐specific organization principles.
However, the present data also demonstrate an effector‐selective mapping within posterior parietal areas that is less pronounced than the action‐selective maps. For example, during imagery, hand movements were associated with an activation cluster lying in the IPL spreading into the more medial and posterior section of the SPL. And the observation of foot movements activated more anterior sections of the IPL and SPL. This kind of segregation is in line with another common view in the literature suggesting that the PPC, like the somatotopy of primary motor and somatosensory regions, is also organized in an effector‐specific manner. For example, it has been proposed that the most anterior portion of the SPL, namely BA 5, has a lateral‐to‐medial gradient for hand versus foot movements, although there is considerable overlap for the two limbs in this area [Heed et al., 2012]. A further often cited study demonstrating an effector‐specific clustering for object‐related movements was conducted by Buccino et al. 2002. They observed an effector‐specific clustering during the observation of object‐related actions. During the observation of hand actions, they found activation within the posterior sector of Area 40. The observation of foot actions was associated with predominant activations of the posterior part of the SPL. Thus, posterior parietal organization also reflects multiple organization forms comparable to the organization of the premotor area. This also may result from a compromise between a body map and a map of actions and their target locations. The resulting map might be a complex combination of overlapping maps and multiple dimensions of action control. The existence of mirror neurons within the premotor and parietal region [Mukamel et al., 2005], which are fine tuned to different levels of action control, underpins this notion [Fernandino and Iacoboni, 2007].
Action Hierarchy During Action Simulation?
It has been suggested that human motor areas might contain a body map, a map reflecting end states of actions, or a map reflecting target locations of actions, or even a mixture of different maps [Fernandino and Iacoboni, 2007]. Thus, several dimensions of action and action control might compete for representation during the action simulation processes, for example, the representation of either the body or of action goals. Overall, three major levels of motor control—goal, kinematic, and muscular—can be distinguished as a basis for an action hierarchy in the brain [Hamilton and Grafton, 2011]. Examples showing that complex actions are organized in terms of control hierarchies based on outcomes can be observed in imitation tasks. For example, Bekkering et al. 2000 have shown that when children imitate another person performing a behavior such as grasping the ear on the same or opposite side of the acting hand, they tend to copy the goal (the ear being grasped) rather than the subgoal (the hand doing the grasping). This is in line with traditional cognitive theories arguing that the problem of action control might be resolved in serial manner: first select “what to do,” then specify “how to do it” [cf. Cisek, 2003].
The present findings in the premotor and the posterior parietal region suggest that activations for action simulation tend to be located together when they contain the same action goal, independent of the effector, whereas effector‐specific activation sites are less pronounced for both simulation states. Thus, we would suggest that within the present design, representing a specific action and its goal is more dominant and important when solving the simulation task than when representing a specific effector that achieves the goal during a simulation task. Therefore, representing actions, the goal of the action, and the effector to achieve it follow a hierarchy involving higher level categorical representations of motor acts within both ROIs.
Limitations of this Study for MI
The present results are constrained by our findings associated with the imagery of different hand and foot movements, because we find activation sites that pass the threshold only when we looked at action‐specific clustering for aiming movements and effector‐specific clustering for hand movements. However, especially for effector‐specific activation sites, several studies have demonstrated effector‐specific segregation during MI [Ehrsson et al., 2005; Wolfensteller et al., 2007]. The examination of single subjects within this study revealed a more inconsistent pattern for the imagery conditions than for the observation conditions (Fig. 5), and this might explain the present findings. Thus, our functional considerations remain speculative when considering the results associated with the imagery conditions.
CONCLUSIONS
This study was the first to investigate both simulation states of action observation and MI for different tasks in one design, thereby demonstrating that activation within the premotor and the posterior parietal cortex differs specifically, especially when observing hand and foot movements with specific action demands. Effector‐specific activation sites were less pronounced. Therefore, the present data underpin the notion that premotor areas contain an action‐based and effector‐based clustering of motor acts during action simulation processes when different types of actions are simulated. However, not only a functional segregation but also an overlap could be observed within the parietal and the premotor region. Thus, uncovering the different mapping mechanisms in the human motor system will require further studies and analyses.
Supporting information
Supporting Information
ACKNOWLEDGMENTS
The authors thank Bertram Walter and Fabian Helm for their helpful support. We also thank Jonathan Harrow for native‐speaker advice.
REFERENCES
- Aziz‐Zadeh L, Koski L, Zaidel E, Mazziotta J, Iacoboni M (2006): Lateralization of the human mirror neuron system. J Neurosci 26:2964–2970. [DOI] [PMC free article] [PubMed] [Google Scholar]
- Bekkering H, Wohlschläger A, Gattis M (2000): Imitation of gestures in children is goal‐directed. Q J Exp Psychol 53:153–164. [DOI] [PubMed] [Google Scholar]
- Binkofski F, Buccino G, Posse S, Seitz RJ, Rizzolatti G, Freund HJ (1999): A fronto‐parietal circuit for object manipulation in man: Evidence from an fMRI study. Eur J Neurosci 11:3276–3286. [DOI] [PubMed] [Google Scholar]
- Buccino G, Binkofski F, Fink GR, Fadiga L, Fogassi L, Gallese V, Seitz RJ, Zilles K, Rizzolatti G, Freund HJ (2001): Action observation activates premotor and parietal areas in a somatotopic manner: An fMRI study. Eur J Neurosci 13:1460–9568. [PubMed] [Google Scholar]
- Bueno CA, Jarvis MR, Batista AP, Andersen RA (2002): Direct visuomotor transformations for reaching. Nature 416:632–636. [DOI] [PubMed] [Google Scholar]
- Cisek P (2007): Cortical mechanisms of action selection: The affordance competition hypothesis. Phil Trans R Soc 362:1585–1599. [DOI] [PMC free article] [PubMed] [Google Scholar]
- Ehrsson HH, Geyer S, Naito E (2003): Imagery of voluntary movement of fingers, toes, and tongue activates corresponding body‐part‐specific motor representations. J Neurophysiol 90:3304–3316. [DOI] [PubMed] [Google Scholar]
- Eickhoff SB, Stephan KE, Mohlberg H, Grefkes C, Fink GR, Amunts K, Zilles K (2005): A new SPM toolbox for combining probabilistic cytoarchitectonic maps and functional imaging data. Neuroimage 25:1325–1335. [DOI] [PubMed] [Google Scholar]
- Elias LJ, Bryden MP, Bulman‐Fleming MB (1998): Footedness is a better predictor than is handedness of emotional lateralization. Neuropsychologia 36:37–43. [DOI] [PubMed] [Google Scholar]
- Fernandino L, Iacoboni, M (2010): Are cortical motor maps based on body parts or coordinated actions? Implications for embodied semantics. Brain Lang 112:44–53. [DOI] [PubMed] [Google Scholar]
- Filimon F, Nelson JD, Hagler DJ, Sereno MI (2007): Human cortical representations for reaching: Mirror neurons for execution, observation, and imagery. Neuroimage 37:1315–1328. [DOI] [PMC free article] [PubMed] [Google Scholar]
- Friston KJ, Holmes AP, Worsley KJ (1999): How many subjects constitute a study? Neuroimage 10:1–5. [DOI] [PubMed] [Google Scholar]
- Gallese V, Fadiga L, Fogassi L, Rizzolatti G (1996): Action recognition in the premotor cortex. Brain 119:593–609. [DOI] [PubMed] [Google Scholar]
- Gazzola V, Keysers C (2009): The observation and execution of actions share motor and somatosensory voxels in all tested subjects: Single‐subject analyses of unsmoothed fMRI data. Cereb Cortex 19:1239–1255. [DOI] [PMC free article] [PubMed] [Google Scholar]
- Graziano M, Taylor C, Moore T, Cooke D (2002): The cortical control of movement revisited. Neuron 36:349–362. [DOI] [PubMed] [Google Scholar]
- Graziano M, Aflalo T (2007): Mapping behavioral repertoire onto the cortex. Neuron 56:239–251. [DOI] [PubMed] [Google Scholar]
- Grèzes J, Decety J (2001): Functional anatomy of execution, mental simulation, observation, and verb generation of actions: A meta‐analysis. Hum Brain Mapp 12:1–19. [DOI] [PMC free article] [PubMed] [Google Scholar]
- Hall CR, Martin KA (1997): Measuring movement imagery abilities: A revision of the Movement Imagery Questionnaire. J Ment Imagery 21:143–154. [Google Scholar]
- Hamilton AFdC, Grafton ST (2007): The motor hierarchy: From kinematics to goals to intentions In: Rosetti Y, et al., editors. Attention and Performance XXII. Oxford: Oxford University Press. [Google Scholar]
- Hauk O, Johnsrude I, Pulvermüller F (2004): Somatotopic representation of action words in human motor and premotor cortex. Neuron 41:301–307. [DOI] [PubMed] [Google Scholar]
- Heed T, Beurze SM, Toni I, Roder B, Medendorp WP (2011): Functional rather than effector‐specific organization of human posterior parietal cortex. J Neurosci 31:3066–3076. [DOI] [PMC free article] [PubMed] [Google Scholar]
- Jastorff J, Begliomini C, Fabbri‐Desto M, Rizzolatti G, Orban GA (2010): Coding observed motor acts: Different organization principles in the parietal and premotor cortex of humans. J Neurophysiol 104:128–140. [DOI] [PubMed] [Google Scholar]
- Jastorff J, Abdollahi RO, Orban GA (2012): Acting alters visual processing: Flexible recruitment of visual areas by one's own actions. Cereb Cortex. Epub ahead of print. [DOI] [PubMed] [Google Scholar]
- Jeannerod M (2001): Neural simulation of action: A unifying mechanism for motor cognition. Neuroimage 14:103–109. [DOI] [PubMed] [Google Scholar]
- Kohler E, Keysers C, Umiltà MA, Fogassi L, Gallese V, Rizzolatti G (2002): Hearing sounds, understanding actions: Action representation in mirror neurons. Science 297:846–848. [DOI] [PubMed] [Google Scholar]
- Mukamel R, Ekstrom AD, Kaplan J, Iacoboni M, Fried I. (2010): Single neuron responses during execution and observation of actions. Curr Biol 20:750–756. [DOI] [PMC free article] [PubMed] [Google Scholar]
- Oldfield, RC (1971): The assessment and analysis of handedness: The Edinburgh inventory. Neuropsychologia 9:97–113. [DOI] [PubMed] [Google Scholar]
- Rintjes M, Dettmers C, Büchel C, Kiebel S, Frackowiak RSJ, Weiller CA (1999): Blueprint for movement: Functional and anatomical representations in the human motor system. J Neurosci 15:8043–8048. [DOI] [PMC free article] [PubMed] [Google Scholar]
- Rizzolatti G, Camarda RM, Fogassi L, Luppino G, Matelli M (1988): Functional organization of inferior area 6 in the macaque monkey. II. Area F5 and the control of distal movements. Exp Brain Res 71:491–507. [DOI] [PubMed] [Google Scholar]
- Sakreida K, Schubotz RI, Wolfensteller U, von Cramon DY (2005): Motion class dependency in observers' motor areas revealed by functional magnetic resonance imaging. J Neurosci 9:1335–1342. [DOI] [PMC free article] [PubMed] [Google Scholar]
- Schubotz RI, von Cramon DY (2001): Functional organization of the lateral premotor cortex: fMRI reveals different regions activated by anticipation of object properties, location and speed. Cogn Brain Res 11:97–112. [DOI] [PubMed] [Google Scholar]
- Schubotz RI, von Cramon DY (2002): Predicting perceptual events activates corresponding motor schemes in lateral premotor cortex: An fMRI study. Neuroimage 15:787–796. [DOI] [PubMed] [Google Scholar]
- Schubotz RI (2004):Human Premotor Cortex: Beyond Motor Performance. Leipzig:Max Planck Institute Series for Human Cognitive and Brain Sciences. [Google Scholar]
- Schubotz RI, von Cramon DY (2003): Functional‐anatomical concepts on human premotor cortex: Evidence from fMRI and PET studies. Neuroimage 20:120–131. [DOI] [PubMed] [Google Scholar]
- Schubotz RI, Anwander A, Knösche TR, Cramon DY, Tittgemeyer M (2010): Anatomical and functional parcellation of the human lateral premotor cortex. Neuroimage 50:396–408. [DOI] [PubMed] [Google Scholar]
- Smith SM, Jenkinson M, Woolrich MW, Beckmann CF, Behrens TEJ, Johansen‐Berg H, Bannister PR, De Luca M, Drobnjak I, Flitney DE, Niazy RK, Saunders J, Vickers J, Zhang Y, De Stefano N, Brady JM, Matthews PM (2004): Advances in functional and structural MR image analysis and implementation as FSL. Neuroimage 23:208–219. [DOI] [PubMed] [Google Scholar]
- Stippich C, Ochmann H, Sartor K (2002): Somatotopic mapping of the human primary sensorimotor cortex during motor imagery and motor execution by functional magnetic resonance imaging. Neurosci Lett 331:50–54. [DOI] [PubMed] [Google Scholar]
- Wheaton KJ, Thompson JC, Syngeniotis A, Abbott DF, Puce A (2004): Viewing the motion of human body parts activates different regions of premotor, temporal, and parietal cortex. Neuroimage 22:277–288. [DOI] [PubMed] [Google Scholar]
- Wise SP (1985): The primate premotor cortex: Past, present and preparatory. Annu Rev Neurosci 8:1–19. [DOI] [PubMed] [Google Scholar]
- Wolfensteller U, Schubotz RI, von Cramon DY (2007): Understanding non‐biological dynamics with your own premotor system. Neuroimage 36:33–43. [DOI] [PubMed] [Google Scholar]
- Zentgraf K, Munzert J, Bischoff M, Newman‐Norlund RD (2011): Simulation during observation of human actions—Theories, empirical studies, applications. Vision Res 51:827–835. [DOI] [PubMed] [Google Scholar]
Associated Data
This section collects any data citations, data availability statements, or supplementary materials included in this article.
Supplementary Materials
Supporting Information