

Abstract
Cortico‐cortical connections might be disturbed in patients with Alzheimer's disease (AD). This study aimed to investigate the alterations of functional connectivity in AD during auditory change detection processing by measuring the local neuronal activation and functional connectivity between cortical regions. Magnetoencephalographic responses to deviant and standard sounds were recorded in 16 AD patients, 18 young controls and 16 elderly controls. Larger source amplitudes and shorter peak latencies were found in the right temporal magnetic mismatch responses of young controls compared with elderly controls and AD patients. During deviant stimuli, the right theta temporal‐frontal phase synchrony was significantly smaller in AD than in young controls and elderly controls. Moreover, the left temporal‐frontal synchronization at theta and alpha bands was reduced in AD and elderly controls compared with young controls. In conclusion, the loss in temporo‐frontal theta synchronization might be an electrophysiological hallmark of AD. Hum Brain Mapp 35:5565–5577, 2014. © 2014 Wiley Periodicals, Inc.
Keywords: Alzheimer's disease, phase synchronization, auditory change detection, mismatch negativity, temporal‐frontal network, magnetoencephalography
INTRODUCTION
Alzheimer's disease (AD) is characterized by memory impairment followed by deficits in visuo‐spatial and executive processes. The neuropathology characteristics in AD are widespread neuronal cell loss, neurofibrillary tangles, and senile plaques in the hippocampus, entorhinal cortex, neocortex, and other brain regions [DeCarli, 2001; Selkoe, 1994]. Pronounced insults in the frontal, temporal, and parietal neocortical association areas have been noted in AD [Arnold et al., 1991, 1994; Bouras et al., 1994]. Delbeuck et al. [2003] proposed that AD might be a disconnection syndrome according to its symptomology. Of note, the cognitive functions of attention and memory are early deteriorated in AD [Parasuraman and Nestor, 1993].
The auditory oddball task without attention and behavioral response has been suggested to be an objective tool for evaluating memory and cognitive function in various neurological disorders [Naatanen, 2000; Pekkonen, 2000]. Using this task, mismatch negativity (MMN) and its magnetic counterpart (MMNm) can be obtained by electroencephalographic (EEG) [Giard et al., 1990; Naatanen et al., 1978; Naatanen and Michie, 1979; Rinne et al., 2000] or magnetoencephalographic (MEG) recordings [Alho et al., 1998; Hari et al., 1992; Korzyukov et al., 1999; Sams et al., 1991]. A MMN (MMNm) response is typically elicited by a rare event (deviance) during a regular acoustic environment [Naatanen et al., 1978]. Cortical generators in the temporal [Alho et al., 1998; Hari et al., 1992; Korzyukov et al., 1999; Sams et al., 1991] and the frontal cortices [Giard et al., 1990; Naatanen and Michie, 1979; Rinne et al., 2000] contribute to scalp MMN activity. The temporal generators are responsible for the establishment of memory trace and sensory discrimination, whereas the frontal sources are associated with an involuntary switch of attention by the deviant [Naatanen, 2000]. Evidence has shown that MMN may be an index of sensory memory in auditory modality [Naatanen, 2000].
The auditory sensory discrimination function in AD has been examined in a passive or active oddball paradigm using EEG [Bronnick et al., 2010; Gaeta et al., 1999; Kazmerski et al., 1997; Pekkonen et al., 1994; Verleger et al., 1992; Yokoyama et al., 1995] or MEG recordings [Pekkonen et al., 2001]. These EEG and MEG studies utilized the frequency‐ or duration‐change deviance with a stimulus onset synchrony at 0.35–3 s and reported normal MMN responses in AD except for Pekkonen's study [Pekkonen et al., 1994], in which prolonged latency and decreased amplitude of MMN responses with stimulus‐onset‐asynchrony (SOA) of 3 s was observed for AD. Consequently, the function of automatic auditory change perception seemed preserved in AD. However, the auditory deviance processing is associated with a distributed cortical network that involves temporal and frontal cortices and initiates the attention switch in normal subjects [Hsiao et al., 2010]. Of note, our previous studies have found frontal phase locking phenomena for auditory deviance at theta band [Hsiao et al., 2009] and modulation of phase locking activities in epilepsy patients [Lin et al., 2007]. To date, it remains unknown whether the functional connectivity underpinning auditory deviant processing is altered in AD.
This study aimed to quantify the cortical connectivity dynamics of MMNm responses in the young, elderly controls and AD patients using minimum‐norm estimate (MNE) analysis and phase synchronization analysis. We hypothesize that the cognitive decline in AD could be characterized by altered neural synchrony within the cortical network associated with auditory change detection.
MATERIALS AND METHODS
Participants
Eighteen young controls (11 men, 7 women; mean age of 30 years), 16 elderly controls (9 men, 7 women; mean age of 73.5 years) and 16 patients with probable AD (11 men, 5 women; mean age of 76.8 years), all right‐handed and with normal hearing, participated in this study. The study was approved by the Institutional Review Board of Taipei Veterans General Hospital. Before MEG measurement, a written informed consent was obtained from each participant. All of the patients were recruited from the outpatient department of neurology and were diagnosed according to the guidelines [McKhann et al., 2011]. Control subjects had no history of neurologic, psychiatric, or any other severe medical diseases. A Mini‐Mental State Examination (MMSE) score of over 26/30 was demanded for the healthy controls [Folstein et al., 1975]. A significantly lower MMSE score was found in AD compared with that in elderly controls (P < 0.001, AD = 21.15 ± 2.26, elderly controls = 28.61 ± 1.26). The mean clinical dementia rating [Morris, 1993] in the AD patients was 1.0 (±0.35).
Stimuli
The sound stimuli at 65–70 dB sound pressure above the hearing level were delivered binaurally through plastic tubes and earpieces to each subject. An auditory oddball paradigm that comprised standard (burst duration of 100 ms, including rise/fall times of 10 ms, probability 85%) and deviant stimuli (burst duration of 50 ms, including rise/fall times of 10 ms, probability 15%) in a random order with a 500‐ms SOA was used on all subjects. In the stimulus sequence, at least three standard stimuli were continuously delivered between two deviant stimuli. During the recording, the subjects were instructed to attentively watch a self‐chosen silent movie on a screen in front and ignore the auditory stimuli being presented.
MEG Recordings
The MEG recordings were conducted in a magnetically shielded room with a whole‐scalp 306‐channel neuro‐magnetometer (Vectorview™, Elekta Neuromag, Helsinki, Finland) that was composed of 102 identical triple sensor elements. Each sensor element was composed of one magnetometer and two orthogonal planar gradiometers. Four coils to stand for the head position were placed on the subject's scalp, and their positions in the head coordinate frame specified by the nasion and two preauricular points were measured with a 3‐dimension digitizer. Then, in the magnetically shielded room, the head position with respect to the MEG sensor array was determined by feeding current to the four indicator coils. These landmarks of the head position allowed for further alignment of the MEG and magnetic resonance (MR) imaging coordinate systems. During the recordings, the subject sat comfortably with the head supported against the helmet of the neuro‐magnetometer. The MEG signals were bandpass filtered (0.1–130 Hz) and digitized at 400 Hz. Averaged and raw data with an epoch length of 50 ms prestimulus and 480 ms poststimulus were stored for offline analysis. Epochs were excluded from being further analyzed whenever the amplitude of the corresponding electro‐oculogram and MEG signals were larger than 300 µV and 6000 fT/cm, respectively. For offline further analysis, approximately 100 trials were recorded for the deviant stimuli, and the same number of trials was randomly selected from the recording of standard‐elicited activities
Source Localization
The subtraction of averaged‐MEG data for standard stimuli from that for deviant stimuli yielded the MMNm responses. Depth‐weighted MNE was used to obtain the dynamics of cortical sources of the MEG data [Hamalainen and Ilmoniemi, 1994]. MNE offers fine spatial accuracy using depth weighting [Lin et al., 2006] and enable one to obtain simultaneous cortical sources that are distributed onto the brain surface [Hamalainen and Ilmoniemi, 1994]. The baseline activities (−50 to 0 ms) were used to calculate the noise covariance matrix. For details of the calculations of the forward model and inverse operator, see Hsiao et al. [2013a]. In the present analysis, the activation at each vertex (a given source space point which is defined as an equilateral triangle in the tessellation of the cortical surface) was estimated every 2.5 ms. MNE analysis was performed with Brainstorm [Tadel et al., 2011], which is a documented program available for free download online under the GNU general public license (http://neuroimage.usc.edu/brainstorm).
Spectral Power and Phase Synchronization Analysis
The raw data for deviant‐ and standard‐elicited activities were further analyzed for brain dynamic activities. Oscillatory phase synchrony was computed by a Morlet wavelet‐based time frequency analysis [Lachaux et al., 1999], using Matlab computing software (The Math Works, Natick, MA). The Morlet wavelet function of time t and frequency f 0 is defined as:
The wavelet width (m = f 0/σf) was 7 [Hsiao et al., 2009; Lachaux et al., 1999]. The time‐varying power P(t,f 0) of the MEG signals for frequency f 0 is the squared norm of the convolution of the complex wavelet w(t,f0) with the MEG signal s(t):
The spectral power was normalized by means of dividing the power at each frequency band by the total power of 1–40 Hz, which has been reported to adequately reduce the interindividual variability in the previous studies and, consequently, reveal the slowing of cortical rhythms in AD [Babiloni et al., 2006; Hsiao et al., 2013b].
To quantify the instantaneous phase characteristics, single‐trial MEG epochs were decomposed. For trial i at time t and frequency f 0, the phase representation was obtained by normalizing the result of the convolution of the complex wavelet w(t,f 0 ) with the recorded neuromagnetic signal (t):
The phase activities of another signal (t) were also calculated as above equation. The phase synchronization (PS) at time t and frequency f 0 over N trials between and was then defined as:
The phase synchronization value (PSV) specified the degree of synchrony at a given time point and frequency band between the neuromagnetic signals of two separate channels. PSV was one when the phases between the responses of the two channels were locked and was 0 when the phases were completely uncorrelated. The study used the Rayleigh test [Fisher, 1993] to assess the statistical significance. For N = 100, the value of phase synchronization above 0.18 and 0.22 was statistically significant with P < 0.05 and P < 0.01, respectively. To remove the contribution of common locking to the stimuli, all of the values were corrected by the estimation of phase‐locking statistics [Lachaux et al., 1999]. Moreover, phase synchronization analysis is better than frequency coherence analysis because it can be applied to nonstationary signals, and the results using this technique can be independent from amplitude modulation [Lachaux et al., 1999]. PSVs of all of the channels were estimated with the reference channel over the left or right temporal regions for each subject's data. According to previous findings [Hsiao et al., 2010], the PSV of each subject was averaged over the time interval of 150–300 ms after stimulus onset for topographic plots and further statistical analysis.
Statistical Analysis
The peak strength and latency of MMNm sources obtained from MNE analysis were statistically compared by ANOVA for the effect of Group (young control, elderly control, and AD) and Hemisphere (left and right). The averaged values of normalized spectral powers at 150–300 ms within the frequency bands (theta, alpha, beta, and gamma bands) were also statistically examined by ANOVA for the effect of Group. The averaged PSV in the time interval of 150–300 ms was selected at the channel with predominant synchrony in the temporal and frontal areas. On the basis of previous findings [Hsiao et al., 2010], with respect to the reference channel in the left or right temporal area, the phase synchronization values in the contralateral temporal and bilateral frontal regions at all frequency bands were statistically examined by ANOVA with factors of Group and stimuli (deviant and standard).
Post hoc tests were adjusted for multiple comparisons using the Bonferroni correction. Statistical analyses were conducted using the SPSS Statistics Package (SPSS). A P value of <0.05 was considered to be statistically significant.
RESULTS
The left panel of Figure 1 shows the spatial distribution of the 204‐channel MEG activities, obtained from the waveform difference between the responses to the deviant and standard stimuli, in young control #2. The predominant MMNm waveforms are observed and peaked at 154 ms and 144 ms in the left and right hemispheres, respectively. The right upper panel illustrates the superimposed MEG responses of young control #2, where the explicit cortical activities at ∼150 ms are the MMNm component. The right lower panel was magnetic field patterns at 144 and 154 ms, showing clear cortical sources over bilateral auditory cortex.
Figure 1.
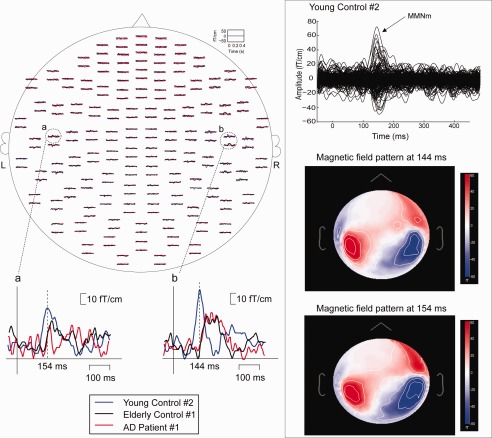
Left panel: topographic distributions of MMNm responses from a young control #2, elderly control #1 and AD patient #1. The head is flattened to a plane and viewed from above with the subject's nose pointing upward. The inserts show the prominent MMNm from the bilateral temporal areas. Note that the MMNm of the right temporal area are selected from the upper (for young control) or lower channel (for AD patient and elderly control) of the dashed‐line encircled region. Right panel: the upper part is the superimposition of all gradiometer channels from young control #2. Remarkable MMNm peaks are at ∼150 ms. The middle and lower parts are the topographic field pattern at 144 and 154 ms, respectively.
The MNE‐derived distributed cortical source maps of MMNm activities from −50 to 400 ms in young control #2 were plotted with the right and left lateral view (Fig. 2a). Remarkable cortical source strength occurred at ∼150 ms and localized in the bilateral auditory cortex (Fig. 2b). The bottom panel showed the time varying source waveforms in the left (Fig. 2c) and right (Fig. 2d) auditory cortex.
Figure 2.
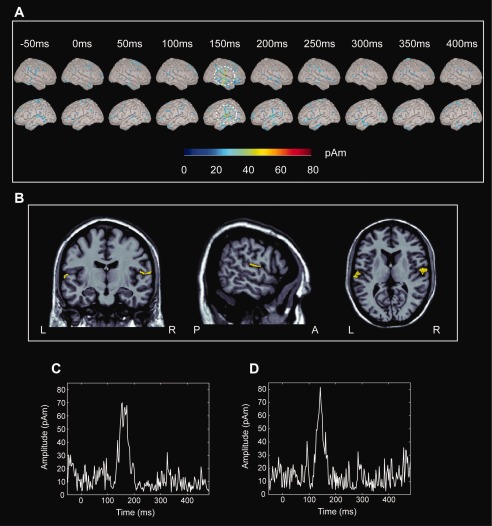
(a) Distributed current activations of the MMNm response from young control #2 at −50 to 400 ms in the right and left views. Dashed lines encircle the significant activation with respect to the baseline. (b) The prominent activations at 150 ms are displayed on MRI; they are located in the bilateral auditory cortex. (c) The current source waveform at the left auditory cortex. (d) The current source waveform at the right auditory cortex.
For the peak amplitude of the MMNm sources, we found a main effect for Group [F(2,94) = 6.2, P < 0.01] and Group × Hemisphere interaction [F(2,94)= 3.2, P < 0.05] but no main effect for Hemisphere [F(1,47) = 1.8, P > 0.2]. For the peak latency, a main effect for Group [F(2,94) = 31.8, P < 0.001], no main effect for Hemisphere [F(1,47) = 1.0, P > 0.3], and no Group × Hemisphere interaction [F(2,94) = 0.9, P > 0.4] were observed. A post hoc test revealed that the source amplitude in the right hemisphere was larger in the young controls than in the elderly controls (P < 0.01) and in AD (P < 0.02) (Fig. 3a). In the between‐group comparison, the latencies in young controls were significantly shorter than those in elderly controls (P < 0.001) and AD (P < 0.001) (Fig. 3b).
Figure 3.
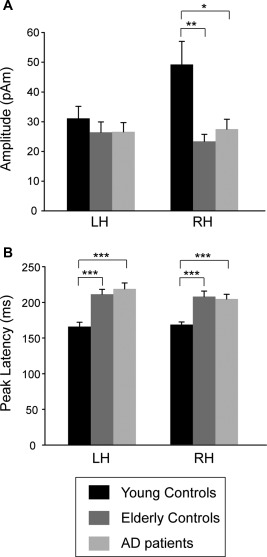
(a) Mean peak amplitude and (b) peak latency of MMNm responses in young controls, elderly controls and AD patients. * P < 0.05; ** P < 0.01; *** P < 0.001. LH, left hemisphere; RH, right hemisphere.
For deviant or standard stimuli, statistical examination of the normalized spectral power values yielded no main effect for Group in the bilateral temporal regions [left temporal region: all F(2,94) < 1.5 and all P > 0.2 for all frequency bands; right temporal region: all F(2,94) < 2.5 and all P > 0.05 for all frequency bands] (Table 1).
Table 1.
Normalized spectral power values of deviant‐ and standard‐elicited responses at 150–300 ms in the bilateral temporal area in young controls, elderly controls, and AD patients
| Left temporal | Right temporal | ||||||||
|---|---|---|---|---|---|---|---|---|---|
| Theta | Alpha | Beta | Gamma | Theta | Alpha | Beta | Gamma | ||
| Young Controls (N = 18) | Deviant | 0.063 ± 0.007 | 0.051 ± 0.006 | 0.021 ± 0.003 | 0.013 ± 0.002 | 0.079 ± 0.009 | 0.052 ± 0.004 | 0.018 ± 0.002 | 0.011 ± 0.002 |
| Standard | 0.057 ± 0.008 | 0.067 ± 0.008 | 0.021 ± 0.003 | 0.009 ± 0.002 | 0.061 ± 0.008 | 0.073 ± 0.008 | 0.019 ± 0.003 | 0.004 ± 0.001 | |
| Elder Controls (N = 16) | Deviant | 0.069± 0.008 | 0.055 ± 0.007 | 0.024 ± 0.003 | 0.014 ± 0.002 | 0.068 ± 0.009 | 0.042 ± 0.005 | 0.023 ± 0.003 | 0.014 ± 0.002 |
| Standard | 0.066± 0.009 | 0.07 ± 0.01 | 0.017 ± 0.003 | 0.006 ± 0.001 | 0.057 ± 0.006 | 0.079 ± 0.007 | 0.018 ± 0.002 | 0.007 ± 0.001 | |
| AD Patients (N = 16) | Deviant | 0.071± 0.011 | 0.048 ± 0.005 | 0.018 ± 0.003 | 0.01 ± 0.002 | 0.063 ± 0.009 | 0.059 ± 0.01 | 0.022 ± 0.004 | 0.008 ± 0.002 |
| Standard | 0.071± 0.009 | 0.064 ± 0.008 | 0.017 ± 0.003 | 0.006 ± 0.001 | 0.067 ± 0.01 | 0.073 ± 0.009 | 0.017 ± 0.003 | 0.007 ± 0.002 | |
Figure 4a depicts the topographic distribution of the phase synchrony at the theta, alpha, beta, and gamma bands in young controls, elderly controls, and AD patients for deviant and standard stimuli. Note that the white square in the plots, located over the right temporal region, stands for the reference sensor. The plots are arranged according to the position of the corresponding sensor on the helmet. Downward views of the head are shown with the nose pointing toward the upper edge of the figure. The topography of phase synchrony is color‐coded; red denotes a large PSV while blue represents a small PSV. The sensors that neighbor the reference channel were neglected because they originated from the same source activity. Moreover, Figure 4b shows the distributions of phase synchronization with reference to the left temporal region.
Figure 4.
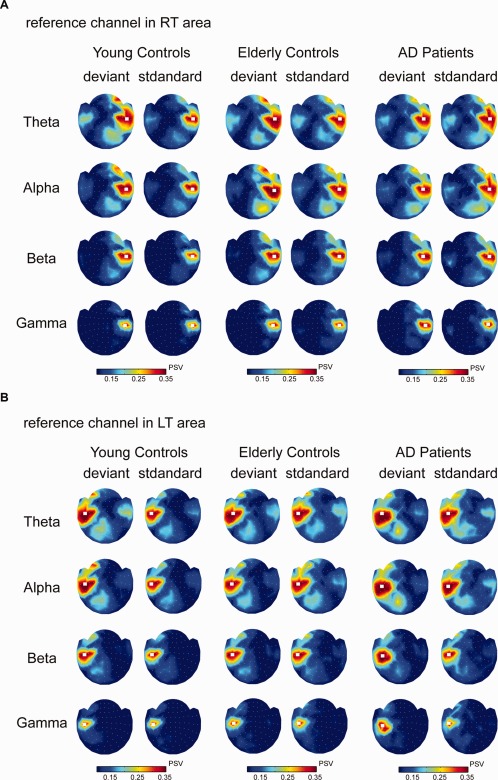
(a) Topographic plots of phase synchrony estimates of standard‐ and deviant‐evoked responses at 150–300 ms after stimulus onset in 4–40 Hz in young controls (Subject 2, S2), elderly controls (Subject 5, S5) and AD patients (Subject 6, S6). The synchrony value is relative to a reference channel (white square) in the right temporal region. The head maps are viewed from the top, with the nose pointing upward. The strength of the phase synchrony is color‐coded; a large value is denoted with red and a small value is denoted with blue. (b) Topographic plots of phase synchrony were estimated with respect to the left temporal region. Theta, 4–8 Hz; Alpha, 8–13 Hz; Beta, 13–25 Hz; and Gamma, 25–40 Hz.
To examine the statistical significance, the PSV with reference to the right temporal area were submitted to ANOVA tests (Table 2). Concerning the factors of Group and Stimulus Conditions, we examined the significant levels for the frequency range from theta to gamma bands and the analyzed channels localized in the left temporal, left, and right frontal regions. For the theta band in the right frontal region, there were main effects of Group [F(2,94) = 4.69, P < 0.02] and Condition [F(1,47) = 27.96, P < 0.0001] and a significant interaction of Group × Condition [F(2,94) = 6.59, P < 0.002]. For Group, a smaller PSV was found in AD when compared with young and elderly controls (all P < 0.03). Regarding the alpha band in the right frontal region, there was a main effect of Condition [F(1,47) = 8.19, P < 0.01] but no significant effect of Group [F(2,94) = 1.34, P > 0.05] or Group × Condition interaction [F(2,94) = 2.44, P > 0.05]. In the frontal region, PSVs elicited by deviant stimuli were larger than those by standard stimuli.
Table 2.
Phase synchronization values of deviant‐ and standard‐elicited responses in varying brain areas relative to a reference channel in right temporal area in young controls, elderly controls, and AD patients
| Left temporal | Left frontal | Right frontal | |||||||||||
|---|---|---|---|---|---|---|---|---|---|---|---|---|---|
| Theta | Alpha | Beta | Gamma | Theta | Alpha | Beta | Gamma | Theta | Alpha | Beta | Gamma | ||
| Young controls (N = 18) | Deviant | 0.23 ± 0.021 | 0.151 ± 0.015 | 0.104 ± 0.006 | 0.089 ± 0.003 | 0.099 ± 0.006 | 0.096 ± 0.007 | 0.089 ± 0.004 | 0.091 ± 0.004 | 0.311 ± 0.008 | 0.275 ± 0.016 | 0.216 ± 0.014 | 0.141 ± 0.008 |
| Standard | 0.178 ± 0.015 | 0.142 ± 0.014 | 0.098 ± 0.007 | 0.083 ± 0.004 | 0.102 ± 0.008 | 0.091 ± 0.006 | 0.084 ± 0.005 | 0.079 ± 0.004 | 0.203 ± 0.009 | 0.202 ± 0.011 | 0.169 ± 0.01 | 0.132 ± 0.009 | |
| Elderly controls (N = 16) | Deviant | 0.194± 0.021 | 0.141 ± 0.009 | 0.106 ± 0.006 | 0.096 ± 0.007 | 0.115 ± 0.014 | 0.106 ± 0.009 | 0.092 ± 0.006 | 0.088 ± 0.004 | 0.289 ± 0.015 | 0.283 ± 0.015 | 0.218 ± 0.01 | 0.135 ± 0.011 |
| Standard | 0.18± 0.009 | 0.151 ± 0.015 | 0.108 ± 0.007 | 0.103 ± 0.006 | 0.133 ± 0.013 | 0.099 ± 0.011 | 0.097 ± 0.006 | 0.093 ± 0.004 | 0.229 ± 0.014 | 0.236 ± 0.018 | 0.215 ± 0.017 | 0.139 ± 0.018 | |
| AD patients (N = 16) | Deviant | 0.183± 0.025 | 0.148 ± 0.015 | 0.107 ± 0.006 | 0.088 ± 0.004 | 0.119 ± 0.01 | 0.103 ± 0.012 | 0.088 ± 0.004 | 0.091 ± 0.005 | 0.224 ± 0.01 | 0.231 ± 0.01 | 0.195 ± 0.014 | 0.145 ± 0.016 |
| Standard | 0.178± 0.027 | 0.163 ± 0.029 | 0.102 ± 0.009 | 0.089 ± 0.007 | 0.118 ± 0.013 | 0.116 ± 0.017 | 0.088 ± 0.008 | 0.086 ± 0.006 | 0.217 ± 0.024 | 0.234 ± 0.028 | 0.19 ± 0.025 | 0.128 ± 0.012 | |
Similarly, statistical examination was conducted for the PSV with reference to the left temporal area (Table 3). Significant PSV values were found at the theta band in the left frontal region. There was a main effect of Condition [F(1,47) = 6.89, P < 0.01] and a significant interaction of Group × Condition [F(2,94) = 4.93, P < 0.01]. For the factor of Group, the difference failed to reach significance [F(2,94) = 0.64, P > 0.05]. Similar to at the alpha band in the left frontal region, there were main effects of Group [F(2,94) = 4.44, P < 0.02] and Condition [F(1,47) = 10.38, P < 0.002] as well as a significant interaction between these two factors [F(2,94) = 11.09, P < 0.0001]. These findings suggest that, in the frontal area, PSVs were larger for deviant stimuli than for standard stimuli. At the alpha band, a post hoc test revealed that the PSVs for young controls were significantly larger than for AD patients (P < 0.02).
Table 3.
Phase synchronization values of deviant‐ and standard‐elicited responses in varying brain areas relative to a reference channel in left temporal area in young controls, elderly controls, and AD patients
| Right temporal | Left frontal | Right frontal | |||||||||||
|---|---|---|---|---|---|---|---|---|---|---|---|---|---|
| Theta | Alpha | Beta | Gamma | Theta | Alpha | Beta | Gamma | Theta | Alpha | Beta | Gamma | ||
| Young controls (N = 18±) | Deviant | 0.216 ± 0.021 | 0.158 ± 0.013 | 0.102 ± 0.005 | 0.091 ± 0.004 | 0.288 ± 0.014 | 0.32 ± 0.012 | 0.24 ± 0.014 | 0.141 ± 0.009 | 0.116 ± 0.009 | 0.088 ± 0.005 | 0.084 ± 0.004 | 0.083 ± 0.003 |
| Standard | 0.192 ± 0.018 | 0.135 ± 0.014 | 0.101 ± 0.007 | 0.081 ± 0.003 | 0.205 ± 0.007 | 0.214 ± 0.01 | 0.19 ± 0.008 | 0.139 ± 0.009 | 0.095 ± 0.01 | 0.085 ± 0.006 | 0.085 ± 0.003 | 0.081 ± 0.004 | |
| Elderly controls (N = 16) | Deviant | 0.189 ± 0.021 | 0.143 ± 0.009 | 0.112 ± 0.006 | 0.095 ± 0.007 | 0.245 ± 0.011 | 0.241 ± 0.015 | 0.221 ± 0.015 | 0.163 ± 0.011 | 0.11 ± 0.008 | 0.085 ± 0.005 | 0.089 ± 0.004 | 0.101 ± 0.006 |
| Standard | 0.202 ± 0.018 | 0.166 ± 0.017 | 0.117 ± 0.012 | 0.105 ± 0.007 | 0.242 ± 0.03 | 0.252 ± 0.026 | 0.213 ± 0.022 | 0.15 ± 0.021 | 0.121 ± 0.011 | 0.105 ± 0.012 | 0.099 ± 0.009 | 0.096 ± 0.009 | |
| AD patients (N = 16) | Deviant | 0.168 ± 0.028 | 0.136 ± 0.019 | 0.097 ± 0.005 | 0.085 ± 0.003 | 0.233 ± 0.012 | 0.228 ± 0.016 | 0.186 ± 0.012 | 0.142 ± 0.01 | 0.096 ± 0.005 | 0.102 ± 0.01 | 0.096 ± 0.006 | 0.095 ± 0.008 |
| Standard | 0.188 ± 0.025 | 0.145 ± 0.026 | 0.107 ± 0.006 | 0.094 ± 0.004 | 0.228 ± 0.023 | 0.223 ± 0.022 | 0.211 ± 0.016 | 0.172 ± 0.014 | 0.125 ± 0.008 | 0.114 ± 0.011 | 0.088 ± 0.003 | 0.091 ± 0.003 | |
As depicted in Figure 5, the PSVs between the temporal and frontal regions were further examined with the interaction between Group and Condition. For the right temporal‐frontal connection, the PSVs for deviant stimuli at the theta and alpha bands were significantly larger than for standard stimuli in young controls (all P < 0.01) and elderly controls (all P < 0.05). Moreover, theta PSVs for deviant stimuli in AD were significantly smaller than for young controls (P < 0.001) and elderly controls (P < 0.01). With regard to the left temporal‐frontal synchronization, in young controls, a significant difference in the PSVs between the deviant and standard stimuli was found at the theta (P < 0.01) and alpha (P < 0.01) bands. The PSVs for deviant stimuli in young controls was significantly larger than in elderly controls and AD at the theta (elderly controls, P < 0.05; AD, P < 0.01) and alpha (elderly controls, P < 0.001; AD, P < 0.001) bands.
Figure 5.
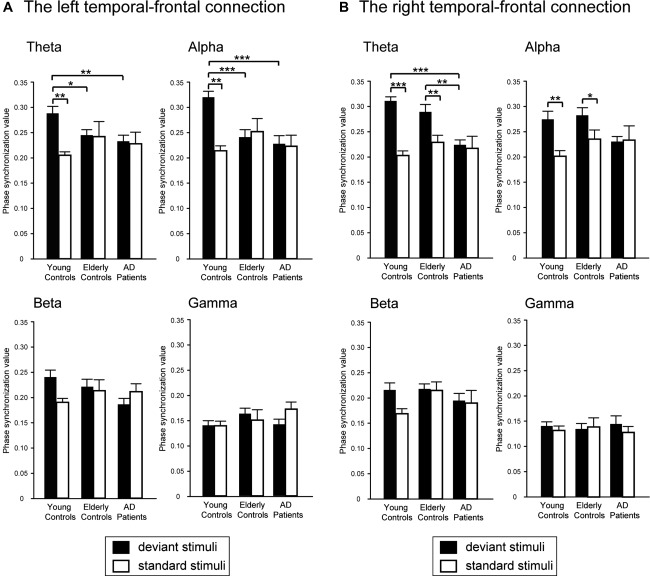
Mean phase synchronization values between the temporal and frontal regions in (a) the left hemisphere and (b) the right hemisphere in response to deviant (filled bar) and standard (empty bar) stimuli in young controls, elderly controls and AD patients. * P < 0.05; *** P < 0.001.
DISCUSSION
In this study, we investigated the alteration of cortical activation and cortico‐cortical synchrony during auditory oddball processing in AD. In the bilateral auditory cortex of AD, there was no significant difference of the cortical sources in comparison with elderly controls, whereas, compared to young controls, the cortical sources revealed attenuated strength and prolonged latency. With regard to temporo‐frontal connectivity, deteriorated synchronization at theta band was found in the right hemisphere in AD; moreover, decreased synchronization at theta and alpha band was observed in the left hemisphere in elderly controls and AD patients.
Similar activation of MMNm responses between AD and elderly controls was obtained in the bilateral auditory cortex. In line with previous EEG [Bronnick et al., 2010; Gaeta et al., 1999; Kazmerski et al., 1997; Pekkonen et al., 1994; Verleger et al., 1992; Yokoyama et al., 1995] and MEG studies [Pekkonen et al., 2001], preserved auditory change detection in AD is suggested in the present study. This finding also supports the prior suggestions that sparse MMN‐related neurons were lost in the early stage of AD [Gaeta et al., 1999; Kazmerski et al., 1997; Pekkonen et al., 2001] because of relatively intact neural tissue in the auditory cortex [Arnold et al., 1991, 1994; Bouras et al., 1994]. In MNE analysis, activation of the bilateral auditory cortex displays normal patterns in AD.
A significant aging effect on the MMNm sources was observed for the attenuated and delayed responses in elderly controls and AD patients. Impairment of the auditory automatic discrimination in aged subjects was noted for sound duration deviance in EEG [Cooper et al., 2006; Pekkonen et al., 1996] and MEG [Jaaskelainen et al., 1999] studies but not for sound frequency deviance with short ISI [Gaeta et al., 1998; Gunter et al., 1996; Pekkonen et al., 1993]. Cognitive decline was associated with a diminished efficiency of inhibitory processing and attentional control [Fabiani and Friedman, 1995; Gazzaley et al., 2005; Logan et al., 2002; McDowd and Filion, 1992] and a faster decay of the sensory memory trace [Jaaskelainen et al., 1999; Pekkonen et al., 1993, 1996]. The cortical source measurements in this study confirm the deterioration of sensory memory processing in elderly subjects, in agreement with the aging effect on MMN amplitude [Lindin et al., 2013], and promise to be an estimate of the cortical cognitive function.
The normalized spectral powers were not significantly different between the groups, suggesting that the oscillatory activities of bilateral auditory cortex, engaged in auditory mismatch processing, exhibited a similar pattern in young, elderly controls and AD patients. This is in agreement with previous findings that increase of theta power was associated with the auditory sensory memory processing [Hsiao et al., 2009] and MMN responses were preserved in AD [Bronnick et al., 2010; Gaeta et al., 1999; Kazmerski et al., 1997; Pekkonen et al., 2001; Verleger et al., 1992; Yokoyama et al., 1995]. Although slowing of the spontaneous cortical activity was reported to characterize the neuropathological changes in AD [Babiloni et al., 2011; Hsiao et al., 2013b]; the oscillatory characteristics during auditory change detection in the bilateral auditory cortex were not deteriorated for AD.
In the present study, AD was characterized as attenuated right temporo‐frontal synchronization at the theta band, which was reported to be engaged in the auditory deviance detection processing [Hsiao et al., 2010]. In AD, previous EEG studies found reduced upper alpha coherence between central and right temporal cortex by Sternberg memory task [Hogan et al., 2003] and a decrease in the upper alpha and beta synchronization likelihood during working memory processing [Pijnenburg et al., 2004]. By the visual oddball task, theta coherence in the left fronto‐parietal connection was decreased in AD [Guntekin et al., 2008]. These results suggested the association of EEG abnormalities in AD patients with functional impairment of information transmission in long cortico‐cortical connections. In this study, using the passive auditory oddball task without the subjects' attention or response and phase synchronization analysis that was free of amplitude modulation, attenuation of functional connectivity in the right temporo‐frontal connection was demonstrated in AD, especially in the theta band. Given the association between theta oscillation, short‐term memory [Jensen and Tesche, 2002; Klimesch, 1996; Sarnthein et al., 1998] and directed attention [Aftanas and Golocheikine, 2001; Basar et al., 2001], it is postulated that the cognitive decline in AD [Grunwald et al., 2002; Schreiter‐Gasser et al., 1993; Soininen et al., 1991] can be reflected by altered cortical rhythm in distributed cortical networks [Sauseng et al., 2008; von Stein and Sarnthein, 2000].
Theta and alpha phase synchronizations in the left temporo‐frontal connection during deviant processing were the predominant features to differentiate between young and elderly adults. Age‐related decline has been characterized by the functional disruption of distributed brain networks, such as in the frontoparietal network during executive control processing [Madden et al., 2010], the anterior to posterior components within the default network [Andrews‐Hanna et al., 2007], and interhemispheric coherence during the resting state [Duffy et al., 1996; Kikuchi et al., 2000]. These findings suggest that the coordination of the temporo‐frontal network was ineffective in elderly adults.
This study discovered attenuated synchronization in AD. Further studies with larger populations would need to verify these results, and, in a longitudinal follow‐up evaluation, examine the effect of cognitive impairment severity. The medication effect on the phase synchrony between cortical regions during auditory change detection processing remains unclear. It will be worthwhile to investigate the changes in the temporo‐frontal connection in AD with treatment using cholinesterase inhibitors or Memantine.
CONCLUSIONS
Deteriorated coordination between temporal and frontal regions to auditory deviance input delineated the alterations in AD, even though preserved neural activities were found in the auditory cortex. We suggest that, in the theta band, the loss of synchronization of oscillatory phases in the temporo‐frontal connection, which is engaged in both sensory memory and attentional processes and acts on neural communications, characterizes the cognitive decline in AD.
ACKNOWLEDGMENT
All authors declared no conflicts of interest with respect to the research, authorship, and/or publication of this article.
REFERENCES
- Aftanas LI, Golocheikine SA (2001): Human anterior and frontal midline theta and lower alpha reflect emotionally positive state and internalized attention: High‐resolution EEG investigation of meditation. Neurosci Lett 310:57–60. [DOI] [PubMed] [Google Scholar]
- Alho K, Winkler I, Escera C, Huotilainen M, Virtanen J, Jaaskelainen IP, Pekkonen E, Ilmoniemi RJ (1998): Processing of novel sounds and frequency changes in the human auditory cortex: Magnetoencephalographic recordings. Psychophysiology 35:211–224. [PubMed] [Google Scholar]
- Andrews‐Hanna JR, Snyder AZ, Vincent JL, Lustig C, Head D, Raichle ME, Buckner RL (2007): Disruption of large‐scale brain systems in advanced aging. Neuron 56:924–935. [DOI] [PMC free article] [PubMed] [Google Scholar]
- Arnold SE, Hyman BT, Flory J, Damasio AR, Van Hoesen GW (1991): The topographical and neuroanatomical distribution of neurofibrillary tangles and neuritic plaques in the cerebral cortex of patients with Alzheimer's disease. Cereb Cortex 1:103–116. [DOI] [PubMed] [Google Scholar]
- Arnold SE, Hyman BT, Van Hoesen GW (1994): Neuropathologic changes of the temporal pole in Alzheimer's disease and Pick's disease. Arch Neurol 51:145–150. [DOI] [PubMed] [Google Scholar]
- C Babiloni, R Ferri, G Binetti, A Cassarino, G Dal Forno, M Ercolani, F Ferreri, GB Frisoni, B Lanuzza, C Miniussi, F Nobili, G Rodriguez, F Rundo, CJ Stam, T Musha, F Vecchio, PM Rossini (2006): Fronto‐parietal coupling of brain rhythms in mild cognitive impairment: A multicentric EEG study. Brain Res Bull 69:63–73. [DOI] [PubMed] [Google Scholar]
- Babiloni C, Vecchio F, Lizio R, Ferri R, Rodriguez G, Marzano N, Frisoni GB, Rossini PM (2011): Resting state cortical rhythms in mild cognitive impairment and Alzheimer's disease: Electroencephalographic evidence. J Alzheimers Dis 26(Suppl 3):201–214. [DOI] [PubMed] [Google Scholar]
- Basar E, Basar‐Eroglu C, Karakas S, Schurmann M (2001): Gamma, alpha, delta, and theta oscillations govern cognitive processes. Int J Psychophysiol 39:241–248. [DOI] [PubMed] [Google Scholar]
- Bouras C, Hof PR, Giannakopoulos P, Michel JP, Morrison JH (1994): Regional distribution of neurofibrillary tangles and senile plaques in the cerebral cortex of elderly patients: A quantitative evaluation of a one‐year autopsy population from a geriatric hospital. Cereb Cortex 4:138–150. [DOI] [PubMed] [Google Scholar]
- Bronnick KS, Nordby H, Larsen JP, Aarsland D (2010): Disturbance of automatic auditory change detection in dementia associated with Parkinson's disease: A mismatch negativity study. Neurobiol Aging 31:104–113. [DOI] [PubMed] [Google Scholar]
- Cooper RJ, Todd J, McGill K, Michie PT (2006): Auditory sensory memory and the aging brain: A mismatch negativity study. Neurobiol Aging 27:752–762. [DOI] [PubMed] [Google Scholar]
- DeCarli C (2001): The role of neuroimaging in dementia. Clin Geriatr Med 17:255–279. [DOI] [PubMed] [Google Scholar]
- Delbeuck X, Van der Linden M, Collette F (2003): Alzheimer's disease as a disconnection syndrome? Neuropsychol Rev 13:79–92. [DOI] [PubMed] [Google Scholar]
- Duffy FH, McAnulty GB, Albert MS (1996): Effects of age upon interhemispheric EEG coherence in normal adults. Neurobiol Aging 17:587–599. [DOI] [PubMed] [Google Scholar]
- Fabiani M, Friedman D (1995): Changes in brain activity patterns in aging: The novelty oddball. Psychophysiology 32:579–594. [DOI] [PubMed] [Google Scholar]
- Fisher NI (1993): Statistical Analysis of Circular Data. Cambridge: Cambridge University Press. [Google Scholar]
- Folstein MF, Folstein SE, McHugh PR (1975): “Mini‐mental state”. A practical method for grading the cognitive state of patients for the clinician. J Psychiatr Res 12:189–198. [DOI] [PubMed] [Google Scholar]
- Gaeta H, Friedman D, Ritter W, Cheng J (1998): An event‐related potential study of age‐related changes in sensitivity to stimulus deviance. Neurobiol Aging 19:447–459. [DOI] [PubMed] [Google Scholar]
- Gaeta H, Friedman D, Ritter W, Cheng J (1999): Changes in sensitivity to stimulus deviance in Alzheimer's disease: An ERP perspective. Neuroreport 10:281–287. [DOI] [PubMed] [Google Scholar]
- Gazzaley A, Cooney JW, Rissman J, D'Esposito M (2005): Top‐down suppression deficit underlies working memory impairment in normal aging. Nat Neurosci 8:1298–300. [DOI] [PubMed] [Google Scholar]
- Giard MH, Perrin F, Pernier J, Bouchet P (1990): Brain generators implicated in the processing of auditory stimulus deviance: A topographic event‐related potential study. Psychophysiology 27:627–640. [DOI] [PubMed] [Google Scholar]
- Grunwald M, Busse F, Hensel A, Riedel‐Heller S, Kruggel F, Arendt T, Wolf H, Gertz HJ (2002): Theta‐power differences in patients with mild cognitive impairment under rest condition and during haptic tasks. Alzheimer Dis Assoc Disord 16:40–48. [DOI] [PubMed] [Google Scholar]
- Guntekin B, Saatci E, Yener G (2008): Decrease of evoked delta, theta and alpha coherences in Alzheimer patients during a visual oddball paradigm. Brain Res 1235:109–116. [DOI] [PubMed] [Google Scholar]
- Gunter TC, Jackson JL, Mulder G (1996): Focussing on aging: An electrophysiological exploration of spatial and attentional processing during reading. Biol Psychol 43:103–145. [DOI] [PubMed] [Google Scholar]
- Hamalainen MS, Ilmoniemi RJ (1994): Interpreting magnetic fields of the brain: Minimum norm estimates. Med Biol Eng Comput 32:35–42. [DOI] [PubMed] [Google Scholar]
- Hari R, Rif J, Tiihonen J, Sams M (1992): Neuromagnetic mismatch fields to single and paired tones. Electroencephalogr Clin Neurophysiol 82:152–154. [DOI] [PubMed] [Google Scholar]
- Hogan MJ, Swanwick GR, Kaiser J, Rowan M, Lawlor B (2003): Memory‐related EEG power and coherence reductions in mild Alzheimer's disease. Int J Psychophysiol 49:147–163. [DOI] [PubMed] [Google Scholar]
- Hsiao FJ, Cheng CH, Chen WT, Lin YY (2013a): Neural correlates of somatosensory paired‐pulse suppression: A MEG study using distributed source modeling and dynamic spectral power analysis. Neuroimage 72:133–142. [DOI] [PubMed] [Google Scholar]
- Hsiao FJ, Cheng CH, Liao KK, Lin YY (2010): Cortico‐cortical phase synchrony in auditory mismatch processing. Biol Psychol 84:336–345. [DOI] [PubMed] [Google Scholar]
- Hsiao FJ, Wang YJ, Yan SH, Chen WT, Lin YY (2013b): Altered oscillation and synchronization of default‐mode network activity in mild Alzheimer's disease compared to mild cognitive impairment: An electrophysiological study. PLoS One 8:e68792. [DOI] [PMC free article] [PubMed] [Google Scholar]
- Hsiao FJ, Wu ZA, Ho LT, Lin YY (2009): Theta oscillation during auditory change detection: An MEG study. Biol Psychol 81:58–66. [DOI] [PubMed] [Google Scholar]
- Jaaskelainen IP, Varonen R, Naatanen R, Pekkonen E (1999): Decay of cortical pre‐attentive sound discrimination in middle‐age. Neuroreport 10:123–126. [PubMed] [Google Scholar]
- Jensen O, Tesche CD (2002): Frontal theta activity in humans increases with memory load in a working memory task. Eur J Neurosci 15:1395–1399. [DOI] [PubMed] [Google Scholar]
- Kazmerski VA, Friedman D, Ritter W (1997): Mismatch negativity during attend and ignore conditions in Alzheimer's disease. Biol Psychiatry 42:382–402. [DOI] [PubMed] [Google Scholar]
- Kikuchi M, Wada Y, Koshino Y, Nanbu Y, Hashimoto T (2000): Effect of normal aging upon interhemispheric EEG coherence: Analysis during rest and photic stimulation. Clin Electroencephalogr 31:170–174. [DOI] [PubMed] [Google Scholar]
- Klimesch W (1996): Memory processes, brain oscillations and EEG synchronization. Int J Psychophysiol 24:61–100. [DOI] [PubMed] [Google Scholar]
- Korzyukov O, Alho K, Kujala A, Gumenyuk V, Ilmoniemi RJ, Virtanen J, Kropotov J, Naatanen R (1999): Electromagnetic responses of the human auditory cortex generated by sensory‐memory based processing of tone‐frequency changes. Neurosci Lett 276:169–172. [DOI] [PubMed] [Google Scholar]
- Lachaux JP, Rodriguez E, Martinerie J, Varela FJ (1999): Measuring phase synchrony in brain signals. Hum Brain Mapp 8:194–208. [DOI] [PMC free article] [PubMed] [Google Scholar]
- Lin FH, Witzel T, Ahlfors SP, Stufflebeam SM, Belliveau JW, Hamalainen MS (2006): Assessing and improving the spatial accuracy in MEG source localization by depth‐weighted minimum‐norm estimates. Neuroimage 31:160–171. [DOI] [PubMed] [Google Scholar]
- Lin YY, Hsiao FJ, Shih YH, Yiu CH, Yen DJ, Kwan SY, Wong TT, Wu ZA, Ho LT (2007): Plastic phase‐locking and magnetic mismatch response to auditory deviants in temporal lobe epilepsy. Cereb Cortex 17:2516–2525. [DOI] [PubMed] [Google Scholar]
- Lindin M, Correa K, Zurron M, Diaz F (2013): Mismatch negativity (MMN) amplitude as a biomarker of sensory memory deficit in amnestic mild cognitive impairment. Front Aging Neurosci 5:79. [DOI] [PMC free article] [PubMed] [Google Scholar]
- Logan JM, Sanders AL, Snyder AZ, Morris JC, Buckner RL (2002): Under‐recruitment and nonselective recruitment: Dissociable neural mechanisms associated with aging. Neuron 33:827–840. [DOI] [PubMed] [Google Scholar]
- Madden DJ, Costello MC, Dennis NA, Davis SW, Shepler AM, Spaniol J, Bucur B, Cabeza R (2010): Adult age differences in functional connectivity during executive control. Neuroimage 52:643–657. [DOI] [PMC free article] [PubMed] [Google Scholar]
- McDowd JM, Filion DL (1992): Aging, selective attention, and inhibitory processes: A psychophysiological approach. Psychol Aging 7:65–71. [DOI] [PubMed] [Google Scholar]
- GM McKhann, DS Knopman, H Chertkow, BT Hyman, CR Jack, Jr., CH Kawas, WE Klunk, WJ Koroshetz, JJ Manly, R Mayeux, RC Mohs, JC Morris, MN Rossor, P Scheltens, MC Carrillo, B Thies, S Weintraub, CH Phelps (2011): The diagnosis of dementia due to Alzheimer's disease: Recommendations from the National Institute on Aging‐Alzheimer's Association workgroups on diagnostic guidelines for Alzheimer's disease. Alzheimers Dement 7:263–269. [DOI] [PMC free article] [PubMed] [Google Scholar]
- Morris JC (1993): The Clinical Dementia Rating (CDR): Current version and scoring rules. Neurology 43:2412–2414. [DOI] [PubMed] [Google Scholar]
- Naatanen R (2000): Mismatch negativity (MMN): Perspectives for application. Int J Psychophysiol 37:3–10. [DOI] [PubMed] [Google Scholar]
- Naatanen R, Gaillard AW, Mantysalo S (1978): Early selective‐attention effect on evoked potential reinterpreted. Acta Psychol (Amst) 42:313–329. [DOI] [PubMed] [Google Scholar]
- Naatanen R, Michie PT (1979): Early selective‐attention effects on the evoked potential: A critical review and reinterpretation. Biol Psychol 8:81–136. [DOI] [PubMed] [Google Scholar]
- Parasuraman R, Nestor P (1993): Attention and driving. Assessment in elderly individuals with dementia. Clin Geriatr Med 9:377–387. [PubMed] [Google Scholar]
- Pekkonen E (2000): Mismatch negativity in aging and in Alzheimer's and Parkinson's diseases. Audiol Neurootol 5:216–224. [DOI] [PubMed] [Google Scholar]
- Pekkonen E, Jaaskelainen LP, Erkinjuntti T, Hietanen M, Huotilainen M, Ilmoniemi RJ, Naatanen R (2001): Preserved stimulus deviance detection in Alzheimer's disease. Neuroreport 12:1649–1652. [DOI] [PubMed] [Google Scholar]
- Pekkonen E, Jousmaki V, Kononen M, Reinikainen K, Partanen J (1994): Auditory sensory memory impairment in Alzheimer's disease: An event‐related potential study. Neuroreport 5:2537–2540. [DOI] [PubMed] [Google Scholar]
- Pekkonen E, Jousmaki V, Partanen J, Karhu J (1993): Mismatch negativity area and age‐related auditory memory. Electroencephalogr Clin Neurophysiol 87:321–325. [DOI] [PubMed] [Google Scholar]
- Pekkonen E, Rinne T, Reinikainen K, Kujala T, Alho K, Naatanen R (1996): Aging effects on auditory processing: An event‐related potential study. Exp Aging Res 22:171–184. [DOI] [PubMed] [Google Scholar]
- Pijnenburg YA, v d Made Y, van Cappellen van Walsum AM, Knol DL, Scheltens P, Stam CJ (2004): EEG synchronization likelihood in mild cognitive impairment and Alzheimer's disease during a working memory task. Clin Neurophysiol 115:1332–1339. [DOI] [PubMed] [Google Scholar]
- Rinne T, Alho K, Ilmoniemi RJ, Virtanen J, Naatanen R (2000): Separate time behaviors of the temporal and frontal mismatch negativity sources. Neuroimage 12:14–29. [DOI] [PubMed] [Google Scholar]
- Sams M, Kaukoranta E, Hamalainen M, Naatanen R (1991): Cortical activity elicited by changes in auditory stimuli: Different sources for the magnetic N100m and mismatch responses. Psychophysiology 28:21–29. [DOI] [PubMed] [Google Scholar]
- Sarnthein J, Petsche H, Rappelsberger P, Shaw GL, von Stein A (1998): Synchronization between prefrontal and posterior association cortex during human working memory. Proc Natl Acad Sci USA 95:7092–7096. [DOI] [PMC free article] [PubMed] [Google Scholar]
- Sauseng P, Klimesch W, Gruber WR, Birbaumer N (2008): Cross‐frequency phase synchronization: A brain mechanism of memory matching and attention. Neuroimage 40:308–317. [DOI] [PubMed] [Google Scholar]
- Schreiter‐Gasser U, Gasser T, Ziegler P (1993): Quantitative EEG analysis in early onset Alzheimer's disease: A controlled study. Electroencephalogr Clin Neurophysiol 86:15–22. [DOI] [PubMed] [Google Scholar]
- Selkoe DJ (1994): Cell biology of the amyloid beta‐protein precursor and the mechanism of Alzheimer's disease. Annu Rev Cell Biol 10:373–403. [DOI] [PubMed] [Google Scholar]
- Soininen H, Partanen J, Laulumaa V, Paakkonen A, Helkala EL, Riekkinen PJ (1991): Serial EEG in Alzheimer's disease: 3 year follow‐up and clinical outcome. Electroencephalogr Clin Neurophysiol 79:342–348. [DOI] [PubMed] [Google Scholar]
- Tadel F, Baillet S, Mosher JC, Pantazis D, Leahy RM (2011): Brainstorm: A user‐friendly application for MEG/EEG analysis. Comput Intell Neurosci 2011:879716. [DOI] [PMC free article] [PubMed] [Google Scholar]
- Verleger R, Kompf D, Neukater W (1992): Event‐related EEG potentials in mild dementia of the Alzheimer type. Electroencephalogr Clin Neurophysiol 84:332–343. [DOI] [PubMed] [Google Scholar]
- von Stein A, Sarnthein J (2000): Different frequencies for different scales of cortical integration: From local gamma to long range alpha/theta synchronization. Int J Psychophysiol 38:301–313. [DOI] [PubMed] [Google Scholar]
- Yokoyama Y, Nakashima K, Shimoyama R, Urakami K, Takahashi K (1995): Distribution of event‐related potentials in patients with dementia. Electromyogr Clin Neurophysiol 35:431–437. [PubMed] [Google Scholar]