

Abstract
The aim of this study was to assess whether mild cognitive impairment (MCI) is associated with disruption in large‐scale structural networks in newly diagnosed, drug‐naïve patients with Parkinson's disease (PD). Graph theoretical analyses were applied to 3T MRI data from 123 PD patients and 56 controls from the Parkinson's progression markers initiative (PPMI). Thirty‐three patients were classified as having Parkinson's disease with mild cognitive impairment (PD‐MCI) using the Movement Disorders Society Task Force criteria, while the remaining 90 PD patients were classified as cognitively normal (PD‐CN). Global measures (clustering coefficient, characteristic path length, global efficiency, small‐worldness) and regional measures (regional clustering coefficient, regional efficiency, hubs) were assessed in the structural networks that were constructed based on cortical thickness and subcortical volume data. PD‐MCI patients showed a marked reduction in the average correlation strength between cortical and subcortical regions compared with controls. These patients had a larger characteristic path length and reduced global efficiency in addition to a lower regional efficiency in frontal and parietal regions compared with PD‐CN patients and controls. A reorganization of the highly connected regions in the network was observed in both groups of patients. This study shows that the earliest stages of cognitive decline in PD are associated with a disruption in the large‐scale coordination of the brain network and with a decrease of the efficiency of parallel information processing. These changes are likely to signal further cognitive decline and provide support to the role of aberrant network topology in cognitive impairment in patients with early PD. Hum Brain Mapp 36:2980–2995, 2015. © 2015 Wiley Periodicals, Inc.
Keywords: graph theory, structural co‐variance networks, characteristic path length, global efficiency, hubs
INTRODUCTION
Mild cognitive impairment (MCI) has a strong impact on quality of life and frequently progresses to dementia in patients with Parkinson's disease (PD) (Svenningsson et al., 2012). A global study of cerebral network disruption can provide critical insights into the topological patterns underlying cognitive decline in PD, going beyond the study of localized brain regions and their association with clinical impairment. Such an approach is perfectly suited to assess cognitive functions, which are not attributable to individual brain areas but rather emerge from the network organization of the whole brain and its interactions (Filippi et al., in press). The ideal tool to examine the structural brain networks is provided by graph theory analysis (Bullmore and Sporns, 2009). This framework relies on the notion that brain regions that are highly correlated in cortical thickness or volume (Alexander‐Bloch et al., 2013a; Bassett et al., 2008; He et al., 2007;) are often part of networks that subserve behavioral or cognitive functions (Alexander‐Bloch et al., 2013a; Bohbot et al., 2007; Lerch et al., 2006). These networks of structural co‐variance (He et al., 2007) partially overlap with the functional networks of healthy subjects and the targets of gray matter atrophy in neurodegenerative disorders (Alexander‐Bloch et al., 2013a).
The notion that PD is related to abnormal functional and structural connectivity has received support in the past few years. On the one hand, there is increasing evidence showing abnormal connectivity between the basal ganglia and motor regions (Helmich et al., 2010; Kwak et al., 2010) as well as decreased functional coupling between areas of the default‐mode network in these patients (van Eimeren et al., 2009). On the other hand, diffusion tensor imaging has revealed reduced integrity of frontal, temporal, and parietal white matter connections in PD patients with MCI (Agosta et al., 2013; Melzer et al., 2013).
Despite this evidence, studies assessing network organization in PD using graph theory remain scarce. The only studies that performed such analyses used functional MRI (Baggio et al., in press; Skidmore et al., 2011; Wu et al., 2010) or magnetoencephalography (Olde Dubbelink et al., 2014) in patients at different disease stages that were mostly under the effects of dopaminergic medication, which can affect the network measures and mask the effects of PD on cognition.
Here, we apply for the first time graph theory analysis to assess the large‐scale structural networks in a large, de novo, drug‐naïve cohort of PD patients. Recent studies have shown that amyloid pathology and a posterior pattern of cortical atrophy, both typical of Alzheimer's disease (AD), can predict cognitive decline in PD (Alves et al., 2014; Siderowf et al., 2010; Weintraub et al., 2012); hence, we hypothesized that MCI in PD would be associated with structural network disruptions analogous to the ones occurring in AD, including alterations in the communication between distant brain areas and breakdown of highly connected regions (He et al., 2008; Yao et al., 2010). We tested this hypothesis by assessing the interconnections between a region's neighboring areas (clustering coefficient) (Luce and Perry, 1949), the overall distance between any two regions (characteristic path length) (Dijkstra, 1959), the balance between local and global connectivity (small‐worldness) (Bassett and Bullmore, 2006; Watts and Strogatz, 1998) and the highly connected regions of the network with a key role in interregional communication (network hubs) (Sporns et al., 2007; van den Heuvel and Sporns, 2013).
MATERIALS AND METHODS
Participants
All subjects included in the current study were enrolled in the Parkinson's Progression Markers Initiative (Parkinson progression marker initiative, 2011, http://www.ppmi-info.org/data; accessed in March 2013). PD patients were diagnosed within 2 years of the screening visit, were entirely untreated, had a Hoehn and Yahr (1967) stage of I or II, and were required to have a dopamine transporter deficit on DaTSCAN imaging. Years of disease duration, motor severity assessed by part III of the MDS unified Parkinson's disease rating scale (UPDRS) (Goetz et al., 2007) and disability by Schwab and England scale (Fahn and Elton, 1987) were obtained from all patients. Psychiatric assessment included the 15‐item geriatric depression scale (GDS) (Sheikh and Yesavage, 1986). Healthy controls were included based on the following criteria: no neurological dysfunction, no first‐degree family member with PD, cognitively normal as defined by a Montreal cognitive assessment (MoCA) score >26, and no detectable dopaminergic deficit on DaTSCAN.
In this study, we only included subjects whose volumetric MRI was acquired on a 3T Siemens system and passed quality control before and after image preprocessing. All subjects underwent a comprehensive neuropsychological test battery that evaluated specific cognitive domains: the 15‐item version of the Benton's judgment of line orientation test (visuospatial); total immediate recall and delayed recall of the Hopkins verbal learning test‐revised (HVLT‐R; verbal memory); three semantic fluency tests (names of animals, fruits, and vegetables) and the phonemic fluency subtest of MoCA (executive); the letter number sequencing test and the symbol digit modalities test (SDMT; attention). The classification of MCI was performed by an approximation to the guidelines of the movement disorders society (MDS) Task Force for the diagnosis of PD with MCI (PD‐MCI) (Litvan et al., 2012) as published elsewhere (Pereira et al., 2014) and presented in Supporting Information. Patients with PD who did not fulfill the criteria for MCI were classified as cognitively normal patients (PD‐CN).
The PPMI study was approved by the institutional review board of all participating sites and written informed consent was obtained from all participants before inclusion in the study.
MRI Acquisition
All three‐dimensional T1‐weighted MRI scans were acquired in the sagittal plane on 3T Siemens scanners (Erlangen, Germany) at different centers using a MP‐RAGE sequence. The acquisition parameters were as follows: repetition time = 2,300/1,900 ms; echo time = 2.98/2.96/2.27/2.48/2.52 ms; inversion time = 900 ms; flip angle: 9°; matrix = 240 × 256/256 × 256; voxel = 1 × 1 × 1 mm3. Based on previously published quality control criteria (Simmons et al., 2011), several subjects were excluded due to field distortions (14 subjects: all PD patients scanned at the same center, 7.9%), intensity inhomogeneities (2 subjects: 1 PD patient, 0.6%; 1 control; 1%), brain injuries (5 subjects: 3 PD patients, 1.7%; 2 controls, 1.1%), and motion artefacts (42 subjects: 25 PD patients, 14.1%; 17 controls, 17.5%).
MRI Preprocessing
The FreeSurfer software (version 5.3, http://surfer.nmr.mgh.harvard.edu/fswiki) was used to provide a measure of cortical thickness at each vertex of the cortical surface (Dale et al., 1999; Fischl and Dale, 2000; Fischl et al., 1999, 2004) as well as volumes of subcortical structures. These measures were obtained in an automated way after image preprocessing using an application included in the Freesurfer distribution called Query design estimate contrast. Preprocessing consisted of removal of nonbrain tissue using a watershed/surface deformation procedure (Segonne et al., 2004) and an automated transformation to Talairach space. Then, segmentation of subcortical white matter and deep gray matter structures including the hippocampus, amygdala, putamen, caudate, thalamus, and nucleus accumbens, was performed using a technique that automatically assigns a neuroanatomical label to each voxel based on probabilistic information from a manually labeled and segmented training set (Fischl et al., 2002). This classification technique uses both global and local spatial information for subcortical segmentation. The global information is encoded by distributing classifiers throughout an atlas volume and maintaining class statistics on a per‐class, per‐location basis, allowing the classifiers to be robust to variations in the contrast properties of an anatomical class over space. The local information is incorporated into the classification procedure by modeling the segmentation as a nonstationary anisotropic Markov random field (Fischl et al., 2002). After subcortical segmentation, intensity normalization (Sled et al., 1998), tessellation of the gray matter–white matter boundary and automated topology correction (Fischl et al., 2001; Segonne et al., 2007) were performed. Deformation of the surfaces was performed following intensity gradients to optimally place the gray/white and gray/cerebrospinal fluid borders at the location where the greatest shift in intensity defines the transition to the other tissue class. Once the cortical models were complete, registration to a spherical atlas took place that utilizes individual cortical folding patterns to match cortical geometry across subjects (Fischl et al., 1999). This was followed by parcellation of the cerebral cortex into units based on gyral and sulcal structure following the nomenclature described in Destrieux et al. (2010). Most of the cortical surface of the brain is hidden in the sulci. For this reason, the Destrieux atlas also parcellates gray matter regions embedded in brain sulci, classifying them as sulcal gray matter regions and providing a more precise description of the cortical surface with good manual concordance to the Duvernoy's atlas (Duvernoy et al., 1991). Hence, for each hemisphere, a total of 74 different structures were identified corresponding to the cortical thickness of gray matter regions located in the cortical gyri and sulci (Supporting Information Table 1). In addition, seven subcortical volumes were also included: hippocampus, amygdala, accumbens, pallidum, thalamus, putamen, and caudate. Using tkmedit, all preprocessing steps performed in FreeSurfer were visually inspected to ensure they had been performed correctly. As a result, 14 subjects (5 PD patients, 2.8%; 9 controls, 9.3%) were excluded due to incorrect definition of the pial surface and gray/white matter boundaries, in addition to 18 subjects (6 PD patients, 3.4%; 12 controls, 12.4%) due to segmentation errors.
Network Analysis
Cortical networks were constructed for each group using the structural co‐variance method (Alexander‐Bloch et al., 2013a; He et al., 2007). The nodes in the network correspond to the 148 cortical regions provided by the Destrieux atlas in addition to 14 subcortical structures, both included in FreeSurfer (version 5.3, http://surfer.nmr.mgh.harvard.edu/fswiki) (Supporting Information Table 1). To date, most studies have analyzed structural networks with graph theory using cortical thickness or volumes. In the current study, we used both thickness and volume measures as there is evidence showing cortical thickness is more sensitive to gray matter changes occurring in PD (Pereira et al., 2012) and that these patients also show abnormalities in subcortical structures (Kehagia et al., 2010). As Freesurfer does not provide measures for subcortical structures other than volume, we decided to include these volumes to build the networks. A similar approach has been used by a previous study assessing networks based both on cortical thickness and cerebellar volume measures (Hosseini et al., 2013). However, to ensure that our results were not driven by the fact we used different anatomical measures, we also built the networks using only cortical thickness and analyzed these networks as a supplementary analysis.
In this study, the strength of the connections corresponds to the structural correlation between brain regions, assessed across each group, and the overall connectivity of the network can be evaluated using the average structural correlation strength. The edges between nodes are introduced when the correlation strength between the corresponding brain regions exceeds a certain threshold. The measures of cortical thickness were adjusted by linear regression to remove potential confounding effects of age and gender, while the measures of subcortical volumes were adjusted by linear regression to remove potential confounding effects of age, gender, and intracranial volume. Cortical thickness measures were not corrected for intracranial volume (ICV) because they do not scale with head size (http://freesurfer.net/fswiki/eTIV) (Westman et al., 2013). However, some studies have corrected the cortical thickness of every brain region by the mean thickness of the whole brain before analyzing the structural covariance networks (Bernhardt et al., 2011; He et al., 2007). Hence, in this study, we also built and assessed the structural networks after applying this additional control.
The resulting residuals were used to substitute for the raw values. In total, the residuals of 148 cortical regions (74 per hemisphere) in addition to 14 subcortical volumes (7 per hemisphere) were included, leading to a grand total of 162 regions. Therefore, the structural correlation networks for controls, PD‐CN and PD‐MCI patients were computed based on a 162 × 162 association matrix created for each group, with each entry defined as the Pearson correlation coefficient between every pair of anatomical measures. We note that this association matrix is symmetric (i.e., there is no preferential directionality in the connections). Because of methodological challenges in analyzing and comparing weighted networks (Rubinov and Sporns, 2011), we proceeded to construct a (undirected) binary network with a given sparsity (i.e., fraction of active connections to all possible connections) from each association matrix, where the correlation coefficient was considered one if it was above a certain threshold indicating the presence of a structural correlation between two brain regions, and zero if it was below the threshold indicating there was not a significant correlation between two regions.
This was achieved by fixing a threshold that permitted us to attain a given common sparsity for the three groups. Hence, we thresholded the constructed association matrices under different network sparsity levels ranging from Smin = 2% to Smax = 12%, in steps of 0.5% and compared the network topologies across that range. For sparsities above 12%, the graphs became increasingly similar to random graphs (i.e., small‐world index close to 1) and, thus, uninteresting for the purpose of our study. For sparsities below 2%, the number of connections was inferior to the number of nodes, corresponding to a network with many single unconnected nodes. Hence, we defined 2% as the lower limit of our range of sparsities as it does not make sense to assess global and regional measures in a widely disconnected network.
At 2% sparsity, all edges had a correlation coefficient that was above 0.639 in controls, 0.601 in the PD‐CN group and 0.536 in the PD‐MCI group. At 12% sparsity, all edges were also significant and had a correlation coefficient that was above 0.487 in controls, 0.446 in the PD‐CN group and 0.375 in the PD‐MCI group. We only included positive suprathreshold correlations in our network analyses, based on the observation by Gong et al. (2012) that only positive thickness correlations are mediated by direct fiber pathways. In addition, the formulas that we used to compute the network measures are not able to quantify the role of negative correlations in global network organization at the moment. These formulas were taken from the Brain Connectivity Toolbox (https://sites.google.com/site/bctnet/) (Rubinov and Sporns, 2010). We used the BrainNet Viewer (http://www.nitrc.org/projects/bnv /) for network visualization (Xia et al., 2013).
We note that the use of structural co‐variance networks is justified as they can result from structural connectivity based on the physical connection of white matter tracts (Gong et al., 2012) or functional connectivity based on synchronous neural activation (Alexander‐Bloch et al., 2013b). In addition, structural correlations might also occur between brain regions due to their connectivity to a third region or shared mechanisms in neurodegeneration (Zhu et al., 2012). This approach has been used to assess brain network structure in normal aging (Zhu et al., 2012), AD (He et al., 2008), schizophrenia (Bassett et al., 2008), multiple sclerosis (He et al., 2009a), epilepsy (Bernhardt et al., 2011), and depression (Singh et al., 2013).
To detect differences between groups in the regional network organization, we assessed the regional clustering coefficient, the regional efficiency, and the network hubs. The regional clustering coefficient is a measure of how strongly a node is locally interconnected; it is measured as the fraction of the node's neighbors that are also neighbors of each other (Rubinov and Sporns, 2010), that is, the fraction of triangles present around the node. The regional efficiency quantifies how efficiently information can be transmitted from a node to the rest of the network and vice versa; it is assessed as the average of the inverse shortest path length from the node to each other node in the graph (Achard and Bullmore, 2007). The network hubs are the nodes that play a critical role in the attainment and regulation of the information flow over the network (van den Heuvel and Sporns, 2013); typically, they have a large number of connections to other nodes (high degree) and are traversed by a large fraction of shortest paths between pairs of nodes belonging to the network (high betweenness centrality). Depending on their location in the brain, the network hubs can be classified into heteromodal, unimodal, paralimbic, and primary sensorimotor (Mesulam, 1998). In this study, the hubs were identified as the nodes with both a degree and betweenness centrality that was one SD above the network averages.
To detect differences between groups in the overall network architecture, we analyzed four global network measures: the mean clustering coefficient, the global efficiency, the characteristic path length, and the small‐worldness. The mean clustering coefficient and the global efficiency are the average of the regional clustering coefficient and the regional efficiency of all nodes, respectively. The characteristic path length is the average of the minimum number of connections that link any two nodes in the network. The small‐worldness is a measure of how much a network is locally interconnected compared with a random network but still retaining global connectivity between distant brain regions (Watts and Strogatz, 1998). In other words, a small‐world network has a higher clustering coefficient but a similar characteristic path length compared with the one of a random network (Watts and Strogatz, 1998). In the current study, the results obtained in the global network analyses were confirmed with another atlas (Desikan atlas; Desikan et al., 2006), also provided by FreeSurfer. All measures were calculated taking into account the presence of disconnected components in the network, as implemented in the formulas by Rubinov and Sporns (2010). This is particularly important for the characteristic path length, which was calculated only within connected components. The global (and regional) efficiency can be meaningfully computed on disconnected networks, as paths between disconnected nodes are considered to have infinite length and zero efficiency (Rubinov and Sporns, 2010). The average (and regional) clustering coefficient may also be calculated in disconnected networks; if a node has less than two connected neighbors then it will have a regional clustering coefficient of zero. The details regarding the formal definition of the measures have been included in Supporting Information.
Comparison of Network Measures Between Groups
Global and regional network measures were computed for each group. To test the statistical significance of the differences between groups, we performed nonparametric permutation tests (Bassett et al., 2008; He et al., 2008) with 1,000 replicates. First, we randomly reallocated each participant's set of regional anatomical measures to one of each pair of groups with the same number of subjects as in the original groups and recalculated the correlation matrix for each randomized group. The corresponding binary matrices were then estimated using the same range of sparsity thresholds as in the real brain networks. The network parameters were computed for each randomized group and the differences between groups were calculated. This randomization procedure was repeated 1,000 times for every sparsity threshold value and the 95% confidence intervals (CI) of each distribution were used as critical values for a one‐tailed test of the null hypothesis at P < 0.05. In the current study, we applied a conservative threshold by requiring results to be significant at all sparsities. In addition, to adjust the regional network results for multiple comparisons, a false discovery rate (Genovese et al., 2002) procedure was also applied to control for the number of regions that were tested at a q value of 0.05.
To further confirm that the results obtained in this study were not influenced by the presence of disconnected components, we also compared the network measures obtained from the weighted networks of each group as these were all connected and did not have any disconnected nodes.
Statistical Analyses
Differences between groups in demographic and neuropsychological variables were analyzed using Mann–Whitney U tests for non‐normally distributed data, Student's T‐test for normally distributed data, and Pearson's chi‐squared test for categorical data in SPSS 20.0. The construction and analyses of structural brain networks were conducted in MATLAB 8.1 (2013b) using the Brain Connectivity Toolbox (https://sites.google.com/site/bctnet/) (Rubinov and Sporns, 2010).
RESULTS
After excluding subjects with an MRI scanner that did not pass quality control or showed preprocessing errors, the final sample size consisted of 56 controls and 123 PD patients as shown in Table 1. Following the MDS criteria (Litvan et al., 2012), 33 out of 123 PD patients were classified as having PD‐MCI, while the remaining 90 PD patients were classified as PD‐CN (Table 1). PD‐MCI patients were significantly older, more frequently male and performed worse on all cognitive tests compared with controls, except in the phonemic fluency test (P < 0.05; Table 1). Moreover, these patients obtained significantly lower scores in all cognitive tests compared with PD‐CN patients, except in the semantic and phonemic fluency tests (P < 0.05; Table 1). PD‐CN patients obtained significantly lower scores in the SDMT compared with controls (P < 0.05; Table 1).
Table 1.
Characteristics of healthy controls, PD‐CN patients, and PD‐MCI patients
| Controls (n = 56) | All patients (n = 123) | PD‐CN patients (n = 90) | PD‐MCI patients (n = 33) | Controls versus PD‐CN (P value)a | Controls versus PD‐MCI (P value)a | PD‐CN versus PD‐MCI (P value)a | |
|---|---|---|---|---|---|---|---|
| Age, years (mean, std, range) | 58.0(10.4) | 60.5(9.5) | 59.4(10.0) | 63.4(7.6) | 0.467 | 0.018 | 0.058 |
| [30–78] | [37–77] | [37–77] | [49–76] | ||||
| Gender (% male) | 58.9% | 61.0% | 61.1% | 60.6% | 0.069 | 0.024 | 0.003 |
| Education, years (mean, std) | 15.5(2.8) | 15.3(2.9) | 15.5(2.6) | 14.6(3.4) | 0.880 | 0.279 | 0.202 |
| MoCA total score (mean, std; range) | 28.1(1.2) | 27.4(2.2) | 28.1(1.5) | 25.7(2.7) | 0.805 | <0.001 | <0.001 |
| (26–30) | (19–30) | (24–30) | (19–29) | ||||
| UPDRS‐III (mean, std,) | – | 20.1(8.7) | 19.6(8.9) | 21.5(8.2) | – | – | 0.178 |
| Hoehn and Yahr stage (median) | – | 2.0 | 2.0 | 2.0 | – | – | 0.555 |
| Disease duration, months (mean, std) | – | 6.6 (7.2) | 6.8 (7.3) | 6.2 (6.8) | – | – | 0.448 |
| GDS (mean, std) | 5.4(1.7) | 5.1(1.4) | 5.1(1.4) | 5.2(1.6) | 0.234 | 0.590 | 0.701 |
| Schwab and England ADL (mean, std) | – | 94.7(5.5) | 94.9(5.3) | 94.1(5.9) | – | – | 0.534 |
| Benton's judgment line orientation (mean, std) | 13.1(1.9) | 12.9(2.1) | 13.3(1.8) | 11.9(2.3) | 0.593 | 0.011 | 0.003 |
| Total immediate recall (HVLT; mean, std) | 25.9(4.9) | 25.5(5.0) | 26.6(4.4) | 22.4(5.4) | 0.424 | 0.006 | <0.001 |
| Delayed recall (HVLT; mean, std) | 9.4(2.1) | 8.7(2.4) | 9.3(2.0) | 7.2(2.6) | 0.813 | <0.001 | <0.001 |
| Letter and number sequencing (mean, std) | 11.4(2.4) | 10.9(2.9) | 11.5(2.7) | 9.2(2.8) | 0.697 | 0.001 | <0.001 |
| Semantic fluency (mean, std) | 53.0(9.6) | 50.3(12.0) | 51.6(11.8) | 46.8(12.2) | 0.325 | 0.009 | 0.061 |
| Phonemic fluency (MoCA; mean, std) | 13.8(4.4) | 12.8(4.3) | 13.0(3.9) | 12.0(5.3) | 0.488 | 0.071 | 0.149 |
| Symbol and digits modalities test (mean, std) | 47.7(10.3) | 41.2(9.0) | 42.6(8.2) | 37.7(10.3) | 0.003 | <0.001 | 0.038 |
Std, standard deviation.
Calculated using Mann–Whitney U tests to compare groups for age, education, UPDRS‐III, Schwab and England ADL, Benton's judgment line orientation scores, Letter and number sequencing scores, total immediate and delayed recall scores (HVLT), semantic and phonemic fluency scores, Symbol and digits modalities scores; Pearson's chi‐squared tests for gender and Hoehn and Yahr stage; and Student's T‐test for GDS scores.
Global Network Analyses
The weighted correlation matrices, undirected binary matrices and the constructed brain graphs are presented in Figure 1. All groups showed strong correlations between bilaterally homologous regions. A progressive decrease of the average correlation strength was observed from controls (0.26 ± 0.2) to PD‐CN patients (0.23 ± 0.2) and to PD‐MCI patients (0.13 ± 0.2). In particular, PD‐MCI patients showed significantly lower average correlation strength compared with controls and PD‐CN patients after permutation testing (P < 0.01 and P < 0.023, respectively). No significant differences were found in the average correlation strength between controls and PD‐CN patients.
Figure 1.
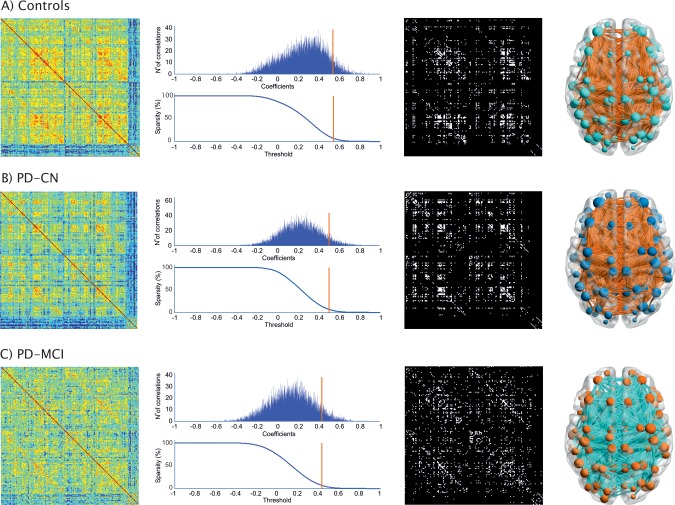
Structural brain networks in healthy controls, PD‐CN patients and PD‐MCI patients. From left to right: weighted correlation matrices of 162 anatomical regions (warmer colors indicate higher correlation coefficients), plots showing the number (N°) of correlations (Y axis) and their correlation coefficients (X axis) at 7% sparsity (orange line—middle value in the range 2–12%; only correlations surviving the threshold, which are located on the right side of the orange line, are included in the binary networks and had a correlation coefficient that was above 0.547 in controls, 0.503 in PD‐CN, and 0.433 in PD‐MCI patients at 7% sparsity), undirected binary connectivity matrices at 7% sparsity, and corresponding brain graphs. From top to bottom: Controls, PD‐CN, and PD‐MCI groups.
In all three groups, using progressively higher values of sparsity, the average clustering coefficient and global efficiency increased (Fig. 2A,B), the characteristic path length decreased (Fig. 2C), and a small‐world topology was observed (Fig. 2D). The differences in the characteristic path length and global efficiency between PD‐MCI patients and controls (Fig. 2E,F) were significant for all sparsities (P range, <0.001–0.04), while no significant differences were found in PD‐CN patients compared with controls or between the two patient groups. The mean clustering coefficient and small‐worldness did not show significant differences at all sparsities between any groups.
Figure 2.
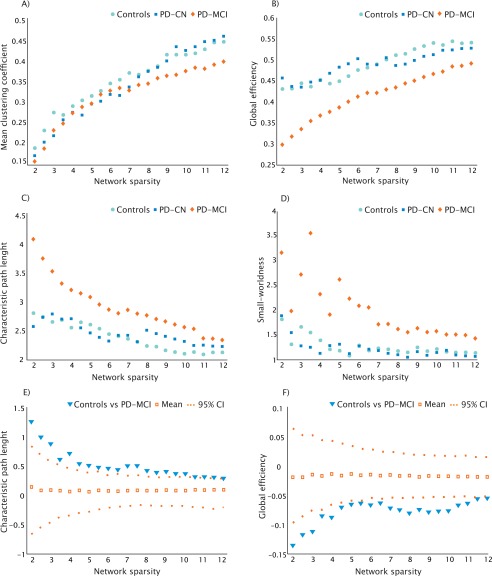
Changes in global network measures and significant differences between groups as a function of network sparsity. Average clustering coefficient (A), global efficiency (B), characteristic path length (C), and small‐worldness (D) of controls (light blue), PD‐CN (dark blue), and PD‐MCI patients (orange) as a function of network sparsity (2–12%). The plots (E) and (F) show the upper and lower bounds of the 95% CI and significant differences in characteristic path length and global efficiency between controls and PD‐MCI patients as a function of sparsity. The triangles show the difference between controls and PD‐MCI groups and, when falling outside the CI, indicate that the difference was statistically significant at P < 0.05. The open squares indicate the mean values of the difference in characteristic path length and global efficiency between the randomized groups after running the permutation tests.
When we analyzed the weighted networks, we also observed a significant increase in the characteristic path length (P < 0.016; 95% CI: −1.20–0.38) and a decrease of the global efficiency (P < 0.011; 95% CI: −0.05–0.09) in PD‐MCI patients compared with controls, suggesting that the findings obtained from the analyses in the binary networks were not influenced by the presence of disconnected components.
In the current study, the global network analyses were also performed in structural networks built with the parcelations provided by the Desikan atlas. This analysis was performed to validate the reproducibility of our findings with different parcelation schemes. The results showed that, in agreement with the findings obtained with the Destrieux atlas, PD‐MCI patients showed significant increases in the path length and reductions of the global efficiency compared with controls at several sparsities (P range, <0.001–0.035), after permutation testing (Supporting Information Table 2).
In addition, we also repeated the global network analyses with the Destrieux atlas after excluding the subcortical volumes. This analysis was performed to address whether there was any influence of mixing cortical thickness with subcortical volumes in our results. We found significant increases in the characteristic path length and decreases in global efficiency in PD‐MCI patients compared with controls at several sparsities (P range, <0.002–0.049), after 1,000 permutations (Supporting Information Table 3), in line with the findings obtained in the networks mixing cortical thickness with subcortical volumes.
Finally, the analyses of the structural networks that were built after correcting the regional thicknesses by the whole brain mean thickness did not show any differences between groups in any network measure.
Regional Network Analyses
We found a lower regional efficiency in the left superior frontal gyrus in PD‐MCI patients compared with controls and PD‐CN patients (P < 0.01, q < 0.05). In addition, we observed a decrease of the regional efficiency in PD‐MCI patients in the right superior parietal gyrus when compared with controls (P < 0.01, q < 0.05) and in the right inferior parietal angular gyrus when compared with PD‐CN patients (P < 0.01, q < 0.05). This is illustrated in Figure 3: in each subplot, the regions showing significant group differences are highlighted in red, while the remaining brain areas are color‐coded according to their distance from such regions. No significant differences were found between PD‐CN and controls in regional efficiency or between any of the groups in the regional clustering coefficients at all sparsities.
Figure 3.
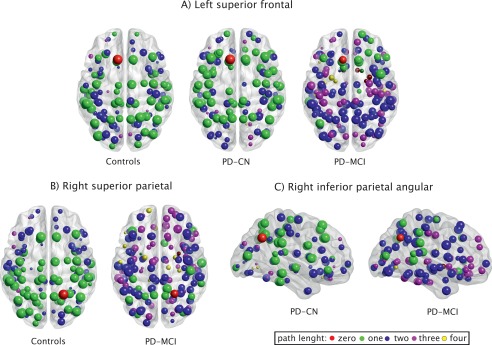
Regions showing higher regional efficiency in controls and PD‐CN patients compared with PD‐MCI patients. The red node corresponds to the region showing significant differences between groups in regional efficiency: (A) left superior frontal gyrus, (B) right superior parietal gyrus, (C) right inferior parietal angular gyrus. The remaining nodes correspond to the brain regions directly or indirectly connected to them by a path length of one to four nodes. The reduction of regional efficiency entails that more nodes had to be crossed in the PD‐MCI network to reach the red node from any other node in the network.
Hub Analysis
The hubs were identified as the nodes with both a degree and betweenness centrality that was one SD above the network averages. This is a descriptive analysis (its statistical significance is unknown) by contrast to the regional efficiency analyses, and it is one of the most common procedures used by previous studies to identify network hubs (for review, see van den Heuvel and Sporns, 2013).
As shown in Figure 4 and Table 2, the control group had 19 regions that were identified as hubs, including 10 heteromodal, 4 unimodal, 2 paralimbic, and 3 primary sensorimotor. The PD‐CN group had 13 regions that were identified as hubs, including 9 heteromodal, 2 unimodal, 1 paralimbic, and 1 primary sensorimotor. Finally, the PD‐MCI group had 16 hubs, of which 4 were in heteromodal, 3 in unimodal, 8 in paralimbic, and 1 in primary sensorimotor regions.
Figure 4.
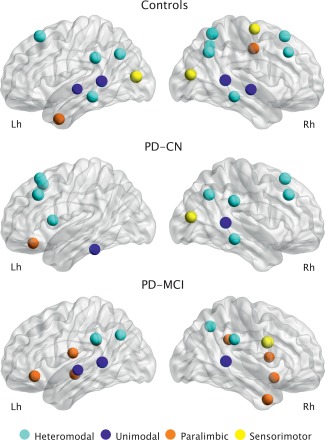
Network hubs. Hubs identified in the structural networks of controls, PD‐CN patients, and PD‐MCI patients. They were classified according to their location in the brain: heteromodal hubs (light blue), unimodal hubs (dark blue), paralimbic hubs (orange), primary sensorimotor hubs (yellow).
Table 2.
Regions showing high nodal degree and betweenness centrality in controls, PD‐CN patients, and PD‐MCI patients
| Class | Degree | Betweenness centrality | |
|---|---|---|---|
| Controls | |||
| Lh superior frontal G | Heteromodal | 51 | 4.6 |
| Lh inferior parietal supramarginal G | Heteromodal | 44 | 3.2 |
| Lh inferior parietal angular G | Heteromodal | 42 | 2.9 |
| Lh superior temporal S | Unimodal | 38 | 2.7 |
| Lh superior temporal G (lateral part) | Unimodal | 25 | 2.3 |
| Lh temporal pole | Paralimbic | 37 | 5.1 |
| Lh middle temporal G | Heteromodal | 39 | 2.5 |
| Lh middle occipital G | Primary SM | 52 | 6.2 |
| Rh superior frontal G | Heteromodal | 41 | 3.4 |
| Rh middle frontal G | Heteromodal | 29 | 2.9 |
| Rh precentral G | Primary SM | 34 | 2.3 |
| Rh middle posterior cingulate G and S | Paralimbic | 39 | 3.2 |
| Rh superior parietal G | Heteromodal | 54 | 6.8 |
| Rh precuneus G | Heteromodal | 34 | 2.9 |
| Rh inferior parietal angular G | Heteromodal | 49 | 2.8 |
| Rh superior temporal S | Unimodal | 41 | 3.2 |
| Rh superior lateral temporal G | Unimodal | 34 | 2.5 |
| Rh middle temporal G | Heteromodal | 33 | 2.8 |
| Rh middle occipital G | Primary SM | 42 | 2.4 |
| PD‐CN patients | |||
| Lh orbital G | Paralimbic | 30 | 4.1 |
| Lh superior frontal G | Heteromodal | 52 | 4.4 |
| Lh superior frontal S | Heteromodal | 43 | 2.2 |
| Lh middle frontal G | Heteromodal | 50 | 3.0 |
| Lh inferior frontal opercular G | Heteromodal | 33 | 2.2 |
| Lh inferior temporal G | Unimodal | 31 | 3.1 |
| Rh superior frontal G | Heteromodal | 50 | 3.9 |
| Rh middle frontal G | Heteromodal | 44 | 2.4 |
| Rh inferior parietal supramarginal G | Heteromodal | 44 | 2.9 |
| Rh inferior parietal angular G | Heteromodal | 42 | 2.3 |
| Rh superior temporal S | Unimodal | 39 | 5.4 |
| Rh middle temporal G | Heteromodal | 38 | 2.2 |
| Rh middle occipital G | Primary SM | 46 | 5.6 |
| PD‐MCI patients | |||
| Lh inferior frontal orbital G | Paralimbic | 32 | 5.8 |
| Lh subcentral G and S | Paralimbic | 23 | 6.1 |
| Lh inferior circular insula S | Paralimbic | 29 | 3.9 |
| Lh inferior parietal supramarginal G | Heteromodal | 40 | 5.0 |
| Lh cingulate G—posterior dorsal part | Paralimbic | 26 | 3.7 |
| Lh inferior parietal angular G | Heteromodal | 28 | 4.2 |
| Lh superior temporal S | Unimodal | 32 | 4.1 |
| Lh superior lateral temporal | Unimodal | 24 | 4.7 |
| Rh orbital G | Paralimbic | 25 | 3.9 |
| Rh superior circular insular S | Paralimbic | 23 | 4.2 |
| Rh precentral G—inferior part | Primary SM | 46 | 9.2 |
| Rh inferior parietal supramarginal G | Heteromodal | 29 | 5.0 |
| Rh precuneus | Heteromodal | 34 | 4.3 |
| Rh cingulate G—posterior dorsal part | Paralimbic | 24 | 4.4 |
| Rh superior temporal S | Unimodal | 34 | 4.1 |
| Rh temporal pole | Paralimbic | 28 | 5.3 |
Lh, left hemisphere; Rh, right hemisphere; G, gyus; S, sulcus; SM, sensorimotor.
In the control group, the hubs were mainly located in posterior parietal, lateral temporal, superior frontal, middle frontal, and middle occipital regions. Compared with controls, the PD‐CN group also showed hubs in bilateral superior frontal regions as well as in the right middle frontal, inferior parietal (angular gyrus), superior temporal, middle temporal, and middle occipital areas. Compared with controls, these patients showed more hubs in the left frontal cortex and less hubs in the posterior parietal and lateral temporal areas of both hemispheres.
Compared with controls, the PD‐MCI patients also showed hubs in the left inferior parietal (supramarginal and angular gyri), left superior temporal and lateral temporal regions, in addition to the right precuneus and right superior temporal areas. Compared with controls, the PD‐MCI group showed more hubs in paralimbic regions such as the left inferior orbital frontal, left subcentral, right orbital, right temporal pole areas as well as the bilateral insula, and bilateral posterior dorsal cingulum.
DISCUSSION
This study is the first in assessing large‐scale structural networks associated with the earliest stages of cognitive impairment in PD. We found that global network properties were disrupted in PD‐MCI patients, as reflected by an increase of characteristic path length and a decrease of global efficiency. This disruption affected mainly frontal and parietal areas, as indicated by a decrease of their regional efficiency. These findings show that MCI in PD is associated with widespread changes that affect the whole cerebral network already at early disease stages. Furthermore, a reorganization of the network's hubs was observed not only in PD‐MCI but also in PD‐CN patients, suggesting that the alterations of the structural cerebral networks are detectable even in cognitively preserved, newly diagnosed, untreated patients.
By contrast to conventional MRI studies of individual brain regions, imaging the structural correlations between brain areas can reveal the pathology of neurodegenerative diseases at the network level (Alexander‐Bloch et al., 2013a). In line with this, an abnormal pattern of increased and decreased structural correlations has been found in AD patients compared with healthy controls (He et al., 2008; Yao et al., 2010). In this study, we found a marked reduction in the average correlation strength between cortical and subcortical regions in PD‐MCI patients. These decreases in structural co‐variance could be related to a disconnectivity process that compromised the white matter pathways connecting brain areas to one another. In fact, it has been previously suggested that PD, like AD, is a disconnection syndrome (Cronin‐Golomb, 2010) characterized by white matter integrity reductions that are more severe in cognitively impaired compared with cognitively preserved patients (Agosta et al., 2013; Melzer et al., 2013). These findings are in line with our results of decreased average correlation strength in PD, which were more marked in the PD‐MCI group. The presence of disconnectivity in the brain networks of PD patients could be associated with Lewy body (Braak et al., 1999) and AD‐related neuropathology (Compta et al., 2011; Palop and Mucke, 2010). In fact, there is growing evidence suggesting misfolded proteins (including beta‐amyloid and tau) first develop intraneuronally and then spread from neuron to neuron through axonal connections, following a prion‐like mechanism (Frost and Diamond, 2010). This mechanism has received support from research in PD patients who received a transplant of dopaminergic neurons and developed pathology within those neurons a few years later (Angot et al., 2010).
Alpha‐synuclein‐positive Lewy neurites can be found in extensive portions of the axons in PD (Braak et al., 1999), which may damage presynaptic terminals, impair axonal transport, and produce axonal degeneration in white matter pathways (Saito et al., 2003). There is evidence suggesting that this axonal degeneration ultimately damages the neuronal cell body, a process that is also known as the “dying back” pattern of neurodegeneration (Hattori et al., 2012), which starts in the axon and spreads to the soma. This process may equally affect the regions that were once connected by the damaged axon, in which case the correlation strength between them would increase due to shared mechanisms in neurodegeneration (Zhu et al., 2012). However, it may also lead to cortical atrophy of the region containing the dying cell body, leaving the other region relatively spared structurally. In this case, an attenuation of the correlation strength between two regions would be observed (Alexander‐Bloch et al., 2013a), a mechanism that could explain the weaker structural correlations observed in the PD‐MCI patients in our study.
In line with previous studies in AD (He et al., 2008; Yao et al., 2010), we found a longer characteristic path length and reduced global efficiency in the networks of PD‐MCI patients compared with controls. Short paths in a brain network ensure an efficient and easy communication between brain regions (Rubinov and Sporns, 2010). The characteristic path length and global efficiency have been previously associated with intelligence (van den Heuvel et al., 2009) and cognitive abilities (Wen et al., 2011), including visuospatial and executive functions. Our findings also support this association of network path length and efficiency with cognition as we did not find such alterations in PD‐CN patients.
Previous studies have shown that neurodegenerative diseases target brain regions that are especially highly correlated in healthy subjects (Seeley et al., 2009). These regions are the network hubs, which play a crucial role in the network as they interact with many brain regions (van den Heuvel and Sporns, 2013). In our study, we found regional efficiency decreases in frontal and parietal regions in PD‐MCI patients. Interestingly, these regions are part of the default‐mode network and were identified as network hubs in the control group but not in the PD‐MCI group, suggesting they were lost as a result of neurodegeneration in these patients, like in other neurodegenerative disorders (Seeley et al., 2009). The regional efficiency decreases we found in parietal and frontal areas are in agreement with a study showing that frontal and parietal abnormalities are an early marker of cognitive decline in PD (Rektorova et al., 2014). In addition, they also agree with previous neuropathological data showing that PD targets neurons that establish connections between high‐order sensory association areas and prefrontal areas (Braak and Del Tredici, 2005). These neurons are vulnerable to PD due to their long, thin and poorly myelinated axons: it has been suggested that incompletely myelinated axons are subjected to higher energy demands and a permanent exposure to oxidative stress (Braak and Del Tredici, 2005).
In the current study, 10 heteromodal hubs were found in controls compared with only four in PD‐MCI patients, suggesting a severe disruption of regions involved in high‐level cognitive processes. In particular, almost all frontal hubs were lost in PD‐MCI patients, by contrast to PD‐CN patients who showed an increase of left frontal hubs, compared with controls. The loss of frontal hubs in our PD‐MCI group might be associated with the typical dysexecutive syndrome usually observed in these patients, which is thought to be produced by fronto‐striatal dopaminergic deficits (Kehagia et al., 2010). By contrast, the increase of frontal hubs we observed in PD‐CN patients might stem from upregulated frontal dopaminergic transmission in early PD in response to reductions in striatal dopamine. This compensatory mechanism is thought to underlie improved frontal function in early PD patients, for instance, in measures of susceptibility to distraction (Cools et al., 2010).
Previous studies assessing functional networks in PD with graph theory have shown reduced global efficiency in these patients (Göttlich et al., 2013; Skidmore et al., 2011; Wu et al., 2010), similarly to our findings. In addition, reduced clustering was found in a small group of early dug‐naïve patients by one study (Olde Dubbelink et al., 2014) in line with the lower clustering levels we found at a few network sparsities in our sample. To date, the only study assessing the functional networks of PD‐MCI patients showed an increased path length and a reorganization of network hubs at moderate disease stages (Baggio et al., in press). Our findings suggest that these network changes can already be identified in the structural networks of early PD patients, prior to the beginning of dopaminergic treatment. In addition, in that study (Baggio et al., in press), an increase in small‐worldness was found in PD‐MCI patients compared with controls and PD‐CN patients, in line with our findings of higher small‐world values in the PD‐MCI group. However, the explanation behind this result is most likely different between the two studies. Normally, the small‐worldness is calculated as: (CC real network/CC random network)/(CPL real network/CPL random network), where CC is the clustering coefficient and CPL is the characteristic path length. While in the study by Baggio et al. (in press) the small‐worldness increases were probably due to higher clustering coefficient values in the real network (CC real network) of PD‐MCI patients, in our study the small‐worldness increases were due to very low clustering values in the random network (CC random network) of PD‐MCI patients. These clustering decreases found in the random network in our study occurred because PD‐MCI patients had less hubs and a more homogenous degree distribution compared with controls and PD‐CN patients, being easier to derive a more random network with lower clustering coefficients from the real network of these patients compared with the other two groups. Future studies assessing small‐worldness in the structural networks of PD‐MCI patients should take this issue into account.
In a previous study, we identified the individual areas showing cortical thinning in the same PD sample assessed in the current study (Pereira et al., 2014). We found significant thinning in the temporal cortex in PD‐CN patients and in frontal, temporal, and parietal regions in PD‐MCI patients compared with controls (Supporting Information Fig. 1). The fact that these results do not completely coincide with the significant regions of our network analysis is probably related with structural networks containing exclusive information that cannot be captured by conventional MRI analyses. These measures may be sensitive to alterations that are not evident in gross structure because they take into account the integration of every brain area into the whole cerebral network.
In the current study, when the regional thickness values were corrected by the average thickness of the whole cortex, the network analyses did not show any differences between any of the groups. Some studies assessing cortical thickness networks corrected the values of each region by the average thickness (Bernhardt et al., 2011; He et al., 2007), while others have not applied this correction (He et al., 2008; Teicher et al., 2013), suggesting that it might not always be appropriate. As mentioned earlier, in a previous study, we observed that our PD‐MCI group showed cortical thinning in several brain regions compared with controls, instead of focal thinning in specific areas (Pereira et al., 2014). Hence, we believe that by correcting for mean thickness we would remove important information from the networks of patients as their pattern of brain abnormalities, being widespread, is closely associated with the mean thickness of the whole cortex. Moreover, it is also very likely that the cortical thinning pattern and the mean thickness of PD‐MCI patients are associated with the network abnormalities that we found in the current study. In line with this, in a previous study, Reijmer et al., (2013) found that reductions in white matter volume and increases in white matter hyperintensity load strongly correlated with abnormalities in the global efficiency, clustering coefficient, and characteristic path length in the white matter networks of AD patients. In that study, the authors did not correct the network values by the white matter volume or hyperintensity load of each patient as it would probably eliminate the effect they wished to measure.
The current study has several strengths including the large sample size, neurobiological confirmation of PD diagnoses with DaTSCAN, diagnosis of MCI using modified MDS criteria and the fact that all patients were drug‐naïve. However, some limitations should also be recognized. First, the anatomical connectivity matrix used in the current study is estimated on the basis of interregional correlations in a group of subjects and does not provide individual networks for each patient. Second, although representative of early stages of PD, the PPMI sample is a research‐based cohort, which might not be truly representative of a community‐based sample. Third, similarly to the Alzheimer's disease neuroimaging initiative (http://adni.loni.usc.edu/), PPMI is a multicenter study and the acquisition of MRI scans from patients and controls was performed in the same type of scanner at different centers. To avoid any issues that might arise from variability between centers, PPMI includes a harmonization and quality control protocol (http://www.ppmi-info.org/data) that must be applied to all MRI scans. This protocol involves acquiring the scans using a phantom to assess scanner noise and instability in addition to quantifying the geometry accuracy, the signal‐to‐noise ratio and the image uniformity of the scans. The different centers were also trained to perform a basic quality control with an emphasis on full brain coverage that included the pons and cerebellum and exclusion of severe image artifacts. Once the scans were acquired, the different sites transferred them to the PPMI's imaging core lab and worked closely with them to verify that the acquisition parameters of the scans and the characteristics of the scanner were compatible with the PPMI's MRI protocol. Hence, the fact that the MRI scans were acquired at different centers most likely did not interfere with our results. Fourth, the significant difference in age found in the current study between controls and PD‐MCI patients could have influenced some of our findings. Previously, Wu et al. (2012) found significant reductions in the global efficiency of structural networks in a large group of elderly subjects between 61 and 80 years of age compared with middle‐aged subjects between 41 and 60 years of age. This finding was interpreted by the authors as a degeneration process in the structural network over aging that might lead to an abnormal topological organization and predispose elder individuals to a higher risk for dysconnectivity syndromes. In our study, there were more subjects between 61 and 80 years of age in the PD‐MCI group compared with the control group, which could have contributed to the lower global efficiency values found in PD‐MCI patients compared with controls. We addressed this issue by adjusting the anatomical measures by age using linear regression to remove age‐related effects. However, it is possible that age could have influenced our results even after this additional control. This issue should be addressed by future studies aimed at assessing the influence of age on the structural networks of PD patients. Finally, although several studies have shown that the whole‐brain network can be divided into different cohesive modules (Chen et al., 2008; He et al., 2009b; Meunier et al., 2009) and that disruption of these modules is closely associated with cognitive impairment (de Haan et al., 2012; Wang et al., 2013), we did not include a modularity analysis in the current study due to evidence of weak modularity (Clauset et al., 2004) in the networks of our groups (data not shown). However, future studies assessing the networks of PD patients using graph theory should also include modularity measures and analyze whether cognitive impairment is associated with abnormal within and between‐module connections in PD.
One mechanism that could account for the negative effects of MCI on the global network measures such as the characteristic path length or global efficiency is the contribution of different neurotransmitters deficits to cognitive impairment in PD. These neurotransmitters are produced in small subcortical nuclei, which innervate widespread areas of the cortex and subcortical regions using relatively few axons. For instance, executive impairment has been associated with a deficit of dopamine produced by the substantia nigra and ventral tegmental area, which innervate the striatum and frontal cortex. Visuospatial and memory impairments have been related to acetylcholine produced by the pedunculopontine nucleus and basal nucleus of Meynert, which innervate the thalamus and widespread neocortical areas. Finally, attention impairment is thought to be mediated by norepinephrine produced by the lateral tegmental nucleus and the locus coeruleus, which innervate the hippocampus, amygdala, and many cortical areas (Kehagia et al., 2010). If the few axons that innervate all these areas are damaged, then the neurotransmitter levels would be reduced in several subcortical structures and cortical regions of the brain. This could lead to abnormalities in global network measures and to a reorganization of the overall network architecture as observed in the PD‐MCI patients in our study.
Supporting information
Supporting Information
Supporting Information
Supporting Information
Supporting Information
Supporting Information
ACKNOWLEDGMENTS
Data used in the preparation of this article were obtained from the Parkinson's Progression Markers Initiative (PPMI) database (http://www.ppmi-info.org/data). For up‐to‐date information on the study, visit http://www.ppmi-info.org. PPMI—a public‐private partnership—is funded by the Michael J. Fox Foundation for Parkinson's Research and funding partners, including Abbott, Avid Radiopharmaceuticals, Biogen Idec, Bristol‐Myers Squibb, Covance, Élan, GE Healthcare, Genentech, GSK‐GlaxoSmithKline, Lilly, Merck, MSD‐Meso Scale Discovery, Pfizer, Roche, UCB (http://www.ppmi-info.org/fundingpartners). We also acknowledge support from the Strategic Research Programme in Neuroscience at Karolinska Institutet (StratNeuro), the Swedish Brain Power and the regional agreement on medical training, clinical research (ALF) between Stockholm County Council and The Swedish Society of Medicine. D.A. serves on scientific advisory boards for Lundbeck Inc. and Merck Serono; has received funding for travel and speaker honoraria from Lundbeck Inc., Novartis, GE Healthcare, and GlaxoSmithKline; serves on the editorial boards of International Psychogeriatrics, Movement Disorders, and the Journal of Neurology, Neurosurgery, and Psychiatry; J.B.P., C.E.G., A.L., L.O.W., G.V., E.W. report no disclosures.
REFERENCES
- Achard S, Bullmore E (2007): Efficiency and cost of economical brain functional networks. PLoS Comput Biol 3:e17. [DOI] [PMC free article] [PubMed] [Google Scholar]
- Agosta F, Canu E, Stefanova E, Sarro L, Tomic A, Spica V, Comi G, Kostić VS, Filippi M (2013): Mild cognitive impairment in parkinson's disease is associated with a distributed pattern of brain white matter damage. Hum Brain Mapp 35:1921–1929. [DOI] [PMC free article] [PubMed] [Google Scholar]
- Alexander‐Bloch A, Giedd JN, Bullmore E (2013a): Imaging structural co‐variance between human brain regions. Nat Rev Neurosci 14:322–336. [DOI] [PMC free article] [PubMed] [Google Scholar]
- Alexander‐Bloch A, Raznahan A, Bullmore E, Giedd J (2013b): The convergence of maturational change and structural covariance in human cortical networks. J Neurosci 33:2889–2899. [DOI] [PMC free article] [PubMed] [Google Scholar]
- Alves G, Lange J, Blennow K, Zetterberg H, Andreasson U, Førland MG, Tysnes O‐B, Larsen JP, Pedersen KF (2014): CSF aβ42 predicts early‐onset dementia in parkinson disease. Neurology 82:1784–1790. [DOI] [PubMed] [Google Scholar]
- Angot E, Steiner JA, Hansen C, Li JY, Brundin P (2010): Are synucleinopathies prion‐like disorders? Lancet Neurol 9:1128–38. 12 [DOI] [PubMed] [Google Scholar]
- Baggio H‐C, Sala‐Llonch R, Segura B, Marti M‐J, Valldeoriola F, Compta Y, Tolosa E, Junqué C (2014): Functional brain networks and cognitive deficits in Parkinson's disease. Hum Brain Mapp 35:4620--4634. [DOI] [PMC free article] [PubMed] [Google Scholar]
- Bassett DS, Bullmore E (2006): Small‐world brain networks. Neuroscientist 12:512–523. [DOI] [PubMed] [Google Scholar]
- Bassett DS, Bullmore E, Verchinski BA, Mattay VS, Weinberger DR, Meyer‐Lindenberg A (2008): Hierarchical organization of human cortical networks in health and schizophrenia. J Neurosci 28:9239–9248. [DOI] [PMC free article] [PubMed] [Google Scholar]
- Bernhardt BC, Chen Z, He Y, Evans AC, Bernasconi N (2011): Graph‐theoretical analysis reveals disrupted small‐world organization of cortical thickness correlation networks in temporal lobe epilepsy. Cereb Cortex 21:2147–2157. [DOI] [PubMed] [Google Scholar]
- Bohbot VD, Lerch J, Thorndycraft B, Iaria G, Zijdenbos AP (2007): Gray matter differences correlate with spontaneous strategies in a human virtual navigation task. J Neurosci 27:10078–10083. [DOI] [PMC free article] [PubMed] [Google Scholar]
- Braak H, Del Tredici K (2005): Poor and protracted myelination as a contributory factor to neurodegenerative disorders. Neurobiol Aging 25:19–23. [DOI] [PubMed] [Google Scholar]
- Braak H, Sandmann‐Keil D, Gai WP, Braak E (1999): Extensive axonal lewy neurites in parkinson's disease: A novel pathological feature revealed by α‐synuclein immunocytochemistry. Neurosci Lett 265:67–69. [DOI] [PubMed] [Google Scholar]
- Bullmore E, Sporns O (2009): Complex brain networks: Graph theoretical analysis of structural and functional systems. Nat Rev Neurosci 10:186–198. [DOI] [PubMed] [Google Scholar]
- Chen ZJ, He Y, Rosa‐Neto P, Germann J, Evans AC (2008): Revealing modular architecture of human brain structural networks by using cortical thickness from MRI. Cereb Cortex 18:2374–2381. [DOI] [PMC free article] [PubMed] [Google Scholar]
- Clauset A, Newman MEJ, Moore C (2004): Finding community structure in very large networks. Phys Rev E 70:066111. [DOI] [PubMed] [Google Scholar]
- Compta Y, Parkkinen L, O'Sullivan SS, Vandrovcova J, Holton JL, Collins C, Lashley T, Kallis C, Williams DR, de Silva R, Lees AJ, Revesz T (2011): Lewy‐ and Alzheimer‐type pathologies in parkinson's disease dementia: Which is more important? Brain 134:1493–1505. [DOI] [PMC free article] [PubMed] [Google Scholar]
- Cools R, Miyakawa A, Sheridan M, D'Esposito M (2010): Enhanced frontal function in parkinson's disease. Brain 133:225–233. [DOI] [PMC free article] [PubMed] [Google Scholar]
- Cronin‐Golomb A (2010): Parkinson's disease as a disconnection syndrome. Neuropsychol Rev 20:191–208. [DOI] [PMC free article] [PubMed] [Google Scholar]
- Dale AM, Fischl B, Sereno MI (1999): Cortical surface‐based analysis. I. Segmentation and surface reconstruction. Neuroimage 9:179–194. [DOI] [PubMed] [Google Scholar]
- de Haan W, van der Flier WM, Koene T, Smits LL, Scheltens P, Stam CJ (2012): Disrupted modular brain dynamics reflect cognitive dysfunction in alzheimer's disease. Neuroimage 59:3085–3093. [DOI] [PubMed] [Google Scholar]
- Desikan RS, Ségonne F, Fischl B, Quinn BT, Dickerson BC, Blacker D, Buckner RL, Dale AM, Maguire RP, Hyman BT, Albert MS, Killiany RJ. (2006): An automated labeling system for subdividing the human cerebral cortex on MRI scans into gyral based regions of interest. NeuroImage 31:968–980. [DOI] [PubMed] [Google Scholar]
- Destrieux C, Fischl B, Dale A, Halgren E (2010): Automatic parcellation of human cortical gyri and sulci using standard anatomical nomenclature. Neuroimage 53:1–15. [DOI] [PMC free article] [PubMed] [Google Scholar]
- Dijkstra EW (1959): A note on two problems in connexion with graphs. Num Mat 1:269–271. [Google Scholar]
- Duvernoy HM, Cabanis EA, Vannson JL (1991): The Human Brain: Surface, Three‐Dimensional Sectional Anatomy and MRI. Wien: Springer‐Verlag. [Google Scholar]
- Fahn S, Elton RL (1987): The UPDRS Development Committee. Unified Parkinson's disease rating scale In: Fahn S, Marsden CD, Calne D, Goldstein M, editors. Recent Developments in Parkinson's disease. Florham Park, NJ: Macmillan Health Care Information; pp 153–163. [Google Scholar]
- Filippi M, van den Heuvel MP, Fornito A, He Y, Pol HEH, Agosta F, Comi G, Rocca MA (2013): Assessment of system dysfunction in the brain through MRI‐based connectomics. Lancet Neurol 12:1189--1199. [DOI] [PubMed] [Google Scholar]
- Fischl B, Dale AM (2000): Measuring the thickness of the human cerebral cortex from magnetic resonance images. Proc Natl Acad Sci USA 97:11050–11055. [DOI] [PMC free article] [PubMed] [Google Scholar]
- Fischl B, Sereno MI, Dale AM (1999): Cortical surface‐based analysis. II: Inflation, flattening, and a surface‐based coordinate system. Neuroimage 9:195–207. [DOI] [PubMed] [Google Scholar]
- Fischl B, Liu A, Dale AM (2001): Automated manifold surgery: Constructing geometrically accurate and topologically correct models of the human cerebral cortex. IEEE Trans Med Imaging 20:70–80. [DOI] [PubMed] [Google Scholar]
- Fischl B, Salat DH, Busa E, Albert M, Dieterich M, Haselgrove C, van der Kouwe A, Killiany R, Kennedy D, Klaveness S, Montillo A, Makris N, Rosen B, Dale AM (2002): Whole brain segmentation: Automated labeling of neuroanatomical structures in the human brain. Neuron 33:341–355. [DOI] [PubMed] [Google Scholar]
- Fischl B, van der Kouwe A, Destrieux C, Halgren E, Segonne F, Salat DH, Busa E, Seidman LJ, Goldstein J, Kennedy D, Caviness V, Makris N, Rosen B, Dale AM (2004): Automatically parcellating the human cerebral cortex. Cereb Cortex 14:11–22. [DOI] [PubMed] [Google Scholar]
- Frost B, Diamond MI (2010): Prion‐like mechanisms in neurodegenerative diseases. Nat Rev Neurosci 11:155–159. [DOI] [PMC free article] [PubMed] [Google Scholar]
- Genovese CR, Lazar NA, Nichols T (2002): Thresholding of statistical maps in functional neuroimaging using the false discovery rate. Neuroimage 15:870–878. [DOI] [PubMed] [Google Scholar]
- Goetz CG, Fahn S, Martinez‐Martin P, Poewe W, Sampaio C, Stebbins GT, Stern MB, Tilley BC, Dodel R, Dubois B, Holloway R, Jankovic J, Kulisevsky J, Lang AE, Lees A, Leurgans S, LeWitt PA, Nyenhuis D, Olanow CW, Rascol O, Schrag A, Teresi JA, Van Hilten JJ, LaPelle N (2007): Movement disorder Society‐sponsored revision of the unified parkinson's disease rating scale (MDS‐UPDRS): Process, format, and clinimetric testing plan. Mov Disord 22:41–47. [DOI] [PubMed] [Google Scholar]
- Gong G, He Y, Chen ZJ, Evans AC (2012): Convergence and divergence of thickness correlations with diffusion connections across the human cerebral cortex. Neuroimage 59:1239–1248. [DOI] [PubMed] [Google Scholar]
- Göttlich M, Münte TF, Heldmann M, Kasten M, Hagenah J, Krämer UM (2013): Altered resting state brain networks in parkinson's disease. PloS One 8:e77336. [DOI] [PMC free article] [PubMed] [Google Scholar]
- Hattori T, Orimo S, Aoki S, Ito K, Abe O, Amano A, Sato R, Sakai K, Mizusawa H (2012): Cognitive status correlates with white matter alteration in parkinson's disease. Hum Brain Mapp 33:727–739. [DOI] [PMC free article] [PubMed] [Google Scholar]
- He Y, Chen ZJ, Evans AC (2007): Small‐world anatomical networks in the human brain revealed by cortical thickness from MRI. Cereb Cortex 17:2407–2419. [DOI] [PubMed] [Google Scholar]
- He Y, Chen Z, Evans A (2008): Structural insights into aberrant topological patterns of large‐scale cortical networks in alzheimer's disease. J Neurosci 28:4756–4766. [DOI] [PMC free article] [PubMed] [Google Scholar]
- He Y, Dagher A, Chen Z, Charil A, Zijdenbos A, Worsley K, Evans A (2009a): Impaired small‐world efficiency in structural cortical networks in multiple sclerosis associated with white matter lesion load. Brain 132:3366–3379. [DOI] [PMC free article] [PubMed] [Google Scholar]
- He Y, Wang J, Wang L, Chen ZJ, Yan C, Yang H, Tang H, Zhu C, Gong Q, Zang Y, Evans AC (2009b): Uncovering intrinsic modular organization of spontaneous brain activity in humans. PloS One 4:e5226. [DOI] [PMC free article] [PubMed] [Google Scholar]
- Helmich RC, Derikx LC, Bakker M, Scheeringa R, Bloem BR, Toni I (2010): Spatial remapping of cortico‐striatal connectivity in parkinson's disease. Cereb Cortex 20:1175–1186. [DOI] [PubMed] [Google Scholar]
- Hoehn MH, Yahr MD (1967): Parkinsonism: Onset, progression, and mortality. Neurology 17:427–442. [DOI] [PubMed] [Google Scholar]
- Hosseini SM, Black JM, Soriano T, Bugescu N, Martinez R, Raman MM, Kesler SR, Hoeft F (2013): Topological properties of large‐scale structural brain networks in children with familial risk for reading difficulties. Neuroimage 71:260–274. [DOI] [PMC free article] [PubMed] [Google Scholar]
- Kehagia AA, Barker RA, Robbins TW (2010): Neuropsychological and clinical heterogeneity of cognitive impairment and dementia in patients with parkinson's disease. Lancet Neurol 9:1200–1213. [DOI] [PubMed] [Google Scholar]
- Kwak Y, Peltier S, Bohnen N, Müller M, Dayalu P, Seidler RD (2010): Altered resting state cortico‐striatal connectivity in mild to moderate stage parkinson's disease. Front Syst Neurosci 4:143. [DOI] [PMC free article] [PubMed] [Google Scholar]
- Lerch JP, Worsley K, Shaw WP, Greenstein DK, Lenroot RK, Giedd J, Evans AC (2006): Mapping anatomical correlations across cerebral cortex (MACACC) using cortical thickness from MRI. Neuroimage 31:993–1003. [DOI] [PubMed] [Google Scholar]
- Litvan I, Goldman JG, Troster AI, Schmand BA, Weintraub D, Petersen RC, Mollenhauer B, Adler CH, Marder K, Williams‐Gray CH, Aarsland D, Kulisevsky J, Rodriguez‐Oroz MC, Burn DJ, Barker RA, Emre M (2012): Diagnostic criteria for mild cognitive impairment in parkinson's disease: Movement disorder society task force guidelines. Mov Disord 27:349–356. [DOI] [PMC free article] [PubMed] [Google Scholar]
- Luce RD, Perry AD (1949): A method of matrix analysis of group structure. Psychometrika 14:95–116. [DOI] [PubMed] [Google Scholar]
- Melzer TR, Watts R, MacAskill MR, Pitcher TL, Livingston L, Keenan RJ, Dalrymple‐Alford JC, Anderson TJ (2013): White matter microstructure deteriorates across cognitive stages in parkinson disease. Neurology 80:1841–1849. [DOI] [PubMed] [Google Scholar]
- Mesulam MM (1998): From sensation to cognition. Brain 121:1013–1052. [DOI] [PubMed] [Google Scholar]
- Meunier D, Lambiotte R, Fornito A, Ersche KD, Bullmore ET (2009): Hierarchical modularity in human brain functional networks. Front Neuroinform 3:37. [DOI] [PMC free article] [PubMed] [Google Scholar]
- Olde Dubbelink KT, Hillebrand A, Stoffers D, Deijen JB, Twisk JW, Stam CJ, Berendse HW (2014): Disrupted brain network topology in parkinson's disease: A longitudinal magnetoencephalography study. Brain 137:197–207. [DOI] [PubMed] [Google Scholar]
- Palop JJ, Mucke L (2010): Amyloid‐β–induced neuronal dysfunction in alzheimer's disease: From synapses toward neural networks. Nat Neurosci 13:812–818. [DOI] [PMC free article] [PubMed] [Google Scholar]
- Parkinson progression marker initiative (2011): The parkinson progression marker initiative (PPMI). Prog Neurobiol 95:629–635. [DOI] [PMC free article] [PubMed] [Google Scholar]
- Pereira JB, Ibarretxe‐Bilbao N, Marti M‐J, Compta Y, Junqué C, Bargallo N Tolosa E (2012): Assessment of cortical degeneration in patients with parkinson's disease by voxel‐based morphometry, cortical folding, and cortical thickness. Hum Brain Mapp 33:2521–2534. [DOI] [PMC free article] [PubMed] [Google Scholar]
- Pereira JB, Svenningsson P, Weintraub D, Brønnick K, Lebedev A, Westman E, Aarsland D (2014): Initial cognitive decline is associated with cortical thinning in early parkinson's disease. Neurology 82:2017–2025. [DOI] [PMC free article] [PubMed] [Google Scholar]
- Reijmer YD, Leemans A, Caeyenberghs K, Heringa SM, Koek HL, Biessels GJ (2013): Disruption of cerebral networks and cognitive impairment in alzheimer disease. Neurology 80:1370–1377. [DOI] [PubMed] [Google Scholar]
- Rektorova I, Biundo R, Marecek R, Weis L, Aarsland D, Antonini A (2014): Grey matter changes in cognitively impaired parkinson's disease patients. PloS One 9:e85595. [DOI] [PMC free article] [PubMed] [Google Scholar]
- Rubinov M, Sporns O (2010): Complex network measures of brain connectivity: Uses and interpretations. Neuroimage 52:1059–1069. [DOI] [PubMed] [Google Scholar]
- Rubinov M, Sporns O (2011): Weight‐conserving characterization of complex functional brain networks. Neuroimage 56:2068–2079. [DOI] [PubMed] [Google Scholar]
- Saito Y, Kawashima A, Ruberu NN, Fujiwara H, Koyama S, Sawabe M, Arai T, Nagura H, Yamanouchi H, Hasegawa M, Iwatsubo T, Murayama S (2003): Accumulation of phosphorylated alpha‐synuclein in aging human brain. J Neuropathol Exp Neurol 62:644–654. [DOI] [PubMed] [Google Scholar]
- Seeley WW, Crawford RK, Zhou J, Miller BL, Greicius MD (2009): Neurodegenerative diseases target large‐scale human brain networks. Neuron 62:42–52. [DOI] [PMC free article] [PubMed] [Google Scholar]
- Segonne F, Dale AM, Busa E, Glessner M, Salat D, Hahn HK, Fischl B (2004): A hybrid approach to the skull stripping problem in MRI. Neuroimage 22:1060–1075. [DOI] [PubMed] [Google Scholar]
- Segonne F, Pacheco J, Fischl B (2007): Geometrically accurate topology‐correction of cortical surfaces using nonseparating loops. IEEE Trans Med Imaging 26:518–529. [DOI] [PubMed] [Google Scholar]
- Siderowf A, Xie SX, Hurtig H, Weintraub D, Duda J, Chen‐Plotkin A, Shaw LM, Deerlin VV, Trojanowski JQ, Clark C (2010): CSF amyloid β 1‐42 predicts cognitive decline in parkinson disease. Neurology 75:1055–1061. [DOI] [PMC free article] [PubMed] [Google Scholar]
- Sheikh JI, Yesavage JA (1986): Geriatric Depression Scale (GDS): Recent evidence and development of a shorter version In: Brink TL, editor. Clinical Gerontology: A Guide to Assessment and Intervention. New York: The Haworth Press; pp 165–173. [Google Scholar]
- Simmons A, Westman E, Muehlboeck S, Mecocci P, Vellas B, Tsolaki M, Kłoszewska I, Wahlund L‐O, Soininen H, Lovestone S, Evans A, Spenger C (2011): The AddNeuroMed framework for multi‐center MRI assessment of alzheimer's disease: Experience from the first 24 months. Int J Geriatr Psychiatry 26:75–82. [DOI] [PubMed] [Google Scholar]
- Singh MK, Kesler SR, Hadi Hosseini SM, Kelley RG, Amatya D, Hamilton JP, Chen MC, Gotlib IH (2013): Anomalous gray matter structural networks in major depressive disorder. Biol Psychiatry 74:777–785. [DOI] [PMC free article] [PubMed] [Google Scholar]
- Skidmore F, Korenkevych D, Liu Y, He G, Bullmore E, Pardalos PM (2011): Connectivity brain networks based on wavelet correlation analysis in parkinson fMRI data. Neurosci Lett 499:47–51. [DOI] [PubMed] [Google Scholar]
- Sled JG, Zijdenbos AP, Evans AC (1998): A nonparametric method for automatic correction of intensity nonuniformity in MRI data. IEEE Trans Med Imaging 17:87–97. [DOI] [PubMed] [Google Scholar]
- Sporns O, Honey CJ, Kötter R (2007): Identification and classification of hubs in brain networks. PloS One 2:e1049. [DOI] [PMC free article] [PubMed] [Google Scholar]
- Svenningsson P, Westman E, Ballard C, Aarsland D (2012): Cognitive impairment in patients with parkinson's disease: Diagnosis, biomarkers, and treatment. Lancet Neurol 11:697–707. [DOI] [PubMed] [Google Scholar]
- Teicher MH, Anderson CM, Ohashi K, Polcari A (2013): Childhood maltreatment: Altered network centrality of cingulate, precuneus, temporal pole and insula. Biol Psychiatry 76:297–305. [DOI] [PMC free article] [PubMed] [Google Scholar]
- van den Heuvel MP, Sporns O (2013): Network hubs in the human brain. Trends Cogn Sci 17:683–696. [DOI] [PubMed] [Google Scholar]
- van den Heuvel MP, Stam CJ, Kahn RS, Hulshoff Pol HE (2009): Efficiency of functional brain networks and intellectual performance. J Neurosci 29:7619–7624. [DOI] [PMC free article] [PubMed] [Google Scholar]
- van Eimeren T, Monchi O, Ballanger B, Strafella AP (2009): Dysfunction of the default mode network in parkinson disease: A functional magnetic resonance imaging study. Arch Neurol 66:877–883. [DOI] [PMC free article] [PubMed] [Google Scholar]
- Wang J, Zuo X, Dai Z, Xia M, Zhao Z, Zhao X, Jia J, Han Y, He Y (2013): Disrupted functional brain connectome in individuals at risk for alzheimer's disease. Biol Psychiatry 73:472–481. [DOI] [PubMed] [Google Scholar]
- Watts DJ, Strogatz SH (1998): Collective dynamics of ‘small‐world’ networks. Nature 393:440–442. [DOI] [PubMed] [Google Scholar]
- Weintraub D, Dietz N, Duda JE, Wolk DA, Doshi J, Xie SX, Davatzikos C, Clark CM, Siderowf A (2012): Alzheimer's disease pattern of brain atrophy predicts cognitive decline in parkinson's disease. Brain 135:170–180. [DOI] [PMC free article] [PubMed] [Google Scholar]
- Wen W, Zhu W, He Y, Kochan NA, Reppermund S, Slavin MJ, Brodaty H, Crawford J, Xia A, Sachdev P (2011): Discrete neuroanatomical networks are associated with specific cognitive abilities in old age. J Neurosci 31:1204–1212. [DOI] [PMC free article] [PubMed] [Google Scholar]
- Westman E, Aguilar C, Muehlboeck JS, Simmons A (2013): Regional magnetic resonance imaging measures for multivariate analysis in alzheimer's disease and mild cognitive impairment. Brain Topogr 26:9–23. [DOI] [PMC free article] [PubMed] [Google Scholar]
- Wu T, Chan P, Hallett M (2010): Effective connectivity of neural networks in automatic movements in parkinson's disease. Neuroimage 49:2581–2587. [DOI] [PMC free article] [PubMed] [Google Scholar]
- Wu K, Taki Y, Sato K, Kinomura S, Goto R, Okada K, Kawashima R, He Y, Evans AC, Fukuda H (2012): Age‐related changes in topological organization of structural brain networks in healthy individuals. Hum Brain Mapp 33:552–568. [DOI] [PMC free article] [PubMed] [Google Scholar]
- Xia M, Wang J, He Y (2013): BrainNet viewer: A network visualization tool for human brain connectomics. PLoS One 8:e68910. [DOI] [PMC free article] [PubMed] [Google Scholar]
- Yao Z, Zhang Y, Lin L, Zhou Y, Xu C Jiang T, Alzheimer's Disease Neuroimaging Initiative (2010): Abnormal cortical networks in mild cognitive impairment and alzheimer's disease. PLoS Comput Biol 6:e1001006. [DOI] [PMC free article] [PubMed] [Google Scholar]
- Zhu W, Wen W, He Y, Xia A, Anstey KJ, Sachdev P (2012): Changing topological patterns in normal aging using large‐scale structural networks. Neurobiol Aging 33:899–913. [DOI] [PubMed] [Google Scholar]
Associated Data
This section collects any data citations, data availability statements, or supplementary materials included in this article.
Supplementary Materials
Supporting Information
Supporting Information
Supporting Information
Supporting Information
Supporting Information