

Abstract
Objective
Chemotherapy (CT) is associated with adverse effects on cognition. Only few studies have investigated cognition in testicular cancer (TC) patients and studies on very late effects of CT on cognition are absent. Further, brain changes in relation to treatment have not been investigated in TC. The objective of the present study is to compare psychosocial functioning, cognitive performance and brain (micro)structure following surgery and CT for TC, against surgery (S)‐only.
Methods
Twenty‐eight CT (43.1 ± 7.5 y) and 23 S‐only (48.2 ± 9.5y) TC survivors on average 14 yr post‐treatment were examined using questionnaires, neurocognitive tests, and 3T‐MRI [Diffusion Kurtosis Imaging (DKI), T1‐weighted and Fluid Attenuated Inversion Recovery]. A multivariate cognitive performance score (Mahalanobis distance) was calculated to indicate the grade of cognitive performance. Kurtosis parameters, gray matter, and white matter (WM) volume were calculated from MRI data.
Results
Overall, the CT group showed lower cognitive performance (5.35 ± 1.7) compared with the S‐only group (4.4 ± 0.9; P =0.03; d = 0.70). Further, TC patients reported more memory problems after CT. DKI revealed a significantly higher radial kurtosis after CT in several anterior and posterior brain areas (P < 0.05, corrected), but this was unrelated to cognitive performance.
Conclusions
This cross‐sectional study suggests that men receiving CT for TC are at risk for long‐term lower cognitive performance. Although CT affected WM microstructure, this was unrelated to cognitive performance. More extensive, preferably prospective studies are warranted to confirm these results and to provide more insight into the possible mechanisms behind the observed cognitive sequelae after treatment for TC. Hum Brain Mapp 36:4638–4647, 2015. © 2015 Wiley Periodicals, Inc.
Keywords: testicular cancer, MRI, oncology, cognition, late effects
INTRODUCTION
During the last decades, treatment‐related cognitive dysfunction in noncentral nervous system cancers has received increasing attention. Several studies showed that patients exhibit cognitive dysfunction after cancer treatment, particularly when chemotherapy (CT) was incorporated into their treatment plan [Ahles et al., 2012; Collins et al., 2014; Wefel and Schagen, 2012; Wefel et al., 2015]. Factors contributing to variability in cognitive performance after treatment are not well understood. Studies show that in a subgroup of patients, these cognitive problems may persist for more than 10 years post‐treatment [Koppelmans et al., 2012; Stouten‐Kemperman et al., 2014; Wefel et al., 2010] and can be accompanied by changes in brain structure and brain function [Deprez et al., 2013; Pomykala et al., 2013; de Ruiter and Schagen, 2013]. Evidence for short and long‐term adverse effects of CT has mainly been found in the field of breast cancer research. Till now only a few neuropsychological studies have investigated cognitive function in other types of non‐CNS cancer for which CT is an important treatment strategy, such as testicular cancer (TC) [Pedersen et al., 2009; Schagen et al., 2008; Skaali et al., 2011a; Wefel et al., 2011, 2014]
It is known that cisplatin, which is the cornerstone of combination CT in the treatment of TC, may have neurotoxic side effects. Although cisplatin is generally believed to have poor penetration of the blood‐brain barrier, studies have shown adverse effects of cisplatin on healthy cells through several mechanisms such as oxidative stress, apoptosis and neurogenesis [Dietrich et al., 2006; Fosså et al., 2009; Rzeski et al., 2004; Seigers et al., 2013; Troy et al., 2000]. As circulation of platinum in blood plasma has been demonstrated up to 20 years after administration [Gietema et al., 2000], direct and/or indirect neurotoxic effects may negatively affect cognitive functioning even long after treatment has ended. The other two systemic agents used in the treatment for TC, etoposide and bleomycin, have also been linked to neurotoxicity. For instance, bleomycin is known to induce oxidative stress, and etoposide induces production of proinflammatory cytokines in animals, which in turn may have an impact on the brain and on cognitive functioning [Chen et al., 2007; Wood et al., 2006].
TC is the most common malignancy in young men (15–35 yr). Fortunately, its treatment is highly effective, exceeding the 95% 5‐year survival rates. Many patients are able to return to an active working and social life, as is illustrated by studies showing a similar quality of life and employment rate compared with the general population [Dahl et al., 2005; Rossen et al., 2009; Travis et al., 2010]. However, although most patients return to work, some cancer survivors have to change their occupational role or level [Berg Gudbergsson et al., 2008; de Boer et al., 2009]. It seems that continuing psychosocial and cognitive problems are still present in occupationally active cancer survivors [Duijts et al., 2014].
Up until now, there are only a few studies that have examined the effects of CT on cognition in TC patients. A prospective study showed that patients who received CT after orchiectomy had more cognitive decline when compared to a surveillance group who did not receive additional treatment (0%, 52%, and 67% for the surveillance group, a low CT exposure, and high CT exposure group respectively) [Wefel et al., 2014]. A second, cross‐sectional study, investigating cognitive performance 3 years post treatment, also revealed that significantly more CT treated TC patients (14.3%) have lower cognitive performance compared to a non‐CT group (5.5%) [Schagen et al., 2008]. However, two other studies did not find such differences in cognitive performance either between TC patients before CT treatment and at one‐year follow‐up [Skaali et al., 2011a], or compared to a non‐CT group 2‐7 years post‐treatment [Pedersen et al., 2009]. These mixed results most probably reflect differences in the criteria used to define lower cognitive performance. All studies used a preset cut‐off score, leading to different results depending on the threshold that is set. This method is less suitable for measuring a more diffuse pattern of lower cognitive performance, since subtle deviations will not exceed this threshold.
Taken together, we can conclude that, although TC survivors are generally functioning well, subtle psychosocial problems and lower cognitive performance may persist until many years post‐treatment. Yet, no study has investigated an underlying neurobiological substrate for these observations using MR imaging. Therefore, the present study was undertaken to investigate the effects of CT on cognitive performance in detail across multiple functions and its relation to brain microstructure in TC survivors. Differences in brain gray matter (GM) and white matter (WM) volume were evaluated using voxel‐based morphometry (VBM). Macrosopic WM abnormalities were assessed by visual rating. Further, in addition to Diffusion Tensor Imaging (DTI), we applied a novel diffusion‐based MRI technique, diffusion kurtosis imaging (DKI). DKI is known to provide a more accurate estimation of diffusion parameters compared with (DTI) [Veraart et al., 2011]. DKI estimates the degree of non‐Gaussian diffusion, which is thought to reflect microscopic restrictions in diffusion [Jensen et al., 2005]. Therefore, it can be applied to reveal more detailed information about tissue microstructure (e.g., on increased extracellular space). DKI may therefore be more sensitive than DTI in detecting WM changes after CT.
METHODS
Participants
All TC survivors were recruited at the Netherlands Cancer Institute and written informed consent was obtained from all participants. The study was approved by the review board of the Netherlands Cancer Institute.
The study population consisted of two groups of patients with TC (either seminomatoma or nonseminomatoma): one group of TC patients who received CT after surgery, and one group of TC patients who received surgery only (S‐only). All patients were unilaterally orchidectomized and in the CT group this was followed by 3 or 4 courses of BEP CT (bleomycin 30 mg; etoposide 100 mg/m2; cisplatin 20 mg/m2). All participants were evaluated in an earlier neuropsychological study from our group [Schagen et al., 2008]. In this earlier study, TC patients who received surgery followed by radiotherapy were also cognitively evaluated. In this study, these patients were not included because of their noncomparable tumor types in comparison with the other two groups. The CT and S‐only group are highly homogenous with regard to tumor‐type but represent extremes with regard to treatment, which makes them highly suitable for inclusion in this study.
Participants had to fulfill the following inclusion criteria: previous participation in our neuropsychological study (longitudinal data on cognitive performance will be presented elsewhere), no presence of metastatic disease or relapse, no history of neurological or psychiatric conditions, sufficient command of the Dutch language and eligibility to undergo the MRI scanning session.
The total sample consisted of 28 CT and 23 S‐only TC survivors. See Figure 1 for an overview of patient inclusion. One patient of the CT group and 5 patients of the S‐only group declined MRI assessment. Therefore, MRI data were available in 27 CT and 18 S‐only patients.
Figure 1.
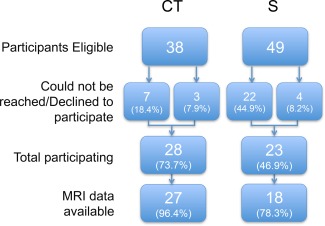
Flowchart of participant inclusion. CT: BEP chemotherapy; S: surgery‐only. [Color figure can be viewed in the online issue, which is available at http://wileyonlinelibrary.com.]
Procedure of the Assessment
A comprehensive battery of 12 neurocognitive tests was used to assess motor and processing speed, executive function, attention and visual and verbal memory (see Table 1 for details on neurocognitive assessment). Patients were also interviewed about potential cognitive problems they encountered in daily life (memory, attention, thinking, and language) [de Jonghe et al., 1990]. Furthermore, we assessed health‐related quality of life, self‐perceived stress, self‐perceived global cognitive problems, trauma, impact of cancer, cancer stereotype vulnerability, and self‐perceived work ability, using various questionnaires (see Table 2 for details).
Table 1.
Description of neuropsychological tests and outcome measures
| Domain | Neurocognitive test | Outcome measure |
|---|---|---|
| Executive Function | Controlled Oral Word Association Test [Benton et al., 1978] | Number of words beginning with specified letter mentioned within 1 min |
| Word Fluency [Deelman et al., 1981] | Number of animals and number of professions mentioned within 1 min | |
| Trail Making Test card B [Reitan, 1958] | Completion time for the task | |
| Tower of London [Culbertson and Zillmer, 1998] | Number of moves | |
| Number of correct items | ||
| Mental rotation Task [van Hemmen et al., 2014] | Number of correct items | |
| Visual memory | Visual Reproduction Test of the Wechsler Memory Scale‐Revised [Wechsler, 1987] | Total score immediate recall |
| Total score delayed recall | ||
| Verbal memory | Dutch version of the California Verbal Learning Test [Mulder et al., 1996] | Number correct responses direct recall |
| Number correct responses delayed recall | ||
| Number correct responses delayed recognition | ||
| Motor speed | Finger‐tapping [Alpherts and Aldenkamp, 1994] | Number of taps dominant hand |
| Number of taps nondominant hand | ||
| Processing speed | Digit Symbol‐Coding Test of the WAIS‐III [Wechsler, 2000] | Number of correctly substituted digits |
| Trail Making Test card A [Reitan, 1958] | Completion time for the task | |
| Attention | Eriksen Flanker Task [Eriksen and Eriksen, 1974] | Reaction time congruent trials |
| Reaction time perceptually incongruent trials | ||
| Reaction time response incongruent trials | ||
| Digit Span of the WAIS‐III [Wechsler, 2000] | Number of correct items |
Table 2.
Description of questionnaires
| Questionnaire | Domain |
|---|---|
| European Organization for Research and Treatment of Cancer (EORTC) Quality of Life Questionnaire‐C30 (QLQ‐C30) [Aaronson et al., 1993] | Health‐related quality of life |
| Perceived Stress Scale [Cohen et al., 1983] | Perceived Stress |
| Trauma Screening Questionnaire [Dekkers et al., 2010] | Previous traumatic experiences/Posttraumatic Stress Disorder |
| Cognitive Functioning Scale‐ Revised of the Medical Outcomes Study [Stewart and Ware, 1992] | Cognitive Complaints |
| Impact of Cancer scale version 2 (IOCv2) [Crespi et al., 2008] | Long‐term impact of disease |
| Stereotype vulnerability questionnaire [Pinel, 1999] | Extent to which patients expect to be stereotyped as a cancer patient by others |
| Workability index [Tuomi et al., 1998] | Two questions on mental and physical self‐perceived workability |
After the assessment the MRI scanning session took place. To assess general physical health, abdominal circumference was measured and diastolic and systolic blood pressures were assessed 3 times. The total experimental procedure lasted ∼3.5 h per participant.
MR Imaging and Data Processing
Multimodal MRI data were obtained at a 3.0 Tesla Ingenia MRI scanner (Philips Medical Systems, Best, The Netherlands) with a dStream SENSE 32‐channel receiver head‐spine coil. A 3D fluid attenuated inversion recovery (FLAIR) scan, a magnetization prepared rapid gradient echo (MPRAGE, TR = 7000 ms, TE = 3200 ms, FOV = 256 × 240 mm, FA = 9°, 180 × 1.0 mm thick sagittal slices, in‐plane resolution of 1 mm2) scan, DKI (also see Fig. 2, TR = 8950 ms, TE = 110 ms, FOV = 240 × 240 mm, scan matrix 96 × 96, in‐plane resolution of 2.5 mm2, 55 axial slices of thickness 2.5 mm, no slice gap, b‐values 700, 1000, and 2500 s/mm2 along 25, 40, and 75 directions [Poot et al., 2010], 10 acquisitions without diffusion weighting, SENSE factor 2 (AP), half scan factor 0.784), multivoxel MR spectroscopy (1H‐MRS) in the bilateral semioval center and task and resting state (rs) fMRI (1H‐MRS and fMRI data will be presented elsewhere).
Figure 2.
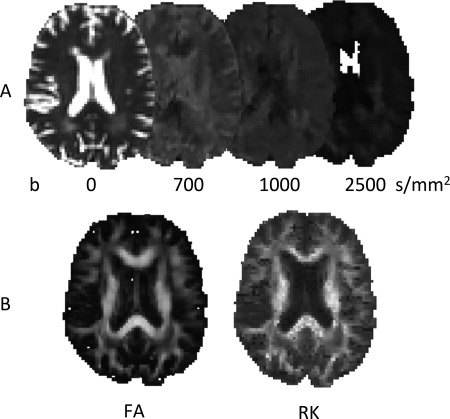
Illustration of DKI. Diffusion weighted images are acquired with different b values (panel A, contrast adjusted) permitting the calculation of various diffusion parameter maps, such as the RK, in addition to the commonly used FA (panel B).
The preprocessing of the diffusion‐weighted MRI data was performed using in‐house developed software, written in Matlab (The MathWorks, Natick, MA). Head motion and deformations induced by eddy currents were corrected for by an affine registration of the diffusion‐weighted images (DWIs) to the averaged non‐DWI. The gradient directions were corrected by the rotation component of the transformation. Rician noise in the DWIs was reduced by an adaptive noise filtering method [Caan et al., 2010]. Diffusion tensors were calculated using a nonlinear least squares estimation. Subsequently, fractional anisotropy (FA) and mean diffusivity (MD) maps were computed for each subject. The Diffusion Kurtosis Tensor and derived parameters Mean, Axial, and Radial Kurtosis (MK/AK/RK) were computed using ExploreDTI software [Leemans and Jeurissen, 2009]. All subjects’ data were then aligned into a common space using the nonlinear registration tool FNIRT [Andersson et al., 2007]. Next, a subject average FA map was created and skeletonized. The resulting FA skeleton represents the center of all major tracts in the population‐based template. Each subject's aligned FA, MD, RD, and AD map was projected onto the skeleton and the resulting data was used for tract‐based spatial statistics (TBSS) or averaged into one summary statistic for each DTI‐measure [Smith et al., 2006].
For VBM, all T1‐weighted images were brain‐extracted using BET [Smith, 2002]. FAST [Zhang et al., 2001] was used for tissue‐type segmentation of GM to create a study‐specific GM template to which all GM images were nonlinearly normalized. All warped images were modulated by dividing each voxel by the Jacobian of the warp field and then smoothed with an isotropic Gaussian kernel with a sigma of 3 mm. Due to scanner hardware problems DKI data were not available for 1 patient of the CT group. FLAIR scans were scored by a radiologist to assess WM abnormalities with the visual rating scale of Fazekas (range 0–3).
Statistical Analysis
Demographic and health‐related variables, patient‐reported outcomes, neurocognitive test scores and Fazekas ratings were analyzed with various statistical procedures within IBM SPSS Statistics 20 (IBM, Armonk, NY). We evaluated cognitive status by calculating a distance score for each patient: the Mahalanobis (MH) distance, which is based on means and covariances of the S group. To all residuals scores that were greater than their respective mean score from the reference group a value of zero was assigned. This way negative scores could not be compensated [Koppelmans et al., 2012]. An advantage of the MH distance is that it is multivariate, taking correlations between tests into account so that it can capture smaller cognitive deviations between multiple tests that would be missed with dichotomized cut‐off scores [DeCarlo, 1997; Koppelmans et al., 2012]. Log2 transformation was applied and subsequently between group differences were tested with an independent sample t‐test.
The mean of all WM DKI values (FA, MD, MK, RK, and AK) across the skeleton, and GM and WM as percentage of intracranial volume were calculated. Group differences were tested in SPSS with ANCOVA, with age as covariate. Focal group differences in WM microstructure (DKI) and GM volume (VBM) were analyzed with voxel‐wise t‐tests (corrected at a cluster level threshold P < 0.05) with age entered as covariate. To do this, the randomize program within FSL was used to perform permutation‐based nonparametric statistical thresholding (5,000 permutations), thereby correcting for multiple comparisons [Nichols and Holmes, 2002].
For correlation analyses we chose to restrict our analyses to measures that showed significant group differences or when a strong correlation was expected based on previous findings. Only significant associations >0.25 were considered meaningful [Colton, 1974]. Voxel‐based correlations between focal DKI measures and MH distance were calculated across groups in FSL. Nonvoxel‐based correlations across groups were calculated in SPSS. We correlated neurocognitive test performance (MH distance) with patient reported outcomes (PROs) and whole brain measures (percentage GM/WM, whole‐brain DKI measures, Fazekas ratings). Further, we correlated PROs with each other. Alpha levels for group differences on PROs were set at P = 0.01, all other analyses were set at P = 0.05.
RESULTS
Demographic, Clinical, and Neurocognitive Data
All patient characteristics and patient‐related outcomes are presented in Table 3. No significant differences were found between groups on estimated premorbid IQ and time since treatment. The CT group was significantly younger than the S‐only group [t(49) = −2.16, P = 0.04]. No significant differences were found between groups on mean scores for any health‐related measures. Lower cognitive performance in the CT group was found, illustrated by a significantly higher MH distance score [t(49) = −2.30, P = 0.03, d = 0.70). Further, the interview indicated a higher report of self‐perceived memory problems in the CT group (35.7 vs. 4.3%, χ 2(2, N = 51) = 7.34, P = 0.007). No significant differences were found on questionnaires regarding self‐perceived stress, cancer stereotype vulnerability, trauma, self‐perceived global cognitive problems, health related quality of life and self‐perceived work ability. 14.8% (n = 4) of the CT group reported that workplace adjustments had to be made in their current job to stay in work. None of the patients reported workplace adjustments in the S‐only group (0%). Further, 11.1% (n = 3) patients changed jobs, compared to none in the S‐only group. These differences did not reach statistical significance. Finally, patients in the CT group scored significantly higher on Body Change Concerns of the IOCv2 subscale than the S group (P = 0.003).
Table 3.
Characteristics of study population, patient‐reported outcomes, and cognitive impairment
| CT | S | |
|---|---|---|
| (n = 28) | (n = 23) | |
| Agea | 43.1 (7.5) | 48.2 (9.5) |
| Estimated IQ (NART) | 95.7 (10.8) | 98.4 (12.0) |
| Years since treatment | 14.7 (2.9) | 14.0 (2.7) |
| Systolic blood pressure (mm Hg) | 133.0 (13.2) | 136.1 (15.9) |
| Diastolic blood pressure (mm Hg) | 83.8 (7.5) | 86.4 (12.4) |
| Abdominal circumference (cm) | 96.2 (11.1) | 96.8 (10.4) |
| Weight (kg) | 88.0 (12.2) | 88.0 (11.4) |
| MH distance scorea | 5.35 (1.7) | 4.4 (0.9) |
| EORTC QLQ‐C30 | ||
| Global quality of life | 78.0 (18.9) | 79.7 (17.2) |
| Cognitive functioning | 81.5 (21.4) | 90.6 (12.1) |
| Physical functioning | 96.9 (5.9) | 95.4 (13.4) |
| Role functioning | 91.1 (22.9) | 85.5 (29.4) |
| Social functioning | 91.1 (23.3) | 90.6 (20.0) |
| Fatigue | 28.0 (26.2) | 25.6 (24.9) |
| PSS | 23.0 (5.7) | 23.9 (5.7) |
| MOS | 77.9 (15.0) | 83.2 (11.6) |
| Stereotype vulnerability | 1.9 (0.6) | 1.7 (0.5) |
| IOCv2 | ||
| Positive impact domains | 3.0 (0.7) | 2.8 (0.7) |
| Altruism and empathy | 3.2 (0.8) | 2.7 (0.9) |
| Health awareness | 3.1 (0.9) | 3.2 (0.9) |
| Meaning of cancer | 2.5 (0.9) | 2.4 (0.9) |
| Positive self‐evaluation | 3.4 (0.8) | 2.7 (0.8) |
| Negative impact domains | 2.0 (0.7) | 1.8 (0.5) |
| Appearance concerns | 1.6 (0.8) | 1.6 (0.6) |
| Body change concernsa | 2.3 (1.0) | 1.8 (0.6) |
| Life interferences | 1.9 (0.8) | 1.6 (0.5) |
| Worry | 2.3 (0.9) | 2.3 (0.7) |
| Employment concerns | 2.0 (0.9) | 2.0 (0.9) |
| Relationship concerns (nonpartnered) | 2.5 (1.0) | 2.5 (1.0) |
| Relationship concerns (partnered) | 3.0 (0.4) | 3.0 (0.4) |
| Work ability | 8.5 (1.6) | 8.6 (1.5) |
| Self‐reported memory problemsa | 35.7% | 4.3% |
Values indicate mean (SD) unless specified otherwise.
P < 0.05.
CT: BEP chemotherapy; S: surgery‐only. EORTC QLQ‐C30, European Organization for Research and Treatment of Cancer health‐related Quality‐of‐Life Questionnaire (a higher score indicates better functioning, except for fatigue), range:0–100); IOCv2: Impact of Cancer Scale version 2, range:1–5; PSS: Perceived Stress Scale, range:10–50; MOS: Cognitive Functioning Scale‐Revised of the Medical Outcomes Study (a higher score indicates less cognitive complaints), range:0–100.
GM and WM Differences
The difference between groups on Fazekas ratings of WM hyperintensities (all between 0 and 2) was marginally significant, being higher for the CT group [χ 2(2, N = 45) = 5.29, P = 0.07]. No significant between group differences were found in global or focal GM nor WM volume (Table 4). Across the WM skeleton there were no significant differences between the CT and S group in MD, FA, MK, and AK values. However, RK was significantly higher in the CT group compared with the S‐only group (F 1,43 = 4.36, P = 0.043). Further, regional analyses with TBSS revealed that significantly higher RK values in the CT group were present in widespread areas of the brain: the body, splenium and genu of the corpus callosum, bilateral internal capsula, bilateral superior longitudinal fasciculus, and bilateral corona radiata (Fig. 3). No other significant voxel‐based differences in DKI parameters were found.
Table 4.
GM and WM measures
| CT | S | |
|---|---|---|
| GM volume (%) | 40.17 (1.33) | 40.04 (1.51) |
| WM volume (%) | 38.10 (1.14) | 37.84 (1.31) |
| MD (μm/s2) | 0.686 (0.026) | 0.704 (0.036) |
| FA | 0.433 (0.042) | 0.420 (0.041) |
| MK | 0.944 (0.059) | 0.901 (0.086) |
| AK | 0.697 (0.035) | 0.703 (0.614) |
| RKa | 1.158 (0.116) | 1.06 (0.133) |
| Fazekas 0 | 16 (59.3%) | 13 (72.2%) |
| Fazekas 1 | 11 (40.7%) | 3 (16.7%) |
| Fazekas 2 | 0 | 2 (11.1%) |
Values indicate mean (SD) unless specified otherwise.
P < 0.05.
CT: BEP chemotherapy; S: surgery‐only.
Figure 3.
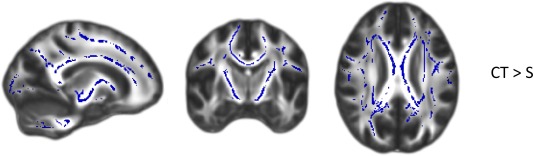
Group differences for RK values analyzed with TBSS (P < 0.05, corrected for multiple comparisons). Group differences are overlaid on a FA map. Blue areas indicate clusters where RK values were significantly higher in CT than S survivors. CT: BEP chemotherapy; S: surgery‐only. MNI coordinates: x = 106, y = 118, and z = 98. [Color figure can be viewed in the online issue, which is available at http://wileyonlinelibrary.com.]
Correlational Analyses of Patient Report Outcomes (PROs)
To investigate the relation between different outcome measures, correlational analyses were performed. Correlational analyses of PROs across all subjects showed that a higher work ability score was related to lower cancer stereotype vulnerability (r = −0.324, P = 0.023), and to lower fatigue scores of the EORTC QLQ‐C30 (r = −0.389, P = 0.006). Further, higher work ability was related to better physical functioning (r = 0.594, P = 0.000), role functioning (r = 0.365, P = 0.010) and social functioning (r = 0.411, P = 0.003) as shown by the subscales of the EORTC QLQ‐C30, and it also was related to a higher global quality of life (r = 0.317, P = 0.026).
Having less cognitive complaints, as measured with the MOS, was significantly related to better social functioning (r = 0.416, P = 0.003), global quality of life (r = 0.559, P = 0.000), and less fatigue (r = −0.519, P = 0.000), lower self‐perceived stress (r = −0.509, P = 0.003), and to lower IOCv2 subscales Health Awareness (r = −0.346, P = 0.014), Body Change Concerns (r = −0.522, P = 0.000), Life Interferences (r = −0.492, P = 0.000), Worry (r = −0.492, P = 0.000), and Negative impact (r = −0.567, P = 0.000).
Correlational Analyses of Cognition and Brain Measures
No significant associations were found between MH Distance score and PROs and any of the neurobiological outcome measures obtained in this study.
DISCUSSION
To the best of our knowledge, this is the first study investigating cognitive function and brain structure in TC survivors long after cisplatin‐based CT. As neurocognitive testing indicated, TC survivors treated with CT exhibit overall lower performance than S‐only treated TC survivors with a moderate effect size. Further, a higher percentage of memory complaints was reported in the CT group. In addition, our neuroimaging data suggest that CT affects WM microstructure, but not GM (volume).
Our observation of self‐perceived memory problems in TC patients after CT are in line with previous studies [Fossa, 2003; Schagen et al., 2008; Skaali et al., 2011b]. On a psychosocial level the two groups were highly comparable except for the significantly higher Body Change Concern subscale in the CT group. Although not significant, notable are the higher reports of workplace adjustments and employer changes that were necessary to stay in work in the CT group. Patient reported outcomes were not related to our neurocognitive measures, but were highly related to each other. The PROs are more likely to reflect psychosocial wellbeing regardless of neurocognitive performance, which is consistent with other studies [Biglia et al., 2012; Schagen et al., 2008; Skaali et al., 2011b].
We observed lower cognitive performance in TC survivors after CT diffusely spread over multiple neurocognitive tests without clear deviations on a specific test or domain. We found indications for effects of CT on WM, demonstrated by a marginally significantly higher Fazekas score and a significantly higher RK in the CT versus the S group across large WM areas in the brain. The higher RK score in the CT group is not straightforward to interpret. Generally, a higher diffusion kurtosis means that the diffusion deviates more from a Gaussian distribution. This is indicative of a more restricted diffusion environment, caused by cellular membranes and myelin sheaths that create a heterogeneous diffusion pattern [Steven et al., 2014]. Accordingly, studies have found that kurtosis parameters decrease with age, probably due to WM degeneration [Coutu et al., 2014; Gong et al., 2014], which was the case for our kurtosis parameters as well (results not shown). Although the CT group was on average 5 years younger than the S group, the higher RK in the CT group was not simply due to lower age as we adjusted for age in our analyses.
However, higher kurtosis parameters have not only been associated with higher levels of WM integrity, but have also been found after experimentally inducing brain injury. More specifically, two studies found that inducing brain injury in rats resulted in elevated DKI levels [Umesh Rudrapatna et al., 2014; Zhuo et al., 2012]. Immunohistochemistry showed that high DKI levels were linked to gliosis and glial scarring whereas conventional DTI measures were less sensitive to this type of injury [Zhuo et al., 2012]. Although it should be noted that these studies acquired DKI shortly after inducing stroke, and studies in humans have shown long term pseudonormalization of DKI parameters after stroke [Taoka et al., 2014], glial scarring might be a long‐term side effect of BEP CT and may explain impaired cognitive performance of the CT group (for a review on the role of glia cells in healthy and diseased aging) [see Rodríguez‐Arellano et al., 2015]. Alternatively, higher RK values in the CT group might reflect WM recovery after initial injury, although this is less likely in view of the higher level of WM hyperintensities and lower cognitive performance in the CT versus the S‐only group. To further test these hypotheses, animal studies will be required to demonstrate the relation between BEP exposure, glial scarring, WM recovery, and kurtosis measures derived from diffusion MRI.
In contrast to earlier studies involving breast cancer patients we did not find negative effects of CT on GM volume [Pomykala et al., 2013]. It is possible that GM recovered after an initial volume reduction, but we do not have imaging data available short after CT treatment to test this hypothesis.
Because of the cross‐sectional design of this study, our ability to draw conclusions about the causality of the relationship between cancer treatment, cognitive impairment, and brain dysfunction is limited. Further, the consent rate in the CT group (74%) was higher than in the S‐only group (47%). Therefore, it is possible that selection bias or other pre‐existing group characteristics are partially reflected in our findings. Further, no healthy control group was included in this study. The proportion of individuals with lower cognitive functioning may have been elevated in both groups compared to a matched group of healthy controls. In addition, studies have shown that TC is often associated with the metabolic syndrome. In turn, metabolic abnormalities may be in part related to cognitive performance and brain structure [Panza et al., 2010; Yates et al., 2012]. Although health‐related factors that are known to be related to metabolic syndrome (blood pressure, BMI, having diabetes, waist circumference) were not significantly different between groups and fell on average in the normal range, we cannot completely rule out the contributory role of metabolic factors.
This study adds to previous studies by using complementary computations of cognitive impairment, thereby allowing the detection of subtle lower cognitive performance across multiple functions long after treatment. Another strength is the use of highly comparable patient groups regarding tumor type and health‐related outcomes. Lastly, the addition of neurobiological outcomes provides more insight into the potential substrate of cognitive dysfunction after treatment for TC.
Most TC survivors live an active (working‐, and social) life at the time of diagnosis. To be able to maintain this lifestyle post‐treatment, integrity of cognitive function is essential. It is important to identify patients who struggle with cognitive problems and to be able to offer them compensatory interventions and support.
In summary, our findings suggest an association between cisplatin‐based CT and cognitive impairment >10 years post‐treatment and provide novel information on the associated radiological phenomena. The late effects of CT for TC on WM warrant further investigation. More extensive, preferably prospective studies with larger sample size are needed to provide more insight in the possible mechanisms behind cognitive problems after treatment for TC.
ACKNOWLEDGMENTS
The authors thank all the participants and colleagues who contributed to our studies. This is a nonindustry‐sponsored study. All authors report no conflict of interests and no financial relationships with commercial interests.
REFERENCES
- Ahles TA, Root JC, Ryan EL (2012): Cancer‐ and cancer treatment‐associated cognitive change: An update on the state of the science. J Clin Oncol 30:3675–3686. [DOI] [PMC free article] [PubMed] [Google Scholar]
- Andersson J, Jenkinson M, Smith S (2007): Non‐linear registration, aka Spatial normalisation. FMRIB Technical Report TR07JA2. Anal Gr Univ Oxford.
- Berg Gudbergsson S, Fosså SD, Dahl Aa (2008): Is cancer survivorship associated with reduced work engagement? A NOCWO Study. J Cancer Surviv 2:159–168. [DOI] [PubMed] [Google Scholar]
- Biglia N, Bounous VE, Malabaila A, Palmisano D, Torta DME, D'Alonzo M, Sismondi P, Torta R (2012): Objective and self‐reported cognitive dysfunction in breast cancer women treated with chemotherapy: A prospective study. Eur J Cancer Care (Engl) 21:485–492. [DOI] [PubMed] [Google Scholar]
- De Boer AGEM Taskila T, Ojajärvi A, van Dijk FJH Verbeek JHAM (2009): Cancer survivors and unemployment: A meta‐analysis and meta‐regression. JAMA 301:753–762. [DOI] [PubMed] [Google Scholar]
- Caan MWA, Khedoe G, Poot D, den Dekker A, Olabarriaga S, Grimbergen K, van Vliet L, Vos F (2010): Adaptive noise filtering for accurate and precise diffusion estimation in fiber crossings. Med Image Comput Comput Assist Interv 13:167–174. [DOI] [PubMed] [Google Scholar]
- Chen Y, Jungsuwadee P, Vore M, Butterfield DA, St Clair DK (2007): Collateral damage in cancer chemotherapy: Oxidative stress in nontargeted tissues. Mol Interv 7:147–156. [DOI] [PubMed] [Google Scholar]
- Collins B, Mackenzie J, Tasca GA, Scherling C, Smith A (2014): Persistent cognitive changes in breast cancer patients 1 year following completion of chemotherapy. J Int Neuropsychol Soc 20:370–379. [DOI] [PubMed] [Google Scholar]
- Colton T (1974): Statistics in Medicine. Boston: Little, Brown and Company; p 211. [Google Scholar]
- Coutu J‐P, Chen JJ, Rosas HD, Salat DH (2014): Non‐Gaussian water diffusion in aging white matter. Neurobiol Aging 35:1412–1421. [DOI] [PMC free article] [PubMed] [Google Scholar]
- Dahl AA, Mykletun A, Fosså SD (2005): Quality of life in survivors of testicular cancer. Urol Oncol 23:193–200. [DOI] [PubMed] [Google Scholar]
- DeCarlo LT (1997): On the meaning and use of kurtosis. Psychol Methods 2:292–307. [Google Scholar]
- Deprez S, Billiet T, Sunaert S, Leemans A (2013): Diffusion tensor MRI of chemotherapy‐induced cognitive impairment in non‐CNS cancer patients: A review. Brain Imaging Behav 7:409–435. [DOI] [PubMed] [Google Scholar]
- Dietrich J, Han R, Yang Y, Mayer‐Pröschel M, Noble M (2006): CNS progenitor cells and oligodendrocytes are targets of chemotherapeutic agents in vitro and in vivo. J Biol 5:22 [DOI] [PMC free article] [PubMed] [Google Scholar]
- Duijts SFA, van Egmond MP, Spelten E, van Muijen P, Anema JR, van der Beek AJ (2014): Physical and psychosocial problems in cancer survivors beyond return to work: A systematic review. Psychooncology 23:481–492. [DOI] [PubMed] [Google Scholar]
- Fossa SD (2003): Quality of life in good prognosis patients with metastatic germ cell cancer: A Prospective Study of the European Organization for Research and Treatment of Cancer Genitourinary Group/Medical Research Council Testicular Cancer Study Group (30941/TE20). J Clin Oncol 21:1107–1118. [DOI] [PubMed] [Google Scholar]
- Fosså SD, Oldenburg J, Dahl AA (2009): Short‐ and long‐term morbidity after treatment for testicular cancer. BJU Int 104:1418–1422. [DOI] [PubMed] [Google Scholar]
- Gietema J, Meinardi M, Messerschmidt J (2000): Circulating plasma platinum more than 10 years after cisplatin treatment for testicular cancer. Lancet 355:1075–1076. [DOI] [PubMed] [Google Scholar]
- Gong N‐J, Wong C‐S, Chan C‐C, Leung L‐M, Chu Y‐C (2014): Aging in deep gray matter and white matter revealed by diffusional kurtosis imaging. Neurobiol Aging 35:2203–2216. [DOI] [PubMed] [Google Scholar]
- Jensen JH, Helpern JA, Ramani A, Lu H, Kaczynski K (2005): Diffusional kurtosis imaging: the quantification of non‐gaussian water diffusion by means of magnetic resonance imaging. Magn Reson Med 53:1432–1440. [DOI] [PubMed] [Google Scholar]
- De Jonghe F, Huyser J, Swinkels J, Sno H, Schalken H (1990): Depressie en Angst lijst.
- Koppelmans V, Breteler MMB, Boogerd W, Seynaeve C, Gundy C, Schagen SB (2012): Neuropsychological performance in survivors of breast cancer more than 20 years after adjuvant chemotherapy. J Clin Oncol 30:1080–1086. [DOI] [PubMed] [Google Scholar]
- Leemans A, Jeurissen B (2009): ExploreDTI: A graphical toolbox for processing, analyzing, and visualizing diffusion MR data. 17th Annual Meeting 245:3300.
- Nichols TE, Holmes AP (2002): Nonparametric permutation tests for functional neuroimaging: A primer with examples. Hum Brain Mapp 15:1–25. [DOI] [PMC free article] [PubMed] [Google Scholar]
- Panza F, Frisardi V, Capurso C, Imbimbo BP, Vendemiale G, Santamato A, D'Onofrio G, Seripa D, Sancarlo D, Pilotto A, Solfrizzi V (2010): Metabolic syndrome and cognitive impairment: Current epidemiology and possible underlying mechanisms. J Alzheimers Dis 21:691–724. [DOI] [PubMed] [Google Scholar]
- Pedersen AD, Rossen P, Mehlsen MY, Pedersen CG, Zachariae R, von der Maase H (2009): Long‐term cognitive function following chemotherapy in patients with testicular cancer. J Int Neuropsychol Soc 15:296–301. [DOI] [PubMed] [Google Scholar]
- Pomykala KL, de Ruiter MB, Deprez S, McDonald BC, Silverman DHS (2013): Integrating imaging findings in evaluating the post‐chemotherapy brain. Brain Imaging Behav 7:436–452. [DOI] [PubMed] [Google Scholar]
- Poot DHJ, den Dekker AJ, Achten E, Verhoye M, Sijbers J (2010): Optimal experimental design for diffusion kurtosis imaging. IEEE Trans Med Imaging 29:819–829. [DOI] [PubMed] [Google Scholar]
- Rodríguez‐Arellano JJ, Parpura V, Zorec R, Verkhratsky A (2015): Astrocytes in physiological aging and Alzheimer's disease. Neuroscience (in press). [DOI] [PubMed] [Google Scholar]
- Rossen PB, Pedersen AF, Zachariae R, von der Maase H (2009): Health‐related quality of life in long‐term survivors of testicular cancer. J Clin Oncol 27:5993–5999. [DOI] [PubMed] [Google Scholar]
- De Ruiter MB, Schagen SB (2013): Functional MRI studies in non‐CNS cancers. Brain Imaging Behav 7:388–408. [DOI] [PubMed] [Google Scholar]
- Rzeski W, Pruskil S, Macke A, Felderhoff‐Mueser U, Reiher AK, Hoerster F, Jansma C, Jarosz B, Stefovska V, Bittigau P, Ikonomidou C (2004): Anticancer agents are potent neurotoxins in vitro and in vivo. Ann Neurol 56:351–360. [DOI] [PubMed] [Google Scholar]
- Schagen SB, Boogerd W, Muller MJ, Huinink WTB, Moonen L, Meinhardt W, Van Dam FS (2008): Cognitive complaints and cognitive impairment following BEP chemotherapy in patients with testicular cancer. Acta Oncol 47:63–70. [DOI] [PubMed] [Google Scholar]
- Seigers R, Schagen SB, Van Tellingen O, Dietrich J (2013): Chemotherapy‐related cognitive dysfunction: Current animal studies and future directions. Brain Imaging Behav 7:453–459. [DOI] [PubMed] [Google Scholar]
- Skaali T, Fosså SD, Andersson S, Cvancarova M, Langberg CW, Lehne G, Dahl AA (2011a): A prospective study of neuropsychological functioning in testicular cancer patients. Ann Oncol 22:1062–1070. [DOI] [PubMed] [Google Scholar]
- Skaali T, Fosså SD, Dahl AA (2011b): A prospective study of cognitive complaints in patients with testicular cancer. Clin Genitourin Cancer 9:6–13. [DOI] [PubMed] [Google Scholar]
- Smith SM (2002): Fast robust automated brain extraction. Hum Brain Mapp 17:143–155. [DOI] [PMC free article] [PubMed] [Google Scholar]
- Smith SM, Jenkinson M, Johansen‐Berg H, Rueckert D, Nichols TE, Mackay CE, Watkins KE, Ciccarelli O, Cader MZ, Matthews PM, Behrens TEJ (2006): Tract‐based spatial statistics: Voxelwise analysis of multi‐subject diffusion data. Neuroimage 31:1487–1505. [DOI] [PubMed] [Google Scholar]
- Steven AJ, Zhuo J, Melhem ER (2014): Diffusion kurtosis imaging: An emerging technique for evaluating the microstructural environment of the brain. AJR Am J Roentgenol 202:W26–W33. [DOI] [PubMed] [Google Scholar]
- Stouten‐Kemperman MM, de Ruiter MB, Koppelmans V, Boogerd W, Reneman L, Schagen SB (2014): Neurotoxicity in breast cancer survivors ≥10 years post‐treatment is dependent on treatment type. Brain Imaging Behav 9:275–284. [DOI] [PubMed] [Google Scholar]
- Taoka T, Fujioka M, Sakamoto M, Miyasaka T, Akashi T, Ochi T, Hori S, Uchikoshi M, Xu J, Kichikawa K (2014): Time course of axial and radial diffusion kurtosis of white matter infarctions: period of pseudonormalization. AJNR Am J Neuroradiol 35:1509–1514. [DOI] [PMC free article] [PubMed] [Google Scholar]
- Travis LB, Beard C, Allan JM, Dahl AA, Feldman DR, Oldenburg J, Daugaard G, Kelly JL, Dolan ME, Hannigan R, Constine LS, Oeffinger KC, Okunieff P, Armstrong G, Wiljer D, Miller RC, Gietema JA, van Leeuwen FE, Williams JP, Nichols CR, Einhorn LH, Fossa SD (2010): Testicular cancer survivorship: research strategies and recommendations. J Natl Cancer Inst 102:1114–1130. [DOI] [PMC free article] [PubMed] [Google Scholar]
- Troy L, McFarland K, Littman‐Power S, Kelly BJ, Walpole ET, Wyld D, Thomson D (2000): Cisplatin‐based therapy: A neurological and neuropsychological review. Psychooncology 9:29–39. [DOI] [PubMed] [Google Scholar]
- Umesh Rudrapatna S, Wieloch T, Beirup K, Ruscher K, Mol W, Yanev P, Leemans A, van der Toorn A, Dijkhuizen RM (2014): Can diffusion kurtosis imaging improve the sensitivity and specificity of detecting microstructural alterations in brain tissue chronically after experimental stroke? Comparisons with diffusion tensor imaging and histology. Neuroimage 97:363–373. [DOI] [PubMed] [Google Scholar]
- Veraart J, Poot DHJ, Van Hecke W, Blockx I, Van der Linden A, Verhoye M, Sijbers J (2011): More accurate estimation of diffusion tensor parameters using diffusion Kurtosis imaging. Magn Reson Med 65:138–145. [DOI] [PubMed] [Google Scholar]
- Wefel JS, Schagen SB (2012): Chemotherapy‐related cognitive dysfunction. Curr Neurol Neurosci Rep 12:267–275. [DOI] [PubMed] [Google Scholar]
- Wefel JS, Saleeba AK, Buzdar AU, Meyers Ca (2010): Acute and late onset cognitive dysfunction associated with chemotherapy in women with breast cancer. Cancer 116:3348–3356. [DOI] [PubMed] [Google Scholar]
- Wefel JS, Vidrine DJ, Veramonti TL, Meyers Ca, Marani SK, Hoekstra HJ, Hoekstra‐Weebers JEHM, Shahani L Gritz ER (2011): Cognitive impairment in men with testicular cancer prior to adjuvant therapy. Cancer 117:190–196. [DOI] [PMC free article] [PubMed] [Google Scholar]
- Wefel JS, Vidrine DJ, Marani SK, Swartz RJ, Veramonti TL, Meyers C, A Hoekstra HJ, Hoekstra‐Weebers JEHM, Gritz ER (2014): A prospective study of cognitive function in men with non‐seminomatous germ cell tumors. Psychooncology 23:626–633. [DOI] [PMC free article] [PubMed] [Google Scholar]
- Wefel JS, Kesler SR, Noll KR, Schagen SB (2015): Clinical characteristics, pathophysiology, and management of noncentral nervous system cancer‐related cognitive impairment in adults. CA Cancer J Clin 65:123–138. [DOI] [PMC free article] [PubMed] [Google Scholar]
- Wood LJ, Nail LM, Gilster A, Winters KA, Elsea CR (2006): Cancer chemotherapy‐related symptoms: evidence to suggest a role for proinflammatory cytokines. Oncol Nurs Forum 33:535–542. [DOI] [PubMed] [Google Scholar]
- Yates KF, Sweat V, Yau PL, Turchiano MM, Convit A (2012): Impact of metabolic syndrome on cognition and brain: A selected review of the literature. Arterioscler Thromb Vasc Biol 32:2060–2067. [DOI] [PMC free article] [PubMed] [Google Scholar]
- Zhang Y, Brady M, Smith S (2001): Segmentation of brain MR images through a hidden Markov random field model and the expectation‐maximization algorithm. IEEE Trans Med Imaging 20:45–57. [DOI] [PubMed] [Google Scholar]
- Zhuo J, Xu S, Proctor JL, Mullins RJ, Simon JZ, Fiskum G, Gullapalli RP (2012): Diffusion kurtosis as an in vivo imaging marker for reactive astrogliosis in traumatic brain injury. Neuroimage 59:467–477. [DOI] [PMC free article] [PubMed] [Google Scholar]