

Abstract
The apolipoprotein E (APOE) gene is associated with structural and functional brain changes. We have used multiscale entropy (MSE) analysis to detect changes in the complexity of resting blood oxygen level‐dependent (BOLD) signals associated with aging and cognitive function. In this study, we further hypothesized that the APOE genotype may affect the complexity of spontaneous BOLD activity in younger and older adults, and such altered complexity may be associated with certain changes in functional connectivity. We conducted a resting‐state functional magnetic resonance imaging experiment in a cohort of 100 younger adults (aged 20–39 years; mean 27.2 ± 4.3 years; male/female: 53/47) and 112 older adults (aged 60–79 years; mean 68.4 ± 6.5 years; male/female: 54/58), and applied voxelwise MSE analysis to assess the main effect of APOE genotype on resting‐state BOLD complexity and connectivity. Although the main effect of APOE genotype on BOLD complexity was not observed in younger group, we observed that older APOE ɛ4 allele carriers had significant reductions in BOLD complexity in precuneus and posterior cingulate regions, relative to noncarriers. We also observed that reduced BOLD complexity in precuneus and posterior cingulate regions was associated with increased functional connectivity to the superior and inferior frontal gyrus in the older group. These results support the compensatory recruitment hypothesis in older APOE ɛ4 carriers, and confer the impact of the APOE genotype on the temporal dynamics of brain activity in older adults. Hum Brain Mapp 35:3238–3248, 2014. © 2013 Wiley Periodicals, Inc.
Keywords: APOE, aging, blood oxygen level dependent, complexity, multiscale entropy
INTRODUCTION
Apolipoprotein E (APOE) is a protein coded by a gene located on chromosome 19, and has three common isoforms, designated ɛ2, ɛ3, and ɛ4 [Strittmatter et al., 1993]. The APOE ɛ4 allele has been studied extensively for its relationship to geriatric cognitive decline [Christensen et al., 2008; Reed et al., 1994] and late‐onset Alzheimer's disease (AD) [Corder et al., 1993; Farrer et al., 1997; Kuusisto et al., 1994; Saunders et al., 1993]. Studies using functional brain imaging have shown that altered brain function associated with APOE ɛ4 allele may occur long before the appearance of AD symptoms [Prvulovic et al., 2011; Small, 1996]. In cognitively normal middle‐aged and older populations, studies with positron emission tomography (PET) found that APOE ɛ4 allele is associated with reduced glucose metabolism [Reiman et al., 1996; Small et al., 1995] but studies with functional magnetic resonance imaging (fMRI) produced mixed results [Trachtenberg et al., 2012; Tuminello and Han, 2011]. Some studies found that APOE ɛ4 allele is associated with reduced functional brain activity in parietal, temporal, and frontal areas [Borghesani et al., 2008; De Blasi et al., 2009; Elgh et al., 2003; Filbey et al., 2010; Lind et al., 2006; Smith et al., 1999; Xu et al., 2009], whereas others found increased activity in the same general regions [Bookheimer et al., 2000; Seidenberg et al., 2009; Smith et al., 2002; Trivedi et al., 2008; Wierenga et al., 2010], and one recent study found both increases and decreases in functional brain activity that varied according to the type of memory function [Kukolja et al., 2010].
Few studies have investigated the impact of APOE genotype on functional brain activities in younger populations. One study with PET found that younger APOE ɛ4 carriers had low rates of glucose metabolism bilaterally in the posterior cingulate, parietal, temporal, and prefrontal cortex, compared with age‐matched noncarriers [Reiman et al., 2004], and a postmortem brain study found that younger APOE ɛ4 carriers had lower posterior cingulate mitochondrial activity than noncarriers [Valla et al., 2010]. fMRI studies found that younger APOE ɛ4 carriers had an increased default mode network (DMN) coactivation, relative to age‐matched noncarriers [Dennis et al., 2010; Filippini et al., 2009a].
Because of mixed fMRI results, an alternative approach is needed for studying the temporal dynamics of functional brain activity, such as the complexity of blood oxygen level‐dependent (BOLD) signals [Fox and Raichle, 2007]. Prior studies have suggested that altered functional connectivity between brain regions is associated with changes in temporal dynamics and the complexity of spontaneous brain activity [Bassett et al., 2012; Fox et al., 2006; Nir et al., 2008]. Because loss of complexity has been suggested as the hallmark of illness and the aging process [Goldberger et al., 2002; Lipsitz and Goldberger, 1992; Vaillancourt and Newell, 2002], investigations of the relationships between complexity and functional connectivity may reveal novel insights into the understanding of the role of aging and genetic predisposition in declining functional brain activity. We have recently applied and validated a complexity measure, multiscale entropy (MSE) analysis [Costa et al., 2002, 2005], to study the complexity of resting BOLD signals in relation to aging and cognitive function [Yang et al., 2011]. We found that reduced complexity of BOLD signals in DMN areas was correlated to increased age and decreased cognitive performance in older adults [Yang et al., 2011]. Another study also showed a regional decrease in complexity of resting‐state BOLD signals among patients with familial AD [Liu et al., 2013].
In this study, we further hypothesized that APOE genotype may affect the complexity of spontaneous BOLD activity in the aging process, and such altered complexity may be associated with certain changes in functional connectivity. Our aims were, therefore, twofold: (1) to assess the effect of APOE genotype on complexity of BOLD signals in the younger and older group, and (2) to assess the functional connectivity associated with altered complexity of BOLD signals, and compare functional connectivity maps across APOE genotypes and age groups. To address these objectives, we conducted a resting fMRI experiment on a large cohort of cognitively normal younger and older adults.
MATERIALS AND METHODS
Participants
This study cohort comprised 212 Han Chinese participants recruited from communities in northern Taiwan. Hundred participants aged 20–39 years comprised the younger group (mean 27.2 ± 4.3 years; male/female: 53/47), and 112 participants aged 60–79 years comprised the older group (mean 68.4 ± 6.5 years; male/female: 54/58). The study was conducted in accordance with the Declaration of Helsinki, receiving approval from the local Institutional Review Board. Each participant was evaluated by a trained research assistant using Mini‐International Neuropsychiatric Interview to exclude the presence of Axis I psychiatric disorders [Sheehan et al., 1998]. All participants were assessed for cognitive function by Mini‐Mental State Examination [Folstein et al., 1975] and Wechsler Digit Span Task [Wechsler, 1997]. Older participants were further assessed by Clinical Dementia Rating Scale (CDR) [Hughes et al., 1982] to exclude dementia (CDR > 0). Overall exclusion criteria for all participants consisted of the following: (1) presence of dementia; (2) presence of Axis I psychiatric disorders, such as schizophrenia, bipolar disorders, or unipolar depression; and (3) a history of neurological conditions, such as head injury, stroke, or Parkinson's disease.
APOE Genotyping
DNA samples for all participants were obtained from blood samples or by buccal swabs. APOE genotypes were determined using PCR‐RFLP [Wenham et al., 1991]. Of 212 participants, there were five genotypes: ɛ2/ɛ2 (n = 1, 0.5%), ɛ2/ɛ3 (n = 30, 14.2%), ɛ3/ɛ3 (n = 148, 69.8%), ɛ2/ɛ4 (n = 5, 2.4%), and ɛ3/ɛ4 (n = 28, 13.2%). The distributions of genotypes did not differ significantly according to the Hardy–Weinberg equilibrium (P = 0.375). When the sample was stratified according to the presence of ɛ4 allele, 33 (15.6%) were ɛ4 carriers and 179 (84.4%) were non‐ɛ4 carriers. The frequency of ɛ4 allele was comparable with frequencies reported in prior studies worldwide (7.9–16.5%) [Hallman et al., 1991; Hong et al., 1996; Myers et al., 1996; Slooter et al., 1998].
fMRI Scanning and Imaging Processing
fMRI scanning was performed at National Yang‐Ming University using a 3.0‐T Siemens MRI Scanner (Siemens Magnetom Tim Trio, Erlangen, Germany) equipped with a 12‐channel head coil. All fMRI experiments were scheduled in the morning. During the experiments, the scanner room was darkened, and the participants were instructed to relax with their eyes closed, without falling asleep. After the resting experiment, the technician routinely asked the participants whether they fell asleep during the resting scan session, and the participants were rescanned if they slept during the resting scan. T2*‐weighted images with BOLD contrast were measured using a gradient echo‐planar imaging (EPI) sequence (repetition time, TR = 2,500 ms, echo time, TE = 27 ms, field of view, FoV = 220 mm, flip angle = 77°, matrix size = 64 × 64, and voxel size = 3.44 mm × 3.44 mm × 3.40 mm). For each run, 200 EPI volume images were acquired along the anterior and posterior commissure (AC–PC) plane. High‐resolution structural T1 images were acquired with three‐dimensional (3D) magnetization‐prepared rapid gradient‐echo sequence (3D‐MPRAGE; TR = 2,530 ms, TE = 3.5 ms, TI = 1,100 ms, FoV = 256 mm, and flip angle = 7°). For each participant, the whole fMRI scanning lasted ∼15 min.
Structural and resting image data were preprocessed and analyzed using SPM8 (Wellcome Department of Imaging Neuroscience, London, UK) implemented in MATLAB (Mathworks, Sherborn, MA). Structural T1 images were segmented and coregistered with resting functional images. Intracranial volume was calculated as the sum of voxel values of gray matter, white matter, and cerebrospinal fluid (CSF) segmented images in native space. Gray matter volumes of left and right hippocampus were also computed using the segmentation and automated anatomical labeling template [Tzourio‐Mazoyer et al., 2002].
Resting images were slice‐timing corrected, realigned, and normalized into the standard stereotaxic space of Montreal Neurological Institute (MNI) EPI template, and resampled to a 3‐mm cubic voxel. Covariates of BOLD time series were regressed out before performing complexity analysis, including the time courses of six head motion, white matter, and CSF. All participants included in this study exhibited a maximum displacement of less than 1.5 mm at each axis and an angular motion of less than 1.5° for each axis. The first five data points (12.5 s) in any BOLD time series were discarded because of the instability of initial MRI scanning, leaving 195 data points in final data. Temporal low‐pass filtering (0.01–0.08 Hz) was performed to reduce the influence of high‐frequency noise from physiologic confounders.
MSE Analysis of BOLD Signals
MSE analysis was developed as a biologically meaningful measure of complexity [Costa et al., 2002, 2005] by quantifying sample entropy [Richman and Moorman, 2000] over multiple timescales inherent in a time series. The procedures involved in MSE calculation can be summarized in the following three steps: (1) construction of coarse‐grained time series according to different scale factors, (2) quantification of the sample entropy of each coarse‐grained time series, and (3) examination of the sample entropy profile over a range of scales. The length of each coarse‐grained time series is equal to the length of original time series divided by the scale factor. For Scale 1, the time series is simply the original time series. Sample entropy is defined by the negative natural logarithm of the conditional probability that a data set of length N, having repeated itself within a tolerance r (similarity factor) for m points (pattern length), will also repeat itself for m + 1 points without allowing self‐matches [Richman and Moorman, 2000]. BOLD time series are usually short (100–200 time points), and the coarse‐grained procedure in MSE with a large‐scale factor may result in short data length and subsequently unreliable sample entropy estimation. To ameliorate this issue, we have estimated the appropriate parameters for MSE calculation from relatively short BOLD signals using parameters of m = 1 and r = 0.35 [Yang et al., 2011].
We averaged the entropy value across all scale factors, and used this averaged entropy as the overall MSE value for a single BOLD time series. We have previously shown that such averaging approach has the advantage of combining information from all scale factors [Yang et al., 2011], and is similar to previous MSE studies with other types of physiological signals [Cheng et al., 2009; Mizuno et al., 2010; Norris et al., 2009; Takahashi et al., 2010; Yang et al., 2013]. For individual resting fMRI data, MSE of BOLD signal was computed at voxelwise levels in all cortical and subcortical voxels to create the whole‐brain MSE parametric map for subsequent group analysis. MSE maps were spatially smoothed (8 mm) in SPM to minimize the differences in the functional anatomy of the brain across subjects [Tomasi and Volkow, 2012]. The MSE algorithm for calculating entropy in functional brain activity is available at (http://www.psynetresearch.org/tools.html).
Seed‐Based Functional Connectivity Analysis
To investigate the relationship between BOLD complexity and functional connectivity, the seed BOLD time series was obtained by averaging the time series of voxels within the brain regions in which the MSE of BOLD signals was affected by APOE genotype. Functional connectivity maps were calculated using Pearson's correlation by correlating the seed BOLD time series against those in every gray matter voxel. Pearson r values were converted to Fisher Z measures using Fisher's r‐to‐z transformation [Lowe et al., 1998].
Statistical Analysis
Statistical analyses of parametric imaging data were conducted using MATLAB. Regional differences in whole‐brain MSE mapping between APOE genotype were examined using the general linear model (GLM), with age, sex, and the interaction of APOE genotype and sex used as regressors to control for nongenetic factors. Because APOE ɛ4 allele is known to affect gray matter structure [Filippini et al., 2009b; Schuff et al., 2009], gray matter probability at the corresponding voxel was also entered in GLM analysis as the covariate of noninterest [Oakes et al., 2007]. However, level of education was not entered in GLM analysis because the assessment of education is often unreliable in older adults.
Significant brain clusters were reported if P value was less than 0.001 for any t test (uncorrected) on a single voxel level with a cluster size greater than 10 voxels, and further corrected by familywise‐error‐rate (FWE) methods at P values of less than 0.05 at the cluster level. The procedures were conducted separately for the younger and older groups to examine the main effect of APOE genotype on the MSE of BOLD signals. The same procedures were also performed for functional connectivity mapping to examine the main effect of APOE genotype on functional connectivity associated with altered BOLD complexity. In addition, GLM was performed on the entire cohort to examine the main effect of age on MSE of BOLD signals, with sex, gray matter probability, and the interaction term of age to sex entered as regressors in the model.
Statistical analyses of demographic, cognitive, and brain morphometric variables were conducted using SPSS for Windows Version 15.0 (SPSS, Chicago, IL). Student's t‐test was used to compare continuous variables, and chi‐squared tests were used to compare categorical variables across APOE genotypes. A P value of less than 0.05 (two‐tailed) was considered statistically significant.
RESULTS
Participants
Within the younger and older groups, significant differences were not observed among the APOE ɛ4 carriers and noncarriers according to age, sex, education, cognitive tests, and brain morphometry measures (Table 1). Furthermore, no differences between APOE ɛ4 carriers and noncarriers were observed in gray matter in both older and younger cohort using a whole‐brain voxel‐based morphometry analysis.
Table 1.
Demographics and clinical characteristics
| Younger (20–39) | APOE ɛ4 carriers (N = 16) | APOE ɛ4 noncarriers (N = 84) | t or x | P |
|---|---|---|---|---|
| Age, year | 28.8 ± 5.6 | 26.9 ± 4.0 | 1.58 | 0.118 |
| Sex, male | 6 (37.5) | 47 (56.0) | 1.17 | 0.279 |
| Education, year | 16.9 ± 2.3 | 17.8 ± 2.6 | −1.34 | 0.183 |
| Handedness, right | 16 (100) | 78 (92.9) | 0.28 | 0.597 |
| Mini‐mental state examination | 28.8 ± 1.4 | 29.2 ± 1.2 | −1.10 | 0.272 |
| Digit forward task | 15.2 ± 0.8 | 15.3 ± 1.6 | −0.33 | 0.739 |
| Digit backward task | 11. ± 3.1 | 10.9 ± 3.0 | 0.16 | 0.869 |
| Intracranial brain volume, cm3 | 1190.8 ± 119.8 | 1176.1 ± 106.6 | 0.50 | 0.621 |
| Gray matter, cm3 | 669.3 ± 98.5 | 693.6 ± 70.9 | −1.17 | 0.243 |
| White matter, cm3 | 521.5 ± 188.2 | 482.5 ± 89.5 | 1.29 | 0.199 |
| CSF volume, cm3 | 565.5 ± 136.8 | 528.8 ± 134.8 | 0.99 | 0.322 |
| Left hippocampus, cm3 | 4.1 ± 0.5 | 4.1 ± 0.4 | −0.08 | 0.935 |
| Right hippocampus, cm3 | 3.8 ± 0.4 | 3.9 ± 0.4 | −0.66 | 0.509 |
| Older (60–79) | APOE ɛ4 carriers (N = 17) | APOE ɛ4 noncarriers (N = 95) | t or x | P |
| Age, year | 69.4 ± 7.4 | 68.2 ± 6.4 | 0.68 | 0.500 |
| Sex, male | 8 (47.1) | 46 (48.4) | 0.03 | 0.862 |
| Education, year | 11.5 ± 6.5 | 11.4 ± 5.5 | 0.06 | 0.952 |
| Handedness, right | 17 (100) | 93 (97.9) | 0.15 | 0.698 |
| Mini‐mental state examination | 27.7 ± 2.2 | 27.4 ± 2.4 | 0.45 | 0.652 |
| Digit forward task | 12.3 ± 2.6 | 13.3 ± 2.3 | −1.66 | 0.100 |
| Digit backward task | 7.3 ± 4.4 | 6.4 ± 3.3 | 1.01 | 0.314 |
| Intracranial brain volume, cm3 | 1047.4 ± 197.5 | 1082.4 ± 250.1 | −0.55 | 0.586 |
| Gray matter, cm3 | 591.0 ± 111.3 | 633.3 ± 260.4 | −0.66 | 0.512 |
| White matter, cm3 | 456.4 ± 90.8 | 449.1 ± 117.0 | 0.24 | 0.808 |
| CSF volume, cm3 | 671.4 ± 124.8 | 722.5 ± 239.3 | −0.86 | 0.394 |
| Left hippocampus, cm3 | 3.5 ± 0.4 | 3.7 ± 0.9 | −0.73 | 0.470 |
| Right hippocampus, cm3 | 3.3 ± 0.4 | 3.5 ± 0.9 | −0.72 | 0.475 |
Categorical data are given as number (%).
Age and MSE of BOLD Signals
Whole‐brain voxelwise analysis examining the effect of age showed four clusters of brain regions in which the MSE of BOLD signals in the younger group was higher than that in the older group (Table 2). No brain regions showed the opposite effect. The largest cluster was found in the left superior temporal gyrus (K E = 422, t = −6.60, P FWE < 0.001), followed by the right superior temporal gyrus (K E = 307, t = −6.69, P FWE < 0.001) and left posterior cingulate gyrus (K E = 117, t = −5.90, P FWE < 0.001). No significant effect of sex or interaction between age and sex on MSE of BOLD signals was observed.
Table 2.
Regions showing decreased MSE of BOLD signals for the older adult group compared with those of the young adult participants
| Brain regiona | MNI coordinates (mm) | Volume (mm3) b | t c | PFWE | Multiscale entropy (MSE) | |||
|---|---|---|---|---|---|---|---|---|
| x | y | z | Younger (N = 100) | Older (N = 112) | ||||
| Left superior temporal gyrus | −45 | 9 | −12 | 11,394 | −6.60 | <0.001 | 1.47 ± 0.02 | 1.43 ± 0.03 |
| Right superior temporal gyrus | 42 | 0 | −12 | 8,289 | −6.69 | <0.001 | 1.47 ± 0.03 | 1.43 ± 0.04 |
| Left posterior cingulate gyrus | −12 | −63 | −9 | 3,159 | −5.90 | <0.001 | 1.48 ± 0.03 | 1.45 ± 0.04 |
| Left anterior cingulate cortex | 0 | 30 | 0 | 1,323 | −5.86 | 0.003 | 1.48 ± 0.03 | 1.45 ± 0.04 |
No regions showed the opposite effect.
Volume was computed from cluster size (3 mm × 3 mm × 3 mm voxel).
The main effect of age on MSE of BOLD signals was controlled for sex, gray matter volume, and interactions between age and sex.
APOE and MSE of BOLD Signals
Figure 1 shows the whole‐brain voxelwise analysis examining the main effect of APOE genotype in the younger and older groups (see Table 3 for detailed statistical results). The APOE genotype effect on MSE of BOLD signals was controlled for age, sex, gray matter probability, and APOE and sex interaction in GLM analysis. In the younger group, APOE ɛ4 carriers showed trends of reduced MSE of BOLD signals in the left precuneus and posterior cingulate cortex regions (Fig. 1a), but the cluster was not significant after FWE corrections (K E = 7, P FWE = 0.505). In the older group (Fig. 1b), whole‐brain analysis showed that APOE ɛ4 carriers had significantly reduced MSE of BOLD signals in the same regions at cluster level after FWE corrections (K E = 26, P FWE = 0.036). Neither a significant effect of sex nor an interaction between sex and APOE genotype was detected for MSE of BOLD signals within the younger and older groups.
Figure 1.
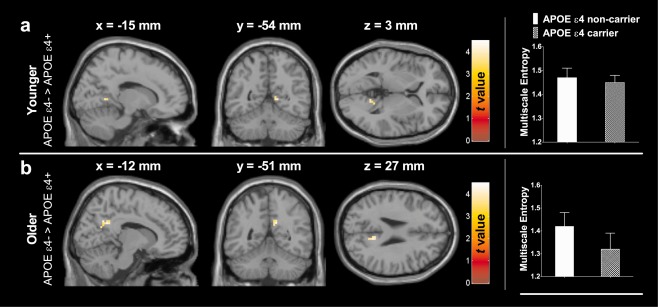
Voxelwise comparison of reduced MSE of BOLD signals in APOE ɛ4 carries, relative to APOE ɛ4 noncarries among (a) the young adult group and (b) the older adult group. Only the older adult group showed significant main effect of APOE genotype after correction for multiple comparisons. No opposite effect of the APOE genotype on MSE of BOLD signals was found. The coordinates represent the location of peak intensity.
Table 3.
Regions showing decreased MSE of BOLD signals for APOE ɛ4 carriers compared with APOE ɛ4 noncarriers, controlling for age, sex, and gray matter volume
| Brain regiona | BA | MNI coordinates (mm) | Volume (mm3) b | t c | PFWE | Multiscale entropy (MSE) | |||
|---|---|---|---|---|---|---|---|---|---|
| x | y | z | APOE ɛ4 carriers | APOE ɛ4 noncarriers | |||||
| Younger | |||||||||
| Left posterior cingulate and left precuneus | 30 | −15 | −54 | 3 | 189 | −3.71 | 0.505 | 1.45 ± 0.03 | 1.47 ± 0.04 |
| Older | |||||||||
| Left posterior cingulate and left precuneus | 31 | −12 | −51 | 27 | 702 | −4.30 | 0.036 | 1.32 ± 0.07 | 1.42 ± 0.06 |
BA, Brodmann area.
No regions showed the opposite effect.
Volume was computed from cluster size (3 mm × 3 mm × 3 mm voxel).
The main effect of APOE ɛ4 on MSE of BOLD signals was controlled for age, sex, gray matter volume, and interactions between sex and APOE.
Relationship Between BOLD Complexity and Functional Connectivity
Because only older groups showed the main effect of APOE genotype on the decreased BOLD complexity, we used the cluster identified in the older group (Fig. 1b) as the seed, and computed the voxelwise functional connectivity in all gray matter regions. Table 4 shows the main effect of APOE genotype on the functional connectivity in each age group.
Table 4.
Regions showing altered functional connectivity for APOE ɛ4 carriers and noncarriers using the posterior cingulate seed (x = −12 mm, y = −51 mm, z = 27 mm)
| Brain region | BA | MNI coordinates (mm) | Volume (mm3) a | t b | PFWE | ||
|---|---|---|---|---|---|---|---|
| x | y | z | |||||
| Younger | |||||||
| None | |||||||
| Older | |||||||
| Right inferior frontal gyrus | 46 | 51 | 36 | 9 | 702 | 5.03 | 0.036 |
| Right superior frontal gyrus, medial | 6/8 | 6 | 30 | 45 | 864 | 4.27 | 0.017 |
BA, Brodmann area.
Volume was computed from cluster size (3 mm × 3 mm × 3 mm voxel).
The effect of APOE ɛ4 on functional connectivity was controlled for age, sex, and interaction between sex and APOE.
In the younger group, no effect of APOE genotype on functional connectivity was detected. In the older APOE ɛ4 carriers (Fig. 2), increased functional connectivity in two clusters of brain regions was observed, compared with noncarriers (Table 4), including the right inferior frontal gyrus (P FWE = 0.036) and the right medial superior frontal gyrus (P FWE = 0.017). No sex and APOE genotype interaction with functional connectivity was identified in results of GLM analysis.
Figure 2.

Difference of functional connectivity in older APOE ɛ4 carries and noncarriers between the seed region identified in the older adult group (see Table 3 and Fig. 1b) and all gray matter voxels.
Relationship Between BOLD Complexity and Cognitive Functions
To assess whether reduced BOLD complexity in APOE ɛ4 carriers could be correlated with cognitive functions, we extracted mean MSE values within the cluster identified in the older group (Fig. 1b), and tested the correlation between extracted MSE values and cognitive functions. We did not find significant correlations within younger and older group, or groups stratified by APOE genotype.
DISCUSSION
We applied voxelwise MSE analysis to investigate the effect of APOE genotype on the complexity of resting BOLD signals in younger and older adults. Our key finding is that older participants bearing the APOE ɛ4 allele had significant reductions in BOLD complexity in the precuneus and posterior cingulate regions. We also identified that reduced BOLD complexity in the precuneus and the posterior cingulate regions was associated with increased functional connectivity to superior and inferior frontal areas in older adults. Our study represents a pioneering investigation of genetic effects on the loss of brain complexity in a large, broadly aged cohort.
Effect of APOE Genotype on Resting Brain Complexity
Consistent with loss of brain complexity hypothesis [Yang and Tsai, 2013], our whole‐brain analysis showed significantly reduced BOLD complexity in the precuneus and posterior cingulate only in older APOE ɛ4 carriers, suggesting an effect of APOE genotype on reduced BOLD complexity in older age. This finding also complements prior fMRI research in that older APOE ɛ4 carriers had decreased activation in various brain regions, including cingulate cortex [Filbey et al., 2010; Xu et al., 2009]. Although we did not find the effect of APOE genotype in younger adults, prior PET and DTI studies show that younger APOE ɛ4 carriers exhibited reduced metabolism [Reiman et al., 2004; Valla et al., 2010] and decreased fractional anisotropy in the cingulum regions [Heise et al., 2011], relative to younger noncarriers. The mechanism by which the APOE genotype affects the complexity of brain activity across lifespan remains unclear. Such reduced BOLD complexity may be linked to metabolic dysfunction and disruption of white matter integrity.
Research on the effects of APOE genotype in healthy adults has suggested that the APOE ɛ4 allele may be beneficial at earlier ages, and may only confer risk of cognitive decline later in life, suggesting antagonistic pleiotropy hypothesis [Tuminello and Han, 2011]. However, brain‐imaging studies of the relationships between APOE ɛ4 and cognitive function in early life have yielded inconsistent results [Tuminello and Han, 2011]. In our study, the cognitive test results of the APOE ɛ4 carriers were indistinguishable from their age‐matched noncarrier counterparts. Furthermore, the BOLD complexity findings in our study do not support antagonistic pleiotropy hypothesis because altered complexity of resting brain activity was observed only in older adults.
Effect of APOE Genotype on Functional Connectivity
Prior studies on the relationship between APOE genotype and functional connectivity have produced complex results [Trachtenberg et al., 2012; Tuminello and Han, 2011]. Although the role of APOE genotype on functional connectivity in younger APOE ɛ4 carriers remains uncertain, converging literatures suggest a dysfunction of functional connectivity in asymptomatic older APOE ɛ4 carriers, particularly in DMN area [Seeley, 2011]. Our findings may add to prior functional connectivity research that increased functional connectivity to various frontal areas was seen in older APOE ɛ4 carriers, relative to noncarriers. Because such increased functional connectivity was involved in the DMN area of precuneus and posterior cingulate regions with reduced BOLD complexity, these brain regions are known to be one of the earliest metabolically affected areas among patients with early AD [Huang et al., 2002; Kogure et al., 2000; Minoshima et al., 1997]. Collectively, our findings of disruption in DMN complexity with enhancement of frontal connectivity in older APOE ɛ4 carriers may support the compensatory recruitment hypothesis [Bookheimer et al., 2000; Trachtenberg et al., 2012] that older APOE ɛ4 carriers, although not exhibiting signs and symptoms of declined cognitive function, may exhibit compensatory recruitment in the brain regions that are commonly impacted in AD [Tuminello and Han, 2011]. However, an alternative explanation to our results should also include the disinhibition hypothesis [Seeley, 2011], as a recent study showed that, relative to noncarriers, the older APOE ɛ4 carriers were associated with the decreased functional connectivity in DMN and increased functional connectivity in salience network, which is inversely correlated with DMN in resting state [Machulda et al., 2011]. The disruption of DMN complexity may also lead to disinhibition of salience network, resulting in the enhancement of frontal connectivity.
Effect of Age on Resting Brain Complexity
Our findings of age‐related changes in complexity of BOLD signals are consistent with our previous report that was based on a smaller cohort of men only [Yang et al., 2011]. We advanced our previous findings in terms of voxelwise MSE analysis and the equal representation of the sexes in both age groups. Our complexity approach is parallel to prior investigations of BOLD variability, such as the standard deviation of BOLD signals, which showed that older adults had less variability in BOLD signals than their younger counterparts [Garrett et al., 2011]. However, these previous investigations also showed increased variability in several subcortical regions that were correlated to poorer cognitive performance and increasing age [Garrett et al., 2011; Samanez‐Larkin et al., 2010]; thus, reconciling the findings of complexity and conventional view of variability requires extensive research in the future.
Limitations
We acknowledge certain limitations to the findings of our study. First, the cross‐sectional study design requires longitudinal follow‐up to determine whether reduced BOLD complexity in the precuneus and posterior cingulate is associated with a higher risk of developing later pathologies. Second, similar to other BOLD time‐course studies, we cannot eliminate the effects of physiologic noise entirely because of a relatively low sampling rate (TR = 2.5 s), despite low‐pass filtering [Lowe et al., 1998]. Third, the relatively short BOLD time courses of 195 data points used in our study may contribute to unreliable entropy calculations on a broad scale. However, sample entropy used in MSE is less sensitive to constraint of time series length than other entropy measures, such as approximate entropy [Richman and Moorman, 2000], and we have demonstrated in our previous research that the use of m = 1 and r = 0.35 for computing MSE in short BOLD signals may produce reliable results [Yang et al., 2011]. Indeed, we evaluated the present results using m = 2 and r = 0.35 and did not find significant changes in BOLD complexity related to APOE genotype. Lastly, other genes are also known to contribute to AD risks, such as BACE1 [Cole and Vassar, 2007], S100B [Mrak and Griffinbc, 2001], CALHM1 [Lambert et al., 2010], or CLU/CR1 [Lambert et al., 2009]. Further study is required to investigate the possible influences of these genes on the interactions of the APOE genotype and resting BOLD complexity.
CONCLUSIONS
By using MSE analysis, we evaluated the influence of APOE ɛ4 allele on resting brain complexity in younger and older adults and its relationships to functional connectivity. Our results confer an impact of the APOE genotype on the dynamics of local brain activity in older population. Moreover, because the observed areas of reduced BOLD complexity mirror those seen in early AD, our findings contribute to a better understanding of the increased risk of neurodegenerative diseases in APOE ɛ4 carriers.
Conflicts of interest: Nothing to report.
REFERENCES
- Bassett DS, Nelson BG, Mueller BA, Camchong J, Lim KO (2012): Altered resting state complexity in schizophrenia. Neuroimage 59:2196–2207. [DOI] [PMC free article] [PubMed] [Google Scholar]
- Bookheimer SY, Strojwas MH, Cohen MS, Saunders AM, Pericak‐Vance MA, Mazziotta JC, Small GW (2000): Patterns of brain activation in people at risk for Alzheimer's disease. N Engl J Med 343:450–456. [DOI] [PMC free article] [PubMed] [Google Scholar]
- Borghesani PR, Johnson LC, Shelton AL, Peskind ER, Aylward EH, Schellenberg GD, Cherrier MM (2008): Altered medial temporal lobe responses during visuospatial encoding in healthy APOE*4 carriers. Neurobiol Aging 29:981–991. [DOI] [PMC free article] [PubMed] [Google Scholar]
- Cheng D, Tsai SJ, Hong CJ, Yang AC (2009): Reduced physiological complexity in robust elderly adults with the APOE epsilon4 allele. PLoS One 4:e7733. [DOI] [PMC free article] [PubMed] [Google Scholar]
- Christensen H, Batterham PJ, Mackinnon AJ, Jorm AF, Mack HA, Mather KA, Anstey KJ, Sachdev PS, Easteal S (2008): The association of APOE genotype and cognitive decline in interaction with risk factors in a 65‐69 year old community sample. BMC Geriatr 8:14. [DOI] [PMC free article] [PubMed] [Google Scholar]
- Cole SL, Vassar R (2007): The Alzheimer's disease beta‐secretase enzyme, BACE1. Mol Neurodegener 2:22. [DOI] [PMC free article] [PubMed] [Google Scholar]
- Corder EH, Saunders AM, Strittmatter WJ, Schmechel DE, Gaskell PC, Small GW, Roses AD, Haines JL, Pericak‐Vance MA (1993): Gene dose of apolipoprotein E type 4 allele and the risk of Alzheimer's disease in late onset families. Science 261:921–923. [DOI] [PubMed] [Google Scholar]
- Costa M, Goldberger AL, Peng CK (2002): Multiscale entropy analysis of complex physiologic time series. Phys Rev Lett 89:068102. [DOI] [PubMed] [Google Scholar]
- Costa M, Goldberger AL, Peng CK (2005): Multiscale entropy analysis of biological signals. Phys Rev E Stat Nonlin Soft Matter Phys 71:021906. [DOI] [PubMed] [Google Scholar]
- De Blasi S, Montesanto A, Martino C, Dato S, De Rango F, Bruni AC, Mari V, Feraco E, Passarino G (2009): APOE polymorphism affects episodic memory among non demented elderly subjects. Exp Gerontol 44:224–227. [DOI] [PubMed] [Google Scholar]
- Dennis NA, Browndyke JN, Stokes J, Need A, Burke JR, Welsh‐Bohmer KA, Cabeza R (2010): Temporal lobe functional activity and connectivity in young adult APOE varepsilon4 carriers. Alzheimers Dement 6:303–311. [DOI] [PMC free article] [PubMed] [Google Scholar]
- Elgh E, Larsson A, Eriksson S, Nyberg L (2003): Altered prefrontal brain activity in persons at risk for Alzheimer's disease: An fMRI study. Int Psychogeriatr 15:121–133. [DOI] [PubMed] [Google Scholar]
- Farrer LA, Cupples LA, Haines JL, Hyman B, Kukull WA, Mayeux R, Myers RH, Pericak‐Vance MA, Risch N, van Duijn CM (1997): Effects of age, sex, and ethnicity on the association between apolipoprotein E genotype and Alzheimer disease. A meta‐analysis. APOE and Alzheimer disease meta analysis consortium. JAMA 278:1349–1356. [PubMed] [Google Scholar]
- Filbey FM, Chen G, Sunderland T, Cohen RM (2010): Failing compensatory mechanisms during working memory in older apolipoprotein E‐epsilon4 healthy adults. Brain Imaging Behav 4:177–188. [DOI] [PMC free article] [PubMed] [Google Scholar]
- Filippini N, MacIntosh BJ, Hough MG, Goodwin GM, Frisoni GB, Smith SM, Matthews PM, Beckmann CF, Mackay CE (2009a): Distinct patterns of brain activity in young carriers of the APOE‐epsilon4 allele. Proc Natl Acad Sci USA 106:7209–7214. [DOI] [PMC free article] [PubMed] [Google Scholar]
- Filippini N, Rao A, Wetten S, Gibson RA, Borrie M, Guzman D, Kertesz A, Loy‐English I, Williams J, Nichols T, Whitcher B, Matthews PM (2009b): Anatomically‐distinct genetic associations of APOE epsilon4 allele load with regional cortical atrophy in Alzheimer's disease. Neuroimage 44:724–728. [DOI] [PubMed] [Google Scholar]
- Folstein MF, Folstein SE, McHugh PR (1975): “Mini‐mental state”. A practical method for grading the cognitive state of patients for the clinician. J Psychiatr Res 12:189–198. [DOI] [PubMed] [Google Scholar]
- Fox MD, Raichle ME (2007): Spontaneous fluctuations in brain activity observed with functional magnetic resonance imaging. Nat Rev Neurosci 8:700–711. [DOI] [PubMed] [Google Scholar]
- Fox MD, Snyder AZ, Zacks JM, Raichle ME (2006): Coherent spontaneous activity accounts for trial‐to‐trial variability in human evoked brain responses. Nat Neurosci 9:23–25. [DOI] [PubMed] [Google Scholar]
- Garrett DD, Kovacevic N, McIntosh AR, Grady CL (2011): The importance of being variable. J Neurosci 31:4496–4503. [DOI] [PMC free article] [PubMed] [Google Scholar]
- Goldberger AL, Peng CK, Lipsitz LA (2002): What is physiologic complexity and how does it change with aging and disease? Neurobiol Aging 23:23–26. [DOI] [PubMed] [Google Scholar]
- Hallman DM, Boerwinkle E, Saha N, Sandholzer C, Menzel HJ, Csazar A, Utermann G (1991): The apolipoprotein E polymorphism: A comparison of allele frequencies and effects in nine populations. Am J Hum Genet 49:338–349. [PMC free article] [PubMed] [Google Scholar]
- Heise V, Filippini N, Ebmeier KP, Mackay CE (2011): The APOE varepsilon4 allele modulates brain white matter integrity in healthy adults. Mol Psychiatry 16:908–916. [DOI] [PubMed] [Google Scholar]
- Hong CJ, Liu TY, Liu HC, Wang SJ, Fuh JL, Chi CW, Lee KY, Sim CB (1996): Epsilon 4 allele of apolipoprotein E increases risk of Alzheimer's disease in a Chinese population. Neurology 46:1749–1751. [DOI] [PubMed] [Google Scholar]
- Huang C, Wahlund LO, Svensson L, Winblad B, Julin P (2002): Cingulate cortex hypoperfusion predicts Alzheimer's disease in mild cognitive impairment. BMC Neurol 2:9. [DOI] [PMC free article] [PubMed] [Google Scholar]
- Hughes CP, Berg L, Danziger WL, Coben LA, Martin RL (1982): A new clinical scale for the staging of dementia. Br J Psychiatry 140:566–572. [DOI] [PubMed] [Google Scholar]
- Kogure D, Matsuda H, Ohnishi T, Asada T, Uno M, Kunihiro T, Nakano S, Takasaki M (2000): Longitudinal evaluation of early Alzheimer's disease using brain perfusion SPECT. J Nucl Med 41:1155–1162. [PubMed] [Google Scholar]
- Kukolja J, Thiel CM, Eggermann T, Zerres K, Fink GR (2010): Medial temporal lobe dysfunction during encoding and retrieval of episodic memory in non‐demented APOE epsilon4 carriers. Neuroscience 168:487–497. [DOI] [PubMed] [Google Scholar]
- Kuusisto J, Koivisto K, Kervinen K, Mykkanen L, Helkala EL, Vanhanen M, Hanninen T, Pyorala K, Kesaniemi YA, Riekkinen P, et al. (1994): Association of apolipoprotein E phenotypes with late onset Alzheimer's disease: population based study. BMJ 309:636–638. [DOI] [PMC free article] [PubMed] [Google Scholar]
- Lambert JC, Heath S, Even G, Campion D, Sleegers K, Hiltunen M, Combarros O, Zelenika D, Bullido MJ, Tavernier B, Letenneur L, Bettens K, Berr C, Pasquier F, Fievet N, Barberger‐Gateau P, Engelborghs S, De Deyn P, Mateo I, Franck A, Helisalmi S, Porcellini E, Hanon O, de Pancorbo MM, Lendon C, Dufouil C, Jaillard C, Leveillard T, Alvarez V, Bosco P, Mancuso M, Panza F, Nacmias B, Bossu P, Piccardi P, Annoni G, Seripa D, Galimberti D, Hannequin D, Licastro F, Soininen H, Ritchie K, Blanche H, Dartigues JF, Tzourio C, Gut I, Van Broeckhoven C, Alperovitch A, Lathrop M, Amouyel P (2009): Genome‐wide association study identifies variants at CLU and CR1 associated with Alzheimer's disease. Nat Genet 41:1094–1099. [DOI] [PubMed] [Google Scholar]
- Lambert JC, Sleegers K, Gonzalez‐Perez A, Ingelsson M, Beecham GW, Hiltunen M, Combarros O, Bullido MJ, Brouwers N, Bettens K, Berr C, Pasquier F, Richard F, Dekosky ST, Hannequin D, Haines JL, Tognoni G, Fievet N, Dartigues JF, Tzourio C, Engelborghs S, Arosio B, Coto E, De Deyn P, Del Zompo M, Mateo I, Boada M, Antunez C, Lopez‐Arrieta J, Epelbaum J, Schjeide BM, Frank‐Garcia A, Giedraitis V, Helisalmi S, Porcellini E, Pilotto A, Forti P, Ferri R, Delepine M, Zelenika D, Lathrop M, Scarpini E, Siciliano G, Solfrizzi V, Sorbi S, Spalletta G, Ravaglia G, Valdivieso F, Vepsalainen S, Alvarez V, Bosco P, Mancuso M, Panza F, Nacmias B, Bossu P, Hanon O, Piccardi P, Annoni G, Mann D, Marambaud P, Seripa D, Galimberti D, Tanzi RE, Bertram L, Lendon C, Lannfelt L, Licastro F, Campion D, Pericak‐Vance MA, Soininen H, Van Broeckhoven C, Alperovitch A, Ruiz A, Kamboh MI, Amouyel P (2010): The CALHM1 P86L polymorphism is a genetic modifier of age at onset in Alzheimer's disease: A meta‐analysis study. J Alzheimers Dis 22:247–255. [DOI] [PMC free article] [PubMed] [Google Scholar]
- Lind J, Persson J, Ingvar M, Larsson A, Cruts M, Van Broeckhoven C, Adolfsson R, Backman L, Nilsson LG, Petersson KM, Nyberg L (2006): Reduced functional brain activity response in cognitively intact apolipoprotein E epsilon4 carriers. Brain 129:1240–1248. [DOI] [PubMed] [Google Scholar]
- Lipsitz LA, Goldberger AL (1992): Loss of 'complexity' and aging. Potential applications of fractals and chaos theory to senescence. JAMA 267:1806–1809. [PubMed] [Google Scholar]
- Liu CY, Krishnan AP, Yan L, Smith RX, Kilroy E, Alger JR, Ringman JM, Wang DJ (2013): Complexity and synchronicity of resting state blood oxygenation level‐dependent (BOLD) functional MRI in normal aging and cognitive decline. J Magn Reson Imaging 38:36–45. [DOI] [PMC free article] [PubMed] [Google Scholar]
- Lowe MJ, Mock BJ, Sorenson JA (1998): Functional connectivity in single and multislice echoplanar imaging using resting‐state fluctuations. Neuroimage 7:119–132. [DOI] [PubMed] [Google Scholar]
- Machulda MM, Jones DT, Vemuri P, McDade E, Avula R, Przybelski S, Boeve BF, Knopman DS, Petersen RC, Jack CR, Jr (2011): Effect of APOE epsilon4 status on intrinsic network connectivity in cognitively normal elderly subjects. Arch Neurol 68:1131–1136. [DOI] [PMC free article] [PubMed] [Google Scholar]
- Minoshima S, Giordani B, Berent S, Frey KA, Foster NL, Kuhl DE (1997): Metabolic reduction in the posterior cingulate cortex in very early Alzheimer's disease. Ann Neurol 42:85–94. [DOI] [PubMed] [Google Scholar]
- Mizuno T, Takahashi T, Cho RY, Kikuchi M, Murata T, Takahashi K, Wada Y (2010): Assessment of EEG dynamical complexity in Alzheimer's disease using multiscale entropy. Clin Neurophysiol 121:1438–1446. [DOI] [PMC free article] [PubMed] [Google Scholar]
- Mrak RE, Griffinbc WS. (2001): The role of activated astrocytes and of the neurotrophic cytokine S100B in the pathogenesis of Alzheimer's disease. Neurobiol Aging 22:915–922. [DOI] [PubMed] [Google Scholar]
- Myers RH, Schaefer EJ, Wilson PW, D'Agostino R, Ordovas JM, Espino A, Au R, White RF, Knoefel JE, Cobb JL, McNulty KA, Beiser A, Wolf PA (1996): Apolipoprotein E epsilon4 association with dementia in a population‐based study: The Framingham study. Neurology 46:673–677. [DOI] [PubMed] [Google Scholar]
- Nir Y, Mukamel R, Dinstein I, Privman E, Harel M, Fisch L, Gelbard‐Sagiv H, Kipervasser S, Andelman F, Neufeld MY, Kramer U, Arieli A, Fried I, Malach R (2008): Interhemispheric correlations of slow spontaneous neuronal fluctuations revealed in human sensory cortex. Nat Neurosci 11:1100–1108. [DOI] [PMC free article] [PubMed] [Google Scholar]
- Norris PR, Canter JA, Jenkins JM, Moore JH, Williams AE, Morris JA, Jr (2009): Personalized Medicine: Genetic variation and loss of physiologic complexity are associated with mortality in 644 trauma patients. Ann Surg 250:524–530. [DOI] [PubMed] [Google Scholar]
- Oakes TR, Fox AS, Johnstone T, Chung MK, Kalin N, Davidson RJ (2007): Integrating VBM into the general linear model with voxelwise anatomical covariates. Neuroimage 34:500–508. [DOI] [PMC free article] [PubMed] [Google Scholar]
- Prvulovic D, Bokde AL, Faltraco F, Hampel H (2011): Functional magnetic resonance imaging as a dynamic candidate biomarker for Alzheimer's disease. Prog Neurobiol 95:557–569. [DOI] [PubMed] [Google Scholar]
- Reed T, Carmelli D, Swan GE, Breitner JC, Welsh KA, Jarvik GP, Deeb S, Auwerx J (1994): Lower cognitive performance in normal older adult male twins carrying the apolipoprotein E epsilon 4 allele. Arch Neurol 51:1189–1192. [DOI] [PubMed] [Google Scholar]
- Reiman EM, Caselli RJ, Yun LS, Chen K, Bandy D, Minoshima S, Thibodeau SN, Osborne D (1996): Preclinical evidence of Alzheimer's disease in persons homozygous for the epsilon 4 allele for apolipoprotein E. N Engl J Med 334:752–758. [DOI] [PubMed] [Google Scholar]
- Reiman EM, Chen K, Alexander GE, Caselli RJ, Bandy D, Osborne D, Saunders AM, Hardy J (2004): Functional brain abnormalities in young adults at genetic risk for late‐onset Alzheimer's dementia. Proc Natl Acad Sci USA 101:284–289. [DOI] [PMC free article] [PubMed] [Google Scholar]
- Richman JS, Moorman JR (2000): Physiological time‐series analysis using approximate entropy and sample entropy. Am J Physiol Heart Circ Physiol 278:H2039–H2049. [DOI] [PubMed] [Google Scholar]
- Samanez‐Larkin GR, Kuhnen CM, Yoo DJ, Knutson B (2010): Variability in nucleus accumbens activity mediates age‐related suboptimal financial risk taking. J Neurosci 30:1426–1434. [DOI] [PMC free article] [PubMed] [Google Scholar]
- Saunders AM, Schmader K, Breitner JC, Benson MD, Brown WT, Goldfarb L, Goldgaber D, Manwaring MG, Szymanski MH, McCown N, et al. (1993): Apolipoprotein E epsilon 4 allele distributions in late‐onset Alzheimer's disease and in other amyloid‐forming diseases. Lancet 342:710–711. [DOI] [PubMed] [Google Scholar]
- Schuff N, Woerner N, Boreta L, Kornfield T, Shaw LM, Trojanowski JQ, Thompson PM, Jack CR, Jr , Weiner MW (2009): MRI of hippocampal volume loss in early Alzheimer's disease in relation to ApoE genotype and biomarkers. Brain 132:1067–1077. [DOI] [PMC free article] [PubMed] [Google Scholar]
- Seeley WW (2011): Divergent network connectivity changes in healthy APOE epsilon4 carriers: Disinhibition or compensation? Arch Neurol 68:1107–1108. [DOI] [PubMed] [Google Scholar]
- Seidenberg M, Guidotti L, Nielson KA, Woodard JL, Durgerian S, Antuono P, Zhang Q, Rao SM (2009): Semantic memory activation in individuals at risk for developing Alzheimer disease. Neurology 73:612–620. [DOI] [PMC free article] [PubMed] [Google Scholar]
- Sheehan DV, Lecrubier Y, Sheehan KH, Amorim P, Janavs J, Weiller E, Hergueta T, Baker R, Dunbar GC (1998): The Mini‐International Neuropsychiatric Interview (M.I.N.I.): The development and validation of a structured diagnostic psychiatric interview for DSM‐IV and ICD‐10. J Clin Psychiatry 59(Suppl 20):22–33;quiz 34–57. [PubMed] [Google Scholar]
- Slooter AJ, Cruts M, Kalmijn S, Hofman A, Breteler MM, Van Broeckhoven C, van Duijn CM (1998): Risk estimates of dementia by apolipoprotein E genotypes from a population‐based incidence study: The Rotterdam Study. Arch Neurol 55:964–968. [DOI] [PubMed] [Google Scholar]
- Small GW (1996): Neuroimaging and genetic assessment for early diagnosis of Alzheimer's disease. J Clin Psychiatry 57(Suppl 14):9–13. [PubMed] [Google Scholar]
- Small GW, Mazziotta JC, Collins MT, Baxter LR, Phelps ME, Mandelkern MA, Kaplan A, La Rue A, Adamson CF, Chang L, et al. (1995): Apolipoprotein E type 4 allele and cerebral glucose metabolism in relatives at risk for familial Alzheimer disease. JAMA 273:942–947. [PubMed] [Google Scholar]
- Smith CD, Andersen AH, Kryscio RJ, Schmitt FA, Kindy MS, Blonder LX, Avison MJ (1999): Altered brain activation in cognitively intact individuals at high risk for Alzheimer's disease. Neurology 53:1391–1396. [DOI] [PubMed] [Google Scholar]
- Smith CD, Andersen AH, Kryscio RJ, Schmitt FA, Kindy MS, Blonder LX, Avison MJ (2002): Women at risk for AD show increased parietal activation during a fluency task. Neurology 58:1197–1202. [DOI] [PubMed] [Google Scholar]
- Strittmatter WJ, Weisgraber KH, Huang DY, Dong LM, Salvesen GS, Pericak‐Vance M, Schmechel D, Saunders AM, Goldgaber D, Roses AD (1993): Binding of human apolipoprotein E to synthetic amyloid beta peptide: Isoform‐specific effects and implications for late‐onset Alzheimer disease. Proc Natl Acad Sci USA 90:8098–8102. [DOI] [PMC free article] [PubMed] [Google Scholar]
- Takahashi T, Cho RY, Mizuno T, Kikuchi M, Murata T, Takahashi K, Wada Y (2010): Antipsychotics reverse abnormal EEG complexity in drug‐naive schizophrenia: A multiscale entropy analysis. Neuroimage 51:173–182. [DOI] [PMC free article] [PubMed] [Google Scholar]
- Tomasi D, Volkow ND (2012): Aging and functional brain networks. Mol Psychiatry 17:471, 549–558. [DOI] [PMC free article] [PubMed] [Google Scholar]
- Trachtenberg AJ, Filippini N, Mackay CE (2012): The effects of APOE‐epsilon4 on the BOLD response. Neurobiol Aging 33:323–334. [DOI] [PubMed] [Google Scholar]
- Trivedi MA, Schmitz TW, Ries ML, Hess TM, Fitzgerald ME, Atwood CS, Rowley HA, Asthana S, Sager MA, Johnson SC (2008): fMRI activation during episodic encoding and metacognitive appraisal across the lifespan: Risk factors for Alzheimer's disease. Neuropsychologia 46:1667–1678. [DOI] [PMC free article] [PubMed] [Google Scholar]
- Tuminello ER, Han SD (2011): The apolipoprotein e antagonistic pleiotropy hypothesis: Review and recommendations. Int J Alzheimers Dis 2011:726197. [DOI] [PMC free article] [PubMed] [Google Scholar]
- Tzourio‐Mazoyer N, Landeau B, Papathanassiou D, Crivello F, Etard O, Delcroix N, Mazoyer B, Joliot M (2002): Automated anatomical labeling of activations in SPM using a macroscopic anatomical parcellation of the MNI MRI single‐subject brain. Neuroimage 15:273–289. [DOI] [PubMed] [Google Scholar]
- Vaillancourt DE, Newell KM (2002): Changing complexity in human behavior and physiology through aging and disease. Neurobiol Aging 23:1–11. [DOI] [PubMed] [Google Scholar]
- Valla J, Yaari R, Wolf AB, Kusne Y, Beach TG, Roher AE, Corneveaux JJ, Huentelman MJ, Caselli RJ, Reiman EM (2010): Reduced posterior cingulate mitochondrial activity in expired young adult carriers of the APOE epsilon4 allele, the major late‐onset Alzheimer's susceptibility gene. J Alzheimers Dis 22:307–313. [DOI] [PMC free article] [PubMed] [Google Scholar]
- Wechsler D (1997). Wechsler Adult Intelligence Scale. San Antonio, TX: The Psychological Corporation. [Google Scholar]
- Wenham PR, Price WH, Blandell G (1991): Apolipoprotein E genotyping by one‐stage PCR. Lancet 337:1158–1159. [DOI] [PubMed] [Google Scholar]
- Wierenga CE, Stricker NH, McCauley A, Simmons A, Jak AJ, Chang YL, Delano‐Wood L, Bangen KJ, Salmon DP, Bondi MW (2010): Increased functional brain response during word retrieval in cognitively intact older adults at genetic risk for Alzheimer's disease. Neuroimage 51:1222–1233. [DOI] [PMC free article] [PubMed] [Google Scholar]
- Xu G, McLaren DG, Ries ML, Fitzgerald ME, Bendlin BB, Rowley HA, Sager MA, Atwood C, Asthana S, Johnson SC (2009): The influence of parental history of Alzheimer's disease and apolipoprotein E epsilon4 on the BOLD signal during recognition memory. Brain 132:383–391. [DOI] [PMC free article] [PubMed] [Google Scholar]
- Yang AC, Huang CC, Yeh HL, Liu ME, Hong CJ, Tu PC, Chen JF, Huang NE, Peng CK, Lin CP, Tsai SJ (2013): Complexity of spontaneous BOLD activity in default mode network is correlated to cognitive function in normal male elderly: A multiscale entropy analysis. Neurobiol Aging 34:428–438. [DOI] [PubMed] [Google Scholar]
- Yang AC, Tsai SJ (2013): Complexity of mental illness: A new research dimension. Prog Neuropsychopharmacol Biol Psychiatry.45:251–252. [DOI] [PubMed] [Google Scholar]
- Yang AC, Tsai SJ, Yang CH, Kuo CH, Chen TJ, Hong CJ (2011): Reduced physiologic complexity is associated with poor sleep in patients with major depression and primary insomnia. J Affect Disord 131:179–185. [DOI] [PubMed] [Google Scholar]