

Abstract
In this study, we investigated the neural substrates involved in visual working memory (WM) and the resulting effects of subthalamic nucleus (STN) stimulation in Parkinson's disease (PD). Cerebral activation revealed by positron emission tomography was compared among Parkinson patients with (PD‐ON) or without (PD‐OFF) STN stimulation, and a group of control subjects (CT) in two visual WM tasks with spatial (SP) and nonspatial (NSP) components. PD‐OFF patients displayed significant reaction time (RT) deficits for both memory tasks. Although there were no significant differences in RT between patients with PD‐ON and ‐OFF stimulation, patients with PD‐ON stimulation performed comparably to controls. The memory tasks were executed with normal error rates in PD‐ON and ‐OFF stimulation. In contrast to these behavioral results, whether the corresponding prefrontal activation was differentially affected by deep brain stimulation status in patients depended on whether the WM modality was SP versus NSP. Thus, SP WM was associated with (1) abnormal reduction in dorsolateral prefrontal activity in PD‐OFF and ‐ON stimulation and (2) abnormal overactivation in parieto‐temporal cortex in PD‐OFF and in limbic circuits in PD‐ON stimulation. In NSP WM, normal activation of the ventral prefrontal cortex was restored in PD‐ON stimulation. In both visual modalities the posterior cerebral regions including fusiform cortex and cerebellum, displayed abnormally reduced activity in PD. These results indicate that PD induces a prefrontal hypoactivation that STN stimulation can partially restore in a modality selective manner by additional recruitment of limbic structures in SP WM or by recovery of the ventral prefrontal activation in NSP WM. Hum Brain Mapp 35:552–566, 2014. © 2012 Wiley Periodicals, Inc.
Keywords: dissociated prefrontal activation, visual working memory, subthalamic stimulation, Parkinson's disease, PET
INTRODUCTION
The basal ganglia participate in executive functions, including visual working memory (WM) via their role in corticostriatothalamocortical (CSTC) loops that allow the prefrontal cortex to process and integrate visual information from different modalities. A WM dissociation based on perceptual modality has been identified in the human frontostriatal system. Indeed, visuospatial memory‐related information might preferentially activate the dorsolateral prefrontal cortex and the head of the caudate nucleus whereas object‐related memory information might activate the ventrolateral part of the prefrontal cortex and the body/tail of the caudate [Courtney et al., 1996; Dominey and Arbib, 1992; Haxby et al., 1991; Levy and Goldman‐Rakic, 2000; Levy et al., 1997; Postle and D'Esposito, 1999; Sala et al., 2003; Ventre‐Dominey et al., 2005]. Such a segregated frontostriatal organization of visual WM suggests a possible behavioral dissociation depending on the involvement of the partially distinct basal ganglia/prefrontal pathways in Parkinson's disease (PD).
When comparing spatial (SP) versus nonspatial (NSP) WM in PD, certain studies report deficits only in SP memory [Owen et al., 1993, 1997; Postle et al., 1997], whereas others found deficits in both visual components of WM [Mollion et al., 2003, 2011; Pillon et al., 1998; Possin et al., 2008]. We previously demonstrated [Mollion et al., 2003] that WM deficits in PD could be dissociated depending on the therapy status, as only the NSP component was preserved in patients with PD on levodopa therapy. Accordingly, more recently Possin et al. 2008 suggested that deficits in SP and object‐related WM in PD might be mediated by two cognitive mechanisms differing in their underlying pathological processes. Based on these observations, it is hypothesized that distinct frontostriatal networks are responsible for the visual WM pathology described in PD and that these circuits might be differentially sensitive to the antiparkinsonism therapy, particularly dopa medication.
As long‐lasting dopamine medication has demonstrated limitations with significant fluctuations in PD symptomatology, alternative therapies have been developed in the last decades using deep brain stimulation (DBS). Although motor improvements induced by DBS of the subthalamic nucleus (STN) are largely and consistently reported [Brown et al., 1999; Krack et al., 1998; Limousin et al., 1995, 1998; Trepanier et al., 2000], the cognitive outcome of this therapy is far less reliable, particularly regarding memory function. Indeed, bilateral STN stimulation in patients with PD can yield adverse [Alberts et al., 2008; Saint‐Cyr et al., 2000] or beneficial [Jahanshahi et al., 2000; Mollion et al., 2011; Pillon et al., 2000] effects on memory processes. Positron emission tomography (PET) neuroimaging studies have shown correlations between poor STN DBS induced performance in executive tasks and reduced regional cerebral blood flow (rCBF) in defined cortical networks, including the frontotemporal cortex for verbal fluency and memory [Kalbe et al., 2009; Schroeder et al., 2003], the cingulate cortex for inhibitory response control [Campbell et al., 2008; Schroeder et al., 2002; Thobois et al., 2007] and the limbic system for emotional processing [Lejeune et al., 2008]. As a whole, little is known about the neural mechanisms responsible for the cognitive disorders of PD in relation to STN DBS. In the context of executive function and WM, reduced change in the dorsolateral prefrontal rCBF has been described in relation with an improvement of SP WM performance induced by STN DBS [Campbell et al., 2008].
We previously demonstrated that patients with PD‐OFF dopa therapy are significantly impaired in SP and NSP WM, and that when ON treatment, only the NSP performance is improved [Mollion et al., 2003]. In contrast, in a more recent study on STN DBS effect on visual WM [Mollion et al., 2011], we found less significant impact of DBS than dopa therapy on memory performance. To our knowledge, no research study reports on the effects of STN DBS on visual memory function, including visuospatial and object‐related cued memory, and on their corresponding neural substrates in PD.
To gain better insight into differential effects of therapy and neurophysiological underpinnings of visual memory in PD, we investigated, by PET scanning in patients with PD, the neural correlates of WM dysfunction, with SP or object visual cueing in the context of STN DBS therapy. For that purpose, using a similar WM paradigm as in our previous studies [Mollion et al., 2003, 2011; Ventre‐Dominey et al., 2005], different forms of visual memory (associative, SP WM and NSP WM) have been tested by analyzing behavior and rCBF changes in the ON and OFF conditions of STN DBS therapy compared with a normal control group.
MATERIAL AND METHODS
Subjects
Fourteen idiopathic right‐handed patients with PD (mean age: 54.6, sd = 6.7; 11 males) and 11 right‐handed healthy age‐matched control subjects (CT) (mean age: 53.2, sd = 7.1; five males) participated in this study. The patients with PD were recruited from the movement disorders department of the Lyon Neurological Hospital on the basis of the UK Parkinson Disease Brain Bank criteria [Gibb and Lees, 1988]. All the selected patients had levodopa induced motor fluctuations and were treated by chronic bilateral STN stimulation (monopolar stimulation; mean amplitude: 3.16 ± 0.4 V; pulse width: 60 μs; frequency: 134.3 ± 7 Hz) for at least 6 months (Table 1). The patients with PD were carefully selected to have a good clinical improvement with STN stimulation. The surgical procedure was performed as previously described [Thobois et al., 2002]. The patients' motor symptoms were evaluated using the Unified Parkinson's Disease Rating Scale (UPDRS) motor score [Fahn et al., 1987], while OFF medication for at least 12 h and ON and OFF STN stimulation conditions. The demographic and neurological characteristics of the patients with PD and controls are presented in Table 1. All the subjects had no history of drug abuse and/or alcoholism and no history of neurological and psychiatric disorders other than PD for the PD group. The control subjects were either the spouse of the patient or a volunteer recruited via an advertisement. All patients developed the pathology after 30 years old and none had history of a familial PD. Cognitive performance was determined by Mini‐Mental State Examination which was normal for all the controls and PD subjects (score > 28). No significant differences (t test P > 0.05) were found in any of the demographic parameters between CT and PD groups. The patients with PD were requested not to take their antiparkinsonian drugs for at least 12 h before the experiment. Due to excessive head motion artifacts, one patient with PD was excluded from the group analysis bringing the group to 13 patients with PD that were fully analyzed. Before PET evaluation, all the subjects gave their informed consent to participate in this research, approved by the Research Ethics Committee in accordance to the Declaration of Helsinsky (CCPRB L. Berard, Proposal No. 02/045).
Table 1.
Demographic and clinical characteristics of control (CT) and Parkinson (PD) groups ON and OFF STN stimulation
| Groups | ||||
|---|---|---|---|---|
| CT n = 11 | PD‐ON/OFF n = 7 | PD‐OFF/ON n = 6 | PD‐total n = 13 | |
| Age | 56 (6) | 55 (6.8) | 54 (7.2) | 54.6 (6.7) |
| Sex (male/female) | 5/6 | 6/1 | 5/1 | 11/2 |
| Disease duration (years) | — | 14.7 (2.4) | 14.8 (4.8) | 14.7 (3.4) |
| Postsurgery duration (months) | — | 15.3 (14) | 24 (15) | 19.3 (14.6) |
| MMS score | 29.3 (1.2) | 30 (0) | 29.7 (0.6) | 29.9 (0.38) |
| UPDRS motor score (Max = 108) | ||||
| ON DBS | — | 9.8 (1.2) | 8.2 (3.6) | 9.1 (2.6) |
| OFF DBS | — | 41 (8) | 36.6 (13) | 39 (10.3) |
| Hoen&Yahr stage (range: 0–5) | ||||
| ON DBS | — | 1.6 (0.3) | 1.6 (0.4) | 1.6 (0.3) |
| OFF DBS | — | 2.3 (0.3) | 2.4 (0.4) | 2.3 (0.3) |
UPDRS scores and Hoen&Yahr stages are reported ON and OFF stimulation in each PD group. Standard deviation in parenthesis.
Behavioural Tasks
Cerebral activation was measured during three types of memory tasks: a simple conditional associative learning (CAL) task and two visual WM tasks using either SP or NSP memory cues.
Paradigm description
Visual stimuli were displayed on a computer screen and the motor response of the right hand was recorded with a joystick. For the three tasks, the visual cues were presented at the centre of the computer screen aligned to the body central axis. The visual targets consisted of two white squares at 10° right and left of the centre. The subject was told to move the joystick to the right or to the left as rapidly as possible on the basis of the color of a central visual cue (Fig. 1). When the subject produced a correct response the visual target located on the same side of the joystick displacement changed color to match the central cue color (visual feedback); if the response was incorrect, the screen was cleared. After each trial, the joystick was maintained by the subject in a neutral middle position. This paradigm has been adapted on the basis of a previous neuroimaging study [Ventre‐Dominey et al., 2005].
Figure 1.
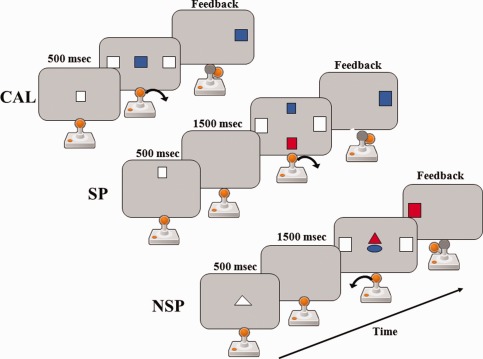
Schematic representation of the experimental paradigm, showing the conditional associative learning (CAL), the spatial (SP) and nonspatial (NSP) working memory tasks. In CAL, the subject associates the color of the centre cue to a movement. In SP, the subject first memorizes the cue position and then retrieves the color matching the memory cue position to produce the correct movement. In NSP, the subject memorizes the cue shape and then retrieves the color matching the memory cue shape to produce the correct movement. The arrow indicates the movement direction of the joystick. Feedback: colored target on the side of the correct movement direction.
CAL: The subject had to learn by trial and error to associate the color of a central cue to a right or left movement of the joystick. For example, a blue cue indicated a joystick displacement to the right and a red cue a joystick displacement to the left. The color‐motor association rule was kept constant all over the tests (Fig. 1), so that in fact, there was no learning during scanning, only use of previously learned associations.
SP WM: The subject had to memorize the position of a visual cue (white square) presented along the vertical midline (top or bottom) of the computer screen. As shown in Figure 1, after a memory delay of 1.5 s, two colored cues were displayed along the vertical midline of the screen. The subject had to choose the cue that matched the position of the previous memory cue, extract its color and on the basis of the color‐motor association rule move the joystick to the right or to the left.
NSP WM: The subject had to memorize the shape of a visual cue (white circle or triangle) presented at the centre of the computer screen. After a memory delay of 1.5 s, two colored cues were displayed at the centre of the screen. The subject had to choose the cue that matched the shape of the previous memory cue, extract its color and on the basis of the color‐motor association rule move the joystick to the right or to the left.
Timing of the paradigm
Before scanning, the subject was trained on the different tasks until he/she could perform each task without errors. For patients with PD, the prescanning training session was always performed ON stimulation. During PET scanning, trials were performed during one min blocks for each task (CAL, SP and NSP). Each task was repeated – for the normal subjects, three times corresponding to a total of nine scans and – for the patients with PD in each ON and OFF stimulation condition two times corresponding to a total of 12 scans. Seven patients started in ON stimulation condition and six in OFF stimulation condition. After the change of STN stimulation (i.e. switched ON or OFF depending on the first condition), the subject rested for 15 min before the next session. The order of the tasks was randomized and balanced over the subjects.
PET scan protocol
PET scans were performed at the Life Imaging PET Centre (CERMEP Lyon, France) on a CTI HR + Siemens tomograph (CTI/Siemens, Knoxville, TN). The transmission scan was acquired using rotating rod sources of 68Ge. For each emission scan, the distribution of radioactivity was recorded after intravenous injection of 333 MBq of [15O]H2O tracer through a forearm catheter. When the brain radioactivity count reached a threshold value of 400% of a 40‐s preliminary scan measure estimating the basal level of activity, the scanning session started and PET scans were collected for a period of 1 min. The radiation counts followed a linear relation to the rCBF changes. The subject initiated the task 25 s prior the scanning onset to avoid any novelty effect on the rCBF measurement. A 10‐min rest interval was required between each experimental scanning session to insure reliable blood radioactivity decrease. The PET images were reconstructed by 3D filtered back projection (Hanning filter; cut‐off frequency: 0.5 cycles/pixel) leading to 63 slices of 128 × 128 pixels format matrix yielding approximately 2 mm cubic voxels.
Head movements were prevented by a thermoplastic mask that was molded to the subject's head and fixed to the scanner bed. The head position was checked throughout the PET examination by using a laser alignment onto the reference points. The visual stimuli were displayed by videoprojector on a translucent screen located behind the scanning bay. The subject looked at the screen via a mirror fixed inside the camera at 20 cm over the subject's head. The joystick held in the subject's right hand was fixed on a table at the level of the subject's lap. The experimental procedure and data collection were monitored on a PC computer using CORTEX software (NIH, Bethesda).
Data Analysis
Behavioural analysis
The reaction time (RT) of the hand response was measured at each trial and the percentage of errors (ER) was calculated for each run. Statistical analysis was performed by using repeated measures analysis of variance (rm ANOVA) on the dependent RT and ER variables. To compare the patients with PD in each STN stimulation condition to the CT, we used a mixed ANOVA design with two factors, Group (CT, PD‐OFF and PD‐ON) and Run (Run1, Run2 and Run3), and one within subject factor Task (CAL, SP and NSP). To analyze the effects of the STN stimulation within the PD group, we used rm ANOVA with three within‐subjects factors, DBS status (ON and OFF), Task (CAL, SP and NSP) and Run (Run1 and Run2). Post hoc specific comparisons between factors were performed by using LSD planned comparison. The significance level was established at a 95% confidence interval. The statistical analysis was realized with the STATISTICA software package.
PET image analysis
The PET images were analyzed by using statistical parametric mapping software (SPM2, Wellcome Department of Cognitive Neurology, London, UK) with MATLAB6.5. For each subject, the PET scans were realigned to the first scan of the session to correct for possible head movements. A mean image of the realigned scans was created and then spatially normalized into the Montreal Neurological Institute (MNI) template provided in SPM2. The normalized images were smoothed with an isotropic Gaussian kernel (full width half maximum 14 mm for all directions) to allow for interindividual gyrus variations and to improve the signal to noise ratio.
rCBF changes were statistically analyzed with SPM2 for all voxels exceeding 80% of the mean scan value by applying the general linear model [Friston et al., 1994]. To examine the effects of the SP and NSP WM tasks we computed in each group a multisubjects model with subject × task interaction. Individual voxel values were adjusted by proportional scaling on the scan mean to account for injected dose effect. Our WM tasks rely on effective embedded CAL and visual working (WM) memory processes. As we were principally interested in visual WM networks, we used the CAL as a control for our contrast to retain only the WM‐related process. Thus individual across‐condition t contrasts (SP‐CAL and NSP‐CAL) were extracted on a voxel by voxel basis in the CT and PD groups. These individual contrasts images were then employed in a second‐level analysis to compare the between group effects and infer about population effects. A two‐sample t test analysis was realized on each contrast independently (SP‐CAL and NSP‐CAL) to identify (1) the effects of PD disease on WM neural networks by comparing CT versus PD groups, OFF and ON condition and (2) the effects of STN stimulation by comparing ON versus OFF conditions. To eliminate putative effects of CAL task on WM‐related activation, we computed t contrasts comparing CAL activation between groups (CT, PD‐ON and PD‐OFF). Statistical maps were generated using a significance threshold either at P < 0.05 corrected or P < 0.001, uncorrected for multiple comparisons with a minimum cluster threshold of 20 contiguous voxels.
Based on our previous studies on WM neural networks in humans [Ventre‐Dominey et al., 2005], putative regions of interest (ROIs) were identified and analyzed principally in the prefrontal regions to determine specific PD‐related disruption in the prefrontostriatal circuits. For this purpose, we used in SPM software the WFU (Wake Forest University School of Medicine) Pickatlas toolbox [Maldjian et al., 2003, 2004] that references AAL atlas [Tzourio‐Mazoyer et al., 2002] and Brodmann areas. The relevant contrasts (SP‐CAL and NSP‐CAL) of the first‐level model were performed for the CT, PD‐ON and ‐OFF groups to produce parametric t statistics maps of the activity changes in three prefrontal ROIs: the premotor area BA 6 in the precentral gyrus, the dorsolateral prefrontal cortex BA 46‐9 in the middle prefrontal gyrus (Frontal‐Mid) and the inferior prefrontal cortex BA 45‐46 (Frontal‐Inf‐Tri). MNI coordinates of the cerebral activation foci reported with SPM were transformed into Talairach coordinates [Talairach and Tournoux, 1988] using Matthew Brett's method (http://imaging.mrc-cbu.cam.ac.uk/imaging/MniTalairach).
RESULTS
Behavioural Data
As illustrated in Figure 2A and Table 2, significant RT deficits were observed in the three memory tasks in patients with PD when compared with the control (CT) group (main Group effect: F(2,44) = 4.5; P = 0.016) independently of the task (Group × Task interaction: F(4,88) = 0.7; P > 0.05).
Figure 2.
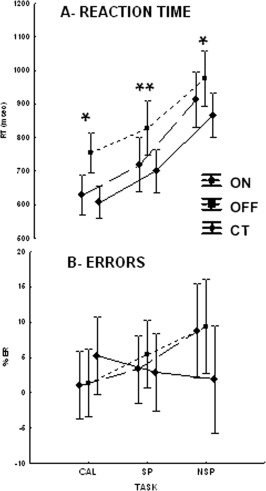
Graphs of the mean RT and ER obtained in the control (C), PD‐ON and ‐OFF groups and in each CAL, SP and NSP memory task. Bars: confidence intervals. * P < 0.05 and ** P < 0.01.
Table 2.
Mean RT and ER values are reported for each run in CT and PD groups
| RUN | Groups | |||||
|---|---|---|---|---|---|---|
| CT n = 11 | PD‐ON/OFF n = 7 | PD‐OFF/ON n = 6 | ||||
| 1st | 2nd | 1st (ON) | 2nd (OFF) | 1st (OFF) | 2nd (ON) | |
| RT | ||||||
| CAL | 602 (79) | 609 (84) | 649 (102) | 800 (157) | 701 (145) | 605 (90) |
| SP | 717 (155) | 673 (86) | 756 (187) | 881 (192) | 767 (143) | 675 (50) |
| NSP | 893 (155) | 831 (111) | 931 (182) | 1013 (182) | 932 (168) | 893 (85) |
| ER | ||||||
| CAL | 0.85 (1.8) | 0.39 (1.31) | 0.00 (0.00) | 0.90 (2.20) | 0.88 (1.50) | 0.00 (0.00) |
| SP | 6.28 (7.16) | 2.45 (4.80) | 4.59 (6.77) | 10.10 (17.83) | 1.43 (3.78) | 1.56 (2.57) |
| NSP | 3.70 (3.41) | 1.56 (2.17) | 6.06 (9.75) | 12.68 (19.52) | 3.82 (6.06) | 5.75 (14.07) |
PD‐ON/OFF and PD‐OFF/ON groups indicate that the task is performed, respectively, ON then OFF and OFF then ON. Standard deviations in parenthesis.
This effect was mainly related to the OFF stimulation status as RT was significantly increased in PD‐OFF when compared with CT group (post hoc P < 0.05). In contrast, when analyzing the STN stimulation effect inside the PD group (rm ANOVA), we found no significant RT changes ON versus OFF status (main DBS status effect: F(1,12) = 3.8; P > 0.05; DBS status × Task interaction: F(2,24) = 1.2; P > 0.05). As shown in Table 2, no effect of the run order was found neither in the CT nor in the PD groups ON and OFF stimulation (Main Run effects in PD: F(1,12) = 0.6; P > 0.05; Run × Group interaction: F(2,41) =1.6; P > 0.05).
As illustrated in Figure 2B, the percentage of ER tended to be increased in the PD group. However, no significant difference in ER was found neither inside the PD group between OFF and ON status nor between CT and PD‐ON and PD‐OFF (main Group effect: F(2,31) = 0.14; P > 0.05; Group × Task interaction: F(4,62) = 1.9; P > 0.05; main DBS status effect: F(1,12) = 0.3; P > 0.05). No effect of the run order was found neither in the CT nor in the PD groups ON and OFF stimulation (Main Run effects in PD: F(1,67) = 0.6; P > 0.05; Run × Group interaction: F(2,67) = 0.11; P > 0.05) (Table 2).
Activation Data
WM activation: ROIs analysis
Spatial WM (SP > CAL): By using voxel based analysis on the predefined ROIs, the SP‐CAL contrast images in the PD‐ON and ‐OFF groups showed a lack of activation in the dorsolateral prefrontal cortex BA 9‐46 observed in CT group. As shown in Figure 3A, no significant rCBF changes are found in dorsolateral prefrontal cortex during SP task in PD‐ON and ‐OFF groups when compared with CT. Only the premotor area (BA 6) on the left remained activated in PD‐OFF stimulation.
Figure 3.
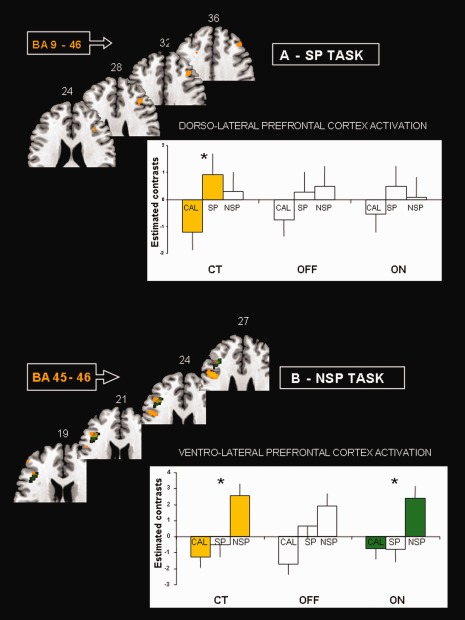
Transverse MNI templates showing significant rCBF changes in prefrontal ROIs during the WM tasks in CT, PD‐ON and ‐OFF groups. The mean values (estimated contrasts) of the regression effects in ROIs are plotted for each task. Bars: standard deviations. (A) Spatial (SP) task: note that the dorsolateral prefrontal cortex is significantly activated during SP task when contrasted to CAL, only in CT group. (B) Nonspatial (NSP) task: the ventrolateral prefrontal cortex is significantly activated during NSP task when contrasted to CAL, in CT group and in PD‐ON group. Talairach coordinates are indicated for each transverse section. * P uncorr < 0.001.
Nonspatial WM (NSP > CAL): By using the putative pars triangularis‐inferior prefrontal gyrus ROI, including the BAs 45‐46, we found a similar cluster of activation in PD‐ON and CT groups (P corrected FDR <0.05). As illustrated in Figure 3B the rCBF was clearly increased in NSP task for CT and PD‐ON and ‐OFF stimulation but reached the significance level only in CT and PD‐ON groups. The right middle prefrontal gyrus including area 6 and 8 was significantly activated in PD‐ON and ‐OFF groups.
WM activation: CT versus PD groups interactions
When comparing by t test the rCBF changes between CT and PD groups (Tables III and IV), significant interactions indicated a pattern of deactivated and activated regions in PD groups:
Between‐subjects interactions: PD‐OFF stimulation (CT > OFF and OFF > CT)
SP‐CAL contrast: A significant deactivation (CT > OFF) was found as a large cluster in the right visual cortex including the fusiform and the occipital gyri, the left cerebellum and the left orbitoprefrontal cortex (BA 11‐47) (Fig. 4). In contrast, the right posterior cortex forming a set of clusters in the occipital, parietal and temporal cortices (BA 20, 39 and 40) was significantly overactivated in PD‐OFF when compared with CT group (OFF > CT).
NSP‐CAL contrast: Large clusters of deactivation (CT > OFF) were found in the left posterior visual areas including the fusiform gyrus (BAs 19, 37) and precuneus (BA 18) and a small cluster in the right cerebellum (Fig. 5A). In contrast, two distinct small areas in the right medial prefrontal cortex (BAs 6 and 9) were significantly activated (OFF > CT) (Table 4; Fig. 5B).
Figure 4.
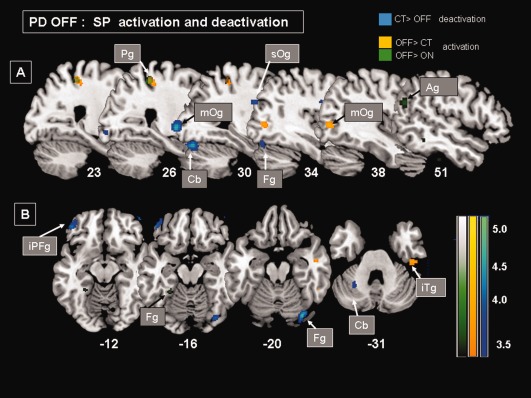
MNI templates showing patterns of significant rCBF changes (P uncorr < 0.001) in PD‐OFF group during SP when compared with CAL task (SP > CAL). OFF deactivation (CT > OFF: blue clusters)‐ OFF overactivation (OFF > CT: yellow clusters, OFF > ON: green clusters). (A) Sagittal sections showing a overactivation in right parietal (Pg) and middle occipital (mOg) gyri as well as a hypoactivation in right fusiform (Fg) and occipital (Og) gyri extending in the cerebellum (Cb). (B) Transverse sections showing a overactivation in the right inferior temporal gyrus (iTg) and a hypoactivation in the ventral part of the right fusiform gyrus (Fg) and in the left cerebellum (Cb) as well as in the left inferior prefrontal gyrus (iPFg). Talairach coordinates are indicated.
Figure 5.
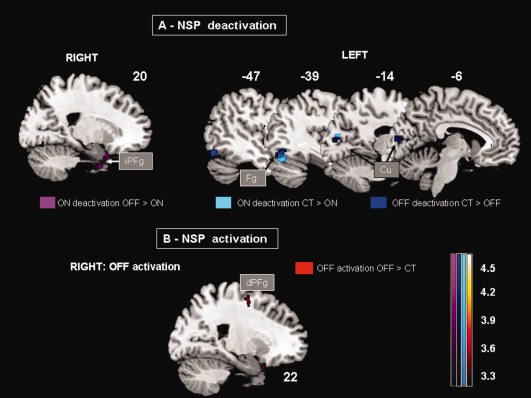
MNI templates showing patterns of significant rCBF changes (P uncorr < 0.001) in PD‐ON and ‐OFF during NSP when compared with CAL task (NSP > CAL). (A) ON deactivation (OFF > ON: violet clusters, CT > ON: light blue clusters)‐ OFF deactivation (CT > OFF: dark blue clusters). Right and left sagittal sections showing the deactivation pattern on the right, in the inferior prefrontal cortex (iPFg) in PD‐ON and on the left in a posterior cortical region including fusiform (Fg) and cuneus (Cu) cortex in common to PD‐ON and ‐OFF. (B) OFF overactivation (OFF > CT: red cluster). Sagittal sections showing the overactivation in the right medial prefrontal cortex (dPFg), including BAs 6. Talairach coordinates are indicated.
Table 4.
Brain regions showing significant rCBF changes when comparing the CT, PD‐OFF and ‐ON groups during NSP task (NSP > CAL contrast)
| NSP > CAL | |||||
|---|---|---|---|---|---|
| Regions (Brodmann's area) | Coordinates (TAL) | t‐Values | Cluster size | ||
| X | Y | Z | |||
| PD‐OFF vs. CT | |||||
| PD‐OFF activation (OFF > CT) | |||||
| Right dorsal prefrontal gyrus BA 6 | 22 | −3 | 50 | 4.06 | 33 |
| Right dorsal prefrontal gyrus BA 9 | 10 | 39 | 33 | 4.06 | 24 |
| PD‐OFF deactivation (CT > OFF) | |||||
| Left fusiform gyrus BA 19‐37 | −46 | −69 | −10 | 4.66 | 158 |
| Left cuneus BA 18 | −8 | −85 | 15 | 4.29 | 97 |
| Right cerebellum | 2 | −41 | −35 | 4.56 | 40 |
| PD‐ON vs. CT | |||||
| PD‐ON activation (ON > CT) | |||||
| Left paracentral gyrus BA 6 | 0 | −15 | 45 | 4.64 | 26 |
| PD‐ON deactivation (CT > ON) | |||||
| Left fusiform gyrus BA 37 | −40 | −69 | −14 | 4.44 | 73 |
| Left cuneus BA 18 | −16 | −79 | 20 | 4.14 | 26 |
| PD‐ON vs. PD‐OFF | |||||
| PD‐ON activation (ON > OFF) | |||||
| Right middle temporal gyrus BA 39 | 63 | −62 | 12 | 4.16 | 28 |
| Right superior temporal gyrus BA 42 | 71 | −21 | 10 | 3.97 | 22 |
| PD‐ON deactivation (OFF > ON) | |||||
| Left middle temporal gyrus BA 21 | −51 | 2 | −25 | 4.69 | 41 |
| Right uncus BA 36 | 16 | −2 | −35 | 4.27 | 56 |
| Right inferior prefrontal gyrus BA 47 | 20 | 10 | −22 | 3.97 | 25 |
Between‐subjects interactions: PD‐ON stimulation (CT > ON and ON > CT)
SP‐CAL contrast: We found a significant overactivation in the right anterior cingulate cortex (BA 24) and in the left premotor (BA 6) (Table 3). In contrast, a significantly deactivated posterior visual associative network extended in the right precuneus, the fusiform cortices on the left and the angular cortex (BA 39) on the right (Fig. 6).
NSP‐CAL contrast: The activation (ON > CT) was very sparse forming a small cluster in the left paracentral gyrus (BA 6). Interestingly, as illustrated in Figure 5A, the deactivation (CT > ON) involved the same regions as for the PD‐OFF (i.e. the fusiform and precuneus cortex).
Table 3.
Brain regions showing significant rCBF changes when comparing the CT, PD‐OFF and ‐ON groups during SP tasks (SP > CAL contrast)
| SP > CAL | |||||
|---|---|---|---|---|---|
| Regions (Brodmann's area) | Coordinates (TAL) | t‐Values | Cluster size | ||
| X | Y | Z | |||
| PD‐OFF vs. CT | |||||
| PD‐OFF activation (OFF > CT) | |||||
| Right inferior and superior parietal gyri BA 40‐7 | 73 | −38 | 24 | 5.25 | 36 |
| 24 | −36 | 53 | 4.12 | 56 | |
| Right inferior temporal gyrus BA 20 | 44 | −23 | −29 | 4.43 | 55 |
| Right middle occipital gyrus BA 19‐39 | 40 | −73 | 7 | 4.03 | 28 |
| PD‐OFF deactivation (CT > OFF) | |||||
| Right fusiform gyrus BA 19‐37 | 32 | −78 | −13 | 4.68 | 110 |
| Right middle occipital gyrus BA 19 | 30 | −97 | 5 | 4.66 | 98 |
| Right superior occipital gyrus BA 19 | 36 | −82 | 32 | 4.40 | 25 |
| Left middle prefrontal gyrus BA 47‐11 | −46 | 42 | −14 | 4.40 | 65 |
| Left cerebellum | −26 | −54 | −26 | 4.22 | 33 |
| PD‐ON vs. CT | |||||
| PD‐ON activation (ON > CT) | |||||
| Right anterior cingulate gyrus BA 24 | 10 | 13 | 27 | 4.40 | 61 |
| Right middle temporal gyrus BA 21 | 55 | −6 | −8 | 4.12 | 21 |
| Left precentral gyrus BA 6 | −44 | −5 | 11 | 3.92 | 23 |
| PD‐ON deactivation (CT > ON) | |||||
| Right middle occipital and angular gyri BA 39 | 40 | −78 | 30 | 5.11 | 233 |
| 34 | −83 | 17 | 4.49 | ||
| Right precuneus BA 7 | 8 | −73 | 61 | 4.49 | 20 |
| Left fusiform gyrus BA 37 | −24 | −43 | −10 | 4.38 | 46 |
| PD‐ON vs. PD‐OFF | |||||
| PD‐ON activation (ON > OFF) | |||||
| Right anterior cingulate gyrus BA 24 | 10 | 15 | 23 | 4.33 | 31 |
| Left insula BA 13 | −42 | −9 | 13 | 4.07 | 31 |
| Left inferior prefrontal gyrus BA 11‐47 | −40 | 42 | −15 | 3.98 | 32 |
| PD‐ON deactivation (OFF > ON) | |||||
| Right inferior parietal gyrus BA 40 | 26 | −38 | 53 | 4.14 | 34 |
| Right superior parietal gyrus BA 7 | |||||
| Right angular gyrus BA 39 | 51 | −65 | 18 | 3.73 | 34 |
| Left precuneus BA 18 | −22 | −63 | 23 | 4.10 | 24 |
Figure 6.
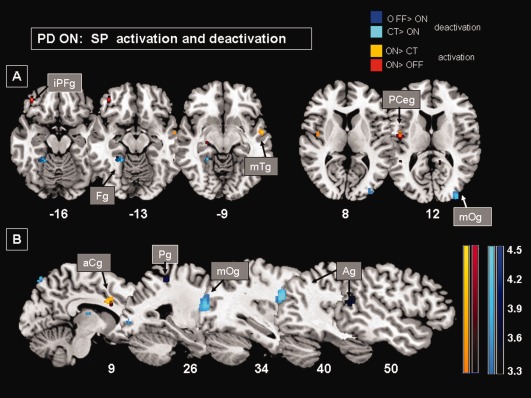
MNI templates showing patterns of significant rCBF changes (P uncorr < 0.001) in PD‐ON group during SP when compared with CAL task (SP > CAL). ON deactivation (OFF > ON: dark blue clusters, CT > ON: light blue clusters)‐ ON overactivation (ON > CT: yellow clusters, ON > OFF: red clusters). (A) Transverse sections showing a overactivation in the left inferior prefrontal gyrus (iPFg), in the left insula at the junction with the precentral cortex (PCeg), in the right middle temporal gyrus (mTg) and a hypoactivation in the left fusiform gyrus (Fg) and in the right angular gyrus (Ag). (B) Sagittal sections showing a overactivation in the right cingulate gyrus (aCg) and a large hypoactivation in the middle occipital gyrus (mOg) extending in the angular gyrus (Ag). Talairach coordinates are indicated.
Within‐subjects interactions: ON > OFF and OFF > ON
SP‐CAL contrast: A significant overactivation with STN stimulation (ON > OFF) was found in the right anterior cingulate (BA 24), the left orbitoprefrontal cortex (BA 11‐47) and the insula (BA 13) (Table 3; Figs. 4 and 6). Similarly to CT > OFF contrast, the posterior visual associative network was significantly deactivated with STN stimulation (OFF > ON), especially in the right inferior parietal and angular cortex (BA 40, 39) and in the left precuneus.
NSP‐CAL contrast: The activation with STN stimulation (ON > OFF) was limited to small clusters in the right middle and superior temporal cortices (Table 4). As illustrated in Figure 5A (OFF > ON), deactivated regions formed a ventral network distributed between the inferior prefrontal (BA 47) and uncus cortices on the right and the middle temporal cortex on the left.
CAL activation
To investigate the CAL contribution in WM‐related cerebral activation in PD, we compared the BOLD changes during CAL tasks between CT and PD groups, ON and OFF stimulation. Only two cortical areas were found hypoactivated in PD during both CAL and WM tasks: (1) a small focus (Ke = 79; t = 3.7; TAL −34 38 −18) in the left middle frontal orbital cortex, involving BA 11 in PD‐OFF (CT > OFF) during CAL and SP (SP‐CAL) and (2) a large cluster (Ke = 249; t = 4.1; TAL −50 −59 −8) extending into the middle occipital and fusiform gyrus, including BA 19, 37 hypoactivated in PD‐OFF (CT > OFF) during both CAL and NSP (NSP‐CAL) tasks. All the other significant BOLD fluctuations observed during CAL task exhibited no overlap with those observed during WM in PD.
DISCUSSION
The neurological correlates of WM deficits found in PD are assessed by the activity changes in the neural memory circuits as revealed by comparing cerebral activation during visual SP and NSP WM versus associative memory (CAL). When compared with healthy subjects in the current and previous study [Ventre‐Dominey et al., 2005], rCBF fluctuations in PD‐ON and ‐OFF stimulation were observed in two cortical networks; a posterior network including the visual associative cortical areas, and an anterior network including different regions of the prefrontal cortex. Although the posterior cortical areas excluding the parieto‐temporal cortex were commonly deactivated in both WM tasks, the prefrontal cortical activation depended on the visual WM modality and on the STN stimulation status in patients with PD. Interestingly, certain sites within the cortical circuits impaired in PD‐OFF stimulation were found to return to normal activity with STN stimulation in a similar manner to the effect of dopaminergic therapy [Cools et al., 2002].
Behavioural Perturbations in WM in PD‐ON and ‐OFF STN DBS
Behavioural data revealed significant deficits in RT in all memory tasks in patients with PD‐OFF stimulation when compared with controls. STN stimulation yielded improvements in all the tasks, though there were no significant differences between ON and OFF STN stimulation status. These findings are in concordance with our recent observations showing marginal effects of STN stimulation on memory performance in patients with PD tested with a similar paradigm [Mollion et al., 2011]. In contrast, a significant dissociation between SP versus NSP WM has been demonstrated with dopa therapy, as the SP memory remained more perturbed in PD‐ON dopamine treatment [Mollion et al., 2003]. A comparable dissociation in WM disorders with more SP than NSP WM impairments has been previously reported in PD with dopaminergic medication [Fern‐Pollak et al., 2004; Owen et al., 1993, 1996, 1997; Possin et al., 2008; Postle et al., 1997; Taylor et al., 1986].
Although some behavioral and neuroimaging studies provide evidence for a link between changes in dopamine‐related prefrontal activity and WM deficits in PD [Cools et al., 2002; Kalbe et al., 2009; Mattay et al., 2002; Owen et al., 1998], this original study demonstrates for the first time (1) a dorsal/ventral pattern of the prefrontal rCBF response occurring during SP/NSP visual WM, respectively in PD when compared with control activation and (2) the effects of DBS on this prefrontal activation. Indeed, we found significant impairments in WM performance in PD‐OFF stimulation corresponding to significantly reduced dorsal and ventral prefrontal activity for SP and NSP WM, respectively. However, in PD‐ON, although significant improvement in behavioral measures did not occur (no difference between ON and OFF) prefrontal activity was normalized by STN stimulation only for NSP WM suggesting that beneficial effects of STN DBS on neural activity are modality specific. In accordance with previous observations, our findings demonstrate that at least for visual WM, STN stimulation outcome on neural activity is not homogeneous.
Cerebellocortical Deactivation Independent of WM Modality in PD
When comparing the activation between PD and CT, we found a deactivation in certain cortical (visual associative areas) and subcortical (cerebellum) regions independently of the visual WM modalities. These changes in neuronal functioning that are nonspecific and independent of the encoded visual modality might reflect the effect of the neuropathological process of the disease.
Visual occipital and fusiform cortex: A significant reduction of the activity of visual associative areas was observed in the fusiform, occipital and cuneus gyri on the right and on the left hemisphere during all memory tasks, including the associative memory task. Even with STN stimulation, the posterior cortical activity, mainly in the fusiform cortex remained diminished with no significant therapy effect. Thus, we postulate that the visual associative cortical dysfunction is likely due to the PD degenerative process. Similarly, Geday et al. 2006 suggest the activity decline observed in the fusiform gyrus during emotional processing might be linked to the PD pathological processes. This assumption is enhanced by anatomical evidence that this cortical region, as well as essentially all neocortex excluding primary auditory and visual cortices, is well connected to the basal ganglia [Middleton and Strick, 1996]. Furthermore, we know that these regions are involved in visual cognitive processes including visual encoding, recognition and attention [see for review Cabeza and Nyberg, 1997, 2000]. Thus these posterior visual areas affected in our patients with PD are likely implicated in the encoding of visual features to be stored in WM. As discussed below, such a visual cortical dysfunction might be compensated by the recruitment of adjacent parieto‐temporal cortical sites that were activated in our study.
Cerebellum: The right and left cerebellum activity recruited, respectively, by SP and NSP WM was significantly reduced in the PD‐OFF group. This cerebellar activity decline likely resulting from the pathological effect of PD, has been previously described either at the resting level in patients with PD [Geday et al., 2009; Skidmore et al., 2011] or during cognitive tasks [Huang et al., 2007; Lejeune et al., 2008], including WM and time‐keeping tasks [Harrington et al., 2011]. Interestingly, using event‐related functional magnetic resonance imaging, Chen and Desmond 2005 investigated the role of the cerebellum in verbal WM and demonstrated that the inferior cerebelloparietal network is involved in the maintenance phase of WM. Thus, it is possible that in patients with PD‐OFF stimulation a dysfunction of this pathway contributes to the WM deficits observed in the current study.
Compensatory or Aberrant Parieto‐Temporal Activation for Visual WM in PD
In PD‐OFF stimulation, we observed that separate posterior and anterior cortical networks were overactivated when compared with control, respectively, in SP and NSP WM tasks. In SP tasks, the rCBF in the right parieto‐temporal and angular cortex was significantly increased in PD‐OFF when compared with control and even to the ON stimulation condition. In NSP memory, neuronal activation in medial prefrontal gyrus (BA 6) including SMA was enhanced in PD‐OFF and ‐ON stimulation when compared with control. Such a cortical hyperactivation can be interpreted in two opposite ways. First, it might result from a tentative compensation for the deactivation observed in visual associative and prefrontal cortex especially in PD‐OFF stimulation. A second alternative explanation of this cortical hyperactivation can be related to aberrant neuronal activity consecutive to the PD pathological processes. Indeed, Yu et al. [2007] have demonstrated that BOLD hyperactivation particularly in motor cortex can have a deleterious impact on motor function. These authors described that two opposite neurophysiological processes can explain neuronal hyperactivation observed in patients with PD: although cerebellar hyperactivation occurs as a compensatory mechanism for the basal ganglia disruption, the primary motor cortex hyperactivation is directly related to the negative upper limb rigidity. In our study, the multimodal posterior cortical regions that are hyperactivated in PD‐OFF stimulation participate in a number of cognitive processes of visuospatial function, including SP representation, visual attention and WM as well as visuomotor imagery [Cabeza and Nyberg, 2000 for review; Margulies et al., 2009]. Furthermore, these parieto‐temporal regions coupled to premotor frontal cortex are part of a large WM network (cerebellum, parieto‐temporal cortex, SMA and middle prefrontal cortex) whose temporal dynamics are perturbed in PD [Harrington et al., 2011]. Indeed, by investigating in PD the neuronal activation during temporal processes of a perceptual task, Harrington et al. 2011 demonstrated abnormal activation in the WM network during the memory information encoding phase. Thus the enhanced neuronal activation in the key nodes of the WM network, including parietal cortical and SMA, is suggestive of either aberrant or compensatory mechanisms in response to disease‐related disruption in WM function.
Dissociated Prefrontal Activation Related to Visual WM Modality
In agreement with previous neuroimaging studies in control subjects [Courtney et al., 1996; Haxby et al., 1991; Sala et al., 2003; Ventre‐Dominey et al., 2005], we identified dissociated prefrontal networks for SP and NSP WM, with the right dorsal middle prefrontal cortex (BA 9) activated only during SP WM and the inferior prefrontal cortex (BAs 45‐46) activated only during NSP WM.
In contrast to this normal condition, the dorsolateral prefrontal cortical activity detected during SP memory process was absent in patients with PD, independent of the STN stimulation status. Similarly, Campbell et al. 2008 described a similar decrease in dorsolateral prefrontal activity despite visuospatial memory amelioration in PD. Interestingly, we found that the inferior prefrontal cortex activity (BAs 47 and 11) was decreased when the patients with PD were not stimulated, and restored when stimulation was turned on. Similarly, the STN stimulation yielded a hyperactivation of the anterior cingulate cortex only during SP WM. As previously discussed, neuronal hyperactivation should be interpreted with caution as it can contribute to opposite functional outcomes, beneficial or deleterious. However, as the cingulate hyperactivation was associated with STN DBS and some behavioural enhancement, we suggest a positive rather than a deleterious mechanism underlying this additional cingulate cortex recruitment.
This therapeutical benefit of STN stimulation on limbic pathway activity might explain some of the performance improvements observed during the SP WM task. Indeed, the inferior prefrontal cortex including BA 47 has been involved in diverse cognitive processes, including the inhibitory response in task switching and manipulation of attentional and memory informations [Aron et al., 2004; Aron and Poldrack, 2006; Barbey et al., 2011; Cabeza and Nyberg, 2000; Jolles et al., 2011]. In the same vein, the anterior cingulate cortex participates in initiating correct responses and in suppressing inappropriate ones [George et al., 1994; Paus et al., 1993]. These findings suggest that the anterior cingulate cortex might act in controlling the operations taking place in the prefrontal cortex.
Therefore, we postulate that during SP WM the STN stimulation therapy might induce a recruitment of additional limbic structures including the ventral prefrontal cortex (BA 47) and the anterior cingulate (BA 24), to counteract for the pathological disruption of the dorsolateral prefrontal cortex. Conversely, during the NSP memory processing, the prefrontal cortical activation observed in control was maintained in PD as a significant activity was found, particularly ON stimulation, in the ventral prefrontal cortex including BA 45‐46 in PD.
One potential cause for this dissociated ventral versus dorsal restoration of activity in STN DBS could be related to the topographical organization of the STN, and placement of the stimulating electrodes [Mollion et al., 2011; Thobois et al., 2007]. STN is topographically organized with distinct territories linked to distinct territories of the striatum, in the CSTC system [Alexander et al., 1986]. The therapeutically oriented site of implantation may have a topographic localization that favors the ventral versus dorsal prefrontal cortex, though this is beyond the scope of the current research.
In conclusion, this study demonstrates how inquiry into the neuropathology of the corticostriatal system can contribute to our understanding of intact function. We have seen that in the pathological OFF stimulation condition, patients with PD are impaired in SP and NSP WM tasks, and that this deficit is partially restored with STN stimulation. Interestingly, this performance improvement was accompanied (1) by restored activation in the ventral prefrontal cortex, previously demonstrated to be recruited in the NSP task [Ventre‐Dominey et al., 2005] and (2) by additional recruitment of limbic cortical pathways during SP tasks. We thus see how restoration of function in the corticostriatal circuit is expressed in frontal “cognitive” circuits, illustrating how the canonical corticostriatal circuit [Alexander et al., 1986] is applicable to higher cognitive function including WM.
Acknowledgments
The authors wish to thank all the patients and volunteers who participated in this study. We thank the staff from the Lyon Life Sciences Imagery Center (CERMEP) for their help in PET scanning and Jérome Redouté for his assistance in the imagery data analysis.
Footnotes
We adopt the convention that CT > PD reveals deactivation in PD, and PD > CT reveals overactivation.
REFERENCES
- Alexander GE, DeLong MR, Strick PR (1986): Parallel organization of functionally segregated circuits linking basal ganglia and cortex. Annu Rev Neurosci 9:357–381. [DOI] [PubMed] [Google Scholar]
- Alberts JL, Voelcker‐Rehage C, Hallahan K, Vitek M, Bamzai R, Vitek JL (2008): Bilateral subthalamic stimulation impairs cognitive‐motor performance in Parkinson's disease patients. Brain 131:3348–3360. [DOI] [PMC free article] [PubMed] [Google Scholar]
- Aron AR, Robbins TW, Poldrack RA (2004): Inhibition and the right inferior frontal cortex. Trends Cogn Sci 8:170–177. [DOI] [PubMed] [Google Scholar]
- Aron AR, Poldrack RA (2006): Cortical and subcortical contributions to Stop signal response inhibition: role of the subthalamic nucleus. J Neurosci 26:2424–2433. [DOI] [PMC free article] [PubMed] [Google Scholar]
- Barbey AK, Koenigs M, Grafman J (2011): Orbitofrontal contributions to human working memory. Cereb Cortex 21:789–795. [DOI] [PMC free article] [PubMed] [Google Scholar]
- Brown RG, Dowsey PL, Brown P, Jahanshahi M, Pollak P, Benabid AL, Rodriguez‐Oroz MC, Obeso J, Rothwell JC (1999): Impact of deep brain stimulation on upper limb akinesia in Parkinson's disease. Ann Neurol 45:473–488. [DOI] [PubMed] [Google Scholar]
- Cabeza R, Nyberg L (1997): Imaging cognition: An empirical review of PET studies with normal studies. J Cogn Neurosci 9:1–26. [DOI] [PubMed] [Google Scholar]
- Cabeza R, Nyberg L (2000): Imaging cognition: An empirical review of 275 PET studies and fMRI studies. J Cogn Neurosci 12:1–47. [DOI] [PubMed] [Google Scholar]
- Campbell MC, Karimi M, Weaver PM, Wu J, Perantie DC, Golchin NA (2008): Neural correlates of STN DBS‐induced cognitive variability in Parkinson disease. Neuropsychologia 46:3162–3169. [DOI] [PMC free article] [PubMed] [Google Scholar]
- Chen SH, Desmond JE (2005): Temporal dynamics of cerebro‐cerebellar network recruitment during a cognitive task. Neuropsychologia 43:1227–1237. [DOI] [PubMed] [Google Scholar]
- Cools R, Stefanova E, Barker RA, Robbins TW, Owen AM (2002): Dopaminergic modulation of high‐level cognition in Parkinson's disease: The role of the prefrontal cortex revealed by PET. Brain 125:584–594. [DOI] [PubMed] [Google Scholar]
- Courtney SM, Ungerleider LG, Keil K, Haxby JV (1996): Object and spatial visual working memory activate separate neural systems in human cortex. Cereb Cortex 6:39–50. [DOI] [PubMed] [Google Scholar]
- Dominey PF, Arbib MA (1992): A cortico‐subcortical model for generation of spatially accurate sequential saccades. Cereb Cortex 2:153–175. [DOI] [PubMed] [Google Scholar]
- Fahn S, Elton RL, the Members of the UPDRS Development Committee Unified Parkinson's Disease Rating Scale (1987): In: Fahn S, Marsden CD, Calne D, Goldstein M, editors.Recent developments in Parkinson's disease, Vol.2Florham Park:Macmillan; pp152–163. [Google Scholar]
- Fern‐Pollak L, Whone AL, Brooks DJ, Mehta MA (2004): Cognitive and motor effects of dopaminergic medication withdrawal in Parkinson's disease. Neuropsychologia 42:1917–1926. [DOI] [PubMed] [Google Scholar]
- Friston KJ, Holmes AP, Worsley KJ, Poline JP, Frith CD, Frackowiak RSJ (1994): Statistical parametric maps in functional imaging: A general linear approach. Hum Brain Mapp 2:189–210. [Google Scholar]
- Geday J, Ostergaard K, Gjedde A (2006): Stimulation of subthalamic nucleus inhibits emotional activation of fusiform gyrus. Neuroimage 33:706–714. [DOI] [PubMed] [Google Scholar]
- Geday J, Ostergaard K, Johnsen E, Gjedde A (2009): STN‐stimulation in Parkinson's disease restores striatal inhibition of thalamocortical projection. Hum Brain Mapp 30:112–121. [DOI] [PMC free article] [PubMed] [Google Scholar]
- George MS, Ketter TA, Parekh PI, Rosinsky N, Ring H, Casey BJ, Trimble MR, Horwitz B, Herscovitch P, Post SM (1994): Regional brain activity when selecting a response despite interference: An H2 15O PET study of the stroop and an emotional stroop. Hum Brain Mapp 1:194–209. [DOI] [PubMed] [Google Scholar]
- Gibb WRG, Lees AJ (1988): The relevance of the Lewy body to the pathogenesis of idiopathic Parkinson's disease. J Neurol Neurosurg Psychiatry 51:745–752. [DOI] [PMC free article] [PubMed] [Google Scholar]
- Harrington DL, Castillo GN, Greenberg PA, Song DD, Lessig S, Lee RR, Rao SM (2011): Neurobehavioral mechanisms of temporal processing deficits in Parkinson's disease. PLoS One 6:1–14. [DOI] [PMC free article] [PubMed] [Google Scholar]
- Haxby JV, Grady CL, Horwitz B, Ungerleider LG, Mishkin M, Carson RE, Herscovitch P, Schapiro MB, Rapoport SI (1991): Dissociation of object and spatial visual processing pathways in human extrastriate cortex. Proc Natl Acad Sci 88:1621–1625. [DOI] [PMC free article] [PubMed] [Google Scholar]
- Huang C, Mattis P, Tang C, Perrine K, Carbon M, Eidelberg D (2007): Metabolic brain networks associated with cognitive function in Parkinson's disease. Neuroimage 34:714–723. [DOI] [PMC free article] [PubMed] [Google Scholar]
- Jahanshahi M, Ardouin CM, Brown RG, Rothwell JC, Obeso J, Albanese A, Rodriguez‐Oroz MC, Moro E, Benabid AL, Pollak P, Limousin‐Dowsey P (2000): The impact of deep brain stimulation on executive function in Parkinson's disease. Brain 123:1142–1154. [DOI] [PubMed] [Google Scholar]
- Jolles DD, van Buchem MA, Crone EA, Rombouts SA (2011): Functional brain connectivity at rest changes after working memory training. Hum Brain Mapp (in press). [DOI] [PMC free article] [PubMed] [Google Scholar]
- Kalbe E, Voges J, Weber T, Haarer M, Baudrexel S, Klein JC, Kessler J, Sturm V, Heiss WD, Hilker R (2009): Frontal FDG‐PET activity correlates with cognitive outcome after STN‐DBS in Parkinson disease. Neurology 72:42–49. [DOI] [PubMed] [Google Scholar]
- Krack P, Pollak P, Limousin P, Hoffmann D, Xie J, Benazzouz A, Benabid AL (1998): Subthalamic nucleus or internal pallidal stimulation in young onset Parkinson's disease. Brain 121:451–457. [DOI] [PubMed] [Google Scholar]
- Lejeune F, Péron J, Biseul I, Fournier S, Sauleau P, Drapier S, Haegelen C, Drapier D, Millet B, Garin E, Herry JY, Malbert CH, Vérin M (2008): Subthalamic nucleus stimulation affects orbitofrontal cortex in facial emotion recognition: A PET study. Brain 131:1599–1608. [DOI] [PMC free article] [PubMed] [Google Scholar]
- Levy R, Goldman‐Rakic PS (2000): Segregation of working memory functions within the dorsolateral prefrontal cortex. Exp Brain Res 133:23–32. [DOI] [PubMed] [Google Scholar]
- Levy R, Friedman HR, Davachi L, Goldman‐Rakic PS (1997): Differential activation of the caudate nucleus in primates performing spatial and non‐spatial working memory tasks. J Neurosci 17:3870–3882. [DOI] [PMC free article] [PubMed] [Google Scholar]
- Limousin P, Pollak P, Benazzouz A, Hoffmann D, Le Bas JF, Perret JE, Benabid AL, Broussolle E, Perret JE, Benabid AL (1995): Effect on parkinsonian signs and symptoms of bilateral subthalamic nucleus stimulation. Lancet 345:91–95. [DOI] [PubMed] [Google Scholar]
- Limousin P, Krack P, Pollak P, Benazzouz A, Ardouin C, Hoffmann D, Benabid AL (1998): Electrical stimulation of the subthalamic nucleus in advanced Parkinson's disease. N Engl J Med 339:1105–1111. [DOI] [PubMed] [Google Scholar]
- Maldjian, JA , Laurienti, PJ , Burdette, JB , Kraft RA (2003): An automated method for neuroanatomic and cytoarchitectonic atlas‐based interrogation of fMRI data sets. Neuroimage 19:1233–1239. [DOI] [PubMed] [Google Scholar]
- Maldjian JA, Laurienti PJ, Burdette JH (2004): Precentral gyrus discrepancy in electronic versions of the talairach atlas. Neuroimage 21:450–455. [DOI] [PubMed] [Google Scholar]
- Margulies DS, Vincent JL, Kelly C, Lohmann G, Uddin LQ, Biswal BB, Villringer A, Castellanos FX, Milham MP, Petrides M (2009): Precuneus shares intrinsic functional architecture in humans and monkeys. Proc Natl Acad Sci U S A 106:20069–20074. [DOI] [PMC free article] [PubMed] [Google Scholar]
- Mattay VS, Tessitore A, Callicott JH, Bertolino A, Goldberg TE, Chase TN, Hyde TM, Weinberger DR (2002): Dopaminergic modulation of cortical function in patients with Parkinson's disease. Ann Neurol 51:156–164. [DOI] [PubMed] [Google Scholar]
- Middleton FA, Strick PL (1996): The temporal lobe is a target of output from the basal ganglia. Proc Natl Acad Sci 93:8683–8687. [DOI] [PMC free article] [PubMed] [Google Scholar]
- Mollion H, Ventre‐Dominey J, Dominey PF,and Broussolle E (2003): Dissociable effects of dopaminergic therapy on spatial versus non‐spatial working memory in Parkinson's disease. Neuropsychologia 41:1443–1451. [DOI] [PubMed] [Google Scholar]
- Mollion H, Dominey PF, Broussolle E, Ventre‐Dominey J (2011): Subthalamic nucleus stimulation selectively improves motor and visual memory performance in Parkinson's disease. Mov Disord 26:2019–2025. [DOI] [PubMed] [Google Scholar]
- Owen AM, Beksinska M, James M, Leigh PN, Summers BA, Marsden CD, Quinn NP, Sahakian BJ, Robbins TW (1993): Visuospatial memory deficits at different stages of Parkinson's disease. Neuropsychologia 31:627–644. [DOI] [PubMed] [Google Scholar]
- Owen AM, Evans AC, Petrides M (1996): Evidence for a two‐stage model of spatial working memory processing within the lateral frontal cortex: A positron emission tomography study. Cereb Cortex 6:31–38. [DOI] [PubMed] [Google Scholar]
- Owen AM, Iddon JL, Hodges JR, Summers BA, Robbins TW (1997): Spatial and non‐spatial working memory at different stages of Parkinson's disease. Neuropsychologia 35:519–532. [DOI] [PubMed] [Google Scholar]
- Owen AM, Doyon J, Dagher A, Sadikot A, Evans AC (1998): Abnormal basal ganglia outflow in Parkinson's disease identified with PET. Implications for higher cortical functions. Brain 121:949–965. [DOI] [PubMed] [Google Scholar]
- Paus T, Petrides M, Evans AC, Meyer E (1993): Role of the human anterior cingulate cortex in the control of oculomotor, manual, and speech responses: a positron emission tomography study. J Neurophysiol 70:453–469. [DOI] [PubMed] [Google Scholar]
- Pillon B, Deweer B, Vidailhet M, Bonnet AM, Hahn‐Barma V, Dubois B (1998): Is impaired memory for spatial location in Parkinson's disease domain specific or dependent on ‘strategic’ processes? Neuropsychologia 36:1–9. [DOI] [PubMed] [Google Scholar]
- Pillon B, Ardouin C, Damier P, Krack P, Houeto JL, Klinger H, Bonnet AM, Pollak P, Benabid AL, Agid Y (2000): Neuropsychological changes between “off” and “on” STN or GPi stimulation in Parkinson's disease. Neurology 55:411–418. [DOI] [PubMed] [Google Scholar]
- Possin KL, Filoteo JV, Song DD, Salmon DP (2008): Spatial and object working memory deficits in Parkinson's disease are due to impairment in different underlying processes. Neuropsychology 22:585–595. [DOI] [PMC free article] [PubMed] [Google Scholar]
- Postle BR, D'Esposito M (1999): Dissociation of human caudate nucleus activity in spatial and non‐spatial working memory: an event‐related fMRI study. Brain Res Cogn Brain Res 8:107–115. [DOI] [PubMed] [Google Scholar]
- Postle BR, Jonides J, Smith EE, Corkin S, Growdon JH (1997): Spatial, but not object, delayed response is impaired in early Parkinson's disease. Neuropsychology 11:171–179. [DOI] [PubMed] [Google Scholar]
- Saint‐Cyr JA, Trépanier LL, Kumar R, Lozano AM, Lang AE (2000): Neuropsychological consequences of chronic bilateral stimulation of the subthalamic nucleus in Parkinson's disease. Brain 123:2091–2108. [DOI] [PubMed] [Google Scholar]
- Sala JB, Rämä P, Courtney SM (2003): Functional topography of a distributed neural system for spatial and nonspatial information maintenance in working memory. Neuropsychologia 41:341–356. [DOI] [PubMed] [Google Scholar]
- Schroeder U, Kuehler A, Haslinger B, Erhard P, Fogel W, Tronnier VM, Lange KW, Boecker H, Ceballos‐Baumann AO (2002): Subthalamic nucleus stimulation affects striato‐anterior cingulate cortex circuit in a response conflict task: A PET study. Brain 125:1995–2004. [DOI] [PubMed] [Google Scholar]
- Schroeder U, Kuehler A, Lange KW, Haslinger B, Tronnier VM, Krause M, Pfister R, Boecker H, Ceballos‐Baumann AO (2003): Subthalamic nucleus stimulation affects a frontotemporal network: A PET study. Ann Neurol 54:445–450. [DOI] [PubMed] [Google Scholar]
- Skidmore FM, Yang M, Baxter L, von Deneen KM, Collingwood J, He G, White K, Korenkevych D, Savenkov A, Heilman KM, Gold M, Liu Y (2011): Reliability analysis of the resting state can sensitively and specifically identify the presence of Parkinson disease. Neuroimage (in press). [DOI] [PubMed] [Google Scholar]
- Talairach J, Tournoux P (1988):Co‐planar Stereotaxic Atlas of the Human Brain.New York:Thieme. [Google Scholar]
- Taylor AE, Saint‐Cyr JA, Lang AE (1986): Frontal lobe dysfunction in Parkinson's disease. The cortical focus of neostriatal outflow. Brain 109:845–883. [DOI] [PubMed] [Google Scholar]
- Thobois S, Dominey P, Fraix V, Mertens P, Guenot M, Zimmer L, Pollak P, Benabid AL, Broussolle E (2002): Effects of subthalamic nucleus stimulation on actual and imagined movement in Parkinson's disease: A PET study. J Neurol 249:1689–1698. [DOI] [PubMed] [Google Scholar]
- Thobois S, Hotton GR, Pinto S, Wilkinson L, Limousin‐Dowsey P, Brooks DJ, Jahanshahi M (2007): STN stimulation alters pallidal‐frontal coupling during response selection under competition. J Cereb Blood Flow Metab 27:1173–1184. [DOI] [PubMed] [Google Scholar]
- Tzourio‐Mazoyer N, Landeau B, Papathanassiou D, Crivello F, Etard O, Delcroix N, Mazoyer B, Joliot M (2002): Automated anatomical labeling of activations in SPM using a macroscopic anatomical parcellation of the MNI MRI single‐subject brain. Neuroimage 15:273–289. [DOI] [PubMed] [Google Scholar]
- Trepanier LL, Kumar R, Lozano AM, Lang AE, Saint‐Cyr JA (2000): Neuropsychological outcome of GPi pallidotomy and GPi or STN deep brain stimulation in Parkinson's disease. Brain Cogn 42:324–347. [DOI] [PubMed] [Google Scholar]
- Ventre‐Dominey J, Bailly A, Lavenne F, Lebars D, Mollion H, Costes N, Dominey PF (2005): Double dissociation in neural correlates of visual working memory: A PET study. Brain Res Cogn Brain Res 25:747–759. [DOI] [PubMed] [Google Scholar]
- Yu H, Sternad D, Corcos DM, Vaillancourt DE (2007): Role of hyperactive cerebellum and motor cortex in Parkinson's disease. Neuroimage 35:222–233. [DOI] [PMC free article] [PubMed] [Google Scholar]