

Abstract
Quality of life (QOL) has been defined in many ways, and these definitions usually emphasize happiness and satisfaction with life. Health‐related problems are known to cause lower QOL. However, the neural mechanisms underlying individual differences in QOL measured by questionnaire (QOLMQ) in young healthy subjects are unknown. QOL is essential to our well‐being, and investigation of the neural mechanisms underlying QOL in uncompromised subjects is obviously of great scientific and social interest. We used voxel‐based morphometry to investigate the association between regional gray matter volume (rGMV) and QOLMQ across the brain in healthy young adults (age, 21.4 ± 1.8 years) men (n = 88) and women (n = 68) in humans. We found significant negative relationships between QOLMQ and rGMV in a region in the left rostrolateral prefrontal cortex and regions in the dorsal part of the anterior cingulate gyrus and contingent cingulate regions. These findings show that structural variations in regions associated with processing of negative emotions such as fear and anger as well as those associated with evaluation of internally generated information are associated with QOLMQ. These findings suggest that these processes might be related to QOLMQ in healthy young adults. Hum Brain Mapp 35:1834–1846, 2014. © 2013 Wiley Periodicals, Inc.
Keywords: quality of life (QOL), voxel‐based morphometry (VBM), anterior cingulate gyrus, regional gray matter volume (rGMV), rostrolateral prefrontal cortex
INTRODUCTION
Quality of life (QOL) has been defined in many ways, and these definitions usually emphasize happiness and satisfaction with life [Fayers and Machin, 2007]. QOL has several components, including psychological, social, and physical domains [Price and Harding, 1993]. According to the World Health Organization (WHO), QOL is a subjective psychological state, which implies that the most appropriate means of QOL measurement is a self‐report questionnaire [The_WHOQOL_Group, 1995]; indeed, current techniques for measuring QOL are questionnaire based [Finlay, 1997]. Investigation of the basis of QOL and the factors leading to QOL is clearly important for facilitation of human well‐being.
Health‐related problems appear to be a factor that affects QOL measured by questionnaire (QOLMQ) [Fayers and Machin, 2007]. In a previous neuroscientific study [Janardhan and Bakshi, 2000], brain lesions in patients with multiple sclerosis were shown to be related to QOLMQ, together with other physical and nonphysical factors such as emotional dysfunction and mental health. Emotional intelligence is also associated with QOLMQ in middle‐aged women [Extremera and Fernandez‐Berrocal, 2002]. Intelligence contributes little to QOLMQ in young adults [Watten et al., 1995], but lower QOLMQ in the elderly seems to be associated with lower IQ during childhood [Bain et al., 2003]. However, the neural basis of QOLMQ in young healthy subjects remains unknown. Although it is clear that severe diseases can be detrimental to QOL, studying the neural basis of QOL in subjects without such conditions can give us insight into what factors underlie QOL and lead to the subjective well‐being of humans, which is of scientific and social interest.
This study aimed to investigate the association between QOLMQ and regional gray matter volume (rGMV) to determine what neural mechanisms QOL measurements are tapping in the brain. Functional and structural imaging studies are believed to complement each other. However, structural imaging studies are especially suited to investigating the neural correlates of QOL because it may be difficult to tap the cognitive processes involving the whole range of QOL during the short cognitive tasks characteristic of functional neuroimaging studies. Furthermore, structural imaging studies are not limited to the specific regions engaged in/with a task or stimuli during scanning and need not take into account unusual situations simulating cognitive activities related to QOL in daily life [Okamoto et al., 2004]. As summarized in our previous study [Takeuchi et al., 2012b], potential rGMV correlates include the number and size of neurons, glia, and neurites, and the level of synaptic bulk [Draganski et al., 2004; May and Gaser, 2006], although this notion remains to be proven by histological studies. Furthermore, rGMV is widely accepted as the basis of individual intellectual ability. The networks that underlie intellectual ability can be identified by measuring rGMV [Colom et al., 2006, 2007; Haier et al., 2004, 2005]. By utilizing this method, the brain structures and possibly the cognitive processes that underlie individual QOLMQ, which is affected by a number of factors described above, can be investigated.
In this study, we used voxel‐based morphometry (VBM) [Good et al., 2001] to assess rGMV and the Japanese version of the WHOQOL‐26 QOL scale to assess QOL [Tazaki and Nakane, 2007]. WHOQOL‐26 is a short version of the WHOQOL [The_WHOQOL_Group, 1995] scale. It is a self‐rating instrument that assesses individuals' perceptions of position in life in the context of the culture and value system in which they live and in relation to their goals, expectations, standards, and concerns. To date, the WHOQOL‐26 has been widely used to evaluate QOL.
METHODS
Subjects
One hundred fifty‐nine healthy, right‐handed university students or postgraduates (90 men and 69 women; age: 21.4 ± 1.8 years) participated in this study as part of our ongoing project investigating the associations among brain imaging, cognitive functions, and aging [Takeuchi et al., 2010a, 2010b, 2011a, 2011d, h; Taki et al., 2011, in press]. Data from some subjects of this study were used in another study [Takeuchi et al., 2011d], and all data from the subjects of this study will also be used in other studies that are irrelevant to the theme of this study. Some of the subjects who participated in this study also participated in our intervention studies [e.g., Takeuchi et al., 2011b], but psychological and imaging data recorded before the interventions were used in this study. Psychological tests and MRI scans not described in this study were performed together with those described in this study. All subjects were well educated and of relatively high socioeconomic status. They had normal vision and none had a history of neurological or psychiatric illness. Handedness was evaluated using the Edinburgh Handedness Inventory [Oldfield, 1971]. We failed to collect QOLMQ data from three subjects; they were removed from subsequent analyses.
QOL Assessment
The Japanese version of the QOL scale, WHOQOL‐26 [Tazaki and Nakane, 2007], was used to assess QOL. A detailed discussion of how this scale was developed can be found in the manual that accompanies the scale [Tazaki and Nakane, 2007]. WHOQOL‐26 comprises 26 items and employs a five‐point Likert scale with a response format ranging from “very bad” to “very good.” The questions include subjective evaluations of physical, psychological (cognitive and affective state), social (interpersonal relationships and social roles in life), environmental (relationships to salient features of the environment), and global (meaning in life or overarching personal beliefs) states. The average score for the 26 items, which is by far the most widely used measure [Tazaki and Nakane, 2007], was used in this study. This score was also used because in our sample the individual scores for each domain (physical, psychological, social, and environmental) were strongly correlated with one another (r = 0.633 and 0.628 for the two highest correlations; see the Behavioral Data subsection in Results). This made it statistically inappropriate to observe the specific effect of each domain using multiple regression analysis (because of the problem of multicollinearity, also refer to the supplementary factor analysis results). However, although our primary focus was the average score across all 26 items, we also evaluated the summary scores for each domain and performed the analyses for those scores in the whole‐brain analyses. This is because although the aforementioned high correlations among the subscales (r > 0.6) made it impossible to dissociate the effects of each subscale statistically, the correlation coefficients were not so high (r > 0.7–0.8) that each subscale cannot be considered to provide meaningful different information [Heausler and Thompson, 1988; Treffinger, 1985].
The average WHOQOL‐26 score has been shown to be reduced in patients with cancer, schizophrenia, and obsessive compulsive disorder, and to be increased in patients with schizophrenia and obsessive compulsive disorder after treatment [Tazaki and Nakane, 2007], proving the external validity of WHOQOL‐26.
Assessment of Psychometric Measures of General Intelligence
Raven's advanced progressive matrix (RAPM) [Raven, 1998], the best measure of general intelligence, was used in this study. Adjustments were made for the effect of general intelligence on brain structures [Colom et al., 2006; Haier et al., 2004; Jung and Haier, 2007; Narr et al., 2007; Toga and Thompson, 2005]. This measure was also used to exclude the possibility that any significant correlation between rGMV and QOLMQ was caused by an association between (a) QOLMQ and general intelligence and (b) rGMV and general intelligence.
Assessment of the Socioeconomic Status
The indirect associations between QOL and brain structures, which were mediated by general intelligence, were not of interest in this study. However, associations between QOL and brain structures, which were mediated by environmental effects on QOL, may not necessarily be excluded. However, determination of how associations between brain structures and QOL are mediated by environmental factors such as socioeconomic status is helpful for understanding the nature of the structure–QOL association. For this purpose, data relating to the socioeconomic status of some of the participants (N = 96) were analyzed.
The measure of socioeconomic status consisted of three questions. One was an enquiry relating to family annual income as reported in our previous study [Taki et al., 2010]. Annual income data were collected using discrete variables: 1, annual income <US$ 16,000 (the currency exchange rate was set at US$ 1 = 80 yen); 2, annual income US$ 16,000–32,000; 3, annual income US$ 32,000–48,000; 4, annual income US$ 48,000–64,000; 5, annual income US$ 64,000–80,000; 6, annual income US$ 80,000–96,000; and 7, annual income ≥US$ 96,000. The values 1–7 were used in subsequent regression analyses. The other two questions related to the highest educational qualification of both parents. There were eight options [1, elementary school graduate or below; 2, junior high school graduate; 3, graduate of a short‐term school completed after junior high school; 4, normal high school graduate; 5, graduate of a short‐term school completed after high school (such as a junior college); 6, university graduate; 7, Masters degree; and 8, Doctorate] and each choice was converted into the number of years taken to complete the qualification in the normal manner in the Japanese education system (1, 6 years; 2, 9 years; 3, 11 years; 4, 12 years; 5, 14 years; 6, 16 years; 7, 18 years; and 8, 21 years). The average of the converted values for each parent was used in the analyses. This protocol followed the standard approach used by the Japanese government for evaluating socioeconomic status, but the questions relating to the parents' highest educational qualifications were modified to increase the number of options available and thus also increased precision.
Image Acquisition
All MRI data were acquired using a 3‐T Philips Intera Achieva scanner (Philips Medical Systems, Best, The Netherlands). High‐resolution T1‐weighted structural images (240 × 240 matrix; repetition time, 6.5 ms; echo time, 3 ms; field of view, 24 cm; slices, 162; and slice thickness, 1.0 mm) were collected using a magnetization‐prepared rapid gradient echo (MPRAGE) sequence [Takeuchi et al., 2010a].
Preprocessing of Structural Data
Preprocessing of morphological data was performed using VBM2 software, an extension of Statistical Parametric Mapping software (SPM2; Wellcome Department of Cognitive Neurology, London, UK), and default settings were used. To reduce the scanner‐specific bias, we used a customized gray matter (GM) anatomical template and prior probability maps of GM and white matter (WM) images created from T1‐weighted structural images obtained using this scanner in our previous study [Takeuchi et al., 2010a, 2011e, 2011f]. The T1‐weighted structural images from each subject were then segmented into GM and WM partitions using new GM and WM prior probability maps, and the resulting images included extracted GM and WM partitions in the native space. The GM partition was then normalized to a new GM probability map. The normalization parameters determined from this initial step were applied to the native T1‐weighted structural image. These normalized T1‐weighted structural data were then segmented into GM and WM partitions. In addition, we performed a volume change correction (modulation) by modulating each voxel with the Jacobian determinants derived from spatial normalization, facilitating determination of regional differences in the absolute amount of GM [Ashburner and Friston, 2000]. Subsequently, all images were smoothed by convolving them with an isotropic Gaussian kernel of 12‐mm full width at half maximum. The resulting maps representing rGMV were then subjected to whole‐brain analysis.
Reasons for Using VBM2
VBM2 instead of VBM5 or VBM8 was used for preprocessing of morphological data because the T1‐weighted images obtained using the abovementioned MPRAGE sequence were incompatible with preprocessing by VBM5/SPM5 and VBM8/SPM8. When VBM5 or SPM5 was used, many apparent segmentation errors occurred, but this was not the case when the optimized protocol of VBM2 was used. No segmentation errors were apparent at first glance when VBM2 or VBM8 was used. However, when VBM8 was used, the test‐retest reliability of total GM volume among 50 subjects who underwent a longitudinal intervention study in which a T1‐weighted structural image was acquired on the first day of the experiment and 1 week thereafter [Takeuchi et al., 2011b] was 0.746, whereas it was 0.980 when VBM2 was used. These procedures (preprocessing with VBM2 and statistical analysis with VBM5) were also used in previous studies [Ilg et al., 2008; Takeuchi et al., 2010a, 2011e, 2011g]. Although the abovementioned data do not indicate that preprocessing with VBM5/VBM8 is worse than any other software, it indicates that there are incompatibilities between T1‐weighted structural images of certain sequences and VBM5/VBM8.
Statistical Analyses
Statistical analyses relating to rGMV were performed using VBM5 software, an extension of SPM5. We only included voxels with GM of >0.05 in rGMV analyses. In whole‐brain analyses, we used voxel‐wise analysis of covariance (ANCOVA), with sex difference as a grouping factor (using the full factorial option of SPM5). In this analysis age, RAPM score, total brain volume (total GM volume + total WM volume), and the average WHOQOL‐26 score were covariates. Age, RAPM score, and the average WHOQOL‐26 score were modeled so that each covariate had a unique relationship with rGMV for each sex (using the interactions option in SPM5), which enabled investigation of the effects of interaction between sex and each covariate. On the other hand, total brain volume was not modeled in this manner, and a common effect of total brain volume on rGMV was assumed for both sexes. In these analyses, the centering option was used for centering the interactions. The main effects of the average WHOQOL‐26 score (contrasts of [the effects of the average WHOQOL‐26 score for males, that for females] were [1 1] or [−1 −1]) and the interaction between sex and the average WHOQOL‐26 score (contrasts of [the effect of the average WHOQOL‐26 score for males, the effect of the average WHOQOL‐26 score for females] were [−1 1] or [1 −1]) were assessed using t‐contrasts.
The analysis of the interaction between sex and the average WHOQOL26 score on rGMV did not reveal any significant results, and our interest lies principally in the significant results obtained from the analyses performed using data from both sexes. However, to further confirm that the similar effects are seen in males and in females and to further confirm that there are not any significant results in other areas in the analyses of each sex alone, we performed additional multiple regression analyses using data from males and females alone. In these analyses, independent variables were age, RAPM score, total brain volume, and the average WHOQOL‐26 score.
Furthermore, in the supplementary analyses of the summary scores for each WHOQOL26 domain, the average WHOQOL26 score was replaced by the summary score for each WHOQOL26 domain in the abovementioned ANCOVA in analysis of each WHOQOL26 norm [resulting in four ANCOVAs (one for physical norm, psychological norm, social norm, and environmental norm)]. The statistical significance level was set at P < 0.05, corrected for multiple comparisons [voxel‐wise family‐wise error (FWE)].
RESULTS
Behavioral Data
Table 1 shows the average plus standard deviation (SD) of age, RAPM score, and the average WHOQOL‐26 score for males and females. Females had a significantly higher average WHOQOL‐26 score than males. Table 2 shows the distribution of the average WHOQOL‐26 score among males and females.
Table 1.
Demographic variables and statistical values for comparison between males and females
| Measure | Males | Females | P valuea | T valuea | Effect sizea | ||
|---|---|---|---|---|---|---|---|
| Mean | SD | Mean | SD | ||||
| Age | 21.20 | 1.93 | 21.67 | 1.61 | 0.106 | 1.63 | −0.262 |
| RAPM | 28.53 | 3.43 | 27.75 | 3.88 | 0.188 | 1.33 | 0.213 |
| Average WHOQOL‐26 score | 3.56 | 0.48 | 3.76 | 0.47 | 0.008 | 2.68 | −0.431 |
Note that the data are for 156 subjects from whom QOL data were obtained.
Statistical values are the comparative values for each measure for males and females.
Table 2.
Distribution of the average WHOQOL‐26 score for study participants
| 2 < x ≤ 2.5 | 2.5 < x ≤ 3 | 3 < x ≤ 3.5 | 3.5 < x ≤ 4 | 4 < x ≤ 4.5 | 4.5 < x ≤ 5 | |
|---|---|---|---|---|---|---|
| Male | 2 | 10 | 29 | 33 | 11 | 3 |
| Female | 0 | 2 | 22 | 23 | 16 | 6 |
Age and RAPM score were not significantly correlated with the average WHOQOL‐26 score among all subjects, among males, and among females (P > 0.1, simple regression analysis). Multiple regression analysis revealed (after correcting for the effects of age and sex) that the RAPM score was not significantly correlated with the average WHOQOL‐26 score [P = 0.349, t = −0.940, and standardized partial regression coefficient (β) = −0.76], indicating the lack of a significant association between QOLMQ and general intelligence in this sample. This lack of a significant association was also found when the score on a Tanaka B‐type intelligence test [for details, see Takeuchi et al., 2011b], which calculates intelligence from several tasks, was used instead of the RAPM score in multiple regression analysis (P = 0.685, t = 0.406, and β = 0.032).
Simple regression analyses revealed that the summary scores for each WHOQOL domain (physical, psychological, social, and environmental) were significantly correlated with one another. The summary score for the physical domain was significantly and positively correlated with the summary scores for the psychological domain (r = 0.633, t = 10.14, P = 8.03 × 10⁻¹⁹), the social domain (r = 0.500, t = 7.17, P = 2.96 × 10⁻¹¹), and the environmental domain (r = 0.481, t = 6.80, P = 2.15 × 10⁻¹⁰). The summary score for the psychological domain was significantly and positively correlated with the summary scores for the social domain (r = 0.628, t = 10.01, P = 1.79 × 10⁻¹⁸) and the environmental domain (r = 0.375, t = 5.02, P = 1.40 × 10⁻⁶). The summary score for the social domain was significantly and positively correlated with the summary score for the environmental domain (r = 0.411, t = 5.60, P = 9.56 × 10⁻⁸). These results indicate that multiple regression analysis that includes all of these factors to investigate the specific effects of each domain would be inappropriate because of the rather strong correlations among the scores for each domain. These psychological data support the primary focus on the average QOL score used in our study as well as in an overwhelming number of previous studies that have used this questionnaire. These data suggest that in a sample such as ours (young, healthy adults in developed countries) one who complains in one domain is highly likely to complain in other domains.
Effects of the Average WHOQOL‐26 Score on rGMV in the Analyses Performed Using Data From Both Sexes
ANCOVA revealed an overall negative main effect (regardless of sex) of the average WHOQOL‐26 score on rGMV in a region in the left rostrolateral prefrontal cortex (RLPFC; Fig. 1) and regions in the dorsal part of the anterior cingulate gyrus (dACG) and contingent cingulate regions (Fig. 2). All results are shown in Table 3. No overall significant positive main effect of the average WHOQOL‐26 score was observed on rGMV. No significant effects of interaction between the average WHOQOL‐26 score and sex were observed on rGMV.
Figure 1.
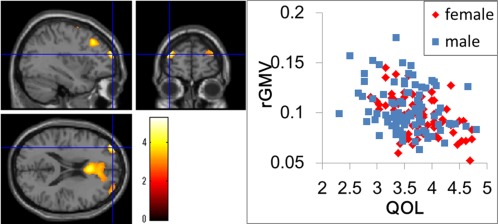
(a) Negative main effect of QOLMQ on rGMV. The results are shown with P < 0.0025, uncorrected. Regions of correlation are overlaid on SPM5′s “single‐subject” T1 image. A region with significant effect is shown in the left and right RLPFCs, which showed a tendency toward the same effect. (b) A scatter plot of the relationship between the average WHOQOL26 score and rGMV values in the peak voxel of the significant cluster in the left RLPFC (x, y, z = −35, 59, 19).
Figure 2.
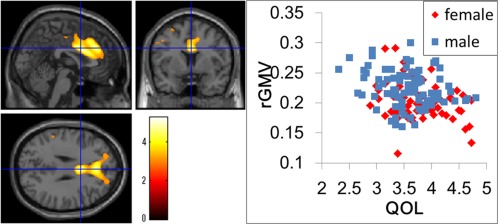
(a) Negative main effect of QOLMQ on rGMV. The results are shown with P < 0.0025, uncorrected. Regions of correlation are overlaid on SPM5′s “single‐subject” T1 image. A significant effect was observed in the ACG and contingent regions. (b) A scatter plot of the relationship between the average WHOQOL‐26 score and rGMV values in the peak voxel of the significant cluster in dACG (x, y, z = 2, 6, 29).
Table 3.
Negative main effect of the average WHOQOL‐26 score on rGMV
| Area | x | y | z | T score | Corrected P value (FWE) | Cluster size (mm3) | |
|---|---|---|---|---|---|---|---|
| RLPFC | L | −35 | 59 | 19 | 5.28 | 0.009 | 30 |
| ACG | 2 | 6 | 29 | 5.07 | 0.021 | 54 | |
| Cingulate gyrus | L | −2 | 24 | 42 | 4.86 | 0.045 | 1 |
| Area of no anatomical names in the atlas | L | 0 | 32 | 31 | 4.85 | 0.047 | 1 |
| Cingulate gyrus | L | 1 | 31 | 32 | 4.84 | 0.048 | 1 |
No regions showed a significant positive main effect of the average WHOQOL‐26 score on rGMV.
Effects of the Average WHOQOL‐26 Score on rGMV in the Analyses Performed Using Data From Each Sex Individually
No significant results were obtained in analyses performed using data from males and females alone. However, a similar tendency toward the significant results obtained in the analyses performed using data from both sexes was observed in the left RLPFC and dACG in both sexes.
Effects of the Summary Score of Each Domain on rGMV in the Analyses Performed Using Data From Both Sexes
ANCOVA of the summary scores for each domain revealed an overall negative main effect (regardless of sex) of the summary score for the psychological domain on rGMV in a region in dACG and an overall negative main effect of the summary score for the physical domain on rGMV in the left RLPFC. No other significant results were observed. However, tendencies similar to those identified for the average WHOQOL‐26 score were obtained for regions in dACG and/or contingent cingulate regions as well as regions in the left RLPFC. The significance of these results from the perspective of T values was not substantially different, suggesting that the specificity of the effect of each domain was not clear in this study. However, the effect of the summary score of the social domain in the left RLPFC was somewhat weak compared with the other results, and the results may or may not suggest a weak association between this area and the social domain of QOL, which is consistent with our interpretation of the association of this area with QOL (see Discussion). These results are presented in Table 4.
Table 4.
Results showing a significant negative correlation between the WHOQOL26 score and dACG and/or contingent regions and the left RLPFC or a tendency toward such a correlation in the supplementary analyses
| Area | x | y | z | T score | Corrected P value (FWE) | Corrected P value (uncorrected) | Cluster size (mm3) of significant voxels | |
|---|---|---|---|---|---|---|---|---|
| Multiple regression analysis for the average WHOQOL26 score using data from males alone | ||||||||
| RLPFC | L | −33 | 60 | 21 | 4.36 | 0.344 | 1.90 × 10⁻⁶ | — |
| dACG area | 2 | 6 | 29 | 3.80 | 0.879 | 1.41 × 10⁻⁴ | — | |
| Multiple regression analysis for the average WHOQOL26 score using data from females alone | ||||||||
| RLPFC | L | −36 | 58 | 19 | 3.92 | 0.851 | 1.09 × 10⁻⁴ | — |
| dACG area | −5 | 19 | 44 | 4.75 | 0.163 | 5.87 × 10⁻⁶ | — | |
| ANCOVA for the summary score of the physical domain using data from both sexes | ||||||||
| RLPFC | L | −34 | 60 | 19 | 5.07 | 0.020 | 5.88 × 10⁻⁷ | 7 |
| dACG area | 2 | 7 | 29 | 4.34 | 0.259 | 1.34 × 10⁻⁵ | — | |
| ANCOVA for the summary score of the psychological domain using data from both sexes | ||||||||
| RLPFC | L | −35 | 60 | 18 | 3.77 | 0.828 | 1.17 × 10⁻⁴ | — |
| dACG area | 3 | 5 | 28 | 5.69 | 0.002 | 3.25 × 10⁻⁸ | 362 | |
| ANCOVA for the summary score of the social domain using data from both sexes | ||||||||
| RLPFC | L | −36 | 58 | 20 | 2.48 | 1.000 | 0.0071 | — |
| dACG area | −2 | 29 | 32 | 4.50 | 0.158 | 6.97 × 10⁻⁶ | — | |
| ANCOVA for the summary score of the environmental domain using data from both sexes | ||||||||
| RLPFC | L | −35 | 57 | 20 | 4.61 | 0.108 | 4.26 × 10⁻⁶ | — |
| dACG area | −10 | 37 | 36 | 3.95 | 0.652 | 6.14 × 10⁻⁵ | — | |
No significant effects of interactions between the summary scores of specific domains and sex were observed on rGMV in any of the analyses of specific domains.
Analyses Investigating the Effects of Parental Socioeconomic Status
Responses to the three questions relating to socioeconomic status were obtained from 93 of the 96 subjects from whom relevant data were gathered. Among the 93 subjects, family annual income was significantly and positively correlated with parents' highest educational qualification (r = 0.437, t = 4.633, P < 0.001, simple regression analysis). However, no significant correlation was observed between family annual income and the average WHOQOL‐26 score (r = −0.035, t = −0.334, P = 0.739, simple regression analysis). Furthermore, no significant correlation was observed between parents' highest educational qualification and the average WHOQOL‐26 score (r = 0.024, t = 0.231, P = 0.818, simple regression analysis).
Next, we investigated how associations between QOLMQ and rGMV in the significant voxels identified above (Table 3) were affected by socioeconomic status among these 93 subjects. In these analyses, we extracted the mean value of all significant voxels in dACG and a contingent areas as well as the mean value of significant voxels in the left RLPFC from each subject. Multiple regression analysis accounting for the effects of age, sex, RAPM score, and total brain volume revealed a significant negative correlation between the average WHOQOL‐26 score and the mean rGMV value of significant voxels in the left RLPFC with statistical values of P < 0.001, t = −3.687, and β = −0.332. When family annual income and parents' highest educational qualifications were added as covariates, these values changed to P < 0.001, t = −3.826, and β = −0.347. In the same way, when the mean rGMV value of significant voxels in dACG was used instead of the mean in the left RLPFC, the statistical values of the association between the rGMV value and the average WHOQOL‐26 score were P < 0.001, t = −4.313, and β = −0.330 when only the effects of age, sex, RAPM score, and total brain volume were corrected. These statistical values changed to P < 0.001, t = −4.312, and β = −0.335 when the variables of parental socioeconomic status were added as covariates.
These results suggest that the significant association between QOLMQ and rGMV presented in Table 3 was little affected by the socioeconomic status of the subjects. We cannot be sure of how marginally significant or insignificant findings from the analysis of the effects of the average WHOQOL‐26 score on rGMV using data from both sexes (using data from 155 subjects) were affected by the addition of socioeconomic status because we could not obtain data from all subjects included in this analysis. However, the small correlation between variables related to socioeconomic status and QOLMQ described above suggests that the effects would have been minor.
DISCUSSION
To our knowledge, this is the first study investigating the association between QOLMQ and rGMV in healthy young adults. QOL is critical for our well‐being and investigating the neural mechanisms underlying QOL is socially and scientifically important. Our results showed that decreased rGMV in dACG and contingent cingulate regions as well as the left RLPFC was associated with higher QOLMQ.
Smaller rGMV in dACG may lead to the experience of fewer negative emotions such as fear and anger [Vogt, 2005], which may in turn lead to higher QOLMQ. One role of dACG that can be related to QOLMQ is processing of fear and anger [for review, see Vogt, 2005]. This region is consistently activated when pain is felt [Singer et al., 2004] and is also involved in a sense of urgency [Griffiths and Fowler, 2010]. The region has diverse roles including cognitive control and reinforcement of learning signals, but the underlying single principle of the role of this region may be negative surprise [Egner, 2011]. The areas around dACG, such as the dorsomedial prefrontal cortex and supplementary motor area, are activated during Stroop task performance, and increased rGMV is associated with a superior ability to resolve Stroop interference in individuals with the same characteristics as those in this study [Takeuchi et al., 2012b]. Thus, decreased rGMV in this region among subjects with higher QOLMQ may be associated with lower functioning of this area and reduced processing of fear and anger. The lower functioning may in turn be associated with the traits of experiencing less negative emotions and may lead to higher QOLMQ or satisfaction with life. One tempting speculation arising from this finding of a negative association between QOLMQ and rGMV in dACG is that the higher QOLMQ in young healthy subjects may be associated with lowered essential cognitive functioning.
To support the notion about the (a) association among QOLMQ, (b) reduced processing of negative emotions such as anger, and (c) function of the dACG, we additionally investigated the association between QOLMQ and anger using the Profile of Mood States (POMS) [for details, see Takeuchi et al., 2011a] questionnaire and the same study population (however, POMS data could not be obtained from six subjects and the analysis was performed using data from 149 subjects). The score on the anger‐hostility subscale of POMS was significantly and negatively correlated with the average WHOQOL‐26 score in a multiple regression analysis that accounted for the effects of age, sex, and RAPM score (P = 0.001, t = −3.511, and β = −0.273). Furthermore, when the mean value of the significant voxels of dACG identified in the Results section was put into the multiple regression analysis as a dependent value (instead of the average WHOQOL‐26 score), the score on the anger‐hostility subscale of POMS was significantly and positively correlated with the rGMV value of dACG (P = 0.028, t = 2.217, and β = 0.169). These results support the abovementioned notion.
Next, to support the notion regarding the association between QOLMQ and the reduced function of the dACG related to Stroop interference, we also investigated the association between QOLMQ and the Stroop interference rate using previously reported material [for details, see Takeuchi et al., 2012b] relating to the study population (data were successfully obtained from 154 subjects). The Stroop interference rate (higher value indicates higher interference and lower functioning for resolving the interference) was not significantly correlated with the average WHOQOL‐26 score in a multiple regression analysis that accounted for the effects of age, sex, and RAPM score (P = 0.183, t = 1.339, and β = 0.108). However, when the mean value of the significant voxels of dACG identified in the Results section was put into the multiple regression analysis as a dependent value (instead of the average WHOQOL‐26 score), Stroop interference was significantly correlated with the rGMV value of dACG (P = 0.006, t = −2.776, and β = −0.211). No such association was observed when the mean value of the significant voxels of the left RLPFC identified in the Results section was used in multiple regression analysis instead (P = 0.826, t = −0.221, and β = −0.017). These results appear to suggest that higher Stroop interference and higher QOLMQ may have certain anatomical overlaps, but differences in associations with neural mechanisms in other areas [Takeuchi et al., 2012b] may prevent any strong direct association between higher Stroop interference and higher QOLMQ.
On the other hand, decreased rGMV in the left RLPFC may be associated with increased functioning of self‐related processing, which in turn may lead to higher QOLMQ. RLPFC activity has been observed in 13 of 15 studies involving episodic memory tasks that require evaluation of self‐generated material [Christoff and Gabrieli, 2000], clarifying that evaluation of internally generated information is one of the roles of the RLPFC [for a review, see Christoff and Gabrieli, 2000]. Lesion studies have suggested that a defining function of this area may be meta‐cognitive awareness, or the process of reflecting one's own mental contents [Hoffmann and Bar‐On, 2012; Stuss, 2007; Stuss and Levine, 2002; Wheeler et al., 1997]. Based on these previous findings, RLPFC has been a region of interest for meta‐cognitive processes in a number of studies [Fleming et al., 2012, 2010; McCaig et al., 2011]. The GM structure of this region as well as the related WM structure has consistently been associated with introspective ability [Fleming et al., 2010], and activity and functional connectivity involving this area are associated with meta‐cognitive processes [Fleming et al., 2012; McCaig et al., 2011]. As discussed above regarding the association between GM volume and dACG and cognition, to determine whether a larger or smaller volume of a certain area is associated with certain functions of that area, one must take many factors into consideration including subject characteristics, regions, and types of cognitive factors. In the area of RLPFC, while RLPFC is associated with evaluation of internally generated information as discussed above, decreased regional GM is associated with intrapersonal emotional intelligence [Takeuchi et al., 2011e] in a population sample with the same characteristics as the sample used in this study [Takeuchi et al., 2011e]. Moreover, intrapersonal emotional intelligence is as a whole mildly associated with better mental health [Uchiyama et al., 2001]. Furthermore, the ability to access one's own emotional states is strongly and positively correlated with positive affects [Lipsanen et al., 2004; Lundh and Simonsson‐Sarnecki, 2001]. Considering these findings, extensive lists of studies that have linked this area with positive emotion [for summary, see Yamasue et al., 2008] may be explained by this principle of the function of this area, namely access to one's own emotional states [but there may be multiple functions for this area (including ones more specifically linked to emotion) and we cannot be sure from this study]. Thus, decreased rGMV may be related to increased processing of internally generated information, which can be related to intrapersonal emotional intelligence and may in turn be related to higher QOL and mental health. Partly consistent with this notion, in the present study population, the score for intrapersonal emotional intelligence on the Japanese version of the Emotional Intelligence Scale [Fukunishi et al., 2001; Takeuchi et al., 2011h; Uchiyama et al., 2001] was significantly and positively correlated with the average WHOQOL‐26 score in the multiple regression analysis that accounted for the effects of age, sex, and RAPM score (P < 0.001, t = 4.199, and β = 0.325).
Contrary to the abovementioned notion of a positive correlation between the volume of dACG and negative mood, much clinical evidence suggests a positive association between positive affects and the volume of dACG. Previous clinical studies have consistently associated decreased dACG volume with emphasized or prolonged experience of negative emotions in pathological conditions such as post‐traumatic stress disorder (PTSD) [e.g., Kasai et al., 2008; Woodward et al., 2006; Yamasue et al., 2003]. and a wide range of psychiatric diseases that may well be associated with negative emotions such as schizophrenia [Baiano et al., 2007; Glahn et al., 2008], obsessive compulsive disorder [Rotge et al., 2009], and major depressive disorder [Bora et al., 2012].
On the other hand, evidence from normal subjects has often (though not always) shown the opposite pattern in terms of associations between negative emotion and the volume of dACG, consistent with our study. For example, increased volume of the areas in the anterior cingulate gyrus (ACG) was associated with (a) higher harm avoidance [Pujol et al., 2002], which is a personality associated with vulnerability to PTSD [Richman and Frueh, 1997] and mood disorders [Smith et al., 2005], (b) higher attention to threat, which is a common component of anxiety disorders [Carlson et al., 2011], (c) stronger alexithymia, which is positively correlated with negative mood [Lipsanen et al., 2004; Lundh and Simonsson‐Sarnecki, 2001], and (d) higher anxiety in ultra high‐risk individuals who do not develop psychosis [Fornito et al., 2008] and conduct problems and callous‐unemotional traits in young boys [De Brito et al., 2009].
There are a number of methodological differences among clinical and nonclinical studies introduced in these two paragraphs, including subject characteristics, and because dACG is a wide area, how the regions of interest are defined also varies across studies as do the peaks of results. However, there is controversy regarding whether negative mood or related cognitions are associated with a larger or smaller ACG volume. Our VBM findings relating to RLPFC and their interpretation may also seem odd and incongruent with those of some clinical studies. For example, meta‐analysis showed that GM in RLPFC is decreased in patients with chronic schizophrenia [Chan et al., 2011; Yamasue et al., 2004]. On the other hand, it is known that the average WHOQOL‐26 score is also reduced in patients with schizophrenia [Tazaki and Nakane, 2007].
However, more and more studies of normal subjects have shown that in terms of the association between GM structure and function, the principle of “the larger the better” does not necessarily hold true. A number of studies have already shown an association between apparently better cognitive functions, especially self‐social‐related cognitive functions and less rGMV in certain regions of interest in young adults [Banissy et al., 2012; Takeuchi et al., 2011e, 2012a]. A summary of the association and for more examples of the negative associations between the functions and GM structures can be found in the review by Kanai and Rees [ 2011].
To understand these discrepancies and determine whether a larger or smaller volume of a certain area is associated with certain functions of that area in a particular group, many factors must be considered, including subject characteristics, regions, and types of cognitive factors. (a) Age range is one factor that should be considered because most cortical regions show developmental thinning after young adolescence [Sowell et al., 2003]; therefore, after adolescence and until young adulthood, advanced development and better functioning may lead to less rGMV. However, because developmental cortical thinning is not seen in all cortical regions, and trajectories of development‐related rGMV, changes differ depending on the region [Sowell et al., 2003], (b) the region itself is another factor to be considered. In older adults neuronal degeneration due to aging may lead to thinned cortices, and advanced aging and the resulting loss of functioning may also lead to thinned cortices [Taki et al., 2004]. Likewise, in a clinical sample of (c) neurodegenerative diseases, neuronal losses and consequent loss of functions may be associated with less rGMV regardless of the age range. The association between larger/smaller GM volumes and functions may well differ among subjects with (d) different general intellectual properties [Shaw et al., 2006]. (e) Autistic spectrum disorders (ASDs) and related cognitions may be associated with a certain increase in functioning [Baron‐Cohen, 2003], and the lack of synaptic pruning observed in ASDs as well as the resultant reductions in developmental cortical thinning [Hill and Frith, 2003] may be associated with these functions. In certain cases, a decrease in certain cognitive or brain functions may essentially be associated with an increase in other cognitive functions (f) [Takeuchi et al., 2011c].
Therefore, the positivity and negativity of the functions and structures may be different if the samples' characteristics are different. Regarding the young adult sample analyzed in this study, the abovementioned literature and our own data suggest an association between larger dACG volume and stronger negative mood as well as an association between less RLPFC volume and stronger self‐referential ability.
The mechanisms responsible for the discrepancies in the RLPFC are discussed in another study of a clinical population [see Takeuchi et al., 2011e, for detail], (1) the clinical samples' associations between reduced function and less rGMV may be caused by neuronal degeneration, including neuron loss. However, nonclinical young adults' association between greater function and less rGMV may be caused by advanced developmental cortical thinning and thus matured functions in nonclinical young adults. The RLPFC is a typical region, which shows developmental cortical thinning.
Regarding the mechanisms responsible for the discrepancies in the dACG, a previous study [Sowell et al., 2003] indicated that the developmental trajectory of GM in parts of the ACG (limbic and dorsal parts) is very different from that in the more anterior parts of the ACG, the medial prefrontal cortex, and RLPFC. It also appears that in this area of the ACG, development has little effect on cortical thinning among young adults. When there is no strong effect of development on cortical thinning, other factors may be more important for determining the function–structure relationship.
We suggest a few possibilities of the reasons why reduced ACG volume is often associated with positive effects in normal sample, but with negative effects in clinical samples. One is that there may be certain nonlinear relationships (inverted U relationships) between cognitive factors linked to negative emotions and the volume of the ACG. It is well known that arousal and anxiety have this type of nonlinear (inverted‐U shape) relationship with cognitive factors and cerebral blood flow [Gur et al., 1987]. Stress levels and some body functions are known to have similar inverted U‐shape relationships [Diamond et al., 2004]. Maybe these types of nonlinear relationships also exist in association with anterior cingulate volume. The other possibility is that the dACG may not be associated with mood itself. Even when negative mood exists, when it is effectively dealt with or denied or repaired, it may not cause a decrease in the volume of dACG, and a process against negative effects may itself underlie the larger volume of dACG [Giuliani et al., 2011]. One study of normal subjects showed that the volume of dACG is positively correlated with cognitive appraisal (the effortful reinterpretation of an emotion‐eliciting situation in a manner that changes its emotional impact), which is related to positive mood, and the ability to repair emotional damage [Giuliani et al., 2011; Koven et al., 2011]. However, these are all speculations based on other studies and confirmation of these speculations is dependent on further research.
This study has a few limitations. First, we used highly educated young and healthy subjects. Limited sampling of the full range of intellectual abilities is a common hazard when sampling from college cohorts. However, given the correlation between intelligence in the young and QOLMQ in later life [Bain et al., 2003], we would not like to focus on the simple given association like higher intelligence lead to better environment which in turn may lead to higher QOLMQ. Thus, focusing on highly intelligent subjects (or subjects with higher education) was certainly warranted for the purpose of this study. Furthermore, it should be noted that this study involved subjects from developed countries, and even when subjects are well educated and intelligent, QOL of subjects surrounded by severe environments may well be very different. Finally, whether the correlations between QOLMQ and rGMV are positive or negative may depend on the subjects. This is because among certain clinical populations, neuronal degeneration, including neuron loss [Baron et al., 2001; Thieben et al., 2002], leads to dysfunction of the damaged area and reduced rGMV signal intensity in segmented GM images. Moreover, in aged populations, reduced rGMV may reflect aging of the brain area [Taki et al., 2004], which in turn can lead to aging‐related changes in functioning. On the other hand, among nonclinical populations of young adults, adaptive development is underlain by increased synaptic pruning, which leads to better functioning in areas such as the ventromedial prefrontal cortex, at least in certain cases, and reduced rGMV signal intensity in segmented GM images.
This is the first study to investigate the association between regional GM structures and QOLMQ in young healthy subjects. Health‐related problems cause lower QOLMQ, but our study showed that in nonclinical young and healthy subjects, structural variations in dACG and the left RLPFC underlie higher QOLMQ. Our findings from imaging analyses and consequent psychological studies may indicate that reduced processing of negative emotions such as fear and anger as well as efficient access to one's inner state may contribute to higher QOLMQ in young healthy subjects (it should be noted that our subjects were surrounded by a rich environment, i.e., all were highly educated and lived in developed countries). Our findings provide new insight into the mental well‐being of healthy subjects.
One such particular new insight is that higher QOLMQ, which we desired may be achieved by compromised essential cognitive functions (related to those of dACG). Another such insight is that cognitive interventions to alter the functions of the RLPFC, such as neurofeedback training relating to RFPFC activity to increase insight into one's condition [McCaig et al., 2011], may lead to higher QOL. Also, meditation's experience is known to be associated with higher introspective abilities [Fox et al., 2012], and so meditation, particularly when one's focus is turned inward, may lead to improved QOL. Writing about anxiety is also known to reduce anxiety [Ramirez and Beilock, 2011]. Whether frequent access to one's mental state by keeping a diary or by other method (and thus frequent use of the RLPFC) can increase QOL in a similar manner and is an interesting subject area for future study that has been identified by the findings of this study. Future studies need to investigate these issues further.
ACKNOWLEDGMENTS
The authors thank Yuki Yamada for operating the MRI scanner, the study participants, and all other colleagues at IDAC, Tohoku University for their support. This study was supported by JST/RISTEX, JST/CREST, and a Grant‐in‐Aid for Young Scientists (B) (KAKENHI23700306) from the Ministry of Education, Culture, Sports, Science, and Technology. The authors would like to thank Enago (http://www.enago.jp) for the English language review.
REFERENCES
- Ashburner J, Friston KJ (2000): Voxel‐based morphometry—The methods. Neuroimage 11: 805–821. [DOI] [PubMed] [Google Scholar]
- Baiano M, David A, Versace A, Churchill R, Balestrieri M, Brambilla P (2007): Anterior cingulate volumes in schizophrenia: A systematic review and a meta‐analysis of MRI studies. Schizophr Res 93: 1–12. [DOI] [PubMed] [Google Scholar]
- Bain GH, Lemmon H, Teunisse S, Starr JM, Fox HC, Deary IJ, Whalley LJ (2003): Quality of life in healthy old age: Relationships with childhood IQ, minor psychological symptoms and optimism. Soc Psychiatry Psychiatr Epidemiol 38: 632–636. [DOI] [PubMed] [Google Scholar]
- Banissy MJ, Kanai R, Walsh V, Rees G (2012): Inter‐individual differences in empathy are reflected in human brain structure. Neuroimage 62: 2034–2039. [DOI] [PMC free article] [PubMed] [Google Scholar]
- Baron‐Cohen S (2003): The Essential Difference: The Truth About the Male and Female Brain.Perseus Books Group,New York. [Google Scholar]
- Baron JC, Chetelat G, Desgranges B, Perchey G, Landeau B, De La Sayette V, Eustache F (2001): In vivo mapping of gray matter loss with voxel‐based morphometry in mild Alzheimer's disease. Neuroimage 14: 298–309. [DOI] [PubMed] [Google Scholar]
- Bora E, Fornito A, Pantelis C, Yücel M (2012): Gray matter abnormalities in major depressive disorder: A meta‐analysis of voxel based morphometry studies. J Affect Disord 138: 9–18 [DOI] [PubMed] [Google Scholar]
- Carlson JM, Beacher F, Reinke KS, Habib R, Harmon‐Jones E, Mujica‐Parodi LR, Hajcak G (2011): Nonconscious attention bias to threat is correlated with anterior cingulate cortex gray matter volume: A voxel‐based morphometry result and replication. Neuroimage 59: 1713–1718. [DOI] [PubMed] [Google Scholar]
- Chan RCK, Di X, McAlonan GM, Gong Q (2011): Brain anatomical abnormalities in high‐risk individuals, first‐episode, and chronic schizophrenia: An activation likelihood estimation meta‐analysis of illness progression. Schizophr Bull 37: 177–188. [DOI] [PMC free article] [PubMed] [Google Scholar]
- Christoff K, Gabrieli JDE (2000): The frontopolar cortex and human cognition: Evidence for a rostrocaudal hierarchical organization within the human prefrontal cortex. Psychobiology 28: 168–186. [Google Scholar]
- Colom R, Jung RE, Haier RJ (2006): Distributed brain sites for the g‐factor of intelligence. Neuroimage 31: 1359–1365. [DOI] [PubMed] [Google Scholar]
- Colom R, Jung RE, Haier RJ (2007): General intelligence and memory span: Evidence for a common neuroanatomic framework. Cogn Neuropsychol 24: 867–878. [DOI] [PubMed] [Google Scholar]
- De Brito SA, Mechelli A, Wilke M, Laurens KR, Jones AP, Barker GJ, Hodgins S, Viding E (2009): Size matters: Increased grey matter in boys with conduct problems and callous–unemotional traits. Brain 132: 843–852. [DOI] [PubMed] [Google Scholar]
- Diamond DM, Bennett MC, Fleshner M, Rose GM (2004): Inverted U relationship between the level of peripheral corticosterone and the magnitude of hippocampal primed burst potentiation. Hippocampus 2: 421–430. [DOI] [PubMed] [Google Scholar]
- Draganski B, Gaser C, Busch V, Schuierer G, Bogdahn U, May A (2004): Neuroplasticity: Changes in grey matter induced by training. Nature 427: 311–312. [DOI] [PubMed] [Google Scholar]
- Egner T (2011): Surprise! A unifying model of dorsal anterior cingulate function? Nat Neurosci 14: 1219–1220. [DOI] [PubMed] [Google Scholar]
- Extremera N, Fernandez‐Berrocal P (2002): Relation of perceived emotional intelligence and health‐related quality of life of middle‐aged women. Psychol Rep 91: 47–59. [DOI] [PubMed] [Google Scholar]
- Fayers PM, Machin D (2007): Quality of life: The assessment, analysis and interpretation of patient‐reported outcomes. Chichester:Wiley. [Google Scholar]
- Finlay A (1997): Quality of life measurement in dermatology: A practical guide. Br J Dermatol 136: 305–314. [PubMed] [Google Scholar]
- Fleming SM, Huijgen J, Dolan RJ (2012): Prefrontal contributions to metacognition in perceptual decision making. J Neurosci 32: 6117–6125. [DOI] [PMC free article] [PubMed] [Google Scholar]
- Fleming SM, Weil RS, Nagy Z, Dolan RJ, Rees G (2010): Relating introspective accuracy to individual differences in brain structure. Science 329: 1541–1543. [DOI] [PMC free article] [PubMed] [Google Scholar]
- Fornito A, Yung AR, Wood SJ, Phillips LJ, Nelson B, Cotton S, Velakoulis D, McGorry PD, Pantelis C, Yücel M (2008): Anatomic abnormalities of the anterior cingulate cortex before psychosis onset: An MRI study of ultra‐high‐risk individuals. Biol Psychiatry 64: 758–765. [DOI] [PubMed] [Google Scholar]
- Fox KCR, Zakarauskas P, Dixon M, Ellamil M, Thompson E, Christoff K (2012): Meditation experience predicts introspective accuracy. PLoS One 7: e45370. [DOI] [PMC free article] [PubMed] [Google Scholar]
- Fukunishi I, Wise TN, Sheridan M, Shimai S, Otake K, Utsuki N, Uchiyama K (2001): Validity and reliability of the Japanese version of the Emotional Intelligence Scale among college students and psychiatric outpatients. Psychol Rep 89: 625–632. [DOI] [PubMed] [Google Scholar]
- Giuliani NR, Drabant EM, Gross JJ (2011): Anterior cingulate cortex volume and emotion regulation: Is bigger better? Biol Psychol 86: 379–382. [DOI] [PMC free article] [PubMed] [Google Scholar]
- Glahn DC, Laird AR, Ellison‐Wright I, Thelen SM, Robinson JL, Lancaster JL, Bullmore E, Fox PT (2008): Meta‐analysis of gray matter anomalies in schizophrenia: Application of anatomic likelihood estimation and network analysis. Biol Psychiatry 64: 774–781. [DOI] [PMC free article] [PubMed] [Google Scholar]
- Good CD, Johnsrude IS, Ashburner J, Henson RNA, Friston KJ, Frackowiak RSJ (2001): A voxel‐based morphometric study of ageing in 465 normal adult human brains. Neuroimage 14: 21–36. [DOI] [PubMed] [Google Scholar]
- Griffiths D, Fowler CJ (2010): Brain imaging in Fowler's syndrome. Curr Bladder Dysfunct Rep 5: 114–118. [Google Scholar]
- Gur RC, Gur RE, Resnick SM, Skolnick BE, Alavi A, Reivich M (1987): The effect of anxiety on cortical cerebral blood flow and metabolism. J Cereb Blood Flow Metab 7: 173–177. [DOI] [PubMed] [Google Scholar]
- Haier RJ, Jung RE, Yeo RA, Head K, Alkire MT (2004): Structural brain variation and general intelligence. Neuroimage 23: 425–433. [DOI] [PubMed] [Google Scholar]
- Haier RJ, Jung RE, Yeo RA, Head K, Alkire MT (2005): The neuroanatomy of general intelligence: Sex matters. Neuroimage 25: 320–327. [DOI] [PubMed] [Google Scholar]
- Heausler NL, Thompson B (1988): Structure of the torrance tests of creative thinking. Educ Psychol Meas 48: 463–468. [Google Scholar]
- Hill EL, Frith U (2003): Understanding autism: Insights from mind and brain. Philos Trans B 358: 281–289. [DOI] [PMC free article] [PubMed] [Google Scholar]
- Hoffmann M, Bar‐On R (2012): Isolated frontopolar cortex lesion: A case study. Cogn Behav Neurol 25: 50–56. [DOI] [PubMed] [Google Scholar]
- Ilg R, Wohlschlager AM, Gaser C, Liebau Y, Dauner R, Woller A, Zimmer C, Zihl J, Muhlau M (2008): Gray matter increase induced by practice correlates with task‐specific activation: A combined functional and morphometric magnetic resonance imaging study. J Neurosci 28: 4210–4215. [DOI] [PMC free article] [PubMed] [Google Scholar]
- Janardhan V, Bakshi R (2000): Quality of life and its relationship to brain lesions and atrophy on magnetic resonance images in 60 patients with multiple sclerosis. Arch Neurol 57: 1485–1491. [DOI] [PubMed] [Google Scholar]
- Jung RE, Haier RJ (2007): The parieto‐frontal integration theory (P‐FIT) of intelligence: Converging neuroimaging evidence. Behav Brain Sci 30: 135–154. [DOI] [PubMed] [Google Scholar]
- Kanai R, Rees G (2011): The structural basis of inter‐individual differences in human behaviour and cognition. Nat Rev Neurosci 12: 231–242. [DOI] [PubMed] [Google Scholar]
- Kasai K, Yamasue H, Gilbertson MW, Shenton ME, Rauch SL, Pitman RK (2008): Evidence for acquired pregenual anterior cingulate gray matter loss from a twin study of combat‐related posttraumatic stress disorder. Biol Psychiatry 63: 550–556. [DOI] [PMC free article] [PubMed] [Google Scholar]
- Koven NS, Roth RM, Garlinghouse MA, Flashman LA, Saykin AJ (2011): Regional gray matter correlates of perceived emotional intelligence. Soc Cogn Affect Neurosci 6: 582–590. [DOI] [PMC free article] [PubMed] [Google Scholar]
- Lipsanen T, Saarijärvi S, Lauerma H (2004): Exploring the relations between depression, somatization, dissociation and alexithymia–Overlapping or independent constructs? Psychopathology 37: 200–206. [DOI] [PubMed] [Google Scholar]
- Lundh LG, Simonsson‐Sarnecki M (2001): Alexithymia, emotion, and somatic complaints. J Pers 69: 483–510. [DOI] [PubMed] [Google Scholar]
- May A, Gaser C (2006): Magnetic resonance‐based morphometry: A window into structural plasticity of the brain. Curr Opin Neurol 19: 407–411. [DOI] [PubMed] [Google Scholar]
- McCaig RG, Dixon M, Keramatian K, Liu I, Christoff K (2011): Improved modulation of rostrolateral prefrontal cortex using real‐time fMRI training and meta‐cognitive awareness. Neuroimage 55: 1298–1305. [DOI] [PubMed] [Google Scholar]
- Narr KL, Woods RP, Thompson PM, Szeszko P, Robinson D, Dimtcheva T, Gurbani M, Toga AW, Bilder RM (2007): Relationships between IQ and regional cortical gray matter thickness in healthy adults. Cereb Cortex 17: 2163–2171. [DOI] [PubMed] [Google Scholar]
- Okamoto M, Dan H, Shimizu K, Takeo K, Amita T, Oda I, Konishi I, Sakamoto K, Isobe S, Suzuki T (2004): Multimodal assessment of cortical activation during apple peeling by NIRS and fMRI. Neuroimage 21: 1275–1288. [DOI] [PubMed] [Google Scholar]
- Oldfield RC (1971): The assessment and analysis of handedness: The Edinburgh inventory. Neuropsychologia 9: 97–113. [DOI] [PubMed] [Google Scholar]
- Price P, Harding K (1993): Defining quality of life. J Wound Care 2: 304–306. [DOI] [PubMed] [Google Scholar]
- Pujol J, López A, Deus J, Cardoner NI, Vallejo J, Capdevila A, Paus T (2002): Anatomical variability of the anterior cingulate gyrus and basic dimensions of human personality. Neuroimage 15: 847–855. [DOI] [PubMed] [Google Scholar]
- Ramirez G, Beilock SL (2011): Writing about testing worries boosts exam performance in the classroom. Science 331: 211–213. [DOI] [PubMed] [Google Scholar]
- Raven J (1998): Manual for Raven's Progressive Matrices and Vocabulary Scales. Oxford:Oxford Psychologists Press. [Google Scholar]
- Richman H, Frueh BC (1997): Personality and PTSD II: Personality assessment of PTSD‐diagnosed Vietnam veterans using the Cloninger Tridimensional Personality Questionnaire (TPQ). Depress Anxiety 6: 70–77. [DOI] [PubMed] [Google Scholar]
- Rotge JY, Guehl D, Dilharreguy B, Tignol J, Bioulac B, Allard M, Burbaud P, Aouizerate B (2009): Meta‐analysis of brain volume changes in obsessive‐compulsive disorder. Biol Psychiatry 65: 75–83. [DOI] [PubMed] [Google Scholar]
- Shaw P, Greenstein D, Lerch J, Clasen L, Lenroot R, Gogtay N, Evans A, Rapoport J, Giedd J (2006): Intellectual ability and cortical development in children and adolescents. Nature 440: 676–679. [DOI] [PubMed] [Google Scholar]
- Singer T, Seymour B, O'Doherty J, Kaube H, Dolan RJ, Frith CD (2004): Empathy for pain involves the affective but not sensory components of pain. Science 303: 1157–1162. [DOI] [PubMed] [Google Scholar]
- Smith DJ, Duffy L, Stewart ME, Muir WJ, Blackwood DHR (2005): High harm avoidance and low self‐directedness in euthymic young adults with recurrent, early‐onset depression. J Affect Disord 87: 83–89. [DOI] [PubMed] [Google Scholar]
- Sowell ER, Peterson BS, Thompson PM, Welcome SE, Henkenius AL, Toga AW (2003): Mapping cortical change across the human life span. Nat Neurosci 6: 309–315. [DOI] [PubMed] [Google Scholar]
- Stuss DT (2007): New approaches to prefrontal lobe testing In: Miller BL, Cummings JL, editors.The Human Frontal Lobes: Functions and Disorders, 2nd ed. New York:Guilford Publications; pp292–305. [Google Scholar]
- Stuss DT, Levine B (2002): Adult clinical neuropsychology: Lessons from studies of the frontal lobes. Annu Rev Psychol 53: 401–433. [DOI] [PubMed] [Google Scholar]
- Takeuchi H, Taki Y, Hashizume H, Sassa Y, Nagase T, Nouchi R, Kawashima R (2011a): Cerebral blood flow during rest associates with general intelligence and creativity. PLoS One 6: e25532. [DOI] [PMC free article] [PubMed] [Google Scholar]
- Takeuchi H, Taki Y, Hashizume H, Sassa Y, Nagase T, Nouchi R, Kawashima R (2011b): Effects of training of processing speed on neural systems. J Neurosci 31: 12139–12148. [DOI] [PMC free article] [PubMed] [Google Scholar]
- Takeuchi H, Taki Y, Hashizume H, Sassa Y, Nagase T, Nouchi R, Kawashima R (2011c): Failing to deactivate: The association between brain activity during a working memory task and creativity. Neuroimage 55: 681–687. [DOI] [PubMed] [Google Scholar]
- Takeuchi H, Taki Y, Hashizume H, Sassa Y, Nagase T, Nouchi R, Kawashima R (2011d): Failing to deactivate: The association between brain activity during a working memory task and creativity. Neuroimage 55: 681–687. [DOI] [PubMed] [Google Scholar]
- Takeuchi H, Taki Y, Sassa Y, Hashizume H, Sekiguchi A, Fukushima A, Kawashima R (2010a): Regional gray matter volume of dopaminergic system associate with creativity: Evidence from voxel‐based morphometry. Neuroimage 51: 578–585. [DOI] [PubMed] [Google Scholar]
- Takeuchi H, Taki Y, Sassa Y, Hashizume H, Sekiguchi A, Fukushima A, Kawashima R (2010b): White matter structures associated with creativity: Evidence from diffusion tensor imaging. Neuroimage 51: 11–18. [DOI] [PubMed] [Google Scholar]
- Takeuchi H, Taki Y, Sassa Y, Hashizume H, Sekiguchi A, Fukushima A, Kawashima R (2011e): Regional gray matter density associated with emotional intelligence: Evidence from voxel‐based morphometry. Hum Brain Mapp 32: 1497–1510. [DOI] [PMC free article] [PubMed] [Google Scholar]
- Takeuchi H, Taki Y, Sassa Y, Hashizume H, Sekiguchi A, Fukushima A, Kawashima R (2011f): Verbal working memory performance correlates with regional white matter structures in the fronto‐parietal regions. Neuropsychologia 49: 3466–3473. [DOI] [PubMed] [Google Scholar]
- Takeuchi H, Taki Y, Sassa Y, Hashizume H, Sekiguchi A, Fukushima A, Kawashima R (2011g): Working memory training using mental calculation impacts regional gray matter of the frontal and parietal regions. PLoS One 6: e23175. [DOI] [PMC free article] [PubMed] [Google Scholar]
- Takeuchi H, Taki Y, Sassa Y, Hashizume H, Sekiguchi A, Fukushima A, Kawashima R (2012a): Brain structures associated with executive functions during everyday events in a non‐clinical sample. Brain Struct Funct DOI s00429‐012‐0444‐z, 2012 Aug 1. [Epub ahead of print]./s00429‐012‐0444‐z, 2012 Aug 1. [Epub ahead of print]. [DOI] [PMC free article] [PubMed] [Google Scholar]
- Takeuchi H, Taki Y, Sassa Y, Hashizume H, Sekiguchi A, Nagase T, Nouchi R, Fukushima A, Kawashima R (2011h): White matter structures associated with emotional intelligence: Evidence from diffusion tensor imaging. Hum Brain Mapp 3 DEC 2011, DOI: 10.1002/hbm.21492. [DOI] [PMC free article] [PubMed] [Google Scholar]
- Takeuchi H, Taki Y, Sassa Y, Hashizume H, Sekiguchi A, Nagase T, Nouchi R, Fukushima A, Kawashima R (2012b): Regional gray and white matter volume associated with Stroop interference: Evidence from voxel‐based morphometry. Neuroimage 59: 2899–2907. [DOI] [PubMed] [Google Scholar]
- Taki Y, Goto R, Evans A, Zijdenbos A, Neelin P, Lerch J, Sato K, Ono S, Kinomura S, Nakagawa M (2004): Voxel‐based morphometry of human brain with age and cerebrovascular risk factors. Neurobiol Aging 25: 455–463. [DOI] [PubMed] [Google Scholar]
- Taki Y, Hashizume H, Sassa Y, Takeuchi H, Asano M, Asano K, Kawashima R (2010): Breakfast staple types affect brain gray matter volume and cognitive function in healthy children. PloS One 5: e15213. [DOI] [PMC free article] [PubMed] [Google Scholar]
- Taki Y, Hashizume H, Sassa Y, Takeuchi H, Asano M, Asano K, Kotozaki Y, Nouchi R, Wu K, Fukuda H (2011): Correlation among body height, intelligence, and brain gray matter volume in healthy children. Neuroimage 59: 1023–1027. [DOI] [PubMed] [Google Scholar]
- Taki Y, Hashizume H, Thyreau B, Sassa Y, Takeuchi H, Wu K, Kotozaki Y, Nouchi R, Asano M, Asano K, et al.: Linear and curvilinear correlations of brain gray matter volume and density with age using voxel‐based morphometry with the Akaike information criterion in 291 healthy children. Hum Brain Mapp,2012. Apr 16. doi: 10.1002/hbm.22033. [Epub ahead of print]. [DOI] [PMC free article] [PubMed] [Google Scholar]
- Tazaki M, Nakane M (2007): Revised Manual of WHO QOL 26. Tokyo:Kaneko‐Syobou. [Google Scholar]
- The_WHOQOL_Group (1995): The World Health Organization quality of life assessment (WHOQOL): Position paper from the World Health Organization. Soc Sci Med 41: 1403–1409. [DOI] [PubMed] [Google Scholar]
- Thieben MJ, Duggins AJ, Good CD, Gomes L, Mahant N, Richards F, McCusker E, Frackowiak RSJ (2002): The distribution of structural neuropathology in pre‐clinical Huntington's disease. Brain 125: 1815–1828. [DOI] [PubMed] [Google Scholar]
- Toga AW, Thompson PM (2005): Genetics of brain structure and intelligence. Annu Rev Neurosci 28: 1–23. [DOI] [PubMed] [Google Scholar]
- Treffinger DJ (1985): Review of the torrance tests of creative thinking In: Mitchell VJ, editor.The Ninth Mental Measurements Yearbook. Lincoln:Buros Institute of Mental Measurements, University of Nebraska; pp1632–1634. [Google Scholar]
- Uchiyama K, Shimai T, Utsuki N, Otake K (2001): EQS Manual. Tokyo:Jitsumukyoiku Syuppan (Practical Education Press). [Google Scholar]
- Vogt BA (2005): Pain and emotion interactions in subregions of the cingulate gyrus. Nat Rev Neurosci 6: 533–544. [DOI] [PMC free article] [PubMed] [Google Scholar]
- Watten RG, Syversen JL, Myhrer T (1995): Quality of life, intelligence and mood. Soc Indicator Res 36: 287–299. [Google Scholar]
- Wheeler MA, Stuss DT, Tulving E (1997): Toward a theory of episodic memory: The frontal lobes and autonoetic consciousness. Psychol Bull 121: 331–354. [DOI] [PubMed] [Google Scholar]
- Woodward SH, Kaloupek DG, Streeter CC, Martinez C, Schaer M, Eliez S (2006): Decreased anterior cingulate volume in combat‐related PTSD. Biol Psychiatry 59: 582–587. [DOI] [PubMed] [Google Scholar]
- Yamasue H, Abe O, Suga M, Yamada H, Inoue H, Tochigi M, Rogers M, Aoki S, Kato N, Kasai K (2008): Gender‐common and‐specific neuroanatomical basis of human anxiety‐related personality traits. Cereb Cortex 18: 46–52. [DOI] [PubMed] [Google Scholar]
- Yamasue H, Iwanami A, Hirayasu Y, Yamada H, Abe O, Kuroki N, Fukuda R, Tsujii K, Aoki S, Ohtomo K (2004): Localized volume reduction in prefrontal, temporolimbic, and paralimbic regions in schizophrenia: An MRI parcellation study. Psychiatry Res 131: 195–207. [DOI] [PubMed] [Google Scholar]
- Yamasue H, Kasai K, Iwanami A, Ohtani T, Yamada H, Abe O, Kuroki N, Fukuda R, Tochigi M, Furukawa S (2003): Voxel‐based analysis of MRI reveals anterior cingulate gray‐matter volume reduction in posttraumatic stress disorder due to terrorism. Proc Natl Acad Sci USA 100: 9039–9043. [DOI] [PMC free article] [PubMed] [Google Scholar]