

Abstract
Objective. To identify overlapping and unique grey (GM) and white matter (WM) signatures within the frontotemporal lobar degeneration (FTLD) continuum, and discriminate likely FTLD‐TAU and FTLD‐TDP patients using structural and diffusion tensor (DT) magnetic resonance imaging (MRI). Methods. T1‐weighted and DT MRI were collected from 121 subjects: 35 motor neuron disease (MND), 14 behavioral variant of frontotemporal dementia, 12 semantic and 11 nonfluent primary progressive aphasia, 21 progressive supranuclear palsy syndrome patients, and 28 healthy controls. Patterns of GM atrophy were established using voxel‐based morphometry. Tract‐based spatial statistics was used to perform a WM voxelwise analysis of mean diffusivity and fractional anisotropy. Results. In all clinical FTLD phenotypes, the pattern of WM damage was more distributed than that of GM atrophy. All patient groups, with the exception of MND cases with a pure motor syndrome, shared a focal GM atrophy centered around the dorsolateral and medial frontal cortex and a largely overlapping pattern of WM damage involving the genu and body of the corpus callosum and ventral frontotemporal and dorsal frontoparietal WM pathways. Surrounding this common area, phenotype (symptom)‐specific GM and WM regions of damage were found in each group. Conclusions. In the FTLD spectrum, WM disruption is more severe than GM damage. Frontal cortex and WM pathways represent the common target of neurodegeneration in these conditions. The topographic pattern of damage supports a “prion‐like” protein propagation through WM connections as underlying mechanism of the stereotyped progression of FTLD. Hum Brain Mapp 36:2602–2614, 2015. © 2015 Wiley Periodicals, Inc.
Keywords: frontotemporal lobar degeneration, frontotemporal dementia, amyotrophic lateral sclerosis, motor neuron disease, primary progressive aphasia, progressive supranuclear palsy, white matter, diffusion tensor MRI
INTRODUCTION
Frontotemporal lobar degeneration (FTLD) pathology may present as one of three clinical frontotemporal dementia (FTD) syndromes (Irwin et al., in press): a behavioral–dysexecutive disorder (behavioral variant FTD, bvFTD), the most frequent phenotype; a language disorder including nonfluent/agrammatic (nfvPPA) and semantic (svPPA) primary progressive aphasia (PPA) variants; or a motor disorder such as motor neuron disease (MND), corticobasal syndrome (CBS), and progressive supranuclear palsy syndrome (PSPs).
A consistent pathological feature across the FTLD continuum is the accumulation of certain neuronal proteins. Approximately half of the FTLD patients have hyperphosphorylated tau inclusions (FTLD‐TAU), whereas most of the remainder have an accumulation of TDP‐43 (FTLD‐TDP) (Rohrer et al., 2011). TDP‐43 is also the principal protein inclusion in MND (Neumann et al., 2006). The various types of inclusions share the capability to aggregate and propagate in a “prion‐like” manner (Soto, 2012). The phenotypic variations within the spectrum may be explained not only by the existence of distinct protein strains, but also by the propagation of misfolded proteins from a region of focal onset to nonadjacent regions along discrete brain networks (Brettschneider et al., 2013, 2014; Clavaguera et al., 2013).
Our understanding of brain networks' alterations across the FTLD spectrum has been fruitfully expanded in the past few years through the use of MRI. There is a broad correspondence between canonical FTLD clinical syndromes and profiles of grey matter (GM) atrophy (Agosta et al., 2011; Chiò et al., 2014). More recently, diffusion tensor (DT) MRI has been used to interrogate the white matter (WM) tract abnormalities in these patients, suggesting a relative specificity in distinguishing these conditions (Agosta et al., 2011; Chiò et al., 2014). Despite the clinical, genetic, and pathological overlap, patterns of brain damage across the whole continuum are still largely unexplored. Very few studies have directly compared brain involvement in patients with bvFTD relative to MND (Lillo et al., 2012) or CBS (Tovar‐Moll et al., 2014).
The aims of this study were: to characterize GM atrophy and WM damage in the clinical syndromes within the FTLD continuum to identify an overlapping pattern of damage regardless the clinical phenotype as well as unique GM and WM signatures for each variant; and to investigate the ability of structural and DT MRI in discriminating in vivo FTLD‐TAU and FTLD‐TDP cases. To this latter purpose, patients with clinical diagnoses of pure‐motor MND (MND‐pm), MND with cognitive and/or behavioral impairment (MND‐plus), and svPPA, which are likely to have FTLD‐TDP, were contrasted to patients with clinical diagnoses of nfvPPA and PSPs, which are likely to harbor FTLD‐TAU pathology (Rohrer et al., 2011).
METHODS
Subjects
Native Italian‐speaking patients were consecutively recruited. MND, bvFTD, svPPA, nfvPPA, and PSPs diagnoses were made in accordance with international criteria (Brooks et al., 2000; Gorno‐Tempini et al., 2011; Litvan et al., 1996; Pringle et al., 1992; Rascovsky et al., 2011). Patients received a comprehensive evaluation including neurological history and examination, and neuropsychological testing. Assessments were performed by experienced evaluators blinded to MRI. Cerebrospinal fluid (CSF) samples were obtained from PPA patients, and amyloid β1–42 (Aβ1–42), total Tau and phosphorylated Tau were determined. Native Italian‐speaking healthy controls were recruited among spouses of patients and by word of mouth. Subjects were excluded if they had: family history of neurodegenerative diseases; significant medical illnesses or substance abuse that could interfere with cognition; major systemic, psychiatric or other neurological illnesses; focal or diffuse brain damage, including cerebrovascular diseases on MRI.
A total of 121 subjects were recruited: 35 MND, 14 bvFTD, 12 svPPA, 11 nfvPPA, 21 PSPs patients, and 28 controls (Table 1). The MND group included 26 amyotrophic lateral sclerosis (ALS) and nine primary lateral sclerosis (PLS) cases. No PPA patient had AD‐like CSF biomarkers.
Table 1.
Demographic and clinical findings in FTLD patient groups and healthy controls
| MND‐pm | MND‐plus | bvFTD | svPPA | nfvPPA | PSPs | HC | P | |
|---|---|---|---|---|---|---|---|---|
| Age at MRI (years) | 58.9 ± 10.9 (35–77) | 64.1 ± 8.5 (44–76) | 61.6 ± 8.2 (46–75) | 65.5 ± 8.5 (51–82)* | 68.1 ± 6.0 (59–80)*× | 69.5 ± 7.5 (52–85)°*× | 64.1 ± 5.6 (58–75)* | 0.01 |
| Gender (women/men) | 10/11 | 6/8 | 5/9 | 7/5 | 7/4 | 9/12 | 18/10 | 0.51 |
| Education (years) | 11.1 ± 3.7 (3–17)° | 9.6 ± 4.2 (4–18)° | 10.8 ± 5.1 (3–18)° | 11.0 ± 5.5 (3–18)° | 10.0 ± 6.2 (5–22)° | 8.9 ± 4.1 (5–17)° | 14.4 ± 4.7 (5–24) | 0.02 |
| Age at onset (years) | 57.7 ± 11.8 (32–77) | 62.9 ± 8.7 (42–77) | 58.7 ± 7.2 (44–69) | 63.2 ± 8.9 (50–81) | 66.4 ± 5.9 (58–79)*× | 67.2 ± 8.1 (50–81)*× | – | 0.02 |
| Disease duration (months) | 27.0 ± 23.8 (6–97) | 26.0 ± 22.5 (3–70) | 38.4 ± 26.0 (8–97) | 44.0 ± 18.5 (23–84) | 36.1 ± 17.6 (15–70) | 47.4 ± 33.1 (3–166)*# | – | 0.02 |
| CDR‐SB | – | – | 4.5 ± 2.6 (2–9)^ | 2.4 ± 2.3 (0.5–8) | 2.6 ± 1.0 (1.5–4) | – | – | 0.06 |
| UPDRS III | – | – | – | – | – | 60.6 ± 24.9 (0–92) | – | – |
| ALSFRS‐R | 37.9 ± 5.7 (23–46) | 34.0 ± 9.1 (22–45) | – | – | – | – | – | – |
| Disease progression rate | 0.6 ± 0.6 (0.1–2.5) | 0.8 ± 0.7 (0.1–3.0) | – | – | – | – | – | – |
| UMN score | 11.0 ± 3.7 (1–14) | 9.9 ± 5.9 (1–16) | – | – | – | – | – | – |
| WMH load (mm3) | 0.8 ± 1.0 (0.0–3.4) | 1.3 ± 1.2 (0–3.2) | 1.2 ± 1.4 (0.04–4.2) | 1.4 ± 1.5 (0.1–4.3) | 1.9 ± 1.5 (0.3–4.9)°* | 1.2 ± 1.4 (0.0–4.3) | 1.1 ± 1.1 (0.0–4.6) | 0.24 |
Values are means ± standard deviations (range) or number. P values refer to the Kruskal–Wallis or Fisher exact tests among groups as appropriate. Symbols refer to between group comparisons assessed using ANOVA models followed by pairwise comparisons: °P < 0.05 versus HC; *P < 0.05 versus MND‐pm; # P < 0.05 versus MND‐plus; × P < 0.05 versus bvFTD; ^P < 0.05 versus svPPA. Abbreviations: ALSFRS‐R, ALS functional rating scale revised; (Cedarbaum et al., 1999) bvFTD, behavioral variant of FTD; CDR‐SB, clinical dementia rating scale Sum of Boxes; (Morris, 1993) HC, healthy controls; MND, motor neuron disease; MND‐pm, pure‐motor MND; MND‐plus, MND with cognitive/behavioral impairment; nfvPPA, nonfluent variant of primary progressive aphasia; PSPs, progressive supranuclear palsy syndrome; svPPA, semantic variant of primary progressive aphasia; UPDRS III, Unified Parkinson's disease rating scale III; (Goetz et al., 2008) UMN score, upper motor neuron score;(Turner et al., 2004) WMH = white matter hyperintensity.
Approval was received from the local ethical standards committee on human experimentation and written informed consent was obtained from all subjects participating in the study or their caregivers.
Cognitive Assessment
Neuropsychological assessment was performed by an experienced neuropsychologist blinded to the MRI results. Scores on neuropsychological tests were age‐, sex‐, and education‐corrected using related normative values, whenever available. The appendix reports the list of neuropsychological tests obtained in each patient group. To be defined MND‐plus, an MND patient had to have a concomitant bvFTD according to Rascovsky's criteria (Rascovsky et al., 2011), or cognitive impairment or behavioral impairment according to Strong's criteria (Strong et al., 2009). For each patient, an executive‐attentive score was computed by transforming raw scores of related cognitive test into Z scores (i.e., by calculating the difference between each subject score and the normative average score, which was then divided by the normative standard deviation of the score). Cognitive tests averaged to obtain the executive‐attentive Z score were: the attentive matrices test, digit span backward, Wisconsin Card Sorting Test (WCST) (global score), Raven's colored progressive matrices, Cognitive Estimation Test (CET), Weigl test, phonemic and semantic fluency tests. In addition, in PPA patients, scores for each language domain were transformed in Z score to obtain the following scores: confrontation naming, object knowledge, single word comprehension, written language, repetition, and comprehension of syntactically complex sentences.
MRI Acquisition
Brain MRI scans were obtained using a 3.0 T scanner (Intera, Philips Medical Systems, Best, The Netherlands). The following sequences were obtained from all subjects: (i) T2‐weighted spin echo [SE] (repetition time [TR] = 3,500 ms, echo time [TE] = 85 ms, echo train length = 15, flip angle = 90°, 22 contiguous 5 mm‐thick axial slices with a matrix size = 512 × 512, field of view [FOV] = 230 × 184 mm2); (ii) fluid‐attenuated inversion recovery [FLAIR] (TR = 11,000 ms, TE = 120 ms, flip angle = 90°, 22 contiguous 5 mm‐thick axial slices with a matrix size = 512 × 512, FOV = 230 × 230 mm2); (iii) three‐dimensional T1‐weighted fast field echo (TR = 25 ms, TE = 4.6 ms, flip angle = 30°, 220 contiguous axial slices with voxel size = 0.89 × 0.89 × 0.8 mm, matrix size = 256 × 256, FOV = 230 × 182 mm2); and (iv) pulsed‐gradient SE echo planar with sensitivity encoding (acceleration factor = 2.5, TR = 8,986 ms, TE = 80 ms, 55 contiguous 2.5 mm‐thick axial slices, number of acquisitions = 2; acquisition matrix 96 × 96, with an in‐plane pixel size of 0.94 × 0.94 mm and a FOV = 240 × 240 mm2) and with diffusion gradients applied in 32 noncollinear directions, using a gradient scheme which is standard on this system (gradient over‐plus) and optimized to reduce echo time as much as possible. The b factor used was 1,000 s/mm2. Fat saturation was performed to avoid chemical shift artifacts. All slices were positioned to run parallel to a line that joins the most infero‐anterior and infero‐posterior parts of the corpus callosum (CC).
MRI Analysis
MRI analysis was performed by an experienced observer, blinded to subjects' identity. WM hyperintensities (WMH), if any, were identified on T2‐weighted and FLAIR scans. WMH load was measured using the Jim software package (Version 5.0, Xinapse Systems, Northants, UK, http://www.xinapse.com).
Voxel‐based morphometry (VBM) was performed using SPM8 and the Diffeomorphic Anatomical Registration Exponentiated Lie Algebra (DARTEL) registration method (Ashburner, 2007), as previously described (Canu et al., 2013). Briefly, (i) T1‐weighted images were segmented (Ashburner and Friston, 2005) to produce GM, WM, and CSF tissue probability maps in the Montreal Neurological Institute (MNI) space; (ii) tissue segmentations were averaged across participants and smoothed with an 8 mm full‐width at half‐maximum (FWHM) Gaussian kernel to create customized prior probability maps; (iii) original T1‐weighted images were segmented a second time using the custom priors to obtain new segmentation and normalization parameters; (iv) T1‐weighted images were rigidly aligned (using the rigid‐body component of the normalization parameters from step [iii]), segmented into GM and WM (using the segmentation parameters from step [iii]) and resampled to 1.5 mm isotropic voxels; (v) GM and WM segments were simultaneously coregistered using DARTEL; (vi) the flow fields were then applied to the rigidly‐aligned segments to warp them to the common DARTEL space and then modulated using the Jacobian determinants. As the DARTEL process warps to a common space that is smaller than the MNI space, we performed an additional transformations as follows: (vii) the modulated images from DARTEL were normalized to the MNI template using an affine transformation estimated from the DARTEL GM template and the a priori GM probability map without resampling (http://brainmap.wisc.edu/normalizeDARTELtoMNI). Prior to the statistical computations, the images were smoothed with an 8 mm FWHM Gaussian filter, which allows to capture differences in small structures such as the deep GM nuclei.
DT MRI analysis was performed using the FMRIB software library (FSL) tools (http://www.fmrib.ox.ac.uk/fsl/fdt/index.html) and the JIM5 software. The diffusion‐weighted data were skull‐stripped using the Brain Extraction Tool implemented in FSL. Using FMRIB's Linear Image Registration Tool, the two diffusion‐weighted scans were coregistered by applying the rigid transformation needed to correct for position between the two b 0 images (T2‐weighted, but not diffusion‐weighted). The rotation component was also applied to diffusion‐weighted directions. Eddy currents correction was performed using the JIM5 software. Then, the two acquisitions were concatenated. The DT was estimated on a voxel‐by‐voxel basis using DTIfit provided by the FMRIB Diffusion Toolbox. Maps of mean diffusivity (MD), fractional anisotropy (FA), as well as axial and radial diffusivity, were obtained.
Tract‐based spatial statistics (TBSS) version 1.2 (http://www.fmrib.ox.ac.uk/fsl/tbss/index.html) was used to perform the multisubject DT MRI analysis (Smith et al., 2006). FA volumes were aligned to a target image using the following procedure: (i) the FA template in standard space (provided by FSL) was selected as the target image, (ii) the nonlinear transformation that mapped each subject's FA to the target image was computed using the FMRIB's Nonlinear Image Registration Tool, and (iii) the same transformation was used to align each subject's FA to the standard space. A mean FA image was then created by averaging the aligned individual FA images, and thinned to create a FA skeleton representing WM tracts common to all subjects (Smith et al., 2006). The FA skeleton was thresholded at a value of 0.2 to exclude voxels with low FA values, which are likely to include GM or CSF. Individual MD and FA data were projected onto this common skeleton.
Statistical Analysis
Analyses of covariance were performed to assess GM volume differences between groups, adjusting for age and total intracranial volume. The statistical threshold was set at P < 0.05 family‐wise error (FWE)‐corrected for multiple comparisons. Results were also tested at P < 0.001 uncorrected.
DT MRI voxelwise statistics were performed to compare FA and MD data between groups using a permutation‐based inference tool for nonparametric statistical thresholding (“randomize,” number of permutation = 5,000), adjusting for age. Statistical maps were thresholded at P < 0.05, FWE‐corrected for multiple comparisons at the cluster level using the threshold‐free cluster enhancement option.
Correlations between executive‐attentive deficits and brain damage were tested using regression models in SPM8 (total intracranial volume and age‐adjusted) and FSL (age‐adjusted) (P < 0.05, FWE‐corrected).
RESULTS
Demographic, Clinical, Neuropsychological, and Behavioral Findings
MND‐pm group included 15 ALS and six PLS patients, while the MND‐plus group included 11 ALS and three PLS cases. MND‐pm patients were younger compared with healthy controls and PPA and PSPs patients, and bvFTD patients were younger relative to nfvPPA and PSPs cases (Table 1). PSPs patients were older also compared with healthy controls (Table 1). All patient groups showed lower years of education compared with healthy controls (Table 1). Disease duration was longer in PSPs patients relative to MND cases (Table 1). NfvPPA patients had a slightly greater WMH load compared with healthy controls and MND‐pm. In all cases, WMHs were aspecific, focal and nonconfluent.
Supporting Information Table e‐1 reports the neuropsychological findings. MND‐plus included six MND‐FTD patients, seven MND‐ci, and one MND‐bi. As expected, MND‐pm patients did not have cognitive deficits, showing only a slightly reduced phonemic fluency score relative to controls. All other patient groups showed executive‐attentive deficits, which were most severe in bvFTD, PSPs, and MND‐plus cases, and least severe in PPA. Subtle deficits in verbal memory were detected in all patients but the MND‐pm group. Visuospatial abilities were relatively spared except in PSPs. PPA patients showed characteristic language impairment. In addition to bvFTD and seven MND‐plus patients, six svPPA, two nfvPPA, and ten PSPs cases reported behavioral abnormalities.
GM: Patients Versus Controls
VBM analysis showed the expected patterns of GM atrophy (Agosta et al., 2011) in bvFTD and PPA patients relative to controls (P < 0.05, FWE; Supporting Information Fig. e‐1). PSPs patients compared with controls showed only small clusters of GM atrophy of the left inferior frontal gyrus and middle cingulum (P < 0.05, FWE; Supporting Information Fig. e‐1). MND‐pm and MND‐plus patients did not show regions of atrophy surviving the correction for multiple comparisons. Findings obtained at P < 0.001 uncorrected are reported in Supporting Information Fig. e‐2 for illustrative purposes. Figure 1 shows that all patient groups, with the exception of MND‐pm, shared a focal GM atrophy relative to healthy controls which includes the dorsolateral and medial frontal cortex and left insula.
Figure 1.
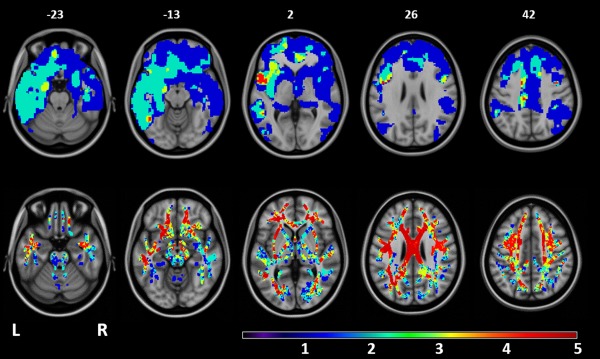
Overlapping patterns of GM atrophy and WM damage among FTLD syndromes (with the exception of MND cases with a pure motor syndrome). Top row: areas of overlapping GM atrophy relative to healthy controls. Bottom row: areas of overlapping decreased FA relative to healthy controls. Patients with behavioral variant of FTD, MND with cognitive and/or behavioral impairment, nonfluent/agrammatic and semantic PPA variants, and PSPs showed significant results relative to healthy controls (see Supporting Information figures). The resulting areas of GM atrophy or FA decrease were overlaid on the axial slices of the T1‐weighetd template in the MNI standard space (numbers are Z coordinates). Color scale indicates the number of patient groups showing GM atrophy or FA decrease relative to healthy controls in each voxel (ranging from 0 to 5 groups). Regions in red are those showing damage in all the clinical phenotypes with the exception of MND cases with a pure motor syndrome.
GM: Between‐Patient Groups (P < 0.05, FWE)
BvFTD showed greater GM atrophy relative to MND‐pm cases involving the frontal lobes, anterior insula and caudate nuclei bilaterally and the left middle temporal gyrus (P < 0.05, FWE; Fig. 2; Supporting Information Fig. e‐3). In addition, bvFTD showed small regions of greater GM atrophy of anterior cingulum and right putamen compared with MND‐plus (P < 0.05, FWE; Supporting Information Fig. e‐3). MND‐plus patients showed only a very small cluster of greater atrophy of the supplementary motor area relative to MND‐pm cases (P < 0.05, FWE; Supporting Information Fig. e‐3). The other between‐patient group comparisons did not show results surviving the correction for multiple comparisons. Findings obtained at P < 0.001 uncorrected are reported in Supporting Information Figure e‐4 for illustrative purposes.
Figure 2.
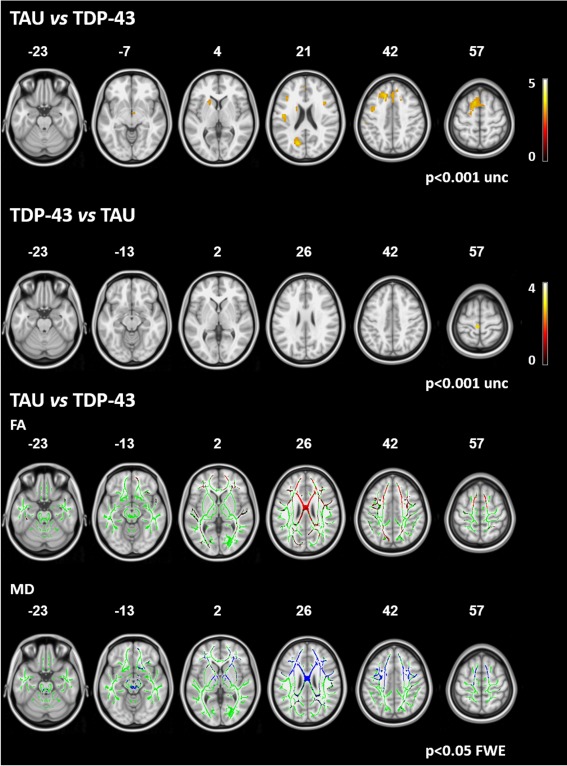
Between‐pathology comparison. Upper two rows: areas of GM atrophy in patients with probable TAU pathology compared with patients with likely TDP‐43 pathology and viceversa. Results are overlaid on the axial sections of a T1‐weighted template in the MNI standard space in neurological convention (left is left) and displayed at P < 0.001 uncorrected (numbers are Z coordinates). The color scale indicates T‐values. Bottom two rows: areas of significant increased mean diffusivity (MD, in blue) and decreased fractional anisotropy (FA, in red) in patients with likely TAU pathology compared with patients with likely TDP‐43 pathology. The results are overlaid on the axial sections of a FA template in the MNI standard space in neurological convention (left is left), and displayed at P < 0.05 FWE‐corrected (numbers are Z coordinates). The WM skeleton is shown in green.
WM: Patients Versus Controls
In all patient groups, WM abnormalities were found to extend beyond the locations of GM atrophy (P < 0.05, FWE; Fig. 1; Supporting Information Figs. e‐5 and e‐6). The least distributed pattern of WM alterations was found in MND‐pm versus controls, showing an increased MD in the bilateral corona radiata underneath the precentral gyri, and a decreased FA in the same regions, extending to the posterior part of the body of CC (P < 0.05, FWE; Supporting Information Figs. e‐5 and e‐6). Relative to controls, bvFTD, MND‐plus, nfvPPA, and PSPs showed a distributed and pronounced pattern of increased MD and decreased FA involving the CC, orbitofrontal WM, frontoparietal WM, occipital WM, internal capsule, and brainstem, bilaterally (P < 0.05, FWE; Supporting Information Figs. e‐5 and e‐6). The temporal WM bilaterally was severely involved in bvFTD, MND‐plus, and nfvPPA cases. Relative to controls, PSPs also showed an involvement of the superior cerebellar peduncles (SCP) (P < 0.05, FWE; Supporting Information Figs. e‐5 and e‐6). svPPA patients compared with controls showed a predominantly left‐sided increased MD of the body of CC, external and internal capsules, orbitofrontal, frontal, anterior temporal and inferior parietal WM, with a relative sparing of the occipital lobes, brainstem, and cerebellum (P < 0.05, FWE; Supporting Information Fig. e‐5). In svPPA, decreased FA was less distributed involving the body and genu of CC, and the left superior longitudinal fasciculus (SLF), cingulum, external and internal capsules, and anterior and middle temporal WM (P < 0.05, FWE; Supporting Information Fig. e‐6). Radial diffusivity abnormalities exceeded axial diffusivity alterations in each patient group (data not shown).
An overlapping pattern of WM damage was identified in all clinical phenotypes relative to controls but the MND‐pm, including the CC body, external capsule, and SLF bilaterally, and left internal capsule and temporoparietal WM (Fig. 1).
WM: Between‐Patient Groups
MND‐plus versus MND‐pm
Compared with MND‐pm cases, MND‐plus showed MD increase of the body of CC and anterior part of the left SLF, and extensive FA decrease involving the whole WM, including brainstem and cerebellum (P < 0.05, FWE; Supporting Information Fig. e‐7). In MND‐pm compared with MND‐plus, there were no DT MRI alterations.
bvFTD versus MND‐pm
The patterns of MD increase and FA decrease in bvFTD versus MND‐pm resembled those observed in bvFTD versus controls except for the absence of alterations in the brainstem, internal capsule, and corona radiata underneath primary motor cortex for both MD and FA, and of the middle part of the CC for FA (P < 0.05, FWE; Supporting Information Fig. e‐7). The opposite contrast did not show significant results.
bvFTD versus MND‐plus
BvFTD compared with MND‐plus patients showed a significant MD increase of the genu and anterior part of the body of CC, fronto‐polar WM bilaterally, and right temporal WM (P < 0.05, FWE; Supporting Information Fig. e‐7). There were no regions of FA decrease in bvFTD versus MND‐plus cases. When the opposite comparison was examined, no significant results were found.
bvFTD versus nfvPPA
Comparing bvFTD to nfvPPA, there was a significant MD increase in the genu of CC, fronto‐polar WM bilaterally, and right anterior temporal WM (P < 0.05, FWE; Supporting Information Fig. e‐7). There were no regions of FA decrease. Compared with bvFTD, nfvPPA patients did not show DT MRI alterations.
bvFTD versus svPPA
Comparing bvFTD to svPPA, there was an MD increase in the genu and anterior part of the body of CC, and frontal and fronto‐polar WM bilaterally (with right predominance) (P < 0.05, FWE; Supporting Information Fig. e‐7). There was a significant FA reduction in the same areas with an additional involvement of the right fronto‐parietal SLF and parietal WM (P < 0.05, FWE; Supporting Information Fig. e‐7). Compared with bvFTD, svPPA cases did not show DT MRI alterations.
bvFTD versus PSPs
Comparing bvFTD to PSPs, there was a significant MD increase in the genu of CC, fronto‐polar WM bilaterally, and right temporal WM (P < 0.05, FWE; Supporting Information Fig. e‐7). There were no regions of FA decrease. Compared with bvFTD, PSPs cases did not show DT MRI alterations.
There were no MD or FA differences comparing nfvPPA versus svPPA, PSPs versus nfvPPA, and PSPs versus MND‐plus.
Probable FTLD‐TAU Versus FTLD‐TDP
MND and svPPA patients were considered likely to have FTLD‐TDP, while nfvPPA and PSPs cases likely to harbor FTLD‐TAU (Rohrer et al., 2011). No VBM results survived the correction for multiple comparisons. Figure 2 reports VBM findings obtained at P < 0.001 uncorrected. On the contrary, patients with probable FTLD‐TAU compared to those with probable FTLD‐TDP showed MD increase in the prefrontal WM and body and genu of CC, external and internal capsules, parietal lobes, brainstem, SCP, and inferior cerebellar peduncles (P < 0.05, FWE; Fig. 2). FA was decreased in the prefrontal WM and body and genu of CC, and in the parietal and occipital WM, bilaterally (P < 0.05 FWE). The opposite contrast did not show regions of MD increase and FA reduction.
Relationship Between Executive‐Attentive Deficits and Brain Damage (P < 0.05 FWE)
Executive‐attentive Z scores correlated with GM volume of the prefrontal cortex bilaterally, and MD values of the CC, frontoparietal, and anterior temporal WM (Fig. 3). The correlation with FA values was more distributed, involving the CC and all the WM tracts except for the corticospinal tracts.
Figure 3.
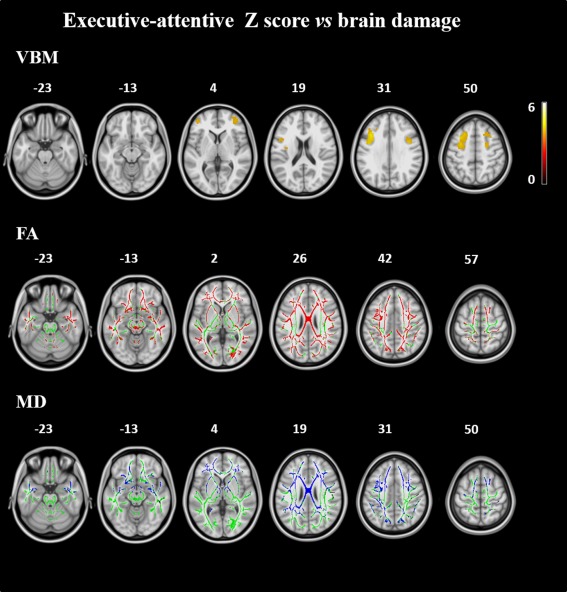
Correlation analysis. Upper row: GM volumes correlating with the executive‐attentive Z score across the FTLD spectrum. Results are overlaid on the axial sections of a T1‐weighted template in the MNI standard space in neurological convention (left is left) and displayed at P < 0.05, FWE‐corrected (numbers are Z coordinates). The color scale indicates T‐values. Bottom rows: correlations of mean diffusivity (MD, in blue) and fractional anisotropy (FA, in red) values with the executive‐attentive Z score across the FTLD spectrum. The results are overlaid on the axial sections of a FA template in the MNI standard space in neurological convention (left is left), and displayed at P < 0.05, FWE‐corrected (numbers are Z coordinates). The WM skeleton is shown in green.
DISCUSSION
This study explored the patterns of GM and WM abnormalities in the FTLD continuum including both TAU and TDP‐43‐associated clinical syndromes. Differently from previous studies, we studied a broader spectrum of FTLD phenotypes, including not only the classic FTLD syndromes (i.e., bvFTD and PPA) but also motor disorders such as MND with or without cognitive/behavioral impairment and PSPs. We showed that: (i) all patient groups, with the exception of MND‐pm, shared a focal GM atrophy including the dorsolateral and medial frontal cortex bilaterally and left insula and a largely overlapping pattern of microstructural WM damage involving the genu and body of the CC and ventral frontotemporal and dorsal frontoparietal pathways; (ii) surrounding this shared area of abnormalities, phenotype (symptom)‐specific GM and WM regions of damage were found in each variant; and (iii) patients with a high likelihood of an underlying FTLD‐TAU had more severe WM damage relative to patients who are likely to harbor a FTLD‐TDP pathology, despite a similar pattern of GM atrophy.
In contrast to the initial equation “neurodegenerative disease = GM atrophy/damage,” the results we obtained in all clinical phenotypes indicate that in the FTLD spectrum WM damage is more distributed than GM atrophy. This suggests that “diffuse” WM abnormalities are unlikely to relate solely to GM atrophy or axonal loss. A key pathophysiologic role of WM alterations in FTLD syndromes is also suggested by MRI evidence in asymptomatic mutation carriers (Dopper et al., 2013; Pievani et al., 2014). Although DT MRI abnormalities are not a marker of FTLD, these findings are in keeping with data reporting abundant tau/TDP pathology in glial cells and altered axonal transport in FTLD cases (Brettschneider et al., 2013, 2014; Forman et al., 2002; Neumann et al., 2007; Zhukareva et al., 2006), as discussed later in this article. Of note, in all the FTLD‐related syndromes we observed a more distributed pattern of radial diffusivity abnormalities compared with axial diffusivity alterations, confirming the evidence that radial diffusivity is likely to be the most sensitive DT MRI measure for such a pathology (Agosta et al., 2012; Dopper et al., 2013; Sajjadi et al., 2013).
When we looked at the similarities across clinical phenotypes of the FTLD spectrum, overlapping patterns of damage were observed. The dorsolateral and medial frontal cortices and left insula were found to be atrophic in all groups, except for MND‐pm, but with a clear gradient in severity and extension from bvFTD and svPPA (more atrophy), to PSPs, nfvPPA, and MND‐plus (less atrophy). In addition, bvFTD, MND‐plus, PPA, and PSPs patients shared a similarly large and severe pattern of damage to the body and genu of the CC and main frontotemporal and frontoparietal WM tracts. The shared anterior anatomic involvement in the FTLD phenotypes targets the executive‐attentive network and its main WM connections, in agreement with the partially overlapping executive difficulties and behavioral abnormalities of these patients. In keeping with this hypothesis, we found that atrophy of the dorsolateral frontal cortex and damage to the CC frontal connections correlated with the executive‐attentive deficits across the whole spectrum of disorders.
Beside the core network affected in FTLD regardless the clinical phenotype, each patient group was characterized by uniquely affected regions, which closely matched the dominant phenotype in each variant. Consistent with previous literature (Chiò et al., 2014), MND with or without cognitive/neuropsychiatric impairment showed the most severe GM and WM damage to the motor network. In line with their prominent behavioral disturbances, patients with bvFTD showed greater involvement of limbic/paralimbic circuits relative to other syndromes (Seeley et al., 2008). Consistent with their dominant language deficits, the two PPA variants showed the classical pattern of left greater than right damage, centered on the anterior temporal regions in svPPA and inferior frontal cortex in nfvPPA (Galantucci et al., 2011; Gorno‐Tempini et al., 2004). The selective involvement of the SCP in PSPs agrees with the pathological observation of demyelination and microgliosis in these tracts (Ishizawa et al., 2000) and a number of previous MRI studies (Whitwell et al., 2011).
Our data, taken in their completeness, can be discussed in the framework of the so‐called network‐based hypothesis of pathology propagation in neurodegenerative diseases (Soto, 2012). In each clinical phenotype, unique brain areas are thought to be selectively vulnerable for FTLD pathology at onset, that is, the motor network in MND, the salience network in bvFTD, the language network in PPA, and the cerebello‐thalamic‐cortical network in PSPs. Then, as the condition progresses, misfolded proteins would spread travelling along the main anatomical connections of the initially involved area throughout the distributed neural system with which the focal site of onset communicates, that is, the executive network. This would ultimately result in a convergence of damage among the different subtypes to the core network, with differences due to the focal site of onset. Although speculative, this model might explain the phenotypic diversity of these conditions as well as the clinical overlap in executive and behavioral deficits with progression of the disease. Increasing evidence of the ability of tau (Clavaguera et al., 2013; Rabano et al., 2014) and, less conclusively, TDP‐43 (Brettschneider et al., 2013, 2014; Nonaka et al., 2013) to propagate transsynaptically through well‐established brain anatomical pathways has been reported.
It is also worth pointing out that, although a remarkable topographic overlap was observed across the spectrum, we also observed some differences between phenotypes within the common pattern of damage in terms of both injury severity and relative involvement of GM and WM tissues. This could be explained by differences in the underlying TAU or TDP‐43 pathology. Indeed, the burden of WM degeneration is different depending on the type of FTLD pathology and may differ even among the distinct subtypes of tau and TDP‐43. A recent pathological study demonstrated that FTLD‐TAU have greater WM pathology relative to FTLD‐TDP cases (McMillan et al., 2013). A few neuroimaging studies reported a more severe WM involvement in FTLD‐TAU relative to FTLD‐TDP cases using atrophy (Caso et al., 2014; Kim et al., 2007) or DT MRI measures (McMillan et al., 2013; Sajjadi et al., 2013), including path‐proven cases. In our study, TBSS analysis showed a strikingly more severe WM damage in likely FTLD‐TAU compared with likely FTLD‐TDP cases, despite they had only a slightly more distributed pattern of GM atrophy. Biological and pathological features of FTLD‐TAU (Forman et al., 2002; Zhukareva et al., 2002, 2006) and FTLD‐TDP (Brettschneider et al., 2013, 2014; Neumann et al., 2007) can contribute to explain our neuroimaging findings. Together with previous studies (McMillan et al., 2013; Sajjadi et al., 2013), our data suggest that WM features may have the potential to differentiate the two major types of FTLD pathology in vivo. Certainly, we cannot exclude that some of the differences we observed may reflect the phenotypical variations. For instance, PSPs patients were older and had a longer disease duration relative to MND‐pm patients. It is remarkable, however, that we found a greater WM damage in FTLD‐TAU relative to FTLD‐TDP cases but not GM differences, while an older age and a longer disease duration should affect both WM and GM.
This study is not without limitations. The most important is the lack of pathological confirmation of our cases, which may lessen the validity of the TAU versus TDP comparisons. However, in cases of typical clinical presentations of MND or PSPs, the likelihood of underlying TDP‐43 and tauopathy, respectively, is extremely high (Rohrer et al., 2011). Pathological heterogeneity is higher in PPA. That said, we included only PPA patients with no AD‐like CSF biomarkers. Furthermore, previous clinicopathological studies indicate that TDP‐43 is the typical pathology in svPPA whereas tauopathies are relatively rare (Rohrer et al., 2011), and similar results were obtained when nfvPPA patients were excluded from the FTLD‐TAU group (data not shown). Of course, the final goal of this kind of research is the in vivo FTLD pathological differentiation among patients with the same clinical phenotype, for example, bvFTD‐TAU and bvFTD‐TDP cases. Second, the number of patients enrolled in each clinical group was relatively small, especially for PPA and MND‐plus, reflecting the rarity of these conditions. Finally, future studies comparing GM and WM signatures across the FTLD spectrum should also include patients with CBS for a full coverage of all variants of this condition.
In conclusion, our findings strengthen the notion of a continuum between the FTLD clinical syndromes showing that the frontal cortex and, even more, its main WM connections may represent the common target of neurodegeneration in these conditions. The topographic pattern of damage that we observed also supports the notion that a prion‐like propagation of protein aggregates underlies the stereotyped progression of neurodegenerative diseases, including FTLD. Finally, our findings agree with the concept that an underlying FTLD pathology determines a more distributed WM disruption than GM atrophy, and that WM damage in likely FTLD‐TAU cases may be greater than in patients with likely FTLD‐TDP. Larger, longitudinal studies including patients with path‐proven diagnoses are now warranted to test the hypothesis of predictable disease spread and to better address the specific signatures of this disease spectrum.
Supporting information
Supplementary Information
Supplementary Information
Supplementary Information
Supplementary Information
Supplementary Information
Supplementary Information
Supplementary Information
Supplementary Information
Supplementary Information
Supplementary Information
ACKNOWLEDGMENTS
Conflicts of Interest: F. Agosta serves on the editorial board of the Journal of Neurology; has received speaker honoraria from Bayer Schering Pharma, Biogen Idec, Sanofi Aventis, and Serono Symposia International Foundation; and receives research supports from the Italian Ministry of Health, and AriSLA (Fondazione Italiana di Ricerca per la SLA). S. Galantucci, G. Magnani, A. Marcone, D. Martinelli, M.A. Volontè, N. Riva, S. Iannaccone, P.M. Ferraro, F. Caso, and A. Falini report no disclosures. A. Chiò serves on the editorial board of Amyotrophic Lateral Sclerosis and Frontotemporal Degeneration; has served on scientific advisory boards for Biogen Idec, Cytokinetics Inc. and Italfarmaco; receives research support from the Italian Ministry of Health, Italian Ministry of University and Research, European Communities, Regione Piemonte, Compagnia di San Paolo, Agenzia Italiana per la Ricerca sulla SLA (ARISLA), Fondazione Vialli e Mauro Onlus, and Federazione Italiana Giuoco Calcio (FIGC). G. Comi has received compensation for consulting services and/or speaking activities from Novartis, Teva Pharmaceutical Ind., Sanofi, Genzyme, Merck Serono, Biogen, Bayer, Actelion, Serono Symposia International Foundation, Almirall, Chugai and Receptos. M. Filippi is Editor‐in‐Chief of the Journal of Neurology; serves on scientific advisory boards for Teva Pharmaceutical Industries and Genmab A/S; has received compensation for consulting services and/or speaking activities from Bayer Schering Pharma, Biogen Idec, Genmab A/S, Merck Serono, and Teva Pharmaceutical Industries; and receives research support from Bayer Schering Pharma, Biogen Idec, Genmab A/S, Merck Serono, Teva Pharmaceutical Industries, Italian Ministry of Health, Fondazione Italiana Sclerosi Multipla, Cure PSP, the Jacques and Gloria Gossweiler Foundation (Switzerland), and the Alzheimer's Drug Discovery Foundation.
REFERENCES
- Agosta F, Canu E, Sarro L, Comi G, Filippi M (2011): Neuroimaging findings in frontotemporal lobar degeneration spectrum of disorders. Cortex 48:389–413. [DOI] [PubMed] [Google Scholar]
- Agosta F, Scola E, Canu E, Marcone A, Magnani G, Sarro L, Copetti M, Caso F, Cerami C, Comi G, Cappa SF, Falini A, Filippi M (2012): White matter damage in frontotemporal lobar degeneration spectrum. Cereb Cortex 22:2705–2714. [DOI] [PubMed] [Google Scholar]
- Ashburner J (2007): A fast diffeomorphic image registration algorithm. Neuroimage 38:95–113. [DOI] [PubMed] [Google Scholar]
- Ashburner J, Friston KJ (2005): Unified segmentation. Neuroimage 26:839–851. [DOI] [PubMed] [Google Scholar]
- Brettschneider J, Del Tredici K, Toledo JB, Robinson JL, Irwin DJ, Grossman M, Suh E, Van Deerlin VM, Wood EM, Baek Y, Kwong L, Lee EB, Elman L, McCluskey L, Fang L, Feldengut S, Ludolph AC, Lee VM, Braak H, Trojanowski JQ (2013): Stages of pTDP‐43 pathology in amyotrophic lateral sclerosis. Ann Neurol 74:20–38. [DOI] [PMC free article] [PubMed] [Google Scholar]
- Brettschneider J, Del Tredici K, Irwin DJ, Grossman M, Robinson JL, Toledo JB, Fang L, Van Deerlin VM, Ludolph AC, Lee VM, Braak H, Trojanowski JQ (2014): Sequential distribution of pTDP‐43 pathology in behavioral variant frontotemporal dementia (bvFTD). Acta Neuropathol 127:423–439. [DOI] [PMC free article] [PubMed] [Google Scholar]
- Brooks BR, Miller RG, Swash M, Munsat TL (2000): El Escorial revisited: Revised criteria for the diagnosis of amyotrophic lateral sclerosis. Amyotroph Lateral Scler Other Motor Neuron Disord 1:293–299. [DOI] [PubMed] [Google Scholar]
- Canu E, Agosta F, Spinelli EG, Magnani G, Marcone A, Scola E, Falautano M, Comi G, Falini A, Filippi M (2013): White matter microstructural damage in Alzheimer's disease at different ages of onset. Neurobiol Aging 34:2331–2340. [DOI] [PubMed] [Google Scholar]
- Caso F, Mandelli ML, Henry M, Gesierich B, Bettcher BM, Ogar J, Filippi M, Comi G, Magnani G, Sidhu M, Trojanowski JQ, Huang EJ, Grinberg LT, Miller BL, Dronkers N, Seeley WW, Gorno‐Tempini ML (2014): In vivo signatures of nonfluent/agrammatic primary progressive aphasia caused by FTLD pathology. Neurology 82:239–247. [DOI] [PMC free article] [PubMed] [Google Scholar]
- Cedarbaum JM, Stambler N, Malta E, Fuller C, Hilt D, Thurmond B, Nakanishi A (1999): The ALSFRS‐R: a revised ALS functional rating scale that incorporates assessments of respiratory function. BDNF ALS Study Group (Phase III). J Neurol Sci 169:13–21. [DOI] [PubMed] [Google Scholar]
- Chiò A, Pagani M, Agosta F, Calvo A, Cistaro A, Filippi M (2014): Neuroimaging in amyotrophic lateral sclerosis: Systematic insight into structural and functional changes. Lancet Neurol 13:1228–1240. [DOI] [PubMed] [Google Scholar]
- Clavaguera F, Lavenir I, Falcon B, Frank S, Goedert M, Tolnay M (2013): “Prion‐like” templated misfolding in tauopathies. Brain Pathol 23:342–349. [DOI] [PMC free article] [PubMed] [Google Scholar]
- Dopper EG, Rombouts SA, Jiskoot LC, Heijer T, de Graaf JR, Koning I, Hammerschlag AR, Seelaar H, Seeley WW, Veer IM, van Buchem MA, Rizzu P, van Swieten JC (2013): Structural and functional brain connectivity in presymptomatic familial frontotemporal dementia. Neurology 80:814–823. [DOI] [PMC free article] [PubMed] [Google Scholar]
- Forman MS, Zhukareva V, Bergeron C, Chin SS, Grossman M, Clark C, Lee VM, Trojanowski JQ (2002): Signature tau neuropathology in gray and white matter of corticobasal degeneration. Am J Pathol 160:2045–2053. [DOI] [PMC free article] [PubMed] [Google Scholar]
- Galantucci S, Tartaglia MC, Wilson SM, Henry ML, Filippi M, Agosta F, Dronkers NF, Henry RG, Ogar JM, Miller BL, Gorno‐Tempini ML (2011): White matter damage in primary progressive aphasias: A diffusion tensor tractography study. Brain 134:3011–3029. [DOI] [PMC free article] [PubMed] [Google Scholar]
- Goetz CG, Tilley BC, Shaftman SR, Stebbins GT, Fahn S, Martinez‐Martin P, Poewe W, Sampaio C, Stern MB, Dodel R, Dubois B, Holloway R, Jankovic J, Kulisevsky J, Lang AE, Lees A, Leurgans S, LeWitt PA, Nyenhuis D, Olanow CW, Rascol O, Schrag A, Teresi JA, van Hilten JJ, LaPelle N, Movement Disorder Society URTF (2008): Movement Disorder Society‐sponsored revision of the Unified Parkinson's Disease Rating Scale (MDS‐UPDRS): scale presentation and clinimetric testing results. Mov Disord 23:2129–2170. [DOI] [PubMed] [Google Scholar]
- Gorno‐Tempini ML, Dronkers NF, Rankin KP, Ogar JM, Phengrasamy L, Rosen HJ, Johnson JK, Weiner MW, Miller BL (2004): Cognition and anatomy in three variants of primary progressive aphasia. Ann Neurol 55:335–346. [DOI] [PMC free article] [PubMed] [Google Scholar]
- Gorno‐Tempini ML, Hillis AE, Weintraub S, Kertesz A, Mendez M, Cappa SF, Ogar JM, Rohrer JD, Black S, Boeve BF, Manes F, Dronkers NF, Vandenberghe R, Rascovsky K, Patterson K, Miller BL, Knopman DS, Hodges JR, Mesulam MM, Grossman M (2011): Classification of primary progressive aphasia and its variants. Neurology 76:1006–1014. [DOI] [PMC free article] [PubMed] [Google Scholar]
- Irwin DJ, Cairns NJ, Grossman M, McMillan CT, Lee EB, Van Deerlin VM, Lee VM, Trojanowski JQ: Frontotemporal lobar degeneration: Defining phenotypic diversity through personalized medicine. Acta Neuropathol (in press). [epub ahead of print 31 Dec 2014; doi: 10.1007/s00401-014-1380-1] [DOI] [PMC free article] [PubMed]
- Ishizawa K, Lin WL, Tiseo P, Honer WG, Davies P, Dickson DW (2000): A qualitative and quantitative study of grumose degeneration in progressive supranuclear palsy. J Neuropathol Exp Neurol 59:513–524. [DOI] [PubMed] [Google Scholar]
- Kim EJ, Rabinovici GD, Seeley WW, Halabi C, Shu H, Weiner MW, DeArmond SJ, Trojanowski JQ, Gorno‐Tempini ML, Miller BL, Rosen HJ (2007): Patterns of MRI atrophy in tau positive and ubiquitin positive frontotemporal lobar degeneration. J Neurol Neurosurg Psychiatry 78:1375–1378. [DOI] [PMC free article] [PubMed] [Google Scholar]
- Lillo P, Mioshi E, Burrell JR, Kiernan MC, Hodges JR, Hornberger M (2012): Grey and white matter changes across the amyotrophic lateral sclerosis‐frontotemporal dementia continuum. PLoS One 7:e43993. [DOI] [PMC free article] [PubMed] [Google Scholar]
- Litvan I, Agid Y, Calne D, Campbell G, Dubois B, Duvoisin RC, Goetz CG, Golbe LI, Grafman J, Growdon JH, Hallett M, Jankovic J, Quinn NP, Tolosa E, Zee DS (1996): Clinical research criteria for the diagnosis of progressive supranuclear palsy (Steele‐Richardson‐Olszewski syndrome): Report of the NINDS‐SPSP international workshop. Neurology 47:1–9. [DOI] [PubMed] [Google Scholar]
- McMillan CT, Irwin DJ, Avants BB, Powers J, Cook PA, Toledo JB, McCarty Wood E, Van Deerlin VM, Lee VM, Trojanowski JQ, Grossman M (2013): White matter imaging helps dissociate tau from TDP‐43 in frontotemporal lobar degeneration. J Neurol Neurosurg Psychiatry 84:949–955. [DOI] [PMC free article] [PubMed] [Google Scholar]
- Morris JC (1993): The Clinical Dementia Rating (CDR): current version and scoring rules. Neurology 43:2412–2414. [DOI] [PubMed] [Google Scholar]
- Neumann M, Sampathu DM, Kwong LK, Truax AC, Micsenyi MC, Chou TT, Bruce J, Schuck T, Grossman M, Clark CM, McCluskey LF, Miller BL, Masliah E, Mackenzie IR, Feldman H, Feiden W, Kretzschmar HA, Trojanowski JQ, Lee VM (2006): Ubiquitinated TDP‐43 in frontotemporal lobar degeneration and amyotrophic lateral sclerosis. Science 314:130–133. [DOI] [PubMed] [Google Scholar]
- Neumann M, Kwong LK, Truax AC, Vanmassenhove B, Kretzschmar HA, Van Deerlin VM, Clark CM, Grossman M, Miller BL, Trojanowski JQ, Lee VM (2007): TDP‐43‐positive white matter pathology in frontotemporal lobar degeneration with ubiquitin‐positive inclusions. J Neuropathol Exp Neurol 66:177–183. [DOI] [PubMed] [Google Scholar]
- Nonaka T, Masuda‐Suzukake M, Arai T, Hasegawa Y, Akatsu H, Obi T, Yoshida M, Murayama S, Mann DM, Akiyama H, Hasegawa M (2013): Prion‐like properties of pathological TDP‐43 aggregates from diseased brains. Cell Rep 4:124–134. [DOI] [PubMed] [Google Scholar]
- Pievani M, Paternico D, Benussi L, Binetti G, Orlandini A, Cobelli M, Magnaldi S, Ghidoni R, Frisoni GB (2014): Pattern of structural and functional brain abnormalities in asymptomatic granulin mutation carriers. Alzheimers Dement 10:S354–S363. [DOI] [PubMed] [Google Scholar]
- Pringle CE, Hudson AJ, Munoz DG, Kiernan JA, Brown WF, Ebers GC (1992): Primary lateral sclerosis. Clinical features, neuropathology and diagnostic criteria. Brain 115(Pt. 2):495–520. [DOI] [PubMed] [Google Scholar]
- Rabano A, Rodal I, Cuadros R, Calero M, Hernandez F, Avila J (2014): Argyrophilic grain pathology as a natural model of tau propagation. J Alzheimers Dis 40:S123–S133. [DOI] [PubMed] [Google Scholar]
- Rascovsky K, Hodges JR, Knopman D, Mendez MF, Kramer JH, Neuhaus J, van Swieten JC, Seelaar H, Dopper EG, Onyike CU, Hillis AE, Josephs KA, Boeve BF, Kertesz A, Seeley WW, Rankin KP, Johnson JK, Gorno‐Tempini ML, Rosen H, Prioleau‐Latham CE, Lee A, Kipps CM, Lillo P, Piguet O, Rohrer JD, Rossor MN, Warren JD, Fox NC, Galasko D, Salmon DP, Black SE, Mesulam M, Weintraub S, Dickerson BC, Diehl‐Schmid J, Pasquier F, Deramecourt V, Lebert F, Pijnenburg Y, Chow TW, Manes F, Grafman J, Cappa SF, Freedman M, Grossman M, Miller BL (2011): Sensitivity of revised diagnostic criteria for the behavioural variant of frontotemporal dementia. Brain 134:2456–2477. [DOI] [PMC free article] [PubMed] [Google Scholar]
- Rohrer JD, Lashley T, Schott JM, Warren JE, Mead S, Isaacs AM, Beck J, Hardy J, de Silva R, Warrington E, Troakes C, Al‐Sarraj S, King A, Borroni B, Clarkson MJ, Ourselin S, Holton JL, Fox NC, Revesz T, Rossor MN, Warren JD (2011): Clinical and neuroanatomical signatures of tissue pathology in frontotemporal lobar degeneration. Brain 134:2565–2581. [DOI] [PMC free article] [PubMed] [Google Scholar]
- Sajjadi SA, Acosta‐Cabronero J, Patterson K, Diaz‐de‐Grenu LZ, Williams GB, Nestor PJ (2013): Diffusion tensor magnetic resonance imaging for single subject diagnosis in neurodegenerative diseases. Brain 136:2253–2261. [DOI] [PubMed] [Google Scholar]
- Seeley WW, Crawford R, Rascovsky K, Kramer JH, Weiner M, Miller BL, Gorno‐Tempini ML (2008): Frontal paralimbic network atrophy in very mild behavioral variant frontotemporal dementia. Arch Neurol 65:249–255. [DOI] [PMC free article] [PubMed] [Google Scholar]
- Smith SM, Jenkinson M, Johansen‐Berg H, Rueckert D, Nichols TE, Mackay CE, Watkins KE, Ciccarelli O, Cader MZ, Matthews PM, Behrens TE (2006): Tract‐based spatial statistics: Voxelwise analysis of multi‐subject diffusion data. Neuroimage 31:1487–1505. [DOI] [PubMed] [Google Scholar]
- Soto C (2012): Transmissible proteins: Expanding the prion heresy. Cell 149:968–977. [DOI] [PMC free article] [PubMed] [Google Scholar]
- Strong MJ, Grace GM, Freedman M, Lomen‐Hoerth C, Woolley S, Goldstein LH, Murphy J, Shoesmith C, Rosenfeld J, Leigh PN, Bruijn L, Ince P, Figlewicz D (2009): Consensus criteria for the diagnosis of frontotemporal cognitive and behavioural syndromes in amyotrophic lateral sclerosis. Amyotroph Lateral Scler 10:131–46. [DOI] [PubMed] [Google Scholar]
- Tovar‐Moll F, de Oliveira‐Souza R, Bramati IE, Zahn R, Cavanagh A, Tierney M, Moll J, Grafman J (2014): White matter tract damage in the behavioral variant of frontotemporal and corticobasal dementia syndromes. PLoS One 9:e102656. [DOI] [PMC free article] [PubMed] [Google Scholar]
- Turner MR, Cagnin A, Turkheimer FE, Miller CC, Shaw CE, Brooks DJ, Leigh PN, Banati RB (2004): Evidence of widespread cerebral microglial activation in amyotrophic lateral sclerosis: an [11C](R)‐PK11195 positron emission tomography study. Neurobiol Dis 15:601–619. [DOI] [PubMed] [Google Scholar]
- Whitwell JL, Master AV, Avula R, Kantarci K, Eggers SD, Edmonson HA, Jack CR Jr, Josephs KA (2011): Clinical correlates of white matter tract degeneration in progressive supranuclear palsy. Arch Neurol 68:753–760. [DOI] [PMC free article] [PubMed] [Google Scholar]
- Zhukareva V, Shah K, Uryu K, Braak H, Del Tredici K, Sundarraj S, Clark C, Trojanowski JQ, Lee VM (2002): Biochemical analysis of tau proteins in argyrophilic grain disease, Alzheimer's disease, and Pick's disease: A comparative study. Am J Pathol 161:1135–1141. [DOI] [PMC free article] [PubMed] [Google Scholar]
- Zhukareva V, Joyce S, Schuck T, Van Deerlin V, Hurtig H, Albin R, Gilman S, Chin S, Miller B, Trojanowski JQ, Lee VM (2006): Unexpected abundance of pathological tau in progressive supranuclear palsy white matter. Ann Neurol 60:335–345. [DOI] [PubMed] [Google Scholar]
Associated Data
This section collects any data citations, data availability statements, or supplementary materials included in this article.
Supplementary Materials
Supplementary Information
Supplementary Information
Supplementary Information
Supplementary Information
Supplementary Information
Supplementary Information
Supplementary Information
Supplementary Information
Supplementary Information
Supplementary Information