

Abstract
Prenatal alcohol exposure is responsible for a broad range of brain structural malformations, which can be studied using magnetic resonance imaging (MRI). Advanced MRI methods have emerged to characterize brain abnormalities, but the teratogenic effects of alcohol on cortical morphology have received little attention to date. Twenty‐four 9‐year‐old children with fetal alcohol spectrum disorders (9 with fetal alcohol syndrome, 15 heavy exposed nonsyndromal children) and 16 age‐matched controls were studied to assess the effect of alcohol consumption during pregnancy on cortical morphology. An automated method was applied to 3D T1‐weighted images to assess cortical gyrification using global and regional sulcal indices and two region‐based morphological measurements, mean sulcal depth and fold opening. Increasing levels of alcohol exposure were related to reduced cortical folding complexity, even among children with normal brain size, indicating a reduction of buried cortical surface. Fold opening was the strongest anatomical correlate of prenatal alcohol intake, indicating a widening of sulci in all regions that were examined. These data identify cortical morphology as a suitable marker for further investigation of brain damage associated with prenatal alcohol exposure. Hum Brain Mapp 35:2285–2296, 2014. © 2013 Wiley Periodicals, Inc.
Keywords: fetal alcohol spectrum disorders, FAS, cortical morphology, fold opening
INTRODUCTION
Prenatal alcohol exposure is associated with structural malformations to the brain and numerous cognitive and behavioral deficits. Fetal alcohol syndrome (FAS), the most severe of the fetal alcohol spectrum disorders (FASD), is the most common cause of preventable mental retardation. It is characterized by a distinctive pattern of craniofacial dysmorphology, small head circumference, and growth retardation [Hoyme et al., 2005; Stratton et al., 1996]. Individuals with partial FAS exhibit some but not all of the dysmorphic features of FAS. Alcohol‐related neurodevelopmental disorder, the most prevalent FASD, is characterized by prenatal alcohol exposure and cognitive and/or behavioral impairment in the absence of distinctive craniofacial dysmorphology. Small head circumference, presumably reflecting reduced brain volume, is required for a diagnosis of FAS and is also seen in partial FAS and some nonsyndromal alcohol‐exposed individuals [Carter et al., 2013; Day et al., 2002]. The prevalence of FASD has been estimated to be as high as 2–5% of school‐age children in the United States and Western Europe [May et al., 2009]. The highest rates of FAS have been reported among the Cape Coloured (mixed ancestry) community in the Western Cape Province, South Africa, ranging from 68 to 89.2 per 1,000 live births [May et al., 2007].
Several neuroimaging studies have used magnetic resonance imaging (MRI) to examine brain structure in children and adults with prenatal alcohol exposure. Reductions in cerebral volume are highly reproducible in FASD [Lebel et al., 2011; Norman et al., 2009] and are seen even at low‐to‐moderate exposure levels [Eckstrand et al., 2012], but effects on specific brain structures are somewhat less consistent. The corpus callosum has been identified as particularly affected by prenatal alcohol exposure, as is the cerebellum [Lebel et al., 2011; Spadoni et al., 2007; Yang et al., 2012a]. Deep gray‐matter (GM) structures are also affected, including the hippocampus and caudate nucleus. Brain tissue reductions have been reported in all lobar regions [Archibald et al., 2001; Astley et al., 2009; Li et al., 2008; Nardelli et al., 2011; Sowell et al., 2002] though findings are less regionally reproducible across groups. GM and white‐matter (WM) differences and regional brain shape abnormalities have also been identified [Archibald et al., 2001; Sowell et al., 2002]. Findings with regard to cortical thickness are contradictory, as one research group reported thicker cortex in children with FASD [Sowell et al., 2008; Yang et al., 2012b], whereas another concluded that prenatal alcohol exposure is associated with cortical thinning [Zhou et al., 2011]. Thus, there continues to be a need to examine subtle abnormalities associated with alcohol‐related cortical damage [Lebel et al., 2011].
To date, no studies in children with FASD have examined cortical morphology, another potential biomarker of developmental abnormalities [Mangin et al., 2010]. Cortical folding indices have detected abnormalities in cortex gyrification in schizophrenia [Cachia et al., 2008], bipolar disorder [Penttila et al., 2009], elderly patients [Liu et al., 2010], and Alzheimer's disease [Reiner et al., 2012]. In this study, we applied an automated method to T1‐weighted MR images to extract morphometric measures related to sulci, including global and regional sulcal indices, regional sulcal mean depth, and fold opening to advance our understanding of the effects of prenatal alcohol exposure on brain anatomy in preadolescent children.
MATERIALS AND METHODS
Participants
Participants were 40 9‐year‐old, right‐handed children from the Cape Coloured community in South Africa, who are participating in the prospective Cape Town Longitudinal Cohort Study [Jacobson et al., 2008]. Nine of these children met criteria for a diagnosis of FAS, 15 were heavily exposed (HE) nonsyndromal, that is, did not meet dysmorphia criteria for FAS, and 16 were typically developing control (CTL) children. Sample characteristics are summarized in Table 1. The mothers of children with FAS drank 9.6 standard drinks per occasion on average and drank twice as frequently per week as the mothers of HE children, who also binge drank, averaging six drinks per occasion. The Cape Coloured community is a mixed ancestry population, composed of descendants of white European settlers, Malaysian slaves, Khoi‐San aboriginals, and black African ancestors.
Table 1.
Sample characteristics
| FAS (N = 9) | HE (N = 15) | CTL (N = 16) | F or χ 2 | |
|---|---|---|---|---|
| Child's age at scan | 9.3 (0.3) | 9.6 (0.6) | 9.3 (0.4) | 2.16 |
| Gender (% male) | 33.3 | 53.3 | 43.8 | 0.93 |
| Parity | 3.3 (1.2) | 1.9 (0.8) | 1.8 (0.8) | 8.97b |
| Socioeconomic status | 16.0 (7.7) | 23.6 (9.6) | 27.4 (7.6) | 5.28b |
| Average oz AA/day during pregnancya | 1.8 (2.2) | 0.5 (0.5) | 0.001 (0.003) | 8.36b |
| Average oz AA/drinking day during pregnancy | 4.8 (1.8) | 3.0 (1.4) | 0.1 (0.3) | 48.15c |
| Frequency of drinking during pregnancy (days/week) | 2.2 (1.8) | 1.1 (0.8) | 0.0 (0.0) | 15.09c |
| Cigarettes/day during pregnancy | 7.7 (5.7) | 7.6 (7.2) | 3.4 (9.9) | 1.32 |
| Marijuana use during pregnancy | 0.1 (0.3) | 0.0 (0.0) | 0.0 (0.0) | 1.79 |
Values are mean (standard deviation, SD).
1 oz absolute alcohol ≃ about two standard drinks.
P < 0.01.
P < 0.001.
Maternal alcohol consumption was assessed using a timeline follow‐back approach [Jacobson et al., 2002]. At recruitment, the mother was interviewed to determine the incidence and amount of her drinking on a day‐by‐day basis during a typical 2‐week period at time of conception. Volume was recorded for each type of beverage consumed each day, converted to oz of absolute alcohol (AA), and averaged across pregnancy. Two groups of women were recruited: (1) heavy drinkers, who consumed 14 or more standard drinks/week and/or engaged in binge drinking (five or more drinks/occasion) during pregnancy and (2) controls who abstained from drinking or drank only minimally. At recruitment, the mother was also asked whether her drinking had changed since conception; if so, when did the change occur and how much she drank on a day‐by‐day basis during the last 2‐week period. This procedure was repeated in mid‐pregnancy and again at 1‐month postpartum to provide information about drinking during the latter part of pregnancy. Data from the three timeline follow‐back interviews were tabulated to provide three continuous measures of prenatal alcohol exposure: average oz AA consumed per day, average oz consumed per drinking day (dose/occasion) during pregnancy, and frequency of drinking (days/week). All control mothers whose children were examined in this study abstained, except for one who drank two drinks on three occasions during pregnancy.
A clinic was organized in 2005, in which each child was examined for growth and FAS anomalies using a standard protocol [Hoyme et al., 2005] by three expert FAS dysmorphologists, who subsequently reached agreement regarding FAS diagnosis [Jacobson et al., 2008]. To meet criteria for full FAS, the child had to have at least two of the principal dysmorphic features (short palpebral fissures, thin upper lip, flat or smooth philtrum), small head circumference (<10th percentile), and low weight or short stature (<10th percentile). As we were interested in contrasting cortical folding in children with full FAS with that seen in HE nonsyndromal children, data from the 19 children diagnosed with partial FAS were not included in this study. One mother whose child met all the diagnostic criteria for FAS denied drinking during pregnancy, and one mother who initially denied drinking reported drinking during pregnancy when interviewed at 5‐year postpartum. The alcohol intake of these two mothers was estimated by substituting the median reported by the other mothers of the children in their respective diagnostic groups.
Procedure
The scans were performed at the Cape Universities Brain Imaging Centre (CUBIC). A staff driver and research nurse transported the mother and child from their home to CUBIC. Written informed consent was obtained from the mothers/guardians of the children, who provided oral assent. Approval for human research was obtained from the Wayne State University Human Investigation Committee and from the Faculty of Health Sciences Human Research Ethics Committee of the University of Cape Town. Mothers and children were given a snack and lunch during the visit, the mother received a small monetary compensation, and the child was given a small gift and picture of his/her brain scan.
MRI Protocol
High‐resolution anatomical images were acquired using a 3T Magnetom Allegra MRI scanner (Siemens Medical Systems, Erlangen, Germany). The images were acquired in the sagittal plane using a three‐dimensional inversion recovery gradient echo sequence (160 slices, TR = 2,200 ms, TE = 5.16 ms, TI = 1,000 ms, FA = 12°, slice thickness = 1 mm, 256 × 256 mm2 FOV, resolution = 1 × 1 × 1 mm3).
Image Processing
Cortex gyrification and other morphology indices were assessed automatically from the raw MRI structural volumes using BrainVISA software (http://brainvisa.info/) and its dedicated pipeline, Morphologist, including several image processing steps (Fig. 1). Brain tissues (GM, WM, cerebrospinal fluid [CSF]) were segmented after bias correction. Cortical folds were automatically segmented from the skeleton of the GM/CSF mask and converted to a graph‐based representation of the cortex with information related to the morphology (fold area, depth, length, and opening) [Mangin et al., 2004]. As children with FAS have smaller brains, each index was measured in native space without spatial normalization to avoid deformation of the sulci.
Figure 1.
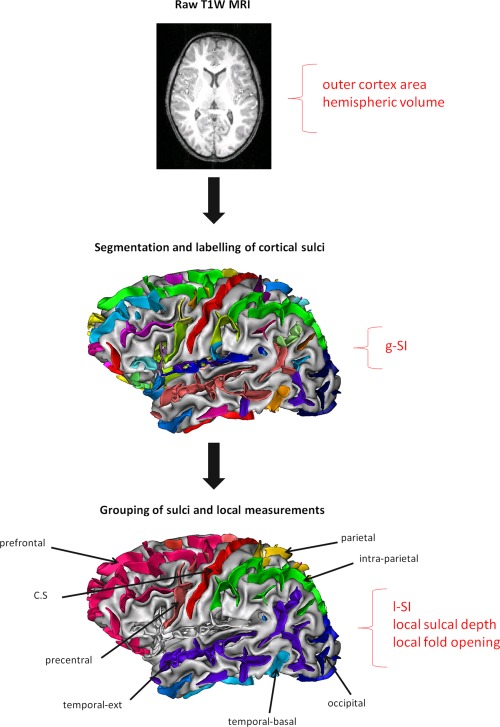
Image processing pipeline within BrainVISA used to segment brains from raw T1‐weighted images, run bias correction, compute WM/GM boundary, reconstruct white/gray mesh, and run sulci recognition and labeling. For each hemisphere of each subject, g‐SI, r‐SI, mean sulcal depth, and regional fold opening were measured in eight regions. g‐SI was defined as the ratio between total sulcal area and area of the outer cortex [Cachia et al., 2008]. [Color figure can be viewed in the online issue, which is available at http://wileyonlinelibrary.com.]
An automatic recognition algorithm based on a congregation of artificial networks trained on manually labeled brains [Rivière et al., 2002] was applied to the extracted cortical folds. This system labeled each cortical fold based on a standard nomenclature including 58 sulci in each hemisphere. Errors of identification were visually tracked and corrected for each subject. Eight regions of interest were selected either because they were easily identifiable to serve as a reference (e.g., central sulcus) or based on a priori knowledge about regions found abnormal in other neuroimaging studies of FASD (frontal, temporal, and parietal cortices).
Brain tissues volumes
For each hemisphere, WM volume, GM volume, and total volume (defined as the sum of WM, GM, and CSF) were computed based on the segmentation of the raw T1 MR images.
Global sulcal index
The global sulcal index (g‐SI) was defined as the percentage ratio between the total sulcal area and the outer cortex area [Cachia et al., 2008]. The area of each cortical fold was measured as the sum of all the triangle areas defining the fold mesh, and total sulcal area was calculated as the sum of the area of all the segmented cortical folds. This method uses the skeleton of the GM/CSF mask, with the cortical folds corresponding to the crevasse bottoms of the “landscape” the altitude of which is defined by intensity on MRI [Mangin et al., 2004]. The outer cortex area is estimated from the area of the smooth envelope of the brain mask. Thus, a cortex with extensive folding has a large g‐SI, whereas a cortex with a low degree of folding has a small g‐SI. At a constant outer cortex area, the g‐SI increases with the number and/or surface of sulcal folds, and the g‐SI of a lissencephalic cortex is zero. Hence, this index focuses on the burying of the cortex and is, therefore, slightly different from standard gyrification indices, which often include additional information related to the cortex thickness and the sulcal opening. It can be regarded as a measure of cortex complexity.
Regional sulcal index
The regional sulcal index (r‐SI) was defined as the percentage ratio between the sum of areas of labeled sulci in a particular region and the outer cortex area [Cachia et al., 2008]. Hence, the r‐SI increases with the depth and the length of a sulcus. Sulcus area was estimated, as for the g‐SI, from the area of the mesh defining the sulcus (Fig. 2). Thus, the sum of all the r‐SIs in each hemisphere was equal to the g‐SI of that hemisphere. Notably, the g‐SI was defined from nonlabeled sulci and was, therefore, not affected by possible labeling errors.
Figure 2.
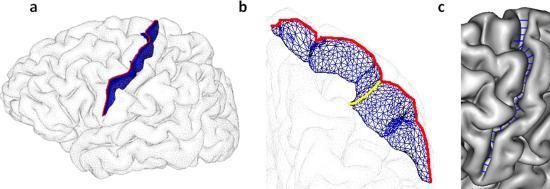
Illustration of sulcal morphometry on the central sulcus [Mangin et al., 2010]: (a) surface area in blue, r‐SI was defined as the sum of areas of labeled sulci in each region divided by outer cortical area [Cachia et al., 2008]; (b) maximal depth in yellow, mean sulcal depth was reported in this study; (c) average opening in blue, fold opening represents the average sulcal width of a sulcus, that is, the mean distance between the two walls of the gyri on each side of the sulcus. [Color figure can be viewed in the online issue, which is available at http://wileyonlinelibrary.com.]
Regional mean sulcal depth
Sulcal depth was measured as the height of the segmented sulcus computed in the perpendicular direction of the main long axis (Fig. 2). The average depth along the sulcus was reported in this study.
Regional mean fold opening
The opening of the fold was measured as the average distance between the two walls of the pial surface (Fig. 2). It has been shown to be a good biomarker of atrophy in aging [Kochunov et al., 2005; Liu et al., 2010] and Alzheimer's disease [Reiner et al., 2012]. The fold opening is also referred to as sulcal span in some studies [Liu et al., 2010]. It should be noted that fold opening can be independent of sulcal index and sulcal depth. Indeed, two‐folds can share the same surface or depth, albeit with different openings.
Statistical Analyses
All statistical analyses were run using SPSS, version 20, and all significance tests were two tailed. Each of the sulcal and brain volume measures was examined in relation to fetal alcohol diagnosis (FAS/HE/CTL) using analysis of variance (ANOVA) followed by least‐significant‐difference post hoc tests. Potential confounding variables were identified by examining the correlation of each of the following control variables with each of the outcome measures—child's gender and age at assessment, maternal cigarettes smoked per day during pregnancy, number of days per month mother used marijuana during pregnancy, parity, and socioeconomic status. Any control variable that was even weakly related to an outcome measure (at P < 0.10) was considered a potential confounder of the relation of diagnostic group to that measure. The ANOVA for each outcome was then rerun as an analysis of covariance that included the potential confounders as covariates to determine if effects related to FASD diagnosis remained significant after adjustment for potential confounders. Finally, for the exposed children (FAS + HE), each of the morphometric measurements was examined in relation to the two continuous measures of alcohol consumption during pregnancy—oz AA/day and dose/occasion (oz AA/drinking day)—using Pearson's correlation analysis.
RESULTS
Brain Tissue Volumes
Mean values of WM, GM, and total volumes for the three groups are listed in Table 2. Children with FAS had significantly smaller total brain volumes compared to HE and CTL children, which was expected, as microcephaly is one of the criteria for an FAS diagnosis. Consequently, WM and GM volumes were also much smaller in the FAS group. A mean reduction of 13% in total volume (12% for GM and 16% for WM) was observed in the FAS group, compared to the controls. The HE and CTL groups did not differ in WM, GM, or total volumes. All three effects continued to be significant after control for gender, the sole potential confounding variable.
Table 2.
Relationship of diagnostic group to measures of brain volume and g‐SI
| Post hoc P‐values | ||||||||
|---|---|---|---|---|---|---|---|---|
| FAS (n = 9) | HE (n = 15) | CTL (n = 16) | F | FAS versus HE | FAS versus CTL | HE versus CTL | F a | |
| Total brain volume (cm3) | 1.0 × 10⁶ (9.6 × 10⁴) | 1.2 × 10⁶ (9.2 × 10⁴) | 1.2 × 10⁶ (9.9 × 10⁴) | 9.87f | 0.000 | 0.000 | 0.902 | 9.96f, b |
| WM (cm3) | 3.7 × 10⁵ (5.4 × 10⁴) | 4.5 × 10⁵ (6.3 × 10⁴) | 4.4 × 10⁵ (4.5 × 10⁴) | 7.85e | 0.001 | 0.002 | 0.604 | 7.35e, b |
| GM (cm3) | 5.3 × 10⁵ (4.4 × 10⁴) | 5.9 × 10⁵ (4.2 × 10⁴) | 6.1 × 10⁵ (4.5 × 10⁴) | 9.85f | 0.003 | 0.000 | 0.175 | 10.70f, b |
| g‐SI | 3.1 (0.2) | 3.2 (0.2) | 3.4 (0.2) | 6.68e | 0.186 | 0.001 | 0.019 | 4.10d, c |
Values are mean (SD).
Adjusted for potential confounders.
Controlling for gender.
Controlling for parity.
P < 0.05.
P < 0.01.
P < 0.001.
Global Sulcal Index
As no significant differences were observed between left and right g‐SI, the mean values for the two hemispheres were summed and compared between groups (Table 2). g‐SI was significantly smaller in the FAS than in the CTL group with a reduction of 8%. g‐SI was also smaller in the HE children than in the controls. Thus, less cortical surface was buried in both the microcephalic FAS group and the HE group whose brain volume was normal, compared with the controls. The effect of diagnostic group on g‐SI continued to be significant after adjustment for parity, the sole potential confounding variable for that outcome. In addition, among the exposed children, both continuous measures of prenatal alcohol exposure were moderately correlated with g‐SI (Table 4). As shown in Figures 3 and 4, the effects of diagnostic group and maternal alcohol consumption during pregnancy on global sulcal morphology were both dose dependent.
Table 4.
Relationship of prenatal alcohol exposure to volumetric and sulcal measures among the alcohol‐exposed children only (N = 24)
| AA/day | AA/drinking day | |
|---|---|---|
| Total brain volume | −0.64 d | −0.48 b |
| WM | −0.59 c | −0.41 b |
| GM | −0.66 d | −0.50 b |
| g‐SI | −0.47 b | −0.42 b |
| AA/day | AA/drinking day | |||
|---|---|---|---|---|
| Left | Right | Left | Right | |
| Local sulcal index | ||||
| Central sulcus | −0.42 b | −0.20 | −0.25 | −0.13 |
| Precentral sulcus | −0.11 | 0.47b | 0.15 | 0.48b |
| Prefrontal sulcus | −0.23 | −0.52 c | −0.17 | −0.41 b |
| Medial frontal sulcus | −0.16 | −0.19 | −0.15 | −0.19 |
| Intraparietal sulcus | −0.31 | −0.29 | −0.31 | −0.31 |
| Parietal sulcus | −0.13 | −0.19 | 0.05 | −0.21 |
| Lateral temporal sulcus | −0.13 | −0.49 b | −0.22 | −0.39 a |
| Medial temporal sulcus | −0.47 b | 0.38a | −0.61 c | 0.33 |
| Mean sulcal depth | ||||
| Central sulcus | −0.18 | 0.05 | −0.22 | 0.13 |
| Precentral sulcus | −0.26 | −0.40 a | 0.01 | −0.41 a |
| Prefrontal sulcus | −0.01 | −0.42 b | 0.003 | −0.26 |
| Medial frontal sulcus | 0.11 | −0.35 a | 0.16 | −0.25 |
| Intraparietal sulcus | −0.50 b | −0.26 | −0.60 c | −0.35 a |
| Parietal sulcus | −0.22 | 0.000 | −0.02 | 0.05 |
| Lateral temporal sulcus | −0.05 | −0.27 | 0.07 | −0.003 |
| Medial temporal sulcus | −0.39 a | 0.01 | −0.45 b | 0.06 |
| Regional fold opening | ||||
| Central sulcus | 0.47 b | 0.29 | 0.38 a | 0.16 |
| Precentral sulcus | 0.29 | 0.38 a | 0.15 | 0.39 a |
| Prefrontal sulcus | 0.38 a | 0.64 d | 0.18 | 0.45 b |
| Medial frontal sulcus | 0.39 a | 0.45 b | 0.20 | 0.52 c |
| Intraparietal sulcus | 0.50 b | 0.41 b | 0.34 | 0.26 |
| Parietal sulcus | 0.49 b | 0.42 b | 0.33 | 0.27 |
| Lateral temporal sulcus | 0.64 d | 0.43 b | 0.47 b | 0.27 |
| Medial temporal sulcus | 0.68 d | −0.03 | 0.56 c | −0.13 |
Values are Pearson's r.
P < 0.10.
P < 0.05.
P < 0.01.
P < 0.001.
Figure 3.

Dose‐dependent relationship between prenatal alcohol exposure and global sulcal index. Values are group mean + standard error. Post hoc comparisons: High exposure versus no exposure, P < 0.001; intermediate exposure versus no exposure, P < 0.05; high exposure versus no exposure, P = 0.072.
Figure 4.
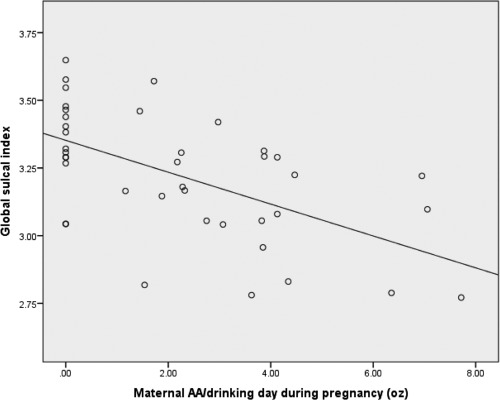
Scatterplot showing relationship of alcohol consumption per drinking day (dose/occasion) during pregnancy to global sulcal index, r = −0.58, P < 0.001.
Regional Sulcal Index
Regional measurements were not reported for one control subject for right precentral sulcus and for two control subjects for right parietal sulcus as the automatic method was not able to label several sulci in these regions.
FASD diagnostic group was significantly related to lower local sulcal index scores in only 2 out of the 16 regions—left central and right prefronal sulcus—and only the effect on the left central sulcus remained significant after control for confounders (Table 3). Among the exposed children, the two measures of maternal alcohol consumption during pregnancy were moderately correlated with the l‐SI in the right prefrontal and left medialtemporal regions (Table 4). AA/day was also correlated with l‐SI in the left central and right lateraltemporal regions.
Table 3.
Effects of FASD diagnosis on local sulcal index, sulcal depth, and fold opening
| FAS (n = 9) | HE (n = 15) | CTL (n = 16) | F | F a | |
|---|---|---|---|---|---|
| Local sulcal Index | |||||
| Central sulcus | |||||
| Left | 0.062 (0.008) | 0.065 (0.006) | 0.073 (0.010) | 5.83k | 3.95i , b |
| Prefrontal sulcus | |||||
| Right | 0.198 (0.033) | 0.229 (0.033) | 0.240 (0.035) | 4.40j | 1.60b , c |
| Sulcal depth | |||||
| Precentral sulcus | |||||
| Right | 11.78 (1.11) | 12.00 (1.09) | 12.84 (0.83) | 4.20i | 1.10b , d , e |
| Prefrontal sulcus | |||||
| Right | 9.30 (0.23) | 9.46 (0.45) | 9.80 (0.67) | 3.14h | 3.65i , c |
| Intraparietal sulcus | |||||
| Left | 12.80 (0.62) | 13.96 (1.05) | 14.17 (0.95) | 6.70j | 6.33k , b , c |
| Regional fold opening | |||||
| Central sulcus | |||||
| Left | 1.20 (0.08) | 1.09 (0.12) | 0.97 (0.21) | 6.24j | 2.81h , b , c |
| Right | 1.14 (0.08) | 1.09 (0.12) | 0.96 (0.21) | 4.52i | 4.52i |
| Precentral sulcus | |||||
| Left | 1.13 (0.15) | 1.03 (0.13) | 0.91 (0.17) | 6.29j | 3.95i , e , f |
| Right | 1.15 (0.09) | 1.03 (0.09) | 0.90 (0.19) | 8.79k | 4.55i , b , d , e |
| Prefrontal sulcus | |||||
| Left | 1.41 (0.15) | 1.39 (0.21) | 1.17 (0.22) | 6.01j | 6.01j |
| Right | 1.48 (0.19) | 1.39 (0.16) | 1.18 (0.23) | 8.14k | 5.83j , b |
| Medial frontal sulcus | |||||
| Left | 1.71 (0.20) | 1.67 (0.25) | 1.49 (0.19) | 3.91i | 3.99i , f |
| Right | 1.81 (0.16) | 1.67 (0.13) | 1.47 (0.25) | 9.62k | 3.60i , b , d , e |
| Intraparietal sulcus | |||||
| Left | 1.04 (0.08) | 0.98 (0.15) | 0.82 (0.18) | 8.15k | 8.15k |
| Right | 1.01 (0.12) | 0.96 (0.13) | 0.80 (0.19) | 7.18j | 5.05i , e , f |
| Parietal sulcus | |||||
| Left | 1.62 (0.33) | 1.32 (0.27) | 1.29 (0.36) | 3.51i | 2.42f |
| Rightg | 1.70 (0.43) | 1.57 (0.25) | 1.28 (0.26) | 5.63j | 5.63j |
| Lateral temporal sulcus | |||||
| Left | 1.08 (0.10) | 1.06 (0.12) | 0.87 (0.18) | 8.57k | 4.51i , d , e |
| Right | 1.06 (0.11) | 1.03 (0.17) | 0.83 (0.18) | 7.97k | 3.10h , b , d , e |
| Medial temporal sulcus | |||||
| Left | 1.87 (0.44) | 1.51 (0.24) | 1.31 (0.32) | 8.60k | 6.00j , e |
| Right | 1.79 (0.55) | 1.67 (0.49) | 1.42 (0.18) | 2.72h | 2.72h |
Values are mean (SD).
Adjusted for potential confounders.
Controlling for parity.
Controlling for gender.
Controlling for cigarettes/day during pregnancy.
Controlling for socioeconomic status.
Controlling for prenatal marijuana exposure.
Missing for two CTL subjects.
P < 0.10.
P < 0.05.
P < 0.01.
P < 0.001.
Regional Mean Sulcal Depth
Diagnostic group was significantly related to reduced sulcal depth in only 2 out of the 16 regions—left intraparietal and right precentral—and only the effect on the left intraparietal sulcus remained significant after control for confounders (Table 3). In addition, a significant effect on the right prefrontal sulcus was seen after control for confounders. Among the exposed children, the two measures of maternal alcohol consumption were both moderately correlated with sulcal depth in the left intraparietal region, with correlations in the right precentral region that fell short of statistical significance (Table 4). In addition, AA/day was correlated with sulcal depth in the right prefrontal region, and AA/drinking day, with sulcal depth in the left medialtemporal region.
Regional Fold Opening
The strongest and most extensive effects of diagnostic group were seen for the measure of fold opening (Table 3). FASD diagnosis was significantly related to larger fold opening in all but 1 out of the 16 regions. The effects remained significant after control for confounders in 12 of the regions, and the effects on three of the other four sulci fell just short of significance after control for confounders. Among the exposed children, oz AA/day was significantly correlated with larger fold opening in 10 out of the 16 regions, and three other correlations fell just short of statistical significance (Table 4). AA/drinking day was correlated with larger fold opening in four regions, and two other correlations fell short of significance.
DISCUSSION
Global Anatomical Differences
The volumetric reduction seen in overall brain size in the children with FAS is consistent with the previous studies [Archibald et al., 2001; Lebel et al., 2011; Nardelli et al., 2011] and is to be expected, given that microcephaly is one of the principal criteria for an FAS diagnosis [Hoyme et al., 2005]. We have recently reported regional GM reductions even in children prenatally exposed to moderate levels of alcohol [Eckstrand et al., 2012]. Bjorkquist et al. [2010] found mean reductions in GM and WM volumes of 12 and 19%, respectively, in HE children (mean age, 10.9 years), which is consistent with our results—reductions of 12 and 16%, respectively. In agreement with the previous studies [Archibald et al., 2001; Bjorkquist et al., 2010], total WM volume reduction for children with FAS was greater than GM reduction.
The observed reduction in cortical folding as assessed by the g‐SI is not surprising in the children with FAS, given that smaller brains are disproportionately less folded than larger brains [Germanaud et al., 2012; Im et al., 2008; Toro et al., 2008]. This correlation also holds true for healthy adults. For the 16 CTL children, the correlation between the outer cortex area and the total volume was r = 0.99. However, the correlation between g‐SI and total volume was only r = 0.40, indicating that this measure is relatively independent of brain volume. In contrast to other gyrification indices that depend on cortical surface segmentation, g‐SI is computed directly from the segmented folds using the skeleton of the GM/CSF mask.
The findings for the HE group make clear that the g‐SI reduction in the children with FAS is not attributable solely to their microcephaly. Although the HE children did not have smaller brain volumes than the controls, they, like the FAS group, also had reduced g‐SI. Thus, fetal alcohol exposure can lead to reduced cortical folding complexity even in the absence of a reduction in brain volume. In addition, the analysis in Figure 3 shows that the relationship between prenatal alcohol exposure and g‐SI is dose dependent.
Regional Anatomical Differences
Given that we evaluated 16 regions with three different sulcal measures, it is important to consider the risk of Type 1 error associated with multiple comparisons. Effects of prenatal alcohol exposure on brain size, GM, and WM were predicted a priori based on the previous studies; moreover, an effect on g‐SI was the principal hypothesis of this study. Among the 16 local sulcal index measures, effects of FASD diagnosis were significant in only two regions—left central sulcus and left prefrontal sulcus. Given that 2 out of the 16 comparisons might well be significant by chance, the data suggest that the effect seen on the global sulcal index was not focused on any particular sulcal region(s). Among the 16 sulcal depth measures, again only two of the effects of diagnosis were significant, suggesting that sulcal depth is not extensively affected by fetal alcohol exposure.
In contrast, diagnostic group was significantly related to all but one of the fold‐opening measures, indicating that this aspect of cortical folding is highly sensitive to prenatal alcohol exposure. It is unlikely that the fold‐opening finding was attributed to multiple comparisons as it was evident throughout the brain. These fold‐opening results, which are independent of the sulcal depth and r‐SI computations, indicate a difference in sulcal shape; namely, an increase in the mean distance between the two walls of the fold. The increasing magnitude of the opening of the folds with increased alcohol exposure is similar to the association that has been reported between degree of fold opening and severity of pathology in Alzheimer's disease [Reiner et al., 2012].
In contrast to cortical thickness methods, cortical folding measurement does not rely on the contrast between GM and WM, which could vary with the severity of the pathology, but on the contrast between GM and CSF, which is stronger and more consistent. The previous studies on the effects of prenatal alcohol exposure on cortical thickness have yielded inconsistent results. Two studies reported thicker cortex in bilateral temporal, bilateral inferior parietal, and right frontal regions in alcohol‐exposed subjects compared to controls [Sowell et al., 2008; Yang et al., 2012b], but Zhou et al. [2011] found no increases in cortical thickness and significant cortical thinning in bilateral middle frontal lobe, pre‐, and postcentral areas, lateral and inferior temporal, and occipital lobes. These inconsistencies could be owing to population differences in degree of alcohol exposure and clinical diagnosis (e.g., FAS vs. HE) and/or differences in the methodologies used to compute cortical thickness. Limitations of these studies are the broad age ranges (8–22 years in the study of Sowell et al.; 6–30 years in the study of Zhou et al.) and that participants with an FAS diagnosis were grouped together with other HE individuals. The strengths of the Cape Town cohort [Jacobson et al., 2008] include age homogeneity (9–10 years) and separation of groups according to rigorous diagnostic criteria. Age and diagnostic group are of primary concern in these studies as cortical thinning increases with age during adolescence [Zhou et al., 2011], and cortical morphology is impacted by brain size. Given that in larger brains significantly less thickening has been detected in left temporal, right frontal, and temporal lobes in normal subjects [Im et al., 2008], findings in cortical thickness studies may be biased by the proportion of children with FAS in a given sample.
Given the reduced GM volume in the children with FAS, the greater fold opening in alcohol‐exposed children is consistent with the inference of an association of prenatal alcohol exposure with reduced cortical thickness. A reduction of cortical thickness might imply a greater distance between the two walls of a fold. However, the sulcal opening is complex and is not necessarily determined by cortical thickness, as it is also linked to the global shape, surface, and number of the folds. Further studies are needed to better understand the correlations among these MRI biomarkers. It is of interest that the regions found to have a thinner cortex in the study of Zhou et al. [2011]—prefrontal, precentral and lateral temporal cortices—were also found to have larger fold opening, particularly in the children with FAS.
Although smoking during pregnancy was related to prenatal alcohol exposure (r = 0.43, P < 0.01), it was not significantly related to g‐SI or any of the brain volume or r‐SI measures. Smoking was related to 1 out of the 16 sulcal depth and 4 out of the 16 fold‐opening measures but was no longer significant in relation to those endpoints when included with prenatal alcohol exposure in multiple regression analyses. Thus, these data indicate that cortical morphology is much more sensitive to prenatal exposure to alcohol than to smoking.
Mechanism of Action
The fetus is affected by maternal alcohol consumption through multiple mechanisms, including disruption of neural proliferation and migration, decreased umbilical artery blood flow, oxidative stress, hypoxia, and cell death [Lebel et al., 2011]. Continuous exposure to alcohol during embryogenesis reduces the radial glial progenitor pool, which impacts on neural cell number [Rubert et al., 2006]. Alcohol exposure induces apoptotic neurodegeneration during synaptogenesis in mice and is believed to have the same effect in humans [Ikonomidou et al., 2000; Olney et al., 2002, 2004]. Thus, prenatal alcohol consumption produces failures in the normal migration of radial cells from which the rest of the brain cells eventually develop [Bosco and Diaz, 2012]. Minor changes in relative production of progenitors and neurons could produce dramatic changes in cortical surface area [Rakic, 2005] and could lead to a decreased number of radial columns and thus a reduced expansion of the cerebral cortex [Chenn et al., 2002].
These processes are consistent with our observations of g‐SI reductions in the FAS and HE groups (surface reduction) compared to the CTL children. The effects on g‐SI may be attributable to a decrease in the number of neurons in alcohol‐exposed children resulting from the mechanisms noted above, which could lead to a reduced burying of the cortex at 9 years of age.
Our results also showed increased fold opening with increasing alcohol exposure, which could reflect reductions in tissue volume. Although brain atrophy is commonly found in adult alcoholics [Garcia‐Valdecasas‐Campelo et al., 2007; Geibprasert et al., 2010], it can be reversible if adult alcohol abuse is stopped [Geibprasert et al., 2010], whereas prenatal alcohol exposure causes irreversible brain damage. This global pattern of decreasing g‐SI and sulcal depth with an increase in fold opening has also been found in aging [Kochunov et al., 2005; Liu et al., 2010], but the underlying mechanisms may differ, with neurodegenerative diseases in aging and developmental abnormalities in infancy and childhood although neuronal loss is common to both.
Limitations of the Study
From a methodological point a view, it was advantageous that the age range in this sample was narrow as brain size and cortical thickness change during development. However, given this homogeneity in age, our conclusions regarding reduced sulcal indices and increased fold opening may be limited to exposed school‐age children within the age range studied. It will be interesting to examine the effects on cortical folding during adolescence when extensive synaptic pruning is observed in CTL children. In addition, little is known about anatomical deficits in the brains of adults exposed to alcohol in utero.
Several brain regions were examined in this study, but the results on other medial regions were not reported owing to poor labeling or segmentation of the folds. Future studies should focus on these sulci as the corpus callosum is known to be affected in FASD, as is cingulate gyrus [Bjorkquist et al., 2010].
This study used morphological tools to evaluate anatomical differences associated with prenatal alcohol exposure, and future studies are needed to examine the relationship of the observed structural malformations to the functional disabilities that are of primary concern in FASD.
CONCLUSIONS
This study used new morphological tools, which are different from but complementary to the GM volumetry and cortical thickness measures used in prior studies, to provide a more complete picture, both global and regional, of the teratogenic effects of alcohol exposure on brain development. Brains of alcohol‐exposed children were globally less folded than those of CTL children, after statistical adjustment for potential confounders, an effect that was dose dependent. Among the cortical morphology indices, fold opening was the most sensitive biomarker of prenatal alcohol exposure, linking this exposure to an extensive widening of sulci in the 9‐year exposed children.
ACKNOWLEDGMENTS
The authors thank the dysmorphologists H.E. Hoyme, L.K. Robinson, and N. Khaole, who performed the FAS dysmorphology examinations of the children; M.‐L. de Villiers and N. Maroof, the radiographers at the Cape Universities Brain Imaging Centre; M. September for her work on participant recruitment and retention; R. Sun for her work on processing the alcohol exposure data; and N.C. Dodge for assistance with the data analysis. The authors also express their gratitude to the mothers and children who have participated in the Cape Town Longitudinal Study.
REFERENCES
- Archibald SL, Fennema‐Notestine C, Gamst A, Riley EP, Mattson SN, Jernigan TL (2001): Brain dysmorphology in individuals with severe prenatal alcohol exposure. Dev Med Child Neurol 43:148–154. [PubMed] [Google Scholar]
- Astley SJ, Aylward EH, Olson HC, Kerns K, Brooks A, Coggins TE, Davies J, Dorn S, Gendler B, Jirikowic T, Kraegel P, Maravilla K, Richards T (2009): Magnetic resonance imaging outcomes from a comprehensive magnetic resonance study of children with fetal alcohol spectrum disorders. Alcohol Clin Exp Res 33:1–19. [DOI] [PMC free article] [PubMed] [Google Scholar]
- Bjorkquist OA, Fryer SL, Reiss AL, Mattson SN, Riley EP (2010): Cingulate gyrus morphology in children and adolescents with fetal alcohol spectrum disorders. Psychiatry Res 181:101–107. [DOI] [PMC free article] [PubMed] [Google Scholar]
- Bosco C, Diaz E (2012): Placental hypoxia and foetal development versus alcohol exposure in pregnancy. Alcohol Alcohol 47:109–117. [DOI] [PubMed] [Google Scholar]
- Cachia A, Paillère‐Martinot ML, Galinowski A, Januel D, de Beaurepaire R, Bellivier F, Artiges E, Andoh J, Bartrés‐Faz D, Duchesnay E, Rivière D, Plaze M, Mangin JF, Martinot JL (2008): Cortical folding abnormalities in schizophrenia patients with resistant auditory hallucinations. NeuroImage 39:927–935. [DOI] [PubMed] [Google Scholar]
- Carter RC, Jacobson JL, Sokol RJ, Duggan C, Avison MJ, Jacobson SW (2013): Prenatal alcohol exposure and moderating effects of maternal nutrition on growth from birth through young adulthood. Alcohol Clin Exp Res 37:452–462. [DOI] [PMC free article] [PubMed] [Google Scholar]
- Chenn A, Walsh CA (2002): Regulation of cerebral cortical size by control of cell cycle exit in neural precursors. Science 297:365–369. [DOI] [PubMed] [Google Scholar]
- Day NL, Leech SL, Richardson GA, Cornelius MD, Robles N, Larkby C (2002): Prenatal alcohol exposure predicts continued deficits in offspring size at 14 years of age. Alcohol Clin Exp Res 26:1584–1591. [DOI] [PubMed] [Google Scholar]
- Eckstrand KL, Ding Z, Dodge NC, Cowan RL, Jacobson JL, Jacobson SW, Avison MJ (2012): Persistent dose‐dependent changes in brain structure in young adults with low‐to‐moderate alcohol exposure in utero. Alcohol Clin Exp Res, 36:1892–1902. [DOI] [PMC free article] [PubMed] [Google Scholar]
- Garcia‐Valdecasas‐Campelo E, Gonzales‐Reimers E, Santolaria‐Fernandez F, De La Vega MJ, Milena‐Abril A, Sanchez‐Perez MJ, Martinez‐Riera A, Rodriguez‐Rodriguez E (2007): Brain atrophy in alcoholics: Relationships with alcohol intake; liver disease; nutritional status, and inflammation. Alcohol Alcohol 42:533–538. [DOI] [PubMed] [Google Scholar]
- Geibprasert S, Gallucci M, Krings T (2010): Alcohol‐induced changes in the brain assessed by MRI and CT. Eur Radiol 20:1492–1501. [DOI] [PubMed] [Google Scholar]
- Germanaud D, Lefèvre J, Toro R, Fischer C, Dubois J, Hertz‐Pannier L, Mangin JF (2012): Larger is twistier: Spectral analysis of gyrification (SPANGY) applied to adult brain size polymorphism. NeuroImage 63:1257–1272. [DOI] [PubMed] [Google Scholar]
- Hoyme HE, May PA, Kalberg WO, Kodituwakku P, Gossage JP, Trujillo PM, Buckley DG, Miller JH, Aragon AS, Khaole N, Viljoen DL, Jones KL, Robinson LK (2005): A practical clinical approach to diagnosis of fetal alcohol spectrum disorders: Clarification of the 1996 Institute of Medicine criteria. Pediatrics 115:39–47. [DOI] [PMC free article] [PubMed] [Google Scholar]
- Ikonomidou C, Bittigau P, Ishimaru MJ, Wozniak DF, Koch C, Genz K, Price MT, Stefovska V, Horster F, Tenkova T, Dikranian K, Olney JW (2000): Ethanol‐induced apoptotic neurodegeneration and fetal alcohol syndrome. Science 287:1056–1060. [DOI] [PubMed] [Google Scholar]
- Im K, Lee JM, Lyttelton O, Kim SH, Evans AC, Kim SI (2008): Brain size and cortical structure in the adult human brain. Cerebral Cortex 18:2181–2191. [DOI] [PubMed] [Google Scholar]
- Jacobson SW, Chiodo LM, Jacobson JL, Sokol RJ (2002): Validity of maternal report of alcohol, cocaine, and smoking during pregnancy in relation to infant neurobehavioral outcome. Pediatrics 109:815–825. [DOI] [PubMed] [Google Scholar]
- Jacobson SW, Stanton ME, Molteno CD, Burden MJ, Fuller DS, Hoyme HE, Robinson LK, Khaole N, Jacobson JL (2008): Impaired eyeblink conditioning in children with fetal alcohol syndrome. Alcohol Clin Exp Res 32:365–372. [DOI] [PubMed] [Google Scholar]
- Kochunov P, Mangin JF, Coyle T, Lancaster J, Thompson P, Rivière D, Cointepas Y, Schlosser A, Royall DR, Zilles K, Mazziotta J, Toga A, Fox PT (2005): Age‐related morphology trends of cortical sulci. Hum Brain Mapp 26:210–220. [DOI] [PMC free article] [PubMed] [Google Scholar]
- Lebel C, Roussotte F, Sowell ER (2011): Imaging the impact of prenatal alcohol exposure on the structure of the developing human brain. Neuropsychol Rev 21:102–118. [DOI] [PMC free article] [PubMed] [Google Scholar]
- Li Z, Ma X, Peltier S, Hu X, Coles CD, Lynch ME (2008): Occipital–temporal reduction and sustained visual attention deficit in prenatal alcohol exposed adults. Brain Imaging Behav 2:39–48. [DOI] [PMC free article] [PubMed] [Google Scholar]
- Liu T, Wen W, Zhu W, Trollor J, Reppermund S, Crawford J, Jin JS, Luo S, Brodaty H, Sachdev P (2010): The effects of age and sex on cortical sulci in the elderly. NeuroImage 51:19–27. [DOI] [PubMed] [Google Scholar]
- Mangin JF, Rivière D, Cachia A, Duchesnay E, Cointepas Y, Papadopoulos‐Orfanos D, Scifo P, Ochiai T, Brunelle F, Régis J (2004): A framework to study the cortical folding patterns. NeuroImage 23:S129–S138. [DOI] [PubMed] [Google Scholar]
- Mangin JF, Jouvent E, Cachia A (2010): In vivo measurement of cortical morphology: Means and meanings. Curr Opin Neurol 23:359–367. [DOI] [PubMed] [Google Scholar]
- May PA, Gossage JP, Marais AS, Adnams CM, Hoyme HE, Jones KL, Robinson LK, Khaole NC, Snell C, Kalberg WO, Hendricks L, Brooke L, Stellvato C, Viljoen DL (2007): The epidemiology of fetal alcohol syndrome and partial FAS in a South African community. Drug Alcohol Depend 88:259–271. [DOI] [PMC free article] [PubMed] [Google Scholar]
- May PA, Gossage JP, Kalberg WO, Robinson LK, Buckley D, Manning M, Hoyme HE (2009): Prevalence and epidemiologic characteristics of FASD from various research methods with an emphasis on recent in‐school studies. Dev Disabil Res Rev 15:176–192. [DOI] [PubMed] [Google Scholar]
- Nardelli A, Lebel C, Rasmussen C, Andrew G, Beaulieu C (2011): Extensive and deep gray matter volume reductions in children and adolescents with fetal alcohol spectrum disorders. Alcohol Clin Exp Res 35:1404–1417. [DOI] [PubMed] [Google Scholar]
- Norman AL, Crocker N, Mattson SN, Riley EP (2009): Neuroimaging and fetal alcohol spectrum disorders. Dev Disabil Res Rev 15:209–217. [DOI] [PMC free article] [PubMed] [Google Scholar]
- Olney JW, Tenkova T, Dikranian K, Qin YQ, Labruyere J, Ikonomidou C (2002): Ethanol‐induced apoptic neurodegeneration in the developing C57BL/6 mouse brain. Dev Brain Res 133:115–126. [DOI] [PubMed] [Google Scholar]
- Olney JW, Young C, Wozniak DF, Jevtovic‐Todorovic V, Ikonomidou C (2004): Do pediatrics drugs cause developing neurons to commit suicide? Trends Pharmacol Sci 25:135–139. [DOI] [PubMed] [Google Scholar]
- Penttila J, Cachia A, Martinot JL, Ringuenet D, Wessa M, Houenou J, Galinowski A, Bellivier F, Gallarda T, Duchesnay E, Artiges E, Leboyer M, Olié JP, Mangin JF, Paillère‐Martinot ML (2009): Cortical folding difference between patients with early‐onset and patients with intermediate‐onset bipolar disorder. Bipolar Disord 11:361–370. [DOI] [PubMed] [Google Scholar]
- Rakic P (2005): Less is more: Progenitor death and cortical size. Nat Neurosci 8:981–982. [DOI] [PubMed] [Google Scholar]
- Reiner P, Jouvent E, Duchesnay E, Cuingnet R, Mangin JF, Chabriat H (2012) : Sulcal span in Azheimer's disease, amnestic mild cognitive impairment, and healthy controls. J Alzheimers Dis 29:605–613. [DOI] [PubMed] [Google Scholar]
- Rivière D, Mangin JF, Papadopoulos‐Orfanos D, Martinez JM, Frouin V, Régis J (2002): Automatic recognition of cortical sulci of the human brain using a congregation of neural networks. Med Image Anal 6:77–92. [DOI] [PubMed] [Google Scholar]
- Rubert G, Minana R, Pascual M, Guerri C (2006): Ethanol exposure during embryogenesis decreases the radial glial progenitor pool and affects the generation of neurons and astrocytes. J Neurosci Res 84:483–496. [DOI] [PubMed] [Google Scholar]
- Sowell ER, Thompson PM, Mattson SN, Tessner KD, Jernigan TL, Riley EP, Toga EW (2002): Regional brain shape abnormalities persist into adolescence after heavy prenatal alcohol exposure. Cerebral Cortex 12:856–865. [DOI] [PubMed] [Google Scholar]
- Sowell ER, Mattson SN, Kan E, Thompson PM, Riley EP, Toga EW (2008): Abnormal cortical thickness and brain‐behavior correlation patterns in individuals with heavy prenatal alcohol exposure. Cerebral Cortex 18:136–144. [DOI] [PMC free article] [PubMed] [Google Scholar]
- Spadoni AD, McGee CL, Fryer SL, Riley EP (2007). Neuroimaging and fetal alcohol spectrum disorders. Neurosci Biobehav Rev 31:239–245. [DOI] [PMC free article] [PubMed] [Google Scholar]
- Stratton K, Howe C, Battaglia F (1996): Fetal Alcohol Syndrome: Diagnosis, Epidemiology, Prevention, and Treatment. Washington, DC: National Academy Press. [Google Scholar]
- Toro R, Perron M, Pike B, Richer L, Veillette S, Pausova Z, Paus T (2008): Brain size and folding of the human cerebral cortex. Cerebral Cortex 18:2352–2357. [DOI] [PubMed] [Google Scholar]
- Yang Y, Phillips OR, Kan E, Sulik KK, Mattson SN, Riley EP, Jones KL, Adnams CM, May PA, O'Connor MJ, Narr KL, Sowell ER (2012a): Callosal thickness reductions relate to facial dysmorphology in fetal alcohol spectrum disorders. Alcohol Clin Exp Res 36:798–806. [DOI] [PMC free article] [PubMed] [Google Scholar]
- Yang Y, Roussotte F, Kan E, Sulik KK, Mattson SN, Riley EP, Jones KL, Adnams CM, May PA, O'Connor MJ, Narr KL, Sowell ER (2012b): Abnormal cortical thickness alterations in fetal alcohol spectrum disorders and their relationships with facial dysmorphology. Cerebral Cortex 22:1170–1179. [DOI] [PMC free article] [PubMed] [Google Scholar]
- Zhou D, Lebel C, Lepage C, Rasmussen C, Evans A, Wyper K, Pei J, Andrew G, Massey A, Massey D, Beaulieu C (2011). Developmental cortical thinning in fetal alcohol spectrum disorders. NeuroImage 58:16–25. [DOI] [PubMed] [Google Scholar]