

Abstract
It is widely accepted that complex regional pain syndrome (CRPS) is associated with shrinkage of the primary somatosensory cortex (S1) representation of the affected limb. However, supporting evidence is surprisingly limited and may be compromised by high risk of bias. This study compared the S1 spatial representation of the hand in 17 patients with upper‐limb CRPS to 16 healthy controls, using functional MRI. Innocuous vibration was delivered to digits one (D1) and five (D5) in a block‐design. Resultant activation maxima were located within a bilateral S1 mask, determined a priori. Distance between D1 and D5 activation maxima, calculated for both hands, was used as a measure of S1 representation. Analyses were blinded to group and hand. In patients, S1 representation was smaller for the affected hand than it was for the healthy hand (t(11) = 2.02, P = 0.03), as predicted. However, S1 representation of the affected hand was no different to that of either hand in controls. Critically, S1 representation of the healthy hand of patients was larger than that of controls' hands. CRPS seems to be associated with an enlarged representation of the healthy hand, not a smaller representation of the affected hand. These findings raise important questions about neuroplasticity in CRPS. Hum Brain Mapp 36:508–518, 2015. © 2014 Wiley Periodicals, Inc.
Keywords: complex regional pain syndrome, cortical reorganization, primary somatosensory cortex, neuroplasticity, functional MRI, reflex sympathetic dystrophy
INTRODUCTION
It is widely accepted that ongoing, or chronic, pain is associated with maladaptive “neuroplastic” changes to the functional organization of the primary somatosensory cortex (S1), particularly to the representation of the painful body part [Flor et al., 1997, 2006; Maihöfner et al., 2003]. The vast majority of evidence for this view comes from studies on phantom limb pain and complex regional pain syndrome (CRPS). CRPS is a debilitating disorder that is characterized by autonomic, sensory, and perceptual problems, but the cardinal feature is severe pain (see Marinus et al. [2011] for review of pathophysiology and Moseley et al. [2012] for a conceptual integrative model). Chronic CRPS has been proposed to be a neurological disease [Jänig and Baron, 2002].
Several studies of upper limb CRPS have reported that the S1 representation of the CRPS‐affected hand is smaller than that of the healthy hand [Juottonen et al., 2002; Maihöfner et al., 2003; Pleger et al., 2004; Vartiainen et al., 2008; see Di Pietro et al. [2013] for meta‐analysis]. These studies underpin the view that the representation of the CRPS‐affected hand has “shrunk.” Indeed, normalization of S1 representation has been proposed as a mechanism of popular treatments such as mirror therapy [McCabe et al., 2003] and as a viable therapeutic target in newly developed treatments such as tactile discrimination training and sensorimotor retuning [Moseley and Flor, 2012; Pleger et al., 2005]. However, a recent systematic review and meta‐analysis [Di Pietro et al., 2013] highlighted important shortcomings of the pertinent literature. For example, the imaging studies have used either electroencephalography (EEG) or magnetoencephalography (MEG), which depend on a priori assumptions to estimate dipole locations, and have relatively poor spatial resolution when compared with functional MRI (fMRI) [Brett et al., 2002; Dale et al., 2000; Dale and Sereno, 1993]; they had limited comparison between CRPS and healthy controls; and carried a high risk of bias [Di Pietro et al., 2013].
We aimed to address some of the weaknesses in the existing literature by investigating the S1 spatial representation of the CRPS‐affected hand relative to the representation of the healthy hand, and also to the representation of the hands of healthy pain‐free controls, using the benefits of enhanced spatial resolution afforded by fMRI. We removed potentially important sources of bias by blinding the diagnosis of CRPS to clinical features that would be consistent with S1 reorganization, and by blinding the analysis of data to group and affected hand. We hypothesized that the S1 representation of the CRPS‐affected hand would be smaller than that of the healthy hand, and smaller than that of either hand of controls. The secondary aims were to determine: whether our results are affected by adhering to strict criteria for CRPS diagnosis [Harden et al., 2007]; whether there are differences in the intensity of the tactile‐evoked fMRI signal in S1 between the affected and healthy hand, and between CRPS patients and healthy controls; and whether S1 representation is associated with pain intensity or duration.
MATERIALS AND METHODS
Participants
We aimed to recruit a convenience sample of 18 people who had received a diagnosis of upper‐limb CRPS from a pain physician, hand therapist, general practitioner or physiotherapist, and 18 healthy pain‐free control participants. Our sample size was determined a priori, based on detecting an interhemispheric difference in S1 hand representation size of 5 mm, assuming a standard deviation of 6 mm [Juottonen et al., 2002; Maihöfner et al., 2003], with power = 0.80 and α = 0.05. Healthy control participants of similar age and gender‐mix were recruited from the general community. Participants attended one testing session. All participants gave informed written consent. All procedures conformed to the Declaration of Helsinki and approval was granted by the Institutional Research Ethics Committee.
Although CRPS participants had been diagnosed by their treating clinician, individual presentations of this condition are highly variable. We aimed to determine whether differences in somatosensory representation might exist as a function of the diagnostic criteria used. The following relates to our independent assessment and diagnosis of the CRPS participants. Clinical assessment of signs and symptoms was undertaken by an investigator who was not involved in the fMRI image analysis (investigator: TRS). This data was then used for diagnosis, which was made by an investigator who also was not involved in the fMRI image analysis (investigator: GLM). The diagnosis of CRPS was therefore blinded to patient factors that are not captured in the diagnostic criteria. Diagnosis of CRPS, according to the International Association for the Study of Pain (IASP) CRPS diagnostic criteria [Harden et al., 2007], requires the presence of signs in at least two of four sign categories and symptoms in at least three of four symptom categories for a diagnosis with sensitivity of approximately 0.85 and specificity of approximately 0.69 (See Appendix). We considered blinding of the researchers who assessed and diagnosed CRPS to be important because aspects of the clinical presentation, most notably tactile dysfunction, which can inform about the likelihood of S1 changes, represent a potentially significant source of bias. Healthy controls underwent the same diagnostic assessment to rule out the presence of CRPS. CRPS participants' pain duration and pain intensity (average pain at rest over the past 48 h on a 0–10 numerical rating scale) were also collected.
MR Image Acquisition
Echoplanar images (EPI) were acquired on a 3T MRI scanner (Philips Achieva; Neuroscience Research Australia, Sydney), using a 32‐channel head coil. Two sessions (left and right hand), each comprising 460 echo‐planar volumes, were collected. Each image volume contained 32 axial slices (whole brain; repetition time (TR) 2,000 ms; time to echo (TE) 30 ms; flip angle 70°; field of view (FOV) 250 mm2; acquisition matrix 100 × 100; voxel volume 2.5 × 2.5 × 3 mm). A T1‐weighted anatomical scan was also collected (TR 5.4 ms; TE 2.4 ms; flip angle 8°; FOV 256 mm2; acquisition matrix 256 × 256; 180 slices; voxel volume 1.0 mm3).
Sensory Stimulation for S1 Mapping
MRI‐compatible vibrotactile stimulation (Piezotactile Stimulator PTS‐C2, http://dancerdesign.co.uk), was run through a custom‐written script using Matlab, version 7.10 (MathWorks, Natick, MA), and involved two probes fixed over the volar tip of the thumb (D1) and little finger (D5). The functional imaging protocol was based on previous block designs that exposed fine digit somatotopy in the postcentral gyrus [Nelson and Chen, 2008] and consisted of randomized 20‐second blocks of innocuous stimulation of D1 (11 blocks), D5 (11 blocks), or rest (24 blocks). Stimulation frequency was 23 Hz [Jones and Lederman, 2006; Nelson and Chen, 2008; Tommerdahl et al., 1999] at the optimal voltage required to drive the device at a fixed amplitude of 280 microns [Butterworth et al., 2003; Francis et al., 2000; Nelson et al., 2004]. Participants were instructed to concentrate on the vibrotactile stimulation [Juottonen et al., 2002; Vartiainen et al., 2008], although this was not formally evaluated. Onset times for D1 and D5 stimulation were later used for model specification.
MR Image Processing
fMRI data were analyzed using Statistical Parametric Mapping version 8 software (Wellcome Trust Centre for Neuroimaging, University College London, UK), running on Matlab version 7.10 (MathWorks, Natick, MA). Right‐ and left‐hand sessions were evaluated separately. The first three EPIs for each session were discarded to account for blood oxygen‐level dependent spin saturation effects. Images were realigned, and then a mean image was calculated for each session and coregistered to each participant's anatomical scan, before normalizing the realigned images to the standard template of the Montreal Neurological Institute. Images were smoothed with a Gaussian kernel (full‐width half‐maximum) of 5 mm [Ball et al., 2012].
Method for Evaluation of S1 Spatial Representation of the Hand
First‐level statistics were employed uniformly across the left‐hand and right‐hand sessions for all participants. Using a bilateral mask of the primary somatosensory cortices [Eickhoff et al., 2005], the highest‐activated voxel within the two‐fold standard deviation range of the D1 and D5 somatotopic S1 representations (between +40 and +67 in the z‐direction) reported by Weibull et al. [2008], were identified. Euclidean distances between the activation maxima of D1 and D5 were calculated as a measure of hand representation size, as has been done in past studies of S1 spatial representation in CRPS [Juottonen et al., 2002; Maihöfner et al., 2003; Vartiainen et al., 2008]. Activation maxima of the highest activated voxels in the contralateral S1 within the given somatotopic range, and their corresponding beta estimates (P < 0.05 uncorrected), were later analyzed as a measure of the intensity of the evoked fMRI signal (“intensity data” below). Analysis was undertaken by an investigator with extensive experience in SPM (investigator: ML), who was blinded to group (CRPS or healthy control) and therefore to the affected hand of patients. Once spatial and intensity data were calculated, results were decoded for statistical analysis by a separate investigator (investigator: FDP).
Statistical Analysis
Analyses were undertaken with SPSS Version 21 (IBM Corporation, New York). All data were checked for normality with Q‐Q plots and the Shapiro–Wilk statistic. Data were normally distributed with the exception of: the hand representation size in the nondominant hemisphere of controls; the D5 intensity data in the dominant hemisphere of controls; D1 intensity data in both hemispheres of CRPS participants; and pain duration in CRPS participants.
Normally‐distributed data were analyzed using paired t tests between hemispheres and independent t tests between groups. Because there is a compelling argument to predict S1 representation to be smaller for the affected hand than for the healthy hand [Juottonen et al., 2002; Maihöfner et al., 2003; Pleger et al., 2004; Vartiainen et al., 2008], a one‐tailed test was used to test the primary hypothesis in the CRPS patient group. Two‐tailed tests were used for all other analyses, unless otherwise stated. Non‐normally distributed data were analyzed using Wilcoxon signed‐rank (between hemispheres) or Mann–Whitney tests (between groups). Correlations were tested using Pearson's correlation for parametric data and Spearman's rho for nonparametric data. For effect sizes, we used Cohen's d (parametric) and effect size r (nonparametric) tests.
CPRS participants who at our assessment met the IASP CRPS diagnostic criteria [Harden et al., 2007] (herein called “ResearchCRPS”; see Appendix) were compared to those who did not (herein called “Pain”). To compare hand representation differences between hemispheres between groups, we planned a 2 × 2 repeated‐measures analysis of variance (ANOVA) (affected vs. healthy hemispheres; “ResearchCRPS” vs. “Pain”). As we did not include our full target sample in the analyses however, there was an increased risk of being underpowered and thus we decided to investigate this secondary aim using paired t tests (one‐tailed test in the “ResearchCRPS” group, as above for the comparison of hand representation size in the original CRPS group).
RESULTS
Participants
Forty‐three people with suspected CRPS were screened for inclusion (Supporting information Fig. 1). Due to practical constraints, the intended sample size of 18 CRPS participants and 18 healthy controls was not achieved. Seventeen participants diagnosed clinically with CRPS (5 male, 12 female; age 48.9 ± 13.9 years; 2 left‐handed, one ambidextrous; Supporting information Table 1) and 16 healthy control participants from the general community (5 male, 11 female; age 43.9 ± 11.7; 2 left‐handed) were recruited (Table 1). Data were not collected from one CRPS patient (#9) due to the inability to tolerate hand stimulation. First‐level analysis was conducted on 16 participants in each group. Six patients (#1, #7, #10, #14, #16, and #17) reported that the stimulation evoked pain. Our independent diagnosis according to IASP criteria resulted in 11 “ResearchCRPS” and five “Pain” participants (see below: The effect of CRPS diagnostic criteria).
Table 1.
Demographics and clinical information of CRPS participants
| Patient number, gender, age | Reported primary CRPS location | CRPS locationa | Pain duration (months) | Pain intensity (0—10)b | Hand dominance (reported) | Pain in other locations | Diagnosis of CRPS in other locationsa |
|---|---|---|---|---|---|---|---|
| #1 Female 43 y/o | R | R | 5 | 7 | R | None | — |
| #2 Male 36 y/oc | L | L | 30 | 8 | R | R UL and L LL | — |
| #3 Female 28 y/o | R | Bil. | 128 | 7 | R | L UL and bilateral LLs | — |
| #4 Female 45 y/oc | R | R | 42 | 6 | R | R face | — |
| #5 Female 39 y/oc | L | L | 2 | 5 | R | None | — |
| #6 Female 46 y/oc | R | None | 2 | 2 | R | None | — |
| #7 Female 52 y/oc | R | R | 29 | 8 | R | L UL, R side face, R LL | —— |
| #8 Male 66 y/oc | L | None | 120 | 4 | R | R UL, LBP | — |
| #9 Female 73 y/o | R | Bil. | 288 | 5 | R | L UL, bilateral LLs | L LL |
| #10 Male 34 y/oc | L | L | 3 | 3 | Ambidextrous | None | — |
| #11 Female 60 y/oc | R | R | 180 | 7.5 | R | L UL, L LL | — |
| #12 Female 56 y/oc | R | None | 25 | 2 | R | None | — |
| #13 Female 44 y/oc | L | None | 48 | 7 | R | Bilateral LL | — |
| #14 Female 53 y/oc | R | R | 19 | 4 | R | None | — |
| #15 Female 74 y/oc | R | None | 4 | 3 | L | None | — |
| #16 Male 53 y/o | L | Bil. | 31 | 8 | L | R UL, both sides of face, L LL | L LL |
| #17 Male 30 y/o | R | R | 8 | 6 | R | L UL, bilateral LLs | — |
Independent diagnosis according to IASP revised diagnostic criteria [Harden et al., 2007].
Resting average pain intensity over last two days. “How would you rate your average pain at rest over the last two days? Please rate from 0 to 10, with 0 being no pain at all and 10 being the worst pain you can imagine.”
Data from this patient included in data analysis.
CRPS, complex regional pain syndrome; R, right; L, left; Bil., bilateral; UL, upper limb; LL, lower limb; LBP, low back pain.
Spatial Representation of the Hand
In four patients (#1, #3, #16, and #17) and five healthy controls, suprathreshold clusters of activity could not be identified for both D1 and D5 bilaterally within the S1 mask (P < 0.05 uncorrected). Data from one control participant were excluded because of biologically implausible activation maxima (>12 SDs above the mean). Data from both hemispheres of the remaining participants (12 CRPS and 10 controls) were analyzed.
Normally distributed data are presented as mean ± SD, non‐normally distributed data as median ± IQR, unless otherwise stated. In people with CRPS, S1 hand representation was smaller for the affected hand (15.02 mm ± 5.08) than it was for the healthy hand [19.98 mm ± 7.14; t(11) = 2.02, P = 0.03, d = 0.80] (Fig. 1A,B; Table 2). In healthy controls, S1 hand representation was smaller for the nondominant hand (12.21 mm ± 3.91) than it was for the dominant hand (18.09 mm ± 4.45; Z = 2.7, P = 0.007, r = 0.49). There was no difference between the representation of the CRPS‐affected hand and those of controls [dominant hand t(20) = 1.49, P = 0.15; nondominant hand U = 41.0, P = 0.23]. The representation of the CRPS patients' healthy hand was larger than that of the controls' nondominant hand (U = 25.0, P = 0.02, r = 0.50), but not their dominant hand [t(20) = 0.73; P = 0.48]. To iterate, only five out of 12 CRPS participants had an affected nondominant hand.
Figure 1.
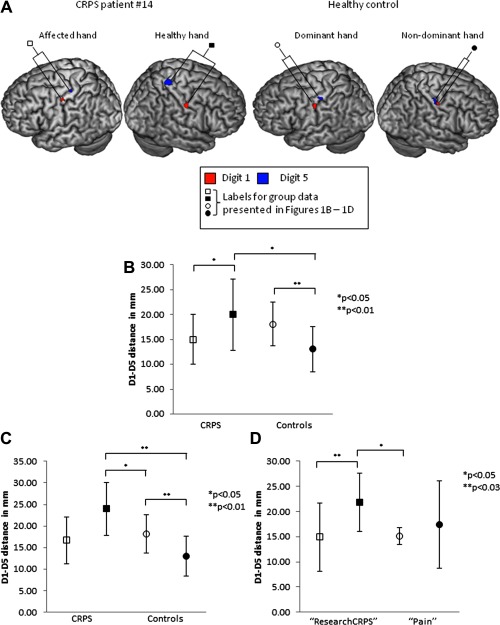
A: A representative CRPS patient and a healthy control, each displaying the typical patterns of S1 representation seen in the sample. B: Mean hand representation size in S1. n = 12 CRPS patients, n = 10 healthy controls. C: Mean hand representation size in S1: patients with CRPS of the dominant hand only. n = 7 CRPS patients, n = 10 healthy controls. D: Mean hand representation size in S1: according to IASP CRPS diagnostic criteria (Harden, Bruehl et al., 2007). n = 7 “ResearchCRPS” patients, n = 5 “Pain” patients. All data presented are mean and SD. □ CRPS affected hand, ▪ CRPS healthy hand, ○ Control dominant hand, and • Control nondominant hand. [Color figure can be viewed in the online issue, which is available at http://wileyonlinelibrary.com.]
Table 2.
Comparisons of hand representation size
| CRPS | Controls | Comparison of affected hemisphere with controls | Comparison of healthy hemisphere with controls | |||
|---|---|---|---|---|---|---|
| CRPS affected versus healthy | Controls dominant versus nondominant | CRPS affected versus control dominant | CRPS affected versus control nondominant | CRPS healthy versus control dominant | CRPS healthy versus control nondominant | |
| Original analysis: | Healthy > affected | Dominant > | ND | ND | ND | CRPS healthy |
| n = 12 CRPS | nondominant | > controls | ||||
| n = 10 controls | d = 0.80 | r = 0.49 | d = 0.64 | r = 0.20 | d = 0.32 | r = 0.50 |
| (Fig 1B) | ||||||
| Posthoc: | ND | — | ND | ND | CRPS healthy > controls | CRPS healthy > controls |
| CRPS of the dominant hand only | ||||||
| n = 7 CRPS | ||||||
| n = 10 controls | d = 1.26 | d = 0.29 | r = 0.43 | d = 1.1 | r = 0.75 | |
| (Fig 1C) | ||||||
| “ResearchCRPS” affected versus healthy | “Pain” affected versus healthy | “ResearchCRPS” affected versus “Pain” affected | “ResearchCRPS” affected versus “Pain” healthy | “ResearchCRPS” healthy versus “Pain” affected | “ResearchCRPS” healthy versus “Pain” healthy | |
| Diagnostic criteria applied: | Healthy > affected | ND | ND | ND | “ResearchCRPS” healthy > controls | ND |
| n = 7 “ResearchCRPS” | ||||||
| n = 5 “Pain” | d = 1.10 | d = 0.37 | d = 0.04 | d = 0.32 | d = 1.55 | d = 0.60 |
| (Fig 1D) | ||||||
| Posthoc: | ND | ND | ND | ND | “ResearchCRPS” healthy > controls | ND |
| “ResearchCRPS” of dominant hand only | ||||||
| n = 5 “ResearchCRPS” | ||||||
| n = 2 “Pain” | d = 1.35 | d = 0.85 | d = 0.40 | d = 0.58 | d = 2.60 | d = 0.12 |
| (Supporting Information Fig 3) | ||||||
CRPS, complex regional pain syndrome; >, larger representation size than; ND, no significant difference; d, effect size for normally‐distributed data (difference in means divided by pooled standard deviation); r, effect size for non‐normally distributed data (Z‐score divided by the square root of the sample size).
Table 3.
Intensity of the evoked fMRI signal, raw beta values
| Group and hemisphere | Affected/dominant hemisphere | Healthy/nondominant hemisphere |
|---|---|---|
| CRPS (n = 12) | D1: 0.540 ± 0.496 D5: 0.389 ± 0.099 | D1: 0.489 ± 0.185 D5: 0.569 ± 0.329 |
| Healthy controls (n = 10) | D1: 0.677 ± 0.309 D5: 0.441 ± 0.415 | D1: 0.655 ± 0.330 D5: 0.478 ± 0.220 |
No differences noted (P > 0.05 for all comparisons).
Posthoc Sensitivity Analysis on the Effect of Hand Dominance
Because we found a difference in S1 hand representation size between the dominant and nondominant hemispheres in controls, we performed a sensitivity analysis to investigate whether the results in the CRPS group were dependent on dominance. The five participants with CRPS of their nondominant hand (#2, #5, #8, #13, and #15) were removed (Fig. 1C; Table 2), such that we compared seven dominant (affected) CRPS hands to dominant control hands, and seven nondominant (healthy) CRPS hands to nondominant control hands. There was no difference in the dominant (affected) hand representation size between patients and controls [CRPS: 16.67mm ± 5.46 vs. controls: 18.09 mm ± 4.45; t(15) = 0.59, P = 0.56], implying that the affected hand representation is not smaller. In contrast, the nondominant (healthy) hand representation was larger in patients than it was in controls (CRPS: 23.97 mm ± 6.09 vs. controls: 12.21 mm ± 3.91; U = 5.0, P = 0.002, r = 0.75), implying that the healthy hand representation is enlarged. Remarkably, the nondominant (healthy) hand was also larger than the dominant hand in controls in this analysis [t(15) = 2.31, P = 0.04, d = 1.1]. A difference between hemispheres was no longer detectable in these seven CRPS participants [t(6) = 1.94, P = 0.1]. An exploration into the five participants with CRPS of the nondominant hand, compared to the healthy controls, revealed that a difference was no longer detectable between the dominant (healthy) hand in CRPS participants and the dominant hand in controls [t(13) = 1.54, P = 0.15], and that there was still no difference between the nondominant (affected) hand in CRPS participants and the nondominant hand in controls [t(13) = 0.13, P = 0.90] (Supporting information Fig. 2).
The Effect of CRPS Diagnostic Criteria
Data for seven of the 11 participants in the “ResearchCRPS” group and all five participants in the “Pain” group were available for analysis (i.e., suprathreshold clusters were not identified in S1 in four of the “ResearchCRPS” participants). In the “ResearchCRPS” group, the effects were more pronounced. That is, S1 representation of the affected hand was smaller than that of the healthy hand [affected: 14.90 mm ± 6.74 vs. healthy: 21.83mm ± 5.84, t(6) = 2.42, P = 0.025, d = 1.10]. In contrast, in the “Pain” group, there was no longer a difference in S1 hand representation between hemispheres [affected: 15.18 mm ± 1.66 vs. healthy: 17.39 mm ± 8.63, t(4)=0.5, P = 0.6] (Fig. 1D; Table 2). The representation size of the affected hand in the “ResearchCRPS” group was not different to that of the affected [t(10) = 0.09, P = 0.93] or the healthy hand [t(10) = 0.56, P = 0.59] in the “Pain” group. However, the representation of the healthy hand in the “ResearchCRPS” group was larger than that of the affected hand [21.83 mm ± 5.84 vs. 15.18mm ± 1.66, t(10) = 2.45, P = 0.03, d = 1.55] but not the healthy hand in the “Pain” group [t(10) = 1.07, P = 0.31]. The results of a posthoc sensitivity analysis on the effect of hand dominance are reported in Supporting information Results (Supporting information Fig. 3) and Table 2.
Intensity of the Evoked fMRI Signal
There were no differences between hemispheres or groups in the intensity of the stimulus‐evoked fMRI signal in S1 (See Supporting information Results and Table III for raw values).
Relationship Between Pain and Duration and S1 Spatial Representation
The representation of the affected hand was not related to pain intensity (Pearson's r: −0.17, P = 0.60) or duration (Spearman's rho: −0.11, P = 0.75). The healthy hand representation was not related to pain intensity (−0.12; P = 0.70) or duration (−0.14; P = 0.66).
DISCUSSION
We hypothesized that S1 representation would be smaller for the CRPS‐affected hand than it was for the healthy hand, or either hand of controls. Our results are partly supportive of this hypothesis: the representation was smaller for the affected hand than it was for the healthy hand. However, the affected hand representation was not smaller than that of healthy controls. In contrast to our hypothesis, the representation of the healthy hand in CRPS participants was larger than that of controls. This contradicts the view that CRPS is associated with shrinkage of the S1 representation of the affected hand. Posthoc sensitivity analyses exclude the possibility that the effects are simply due to dominance. Whether or not the patients fulfilled the strict CRPS diagnostic criteria on blinded assessment was also important: the interhemispheric difference was more pronounced in those who met the criteria (d = 1.10, vs. d = 0.80 in the original CRPS comparison), and absent in those who did not meet the criteria (i.e., the “Pain” group). That there was no difference in the intensity of the evoked fMRI signal from hand stimulation, in any comparison, is consistent with previous studies, which have yielded mixed and inconclusive results [Di Pietro et al., 2013].
To our knowledge, this is the first study to demonstrate a larger healthy hand S1 representation, rather than a smaller affected hand S1 representation, in people with CRPS, as compared to healthy controls. There are several reasons we can be confident in our findings even though they contrast with previous work. First, the design of our study was informed by the findings of a recent systematic review [Di Pietro et al., 2013] that identified several threats to the validity of previous studies, for example, limitations of MEG and EEG, nonblinding in data analysis, and failure to report on healthy control participants. Of the previous investigations of S1 representation in CRPS [Juottonen et al., 2002; Maihöfner et al., 2003; Pleger et al., 2004; Vartiainen et al., 2008], only two studies reported on healthy controls [Pleger et al., 2004; Vartiainen et al., 2008] and only one statistically compared patients to controls [Pleger et al., 2004]. In that study of seven CRPS (the dominant hand was affected in four) and seven control participants, the authors stimulated median and ulnar nerves, rather than digits. They reported that the S1 representation of the CRPS‐affected hand was smaller than that of either hand of controls, and that there was no difference between the healthy hand representation of patients and that of either hand of controls [Pleger et al., 2004]. They undertook a sensitivity analysis using the four patients with their dominant hand affected versus those with their nondominant hand affected and reported that there was no effect of dominance, although they do not provide values for this comparison. They reported no difference between dominant and nondominant hands of controls. Perhaps the different stimulation approach, the smaller sample, or the use of EEG versus our use of fMRI, explains the difference in results between that study and ours; clearly further work is required to clarify the discrepancy. Regarding the lateralization of function in the healthy human brain, less is known about the somatosensory system than is known about motor or language systems. There have been few studies that have mapped the S1 spatial representation of the hands as we have done here. In their MEG investigation into cortical asymmetries (using Euclidean distance calculations) in healthy right‐ and left‐hand dominant subjects, Sörös et al. [1999] found that the S1 representation of the right (dominant) hand was consistently larger than that of the left (nondominant) hand in right‐handed subjects. The asymmetry results were less consistent in left‐handed subjects [Sörös et al., 1999]. It would appear, from these results at least, that normal cortical asymmetry cannot explain our main result; indeed, in the majority of our sample the healthy hand was not the subject's dominant hand.
That CRPS is associated with a shrinkage in S1 hand representation is widely accepted [Henry et al., 2011; Maihöfner et al., 2010; Marinus et al., 2011; Schwenkreis et al., 2009; Swart et al., 2009], despite surprisingly little direct supportive evidence [Di Pietro et al., 2013]. Indeed, the only debate around this issue has concerned whether the smaller representation contributes to CRPS, or is caused by CRPS [Harris, 1999; McCabe and Blake, 2007; Moseley and Flor, 2012]. The notion that reduced use of the affected hand leads to a shrinkage in representation [Juottonen et al., 2002; Vartiainen et al., 2008] is so intuitively sensible, that it might explain this assumption. There is also evidence from phantom upper limb pain of invasion in S1 of the hand region by the lip region, which implies that the phantom limb representation has become smaller [Flor et al., 2006], but does not prove it—to do so would require the stimulation of a missing limb. Reports of neglect‐like findings in CRPS [Frettlöh et al., 2006; Lewis et al., 2007; Moseley, 2004] also seemed consistent with a shrunken representation of the affected hand in S1. Interestingly, however, and perhaps pertinent to keep in mind given that our findings do not implicate the S1 representation of the affected hand, neglect‐like findings are probably more dependent on spatial, and not purely on somatotopic, maps as was once thought [Moseley et al., 2009; Moseley et al., 2013]—which is consistent with poststroke neglect (Vallar and Perani, 1986). That enlarged S1 representation in the healthy hemisphere might be maladaptive seems consistent with the principles of interhemispheric rivalry [Murase et al., 2004], and the association between poor recovery after stroke and maladaptive reorganization of the healthy hemisphere [Manganotti et al., 2008]. In that group, inhibitory stimulation of the intact hemisphere aids rehabilitation [Dimyan and Cohen, 2011], which clearly raises the possibility of a new approach to CRPS rehabilitation. Just as reduced use of the affected hand might be implicated in the apparent shrinkage in its S1 representation, it follows that increased—that is, compensatory—use of the healthy hand might underlie the enlargement in S1 representation that we have identified here. That we found no relationship between the size of the healthy hand S1 representation and pain duration would imply that the asymmetry between hemispheres in the patients does not emerge as a function of adaptation induced by persistent compensatory use of the healthy hand—or even maladaptive processes related to the disorder. Gathering information related specifically to the healthy hand in CRPS would help clarify this. Clearly such questions of use‐dependent neuroplasticity in this disorder warrant further investigation.
Our study raises new questions about CRPS. The main result appeared more pronounced in the “ResearchCRPS” group than it was in the “Pain” group. Although similar pain levels between groups suggests that the difference is not simply due to pain, or to differential hand use in the two groups, these possibilities do remain. Does the interhemispheric difference reflect reorganization from baseline or does it reflect baseline, pre‐CRPS, differences? If the answer is reorganization, is that a result of pain or of some other pathophysiological characteristic of CRPS? Could the larger S1 representation be a biomarker for CRPS? Is the reorganization limited to S1, or is there wider reorganization, as is suggested by widespread disruption of systems of regulation and protection [Moseley et al., 2012]? If S1 differences were instead present before CRPS, might they represent a vulnerability to the disorder? These questions are speculative but not outrageous, and critically they are eminently testable.
Although we overcame some of the methodological limitations of previous studies, limitations remain. Our sample was smaller than we projected—we aimed for 18 participants in each group but only had 16 in each group. We may have been underpowered to detect differences in some of the planned comparisons, particularly given that suprathreshold activity within the S1 mask was not identified in all participants, despite every effort to optimize the stimulation paradigm. It is difficult to ascertain why the S1 response to peripheral stimulation in some participants was weaker than in others [Bushnell et al., 1999], but as can be seen in Table 1, it seems that there were no systematic differences in the clinical characteristics of those who did and did not reach threshold. The issue of sample size does not threaten the validity of the main finding: the largest difference in S1 representation size between patients and controls clearly involved the healthy hand, not the affected one. Further, the four patients in whom suprathreshold activity was not identified were in the “ResearchCRPS” group, not the “Pain” group. The larger effect observed in the “ResearchCRPS” group suggests that, if anything, not including those participants decreased the effect rather than increased it. In fact, that our main results came from a small and clinically heterogeneous sample makes them more compelling. Having said this, although our sample was larger than any previous investigation of this question, it was still small and, as with any scientific findings, replication would provide more confidence in the current findings—particularly replication with a larger sample. With larger samples it will be more viable to implement other analyses, for instance to investigate for interactions [Nieuwenhuis et al., 2011] rather than compare groups as we have done here, and as has been done in past studies in this field [Juottonen et al., 2002; Maihöfner et al., 2003; Pleger et al., 2004; Vartiainen et al., 2008]. Finally, we identified activation maxima in the contralateral S1, and their corresponding beta estimates, using a threshold of P < 0.05 uncorrected. We accept that false positives are a problem in fMRI studies that involve multiple testing of vast quantities of data [Bennett et al., 2009], but some protection is offered by an a priori hypothesis, which related to a specific functional region, being S1, and somatotopic boundaries of S1 that were specified a priori, based on coordinates reported by previous work [Weibull et al., 2008]. For this same reason, it is also unlikely that medications imparted an effect on the results. Although a variety of medication use was reported across the sample, there was no systematic use of medication according to hand dominance, or whether or not participants met the strict CRPS criteria. Moreover, a biologically plausible mechanism by which CRPS medications could differentially modulate S1 spatial representation in predefined areas of cortex is very unlikely. A final consideration relates to the provocation of pain in a subgroup of participants, which raises the possibility that our S1 data reflect nociceptive as well as non‐nociceptive maps in those participants [Mancini et al., 2012]. However, visual input alone can provoke pain in people with CRPS [Acerra and Moseley, 2005], and in those with pre‐CRPS wrist pain [Moseley et al., 2014], which supports our assertion that the somatosensory stimuli used here were not nociceptive. Further work is required to fully exclude the possibility of nociceptive activation in these participants.
In conclusion, our results clearly support the side‐to‐side differences in S1 representation in people with CRPS of the upper limb. However, they also clearly suggest that this difference is best explained by a larger than normal representation of the healthy, unaffected hand, not a smaller than normal representation of the CRPS‐affected hand, a possibility that has not hitherto been considered. Indeed, this finding is in contrast to the widely accepted view and strongly suggests we need to reconsider the nature of cortical reorganization in people with CRPS.
Supporting information
Supplementary Information
ACKNOWLEDGMENT
The authors thank Dr Mushin Karim and Dr Jörg Pfannmöller for their technical assistance with this study.
CRPS DIAGNOSTIC CRITERIA
Table 4.
| 1. Continuing pain, which is disproportionate to any inciting event | |
| 2. Must report at least one symptom in three of the four categories below: | |
| Sensory | Reports of hyperesthesia and/or allodynia |
| Vasomotor | Reports of temperature asymmetry and/or skin color changes and/or skin color asymmetry |
| Sudomotor/Oedema | Reports of oedema and/or sweating changes and/or sweating asymmetry |
| Motor/Trophic | Reports of decreased range of motion and/or motor dysfunction (weakness, tremor, and dystonia) and/or trophic changes (hair, nail, and skin) |
| 3. Must display at least one sign at time of evaluation in two or more of the following categories: | |
| Sensory | Evidence of hyperalgesia (to pinprick) and/or allodynia (to light touch and/or temperature sensation and/or deep somatic pressure and/or joint movement) |
| Vasomotor | Evidence of temperature asymmetry (>1°C) and/or skin color changes and/or asymmetry |
| Sudomotor/Oedema | Evidence of oedema and/or sweating changes and/or sweating asymmetry |
| Motor/Trophic | Evidence of decreased range of motion and/or motor dysfunction (weakness, tremor, and dystonia) and/or trophic changes (hair, nail, and skin) |
| 4. There is no other diagnosis that better explains the signs and symptoms | |
From Harden et al., [2007]
This work performed at Neuroscience Research Australia, Sydney, NSW, Australia.
Conflict of interest: Nothing to report
J.H.M. reports no disclosures
REFERENCES
- Acerra NE, Moseley GL (2005): Dysynchiria: Watching the mirror image of the unaffected limb elicits pain on the affected side. Neurology 65:751–753. [DOI] [PubMed] [Google Scholar]
- Ball T, Breckel TPK, Mutschler I, Aertsen A, Schulze‐Bonhage A, Hennig J, Speck O (2012): Variability of fMRI‐response patterns at different spatial observation scales. Hum Brain Mapp 33:1155–1171. [DOI] [PMC free article] [PubMed] [Google Scholar]
- Bennett CM, Wolford GL, Miller MB (2009): The principled control of false positives in neuroimaging. Soc Cogn Affect Neurosci 4:417–422. [DOI] [PMC free article] [PubMed] [Google Scholar]
- Brett M, Johnsrude IS, Owen AM (2002): The problem of functional localization in the human brain. Nat Rev Neurosci 3:243–249. [DOI] [PubMed] [Google Scholar]
- Bushnell MC, Duncan GH, Hofbauer RK, Ha B, Chen JI, Carrier B (1999): Pain perception: Is there a role for primary somatosensory cortex? Proc Natl Acad Sci USA 96:7705–7709. [DOI] [PMC free article] [PubMed] [Google Scholar]
- Butterworth S, Francis S, Kelly E, McGlone F, Bowtell R, Sawle GV (2003): Abnormal cortical sensory activation in dystonia: An fMRI study. Mov Disord 18:673–682. [DOI] [PubMed] [Google Scholar]
- Dale AM, Sereno MI (1993): Improved localization of cortical activity by combining EEG and MEG with MRI cortical surface reconstruction: A linear approach. J Cogn Neurosci 5:162–176. [DOI] [PubMed] [Google Scholar]
- Dale AM, Liu AK, Fischl BR, Buckner RL, Belliveau JW, Lewine JD, Halgren E (2000): Dynamic statistical parametric mapping: Combining fMRI and MEG for high‐resolution imaging of cortical activity. Neuron 26:55–67. [DOI] [PubMed] [Google Scholar]
- Di Pietro F, McAuley JH, Parkitny L, Lotze M, Wand BM, Moseley GL, Stanton TR (2013): Primary somatosensory cortex function in Complex Regional Pain Syndrome: A systematic review and meta‐analysis. J Pain 14:1001–1018. [DOI] [PubMed] [Google Scholar]
- Dimyan MA, Cohen LG (2011): Neuroplasticity in the context of motor rehabilitation after stroke. Nat Rev Neurol 7:76–85. [DOI] [PMC free article] [PubMed] [Google Scholar]
- Eickhoff SB, Stephan KE, Mohlberg H, Grefkes C, Fink GR, Amunts K, Zilles K (2005): A new SPM toolbox for combining probabilistic cytoarchitectonic maps and functional imaging data. NeuroImage 25:1325–1335. [DOI] [PubMed] [Google Scholar]
- Flor H, Braun C, Elbert T Birbaumer N (1997): Extensive reorganization of primary somatosensory cortex in chronic back pain patients. Neurosci Lett 224:5–8. [DOI] [PubMed] [Google Scholar]
- Flor H, Nikolajsen L Staehelin, Jensen T (2006): Phantom limb pain: A case of maladaptive CNS plasticity? Nat Rev Neurosci 7:873–881. [DOI] [PubMed] [Google Scholar]
- Francis ST, Kelly EF, Bowtell R, Dunseath WJR, Folger SE, McGlone F (2000): fMRI of the responses to vibratory stimulation of digit tips. NeuroImage 11:188–202. [DOI] [PubMed] [Google Scholar]
- Frettlöh J, Hüppe M, Maier C (2006): Severity and specificity of neglect‐like symptoms in patients with complex regional pain syndrome (CRPS) compared to chronic limb pain of other origins. Pain 124:184–189. [DOI] [PubMed] [Google Scholar]
- Harden RN, Bruehl S, Stanton‐Hicks M, Wilson PR (2007): Proposed new diagnostic criteria for complex regional pain syndrome. Pain Med 8:326–331. [DOI] [PubMed] [Google Scholar]
- Harris AJ (1999): Cortical origin of pathological pain. Lancet 354:1464–1466. [DOI] [PubMed] [Google Scholar]
- Henry DE, Chiodo AE, Yang W (2011): Central nervous system reorganization in a variety of chronic pain states: A review. Phys Med Rehabil 3:1116–1125. [DOI] [PubMed] [Google Scholar]
- Jänig W, Baron R (2002): Complex regional pain syndrome is a disease of the central nervous system. Clin Auton Res 12:150–164. [DOI] [PubMed] [Google Scholar]
- Jones LA, Lederman SJ (2006): Neurophysiology of hand function. Human Hand Function. In: Carlin C, editor. New York: Oxford University Press; pp 24–43. [Google Scholar]
- Juottonen K, Gockel M, Silen T, Hurri H, Hari R, Forss N (2002): Altered central sensorimotor processing in patients with complex regional pain syndrome. Pain 98:315–323. [DOI] [PubMed] [Google Scholar]
- Lewis JS, Kersten P, McCabe CS, McPherson, KM Blake DR (2007): Body perception disturbance: A contribution to pain in complex regional pain syndrome (CRPS). Pain 133:111–119. [DOI] [PubMed] [Google Scholar]
- Maihöfner C, Handwerker HO, Neundörfer B, Birklein F (2003): Patterns of cortical reorganization in complex regional pain syndrome. Neurology 61:1707–1715. [DOI] [PubMed] [Google Scholar]
- Maihöfner C, Seifert F, Markovic K (2010): Complex regional pain syndromes: New pathophysiological concepts and therapies. Eur J Neurol 17:649–660. [DOI] [PubMed] [Google Scholar]
- Mancini F, Haggard P, Iannetti GD, Longo MR, Sereno MI (2012): Fine‐grained nociceptive maps in primary somatosensory cortex. J Neurosci 32:17155–17162. [DOI] [PMC free article] [PubMed] [Google Scholar]
- Manganotti P, Acler M, Zanette GP, Smania N, Fiaschi A (2008): Motor cortical disinhibition during early and late recovery after stroke. Neurorehabil Neural Repair 22:396–403. [DOI] [PubMed] [Google Scholar]
- Marinus J, Moseley GL, Birklein F, Baron R, Maihofner C, Kingery WS, van Hilten JJ (2011): Clinical features and pathophysiology of complex regional pain syndrome. Lancet Neurol 10:637–648. [DOI] [PMC free article] [PubMed] [Google Scholar]
- McCabe CS, Blake DR (2007): Evidence for a mismatch between the brain's movement control system and sensory system as an explanation for some pain‐related disorders. Curr Pain Headache Rep 11:104–108. [DOI] [PubMed] [Google Scholar]
- McCabe CS, Haigh RC, Ring EF, Halligan PW, Wall PD, Blake DR (2003): A controlled pilot study of the utility of mirror visual feedback in the treatment of complex regional pain syndrome (type 1). Rheumatology 42:97–101. [DOI] [PubMed] [Google Scholar]
- Moseley GL (2004): Why do people with complex regional pain syndrome take longer to recognize their affected hand? Neurology 62:2182–2186. [DOI] [PubMed] [Google Scholar]
- Moseley GL, Flor H (2012): Targeting cortical representations in the treatment of chronic pain. Neurorehabil Neural Repair 26:646–652. [DOI] [PubMed] [Google Scholar]
- Moseley GL, Gallace A, Spence C (2009): Space‐based, but not arm‐based, shift in tactile processing in complex regional pain syndrome and its relationship to cooling of the affected limb. Brain 132:3142–3151. [DOI] [PubMed] [Google Scholar]
- Moseley GL, Gallace A, Spence C (2012): Bodily illusions in health and disease: Physiological and clinical perspectives and the concept of a cortical 'body matrix'. Neurosci Biobehav Rev 36:34–46. [DOI] [PubMed] [Google Scholar]
- Moseley GL, Gallace A, Di Pietro F, Spence C, Iannetti GD (2013): Limb‐specific autonomic dysfunction in complex regional pain syndrome modulated by wearing prism glasses. Pain 154:2463–2468. [DOI] [PubMed] [Google Scholar]
- Moseley GL, Herbert RD, Parsons T, Lucas S, Van Hilten JJ, Marinus J (2014): Intense pain soon after wrist fracture strongly predicts who will develop Complex Regional Pain Syndrome: Prospective cohort study. J Pain 15:16–23. [DOI] [PubMed] [Google Scholar]
- Murase N, Duque J, Mazzocchio R, Cohen LG (2004): Influence of interhemispheric interactions on motor function in chronic stroke. Ann Neurol 55:400–409. [DOI] [PubMed] [Google Scholar]
- Nelson AJ, Chen R (2008): Digit somatotopy within cortical areas of the postcentral gyrus in humans. Cereb Cortex 18:2341–2351. [DOI] [PubMed] [Google Scholar]
- Nelson AJ, Staines WR, Graham SJ, McIlroy WE (2004): Activation in SI and SII: The influence of vibrotactile amplitude during passive and task‐relevant stimulation. Cogn Brain Res 19:174–184. [DOI] [PubMed] [Google Scholar]
- Nieuwenhuis S, Forstmann BU, Wagenmakers EJ (2011): Erroneous analyses of interactions in neuroscience: A problem of significance. Nat Neurosci 14:1105–1107. [DOI] [PubMed] [Google Scholar]
- Pleger B, Tegenthoff M, Schwenkreis P, Janssen F, Ragert P, Dinse HR, Völker B, Zenz M, Maier C (2004): Mean sustained pain levels are linked to hemispherical side‐to‐side differences of primary somatosensory cortex in the complex regional pain syndrome I. Exp Brain Res 155:115–119. [DOI] [PubMed] [Google Scholar]
- Pleger B, Tegenthoff M, Ragert P, Forster A‐F, Dinse HR, Schwenkreis P, Nicolas V, Maier C (2005): Sensorimotor retuning [corrected] in complex regional pain syndrome parallels pain reduction.[Erratum appears in Ann Neurol. 2005 Apr;57(4):609]. Ann Neurol 57:425–429. [DOI] [PubMed] [Google Scholar]
- Schwenkreis P, Maier C, Tegenthoff M (2009): Functional imaging of central nervous system involvement in complex regional pain syndrome. Am J Neuroradiol 30:1279–1284. [DOI] [PMC free article] [PubMed] [Google Scholar]
- Sörös P, Knecht S, Imai T, Gürtler S, Lütkenhöner B, Ringelstein EB, Henningsen H (1999): Cortical asymmetries of the human somatosensory hand representation in right‐ and left‐handers. Neurosci Lett 271:89–92. [DOI] [PubMed] [Google Scholar]
- Swart CMA, Stins JF, Beek PJ (2009): Cortical changes in complex regional pain syndrome (CRPS). Eur J Pain 13:902–907. [DOI] [PubMed] [Google Scholar]
- Tommerdahl M, Delemos KA, Whitsel BL, Favorov OV, Metz CB (1999): Response of anterior parietal cortex to cutaneous flutter versus vibration. J Neurophysiol 82:16–33. [DOI] [PubMed] [Google Scholar]
- Vallar G, Perani D (1986): The anatomy of unilateral neglect after right‐hemisphere stroke lesions. A clinical/CT‐scan correlation study in man. Neuropsychologia 24:609–622. [DOI] [PubMed] [Google Scholar]
- Vartiainen NV, Kirveskari E, Forss N (2008): Central processing of tactile and nociceptive stimuli in complex regional pain syndrome. Clin Neurophysiol 119:2380–2388. [DOI] [PubMed] [Google Scholar]
- Weibull A, Björkman A, Hall H, Rosén B, Lundborg G, Svensson J (2008): Optimizing the mapping of finger areas in primary somatosensory cortex using functional MRI. Magn Reson Imaging 26:1342–1351. [DOI] [PubMed] [Google Scholar]
Associated Data
This section collects any data citations, data availability statements, or supplementary materials included in this article.
Supplementary Materials
Supplementary Information