

Abstract
Despite extensive research, psychiatry remains an essentially clinical and, therefore, subjective clinical discipline, with no objective biomarkers to guide clinical practice and research. Development of psychiatric biomarkers is consequently important. A promising approach involves the use of machine learning with neuroimaging, to make predictions of diagnosis and treatment response for individual patients. Herein, we describe predictions of attention deficit hyperactivity disorder (ADHD) diagnosis using structural T 1 weighted brain scans obtained from 34 young males with ADHD and 34 controls and a support vector machine. We report 93% accuracy of individual subject diagnostic prediction. Importantly, automated selection of brain regions supporting prediction was used. High accuracy prediction was supported by a region of reduced white matter in the brainstem, associated with a pons volumetric reduction in ADHD, adjacent to the noradrenergic locus coeruleus and dopaminergic ventral tegmental area nuclei. Medications used to treat ADHD modify dopaminergic and noradrenergic function. The white matter brainstem finding raises the possibility of “catecholamine disconnection or dysregulation” contributing to the ADHD syndrome, ameliorated by medication. Hum Brain Mapp 35:5179–5189, 2014. © 2014 Wiley Periodicals, Inc.
Keywords: ADHD, brainstem, machine learning, DARTEL
INTRODUCTION
Attention deficit hyperactivity disorder (ADHD) affects around 5% of the population under the age of 16 and is the most commonly diagnosed psychiatric disorder in children [Banaschewski et al., 2010]. Medications used to treat ADHD include methylphenidate, dextroamphetamine, and atomoxetine, which act to increase release of dopamine (DA) and noradrenaline (NA). Abnormalities of the DA and NA systems have been widely implicated in studies of ADHD [Del Campo et al., 2011]. In three recent meta‐analyses of imaging studies of ADHD which considered the whole brain, the DA rich basal ganglia was the only brain region found to be consistently reduced in gray matter [Ellison‐Wright et al., 2008; Frodl and Skokauskas, 2012; Nakao et al., 2011]. Reduced DA release and reduced D2 receptors have been reported in adult ADHD caudate [Volkow et al., 2007b] and ventral striatum [Volkow et al., 2007a]. It has been suggested that stimulant medications correct an underlying hypo‐dopaminergic disorder, improving cognitive and behavioral deficits [Del Campo et al., 2011].
Although studies of the DA system have attracted the most attention, possible abnormalities of the NA system have also been recognized [Arnsten, 1998; Arnsten et al., 1996; Del Campo et al., 2011; Levy and Swanson, 2001]. NA cell bodies are primarily located in the brainstem locus coeruleus with axonal projections to the prefrontal cortices, which are a substrate for cognitive functions such as response inhibition and working memory, often reported as impaired in ADHD [Arnsten and Li, 2005; Del Campo et al., 2011; Seidman et al., 2005]. The importance of NA is underlined by atomoxetine, a relatively selective NA reuptake inhibitor [Chamberlain et al., 2006]. To our knowledge, there are no imaging studies of the NA system in ADHD. Conceivably, enhancement of NA function could help correct an additional underlying hypo‐noradrenergic abnormality.
The majority of structural brain‐imaging studies use conventional voxel‐based morphometry (VBM) or volumetric analyses, which test for hypothesized group level (e.g., ADHD vs. control) abnormalities but cannot address how specific any abnormalities are for individual patients. However, a promising new method involves combining machine learning techniques such as a support vector machine (SVM), with automated selection of informative brain regions (feature selection), to train diagnostic classifiers. These methods have been reported to make highly accurate predictions in adults with major depression [Mwangi et al., 2012], Alzheimer's Disease [Klöppel et al., 2008], and Autism Spectrum Disorder [Ecker et al., 2010].
Attempting to predict diagnostic status between children and adolescents with ADHD and healthy controls using machine learning‐based techniques has become increasingly popular in the literature. Studies using only structural MR images achieved classification accuracies of 67% [Chang et al., 2012] and 79% [Lim et al., 2013], although two other studies combined resting state fMRI and structural MRI to the same classification problem, achieving accuracies of 58% [Eloyan et al., 2012] and 76% [Cheng et al., 2012]. However, it is important to note that none of the above studies investigated the white matter component of the structural images. Using resting state fMRI connectivity data, accuracies of 65% and 85% have been previously reported for the prediction of ADHD vs. controls [Solmaz et al., 2012; Zhu et al., 2008] and resting state fMRI functional connectivity data provided accuracies of 56%, 66%, and 80% [Colby et al., 2012; Dai et al., 2012; Liang et al., 2012]. Bohland et al [2012] combined resting state fMRI functional connectivity, T 1 weighted brain images and non‐imaging features into one classifier which achieved 80% accuracy. The highest accuracy achieved using structural MRI, 79%, was associated with brain regions which included the caudate, ventral striatum/putamen, insula, brainstem, thalamus, hypothalamus, precuneus/cuneus, hippocampus, amygdala, cerebellar vermis and inferior, and superior parietal regions [Lim et al., 2013].
Studies using non‐prediction group level analysis methods have provided evidence for subtle reductions in total brain volume in ADHD [Castellanos et al., 2002] and consistent evidence for basal ganglia gray matter reductions [Ellison‐Wright et al., 2008; Frodl and Skokauskas, 2012; Nakao et al., 2011]. Caudate reductions may normalize as a child matures toward adulthood [Castellanos et al., 2002], which may be clinically relevant as the caudate is associated with motor activity, and there is often a relative reduction in hyperactivity later in development. Cerebellar gray matter volume is frequently reported to be decreased in ADHD [Berquin et al., 1998; Bussing et al., 2002; Castellanos et al., 1996; Hill et al., 2003; Lim et al., 2013; Mostofsky et al., 1998] and decreased gray matter volume in the temporal lobes has been reported by Castellanos et al. [1996]. The amygdala has previously been reported to show either no significant changes in gray matter volume [Castellanos et al., 1996; Filipek et al., 1997] or a decrease in volume [Lim et al., 2013; Plessen et al., 2006].
There are fewer known group level abnormalities in white matter as it is less frequently investigated using structural MRI [Hermann et al., 2007]. Although no differences in white matter volume were reported in one small study [Carmona et al., 2005], a larger study described significantly reduced total white matter volume and significant reductions in the frontal, parietal, temporal, and occipital lobes in ADHD [Castellanos et al., 2002]. Hermann et al. [2007] reported a significantly decreased brainstem volume in patients with both ADHD and epilepsy compared with a healthy control group and a patient group with epilepsy alone compared with the control group.
Feature selection is an important part of this study as there are many brain regions which do not provide useful information for diagnostic prediction. Inclusion of these regions impairs the accuracy of prediction. Automated feature selection identifies brain regions supporting high accuracy individual classification, and therefore localizes structurally abnormal brain regions. SVM analysis consists of two stages: training a classifier, then testing its accuracy using data not used for training (cross‐validation). One cross‐validation method involves removing a single subject from the dataset, then using the remaining subjects to optimize the classifier, such that entering the left‐out subject constitutes a prediction on novel data (leave one out cross validation). This approach is ideal for clinical use, as it maximizes the available data for “training,” whilst not assuming prior knowledge of diagnostic status for the “left out” subject. In cross‐sectional studies, leave one out cross validation is repeated with a different subject left out until all scans have been predictively classified; in longitudinal studies the process is repeated as new subject data is acquired and the outcomes of previous predictions become known.
This study used DARTEL, feature selection with SVM and leave one out cross‐validation, to develop a method for predicting, with best accuracy, individual diagnostic status (ADHD vs. controls) using T 1 weighted structural MRI scans. T 1 weighted imaging has similar advantages to resting state fMRI in not requiring comprehension and cooperation with a paradigm but also has the additional advantage of being more readily available at scanning centers and to provide better anatomical localization than fMRI. Our main hypothesis was that high accuracy classification would be supported by brainstem and basal ganglia abnormalities highlighted during feature selection, given the common pharmaceutical actions of medications used to treat ADHD, and the anatomical locations of DA and NA nuclei.
METHOD
Subjects
Structural T 1 weighted scans were obtained from subjects participating in neuroimaging studies at the Research Centre in Juelich, Germany. Informed consent was obtained from all volunteers and their parents according to the Declaration of Helsinki. The study protocols were approved by the Ethics Committee of the Rheinisch‐Westfälische Technische Hochschule, Aachen University Hospital, Germany. Volunteers were compensated for participation in the study.
Thirty‐four males with a diagnosis of ADHD were recruited from the Department of Child and Adolescent Psychiatry and Psychotherapy in Aachen. Initial diagnosis was made by experienced clinicians according to DSM‐IV [American Psychiatric Association, 2000] criteria and confirmed by an independent rater using a semistructured diagnostic interview: either the K‐SADS‐PL [Kaufman et al., 1997] or K‐DIPS [Schneider et al., 2009]. All parents were asked to complete a German Questionnaire on ADHD symptoms, the FBB‐HKS [Döpfner and Lehmkuhl, 1998], which includes DSM‐IV and ICD‐10 items for ADHD diagnosis. Three subjects in the ADHD group fulfilled additional criteria for Externalizing Disorders (Oppositional Defiant Disorder and Conduct Disorder) and one subject had comorbid Dyslexia. Exclusion criteria included potentially confounding diagnoses such as Psychosis, Mania, Major Depression or Substance Misuse. Ten ADHD participants were being treated with either short‐ or long‐acting MPH (Ritalin, Concerta or Equasym) which was stopped at least 48 h before scanning. None were taking any other psychotropic drugs.
Thirty‐four male typically developing controls were recruited from local schools and underwent an extensive psychiatric examination using the same standardized, semistructured interviews as the ADHD volunteers. None of the controls had a history of current or past psychiatric or neurological disorder and none were taking medication. ADHD and control volunteers had an Intelligence Quotient above 80 as assessed by either the Culture Fair Intelligence Test 20 [Weiß, 1998] or the WISC (Version III or IV) [Wechsler, 1991, 2004]. Handedness was assessed using the Edinburgh Handedness Inventory [Oldfield, 1971]. Apart from two left‐handed subjects in the ADHD group and one ambidextrous subject in the control group, all subjects were right‐handed.
Age and IQ did not differ significantly (t‐test, P > 0.1) between groups. The ADHD group mean age was 12.5 years (standard deviation 2.3) mean IQ was 99.8 (standard deviation 11.5). The control group mean age was 13.2 years (standard deviation 1.0) and the mean IQ 103.7 (standard deviation 10.0).
A particular strength of the study is that the dataset is relatively heterogeneous—particularly with regard to comorbidity, medication history, and fairly wide age range during a time of dynamic brain development. If high classification accuracy can be achieved using this dataset then it gives more confidence that the technique could achieve similar results in a more homogeneous population.
Image Acquisition
For each participant structural whole‐brain images were acquired using a 1.5 T Siemens Sonata scanner (Siemens, Erlangen, Germany) using an isotropic T 1‐weighted MP‐RAGE (magnetisation‐prepared rapid acquisition gradient echo) sequence with the following parameters: TR = 2,200 ms, TE = 3.93 ms, flip angle = 15°, FOV = 256 mm, matrix = 180 × 256, 160 slices, voxel size 1 × 1 × 1 mm, slice thickness 1 mm.
Image Quality Control
The study was designed to reduce the possibility of movement during scanning, particularly in the ADHD group, from affecting results. A number of different methods were used to ensure there were no significant differences in data quality between groups.
Yerys et al. [2009] argued that the age of a child may be a more significant factor than diagnosis (including ADHD) when investigating fMRI scan success rates. In this study by Yerys et al., reasons for scan failures included movement during scan and inattention during fMRI task with younger children having far more unsuccessful scans than older children. Therefore, this study therefore only used data from volunteers older than 8.5 years and the ADHD and control groups were carefully matched for age, such that there were no significant differences.
All scans were visually inspected for motion artefacts which appear as blurring or ghosting [McRobbie et al., 2010]. No scans exhibited blurring, ghosting or other artefacts so no scans were excluded from analysis.
To ensure there was no bias in the assessment of image quality between groups, an experienced senior radiographer who was not involved in this study was asked to rank the structural images in three categories: “Good,” “Fair,” or “Poor,” in a blinded fashion. No scans were ranked in the “Poor” category and there were no significant differences in the number of “Good” and “Fair” ratings between groups (χ 2 = 0.36, P = 0.55).
Due to the results presented later in the article, in addition to ranking the whole brain image quality, the image quality in the brainstem (particularly the pons) was separately rated by the same radiographer. Again, no “Poor” images were identified and no significant differences in image quality were identified between groups (χ 2 = 1.94, P = 0.16).
In addition to ranking the quality of each scan, the radiographer was asked to attempt to predict the diagnosis of each subject. The radiographer achieved an accuracy of 51.5% (35/68, P = 0.8), demonstrating no significant ability of predicting diagnosis.
Finally, a quantitative analysis which compared the image blurring in ADHD and control scans was done. Movement during scanning results in blurring, resulting in an increased spatial autocorrelation, which is the amount of correlation between voxels in a given brain image. Spatial autocorrelation [Slotnick and Schacter, 2006] in each of the three spatial dimensions was calculated using an established method (https://www2.bc.edu/~slotnics/scripts.htm) for each structural MRI scan. Again, no significant differences were identified between ADHD and control groups.
Image Pre‐processing
The raw DICOM images were converted to analyze format using MRIConvert (http://lcni.uoregon.edu/~jolinda/MRIConvert/). Image pre‐processing was done using the DARTEL toolbox [Ashburner, 2007] as implemented in SPM8 (http://www.fil.ion.ucl.ac.uk/spm). The DARTEL procedure involves segmentation of T 1 weighted images into separate gray matter, white matter, and cerebrospinal fluid compartment images. In a white matter segmented image, for example, the white matter intensity at a given voxel corresponds to the estimated probability of white matter being present at that voxel. The DARTEL procedure involved creation of a study‐specific anatomical template for spatial normalization. Creation of a study‐specific template was important as participants were at an earlier stage of development than the adults who contributed to the default SPM8 anatomical template. The DARTEL procedure included modulation to compensate for potential spatial normalization rescaling [Ashburner, 2007]. The resultant images were smoothed with an 8 mm full‐width at half‐maximum Gaussian kernel.
Individual Scan Classification
Machine learning allowing individual predictions was implemented in Matlab (The Mathworks) using an SVM toolbox [Schwaighofer, 2001] and custom Matlab scripts (see Supporting Information for a mathematical overview of the SVM algorithm). As described above, SVM analysis consisted of two stages: training the classifier, then testing the accuracy using data not used for training. Standard leave‐one‐out cross‐validation (LOOCV) [Cristianini and Shawe‐Taylor, 2000] was used for training and feature selection was used to identify brain regions supporting predictive classification.
Training a linear SVM involves varying one parameter (soft‐margin parameter, which affects how much a wrongly classified scan is weighted) during cross‐validation. Training a non‐linear SVM involves optimizing two or more parameters depending on the choice of non‐linear kernel. For the most common non‐linear kernel functions two parameters require optimization (the soft‐margin parameter and an additional “kernel width” parameter, the latter having an effect of scaling the non‐linear kernel function). The more parameters that require to be optimized, the longer the training stage typically takes.
In cross‐validation, for each prediction of a left‐out subject, all parameters must be tuned using the training set before predictive classification. In this study, parameter selection was performed using an inner LOOCV procedure within the training set when all possible parameters were tested using a “grid search” procedure: i.e., all combinations of variables were tested on the inner LOOCV and the selection of optimal parameters based on the highest “training accuracy.” It is important to distinguish the accuracy during training (obtained from the inner LOOCV), which is used to guide parameter selection, from the true predictive accuracy achieved during the testing stage with novel data. We only report the true predictive accuracy achieved during the testing stage.
As expected, a linear SVM classifier which used voxels from the whole brain achieved poor predictive accuracy, therefore a feature selection method, which selected localized regions of the brain for SVM analysis in an automated manner [Bray et al., 2009; Klöppel et al., 2008] was used. Poor predictive accuracy when using whole brain data is unsurprising because, when a large number of voxels are used with a SVM, most of these voxels are redundant [Dash and Liu, 1997]. Feature selection can be successful as it excludes many voxels that confer no useful information for prediction, but introduce noise and correlated information, so degrading classifier performance. Feature selection was applied to a non‐linear (Gaussian) SVM to investigate whether this improved predictive accuracy. The results from the Gaussian SVM are reported in the main text, whereas the linear SVM results are included in the Supporting Information.
A simple feature selection approach was used: “mean‐threshold.” To ensure no prior information about the left out subject was “leaked to testing” during feature selection, we performed feature selection during the parameter selection stage (inner LOOCV procedure) only. This ensured the features (brain regions) selected for classification were entirely independent from the “held‐out” image which was predictively classified.
This mean‐thresholding method involved calculating the average image for each group (ADHD and controls), during the training stage (i.e., not including the single “left‐out” scan to be predictively classified). The absolute difference between the average ADHD image in the training set and the average control image in the training set was then calculated. Each voxel was ordered from the lowest to the highest absolute difference between the average images. Absolute difference values typically ranged between 0 and ∼0.1 in this dataset. The thresholding process of the mean‐thresholding technique involved identifying the optimal absolute difference cut‐off value for the difference between the average images—all voxels above this cut‐off value were included in the SVM calculation. Further information of the optimization process is contained in the Supporting Information.
Group Level Comparisons
For a conventional group level VBM analysis, the null hypothesis of no difference in brain structure between ADHD participants compared with controls was tested using an unpaired t‐test as implemented in SPM8. Significance was defined using a family‐wise error correction using a customized version of a popular Monte‐Carlo neuroimaging algorithm [Slotnick et al., 2003]. This consisted of a simultaneous requirement for voxels to exceed P < 0.005 in significance and clusters to exceed 139 contiguous voxels using a 6‐voxel connectivity criterion. Using this approach, only clusters of voxels and not individual voxels which meet the criteria are deemed significantly different between groups. Cluster size thresholding is discussed in more detail in the Supporting Information.
RESULTS
Individual Subject SVM Predictions
A Gaussian SVM was used to analyze 34 structural MRI images of children satisfying DSM IV criteria for ADHD and 34 structural MRI images of control subjects aged 8.5 to 18.4 years. Feature selection was implemented using the “mean threshold” procedure which selected voxels (training‐data only) which differed between the ADHD and control groups by more than a given threshold. The analysis was done using; the gray matter compartment of T 1 weighted images (automatically extracted using DARTEL) only, white matter compartment images only, and combined gray and white matter images.
The analysis using white matter images alone resulted in an individual subject predictive accuracy of 93% (mean optimal threshold = 0.0607, sensitivity 1.0, specificity 0.85, χ 2 = 50.6, P << 0.0001). The analysis using gray matter images alone resulted in an accuracy of 63% (mean optimal threshold 0.0608, sensitivity 0.68, specificity 0.59, χ 2 = 4.8, P < 0.028), and that with gray and white matter images combined an accuracy of 81% (mean optimal threshold = 0.0653, sensitivity 0.74, specificity 0.88, χ 2 = 26.5, P << 0.0001). Consequently, the most accurate predictions were supported by white matter images alone. Adding gray matter images did not improve the accuracy of prediction.
Brain Regions identified Using Feature Selection
When only white matter images were used for analysis, the largest brain region supporting 93% accuracy of prediction was located in the brainstem. As shown in Figure 1a, this comprised a large region in the central pons with a small extension to the midbrain, and a smaller bilateral region within the midbrain. For illustration, Figure 2 shows the locations of the locus coeruleus [Keren et al., 2009] and ventral tegmental area nuclei [Guitart‐Masip et al., 2012; Mai et al., 1997], in relation to the brainstem region used for classification. This abnormality may involve the axonal projections to and from the locus coeruleus and ventral tegmental area. Smaller regions in the bilateral frontal pole white matter deep to Broadmann's Area (BA) 10 and pyramidal tract were also identified, which might be related to prefrontal and motor abnormalities.
Figure 1.
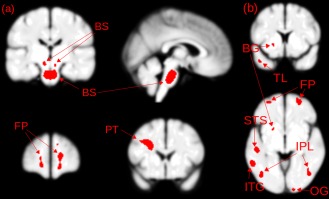
(a) Feature selection (Gaussian SVM) identified brain regions in white matter. BS—brainstem regions comprising a lower region in the pons and smaller bilateral region in the mid‐brain; FP—frontal pole white matter; PT—pyramidal tracts (b) feature selection (Gaussian SVM) brain regions identified using gray matter. BG—basal ganglia; FP—frontal pole; STS—superior temporal sulcus; IPL—inferior parietal lobule; ITG—inferior temporal gyrus; TL—temporal lobe; OG—occipital gyrus. [Color figure can be viewed in the online issue, which is available at http://wileyonlinelibrary.com.]
Figure 2.
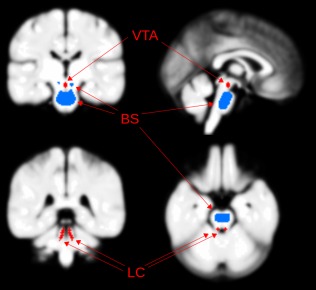
Locations of the noradrenergic locus coeruleus [Anderson et al., 2002] and dopaminergic ventral tegmental area nuclei (VTA), in relation to the brainstem (BS) white matter region used for classification. LC and VTA locations from previous studies [Guitart‐Masip et al., 2012; Keren et al., 2009; Mai et al., 1997]. [Color figure can be viewed in the online issue, which is available at http://wileyonlinelibrary.com.]
When only gray matter images were used for analysis, regions supporting individual prediction at accuracy of 63% were identified in the DA rich putamen, bilateral frontal pole gray matter (BA 10), and bilateral inferior parietal lobule. Gray matter regions are shown in Figure 1b.
VBM Analysis
Brain regions identified using feature selection were compared with the results of a VBM group level analysis (P < 0.005, whole brain level significance). In the VBM analysis, only white and gray matter reductions were identified in ADHD subjects. As shown in Figure 3, white matter regions were identified in the brainstem and gray matter regions in the putamen, both of which overlapped with feature selection identified regions, indicating that prediction was based on significant white and gray matter reductions in the ADHD subjects.
Figure 3.
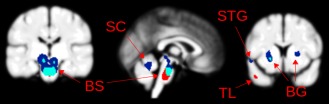
Brain regions identified using feature selection (red), voxel based morphometry (dark blue), and regions common to both analyses (light blue). BS—brain stem; SC—superior cerebellum; BG—basal ganglia; TL—temporal lobe; STG—superior temporal gyrus. [Color figure can be viewed in the online issue, which is available at http://wileyonlinelibrary.com.]
Volumetric Analysis of the Pons
As SPM identifies the brainstem as composing of only white matter during segmentation, the identification of a brainstem reduction in children and adolescents with ADHD merited further investigation, to determine whether the result comes from a genuine decrease in white matter volume or from segmentation errors. If the result was due to segmentation errors then the reduction in white matter volume in patients would be negated by an increase in gray matter in the patient group due to part of the brainstem being incorrectly identified as gray matter during the segmentation procedure. If there was a genuine reduction in brainstem volume, then it would be expected that the white matter volume would be found to be significantly reduced but gray matter volume would not be significantly increased. If the pons volume was reduced in ADHD then when images from these subjects were normalized, the pons volume would need to be increased to normalize the images toward the study‐specific template. As modulation was used during normalization, the probability of white matter within this region would therefore be decreased to compensate for the increase in volume, with an opposite effect for the control group scans.
The volumetric analysis involved performing a rigid‐body coregistration of all segmented images to ensure the rear of the brainstem was as close to vertical as possible, such that cuboids containing this region‐of‐interest could be created through manual identification of landmark coordinates for each subject. The volume of gray and white matter in these bounding cuboids were calculated for each subject and compared between groups. As predicted from the VBM analysis, the ADHD group were found to have a significantly lower (7.5%) mean white matter volume compared with controls (P = 0.005). There was no significant difference between the level of gray matter surrounding the brainstem between groups (P = 0.25) with the ADHD group found to have less gray matter on average. The superior–inferior height and anterior–posterior depth were significantly reduced (P = 0.035 and P = 0.028, respectively), but there was no significant difference in the lateral width.
These results provide evidence that the reduction identified through both the VBM analysis and feature selection (implemented during machine learning) in the brainstem in ADHD subjects is due to a decrease in volume. Importantly, a reduction in brainstem volume in children and adolescents with both ADHD and epilepsy has been reported in the past, which was reduced in comparison with children and adolescents with epilepsy alone and also a healthy control group [Hermann et al., 2007].
Further Analysis to Investigate a Potential Medication Effect
To investigate a potential medication confound, a sub‐group analysis was performed to investigate whether there are any significant between‐group or sub‐group differences. Significant differences in brainstem volume (as calculated using the volumetric analysis, P = 0.005, unmedicated < controls) were found when comparing the unmedicated ADHD subjects with controls. Comparing the medicated ADHD group with the control group, there was no significant difference in brainstem volume; the medicated ADHD group had an average brainstem volume intermediate between the average volumes for the unmedicated ADHD and control groups. No significant difference may be due to the low power of this calculation (10 subjects in the medication group). Notably though, the medicated ADHD group had significantly lower ages than the control group (P = 0.014) which is another limitation of this subgroup analysis. When comparing the medicated and unmedicated ADHD groups there were possible trends for differences in age, inattention (as rated by the FBB‐HKS subscore [Döpfner and Lehmkuhl, 1998]) and brainstem width (P = 0.059 (med < unmed), P = 0.068 (med > unmed), and P = 0.061 (med > unmed), respectively), although there were no differences at the chosen threshold of significance.
A group level analysis comparing medicated vs. unmedicated ADHD subjects (matched for age and IQ) identified white matter differences. However, none of the medication‐related regions overlapped with the white matter regions used for predictive classification and none were found in the brainstem (see Supporting Information for more detail on both gray and white matter analyses). Despite the power being limited in the comparison between medicated and unmedicated subjects with ADHD, if the medicated subjects were driving the diagnostic classification then the brain regions used in the classification would be expected to be significantly different in the medicated vs. unmedicated group comparison. The fact that the brainstem was not identified as significantly different in the medicated vs. unmedicated VBM analysis suggests medication did not drive the accuracy of the prediction of ADHD vs. control.
Furthermore, a white matter predictive classification analysis using only the 24 unmedicated subjects and a control group of 24 subjects matched for age and IQ, achieved a significant diagnostic prediction accuracy of 85% (sensitivity = 0.96, specificity = 0.75, χ 2 = 22.3, P < 0.0001). We repeated the calculation only using the 10 medicated subjects and a similarly matched control group and obtained a significant classification accuracy of 75% (sensitivity = 1, specificity = 0.5, χ 2 = 4.3, P < 0.04). We interpret these further analyses as evidence that medication did not affect the overall (unmedicated plus medicated) white matter classification accuracy.
DISCUSSION
It was possible to predictively classify individual scans from patients with ADHD and controls to an accuracy of 93% using only the white matter compartment of T 1 weighted scans. To our knowledge, this is the highest accuracy reported for a predictive classification study in ADHD using “structural” (T 1 weighted) brain scans alone; most have used resting state fMRI though a few have combined resting state fMRI with T 1 data for prediction, and none have used white matter images.
In this study, the largest region supporting 93% accuracy white matter compartment prediction was in the brainstem. Evidence for a brainstem abnormality was supported by a volumetric analysis which found that children and adolescents with ADHD have a significantly decreased white matter volume in this region. In addition, reduced brainstem volume has been reported previously in patients with both ADHD and epilepsy and a patient group with epilepsy alone, suggesting this abnormality is linked with ADHD [Hermann et al., 2007].
The brainstem region identified is adjacent to the more posterior NA locus coeruleus and more anterior DA ventral tegmental area nuclei, which are ellipsoid structures elongated along the axis of the axis of the midbrain and pons [Afshar et al., 1978; Mai et al., 1997]. The bilateral locus coeruleus nuclei lie in the posterior brainstem lateral to the periaqueductal gray matter, the ventral tegmental area lies in the ventral‐medial aspect of the brainstem. The white matter region could therefore contain axonal connections between the locus coeruleus/ventral tegmental area nuclei and rest of the brain, raising the possibility of “catecholamine dysconnection” (i.e., an abnormality in connection) [Stephan et al., 2009], in contrast to “disconnection”) contributing to the ADHD syndrome. If such a dysconnection exists in ADHD, this could provide a plausible explanation why medications which enhance DA and NA function are able to reduce associated behavioral abnormalities.
Several reviews of the neural substrates of attention relevant to ADHD have implicated a distributed network of regions including the brainstem Reticular Activating System (RAS, which includes the locus coeruleus and ventral tegmental area nuclei), ascending white matter pathways from the RAS (mediating arousal), and descending pathways from the prefrontal cortex via the thalamus to the RAS (mediating inhibition), and basal ganglia/frontal lobe abnormalities (e.g., Riccio et al. [2002] and Voeller [1991]). It has been argued that disruption at any level of this system could lead to a behavioral phenotype that resembles ADHD (inattention, difficulty concentrating, distractibility, impulsivity, hyperactivity) [Riccio et al., 2002; Voeller, 1991]. A number of the ADHD and control subjects who contributed T 1 weighted images to this study also took part in an fMRI study of attention [Konrad et al., 2006]. During the alerting component of an attention task, ADHD subjects showed abnormally increased activation at the midbrain‐pons junction at a posterior brainstem region, which the authors suggested was the locus coeruleus [Konrad et al., 2006]. Abnormal functional activity of the locus coeruleus could be linked to decreased white matter connections with the rest of the brain.
Lim et al. [2013] reported that the brainstem was a relevant feature during classification of gray matter images which yielded 79% accuracy—although this region was closer to the midbrain than the DA and NA nuclei in the brainstem. The brain regions that were most relevant to this gray matter‐based prediction included the caudate, ventral striatum/putamen, insula, brainstem, thalamus, hypothalamus, precuneus/cuneus, hippocampus, amygdala, cerebellar vermis, and inferior and superior parietal regions [Lim et al., 2013]. A number of these regions were also identified in this study.
The frequently reported decrease in cerebellar gray matter [Berquin et al., 1998; Bussing et al., 2002; Castellanos et al., 1996; Hill et al., 2003; Lim et al., 2013; Mostofsky et al., 1998] was replicated in our study and we additionally identified a decrease in cerebellar white matter. In addition, we identified decreased gray matter volume in the temporal lobes which has been reported by Castellanos et al. [1996]. Although the amygdala previously been reported to show no significant changes in gray matter volume [Castellanos et al., 1996; Filipek et al., 1997], it has also been reported to show a decrease in volume [Lim et al., 2013; Plessen et al., 2006] as found here.
In addition, reductions in gray matter BA 10 and in white matter deep to BA 10 were identified in prediction analyses. BA 10 functions are diverse, including episodic memory retrieval and “multitask” information processing, with evidence for lateral‐medial and rostral‐caudal functional gradients, implying BA 10 is not a functionally homogeneous region [Gilbert et al., 2006]. The frontal pole cortex has been found to develop late into childhood/adolescence which may increase susceptibility to developmental disorders [Tsujimoto et al., 2011]. Partial disruption of BA 10 and its connections could therefore have widespread effects on cognition. A region of gray matter decrease was identified in the basal ganglia (putamen) replicating previous reports and further suggesting a DA dysfunction in ADHD.
An important aspect of the analysis used in this study is the use of DARTEL. This method involves creation of a brain template from the study images themselves, which is then used to realign and warp the images to a standardized anatomical space. A study specific template was considered particularly important as the brains of children and adolescents are different from those of the adults that were used to create the default SPM templates. Furthermore, DARTEL has also an improved method for warping the MRI images toward the aforementioned study specific template, resulting in more accurately aligned images across subjects [Ashburner, 2007], decreasing inter‐subject variance and therefore increasing the power of subsequent statistical analyses. As a DARTEL‐created template has been shown to perform as well as a specialist atlas of the cerebellum and brainstem (SUIT—http://www.icn.ucl.ac.uk/motorcontrol/imaging/suit.htm) [D'Agata et al., 2011] it is considered to perform accurate normalisation for these regions. The SUIT atlas has since been updated to use the DARTEL approach “for more accurate results.” Although several of the abnormal regions we identified have been reported previously, some have not, and it is possible this is in part a consequence of using DARTEL.
It is important to note that the abnormal region in the brainstem, identified using VBM analysis, the classification algorithm and a volumetric analysis, requires further investigation using Diffusion Tensor Imaging (DTI). As the SPM8 segmentation method classifies almost all of the brainstem and in particular the pons as white matter, it is unclear whether the brainstem abnormalities are due to reduced nuclei volume, or reduced volume of white matter tracts, or abnormal tract integrity in children and adolescents with ADHD.
A potential limitation of this study is stopping medication two days or more before scanning in a minority (29%) of the ADHD subjects. Medication might be associated with structural brain change. Through a sub‐group analysis of the medicated and unmedicated subjects in this study, we found no evidence that previous exposure to medication affected the overall (unmedicated plus medicated) white matter prediction. Another possible limitation is movement during the image acquisition. It's unclear if movement would make classification more accurate or less accurate, but as discussed above, a range of methods were used to exclude significant movement effects. It is important to emphasize that the high classification accuracy achieved here is likely to be linked to scans obtained from the same MR scanners. For example, if images from another scanner were classified with the algorithm trained on scans from a different scanner, it is unlikely that the scans would be classified to the level of accuracy reported here. This is due to subtle differences in images obtained from different scanners [Moorhead et al., 2009). In our experience with different psychiatric syndromes, multicentre classification studies can achieve similar results to single‐centre studies provided there is a sufficient number subjects from each centre in all training sets [Mwangi et al., 2012]. Work on possible scanner related confounds to prediction is required. Whilst the reported method achieved high predictive accuracy, it is important to note that this was in the context of only scans from volunteers with ADHD and controls. Further work would be required to establish the accuracy of the technique if scans from other diagnostic categories were included, and scans from subjects with comorbidities.
A common issue in machine learning studies is overfitting, which occurs when the classifier is able to classify the training data well but is unable to generalize to novel testing data [Johnston et al., 2013]. The classification accuracies described in this article refer to predictions on novel testing data (described fully in the Supporting Information). As the cross‐validation procedure ensures predictions are made on novel data, the accuracies we report are not due to overfitting.
The mean‐thresholding method was chosen as it is one of the simplest and computationally efficient methods. However, a multivariate feature selection technique was also investigated, as described in the Supporting Information. There are many other feature selection techniques which could have been investigated such as t‐tests, ANOVA, Searchlight, and Elastic Net [Guyon and Elisseeff, 2003; Mwangi et al., 2014]. A particularly interesting approach by Zhang and Davatzikos [2013], Optimally discriminative voxel‐based morphometry (ODVBM), addresses the limitations of the traditional Gaussian smoothing of MR images after spatial normalisation and has been reported to be more sensitive than traditional VBM when detecting between‐group differences in schizophrenia, mild cognitive impairment and Alzheimer's disease [Zhang and Davatzikos, 2013]. Further work could include comparing the performances of various feature selection techniques, including mean‐thresholding and ODVBM.
In summary, it was possible to predictively classify scans from individual children and adolescents with ADHD to an accuracy of 93% using the white matter compartment of T 1 weighted images alone. This is of comparable diagnostic accuracy to that reported for general adult psychiatric syndromes [Klöppel et al., 2008; Koutsouleris et al., 2012; Mwangi et al., 2012]. The gray matter‐based prediction achieved a lower, yet comparable, accuracy to similar studies in the literature [Chang et al., 2012; Lim et al., 2013], using many brain regions which have been reported previously such as the decreased putamen volume. A relatively large region of the brainstem supported these predictions, adjacent to the brainstem NA and DA nuclei, raising the possibility of “catecholamine dysconnection” contributing to the ADHD syndrome. The pons was found to be significantly reduced in volume compared with controls, consistent with a previous report on subjects with both ADHD and epilepsy which showed decrease brainstem volume in comparison with an epilepsy group and a control group [Hermann et al., 2007]. Brainstem, prefrontal, and putamen abnormalities accord well with suggestions about the neural substrates of attention and its abnormalities in ADHD [Riccio et al., 2002; Voeller, 1991]. Given the possible heterogeneity of the ADHD syndrome [Fair et al., 2012], the results are encouraging for the identification of consistent imaging biomarkers, that can inform future work into the aetiology, pathophysiology, and clinical management of ADHD. To our knowledge, brainstem white matter has not been specifically investigated in previous studies of ADHD. The brainstem region identified here may constitute a biomarker for ADHD, although it is important to stress that independent studies are required to replicate these findings, investigate the nature of the abnormality using DTI, explore issues of diagnostic syndrome specificity and possible scanner related confounds to prediction.
Supporting information
Supplementary Information Figure S1.
Supplementary Information Figure S2.
Supplementary Information Figure S3.
Supplementary Information Figure S4.
Supplementary Information Figure S5.
Supplementary Information Figure S6.
Supplementary Information Figure S7.
Supplementary Information Figure S8.
Supplementary Information Figure S9.
Supplementary Information Figure S10.
Supplementary Information Figure S11.
Supplementary Information Figure S12.
Supplementary Information Figure S13.
Supplementary Information
ACKNOWLEDGMENT
The authors thank Ms. Patricia Martin, senior radiographer, for supporting this work.
REFERENCES
- Afshar F, Watkins ES, Yap JC (1978): Stereotaxic Atlas of the Human Brainstem and Cerebellar Nuclei: A Variability Study. New York: Raven Press. [Google Scholar]
- American Psychiatric Association (2000): Diagnostic and Statistical Manual of Mental Disorders: DSM‐IV‐TR. Arlington, Virginia, U.S.A: American Psychiatric Publishing, Inc. [Google Scholar]
- Anderson CM, Polcari A, Lowen SB, Renshaw PF, Teicher MH (2002): Effects of methylphenidate on functional magnetic resonance relaxometry of the cerebellar vermis in boys with ADHD. Am J Psychiatr 159:1322–1328. [DOI] [PubMed] [Google Scholar]
- Arnsten AF (1998): Catecholamine modulation of prefrontal cortical cognitive function. Trends Cogn Sci 2:436–447. [DOI] [PubMed] [Google Scholar]
- Arnsten AF, Steere JC, Hunt RD (1996): The contribution of alpha 2‐noradrenergic mechanisms of prefrontal cortical cognitive function. Potential significance for attention‐deficit hyperactivity disorder. Arch Gen Psychiatr 53:448–455. [DOI] [PubMed] [Google Scholar]
- Arnsten AFT, Li B‐M (2005): Neurobiology of executive functions: Catecholamine influences on prefrontal cortical functions. Biol Psychiatr 57:1377–1384. [DOI] [PubMed] [Google Scholar]
- Ashburner J (2007): A fast diffeomorphic image registration algorithm. Neuroimage 38:95–113. [DOI] [PubMed] [Google Scholar]
- Banaschewski T, Coghill D, Danckaerts M, Dopfner M, Rohde L, Sergeant JA, Sonuga‐Barke EJS, Taylor E, Zuddas A (2010): ADHD and Hyperkinetic Disorder. New York: Oxford University Press; 136 p. [Google Scholar]
- Berquin PC, Giedd JN, Jacobsen LK, Hamburger SD, Krain AL, Rapoport JL, Castellanos FX (1998): Cerebellum in attention‐deficit hyperactivity disorder: A morphometric MRI study. Neurology 50:1087–1093. [DOI] [PubMed] [Google Scholar]
- Bohland JW, Saperstein S, Pereira F, Rapin J, Grady L (2012): Network, anatomical, and non‐imaging measures for the prediction of ADHD diagnosis in individual subjects. Front Syst Neurosci 6, p 78. [DOI] [PMC free article] [PubMed] [Google Scholar]
- Bray S, Chang C, Hoeft F (2009): Applications of multivariate pattern classification analyses in developmental neuroimaging of healthy and clinical populations. Front Hum Neurosci 3:32. [DOI] [PMC free article] [PubMed] [Google Scholar]
- Bussing R, Grudnik J, Mason D, Wasiak M, Leonard C (2002): ADHD and conduct disorder: An MRI study in a community sample. World J Biol Psychiatr 3:216–220. [DOI] [PubMed] [Google Scholar]
- Carmona S, Vilarroya O, Bielsa A, Trèmols V, Soliva JC, Rovira M, Tomàs J, Raheb C, Gispert JD, Batlle S, Bulbena A (2005): Global and regional gray matter reductions in ADHD: A voxel‐based morphometric study. Neurosci Lett 389:88–93. [DOI] [PubMed] [Google Scholar]
- Castellanos FX, Giedd JN, Marsh WL, Hamburger SD, Vaituzis AC, Dickstein DP, Sarfatti SE, Vauss YC, Snell JW, Lange N, Kaysen D, Krain AL, Ritchie GF, Rajapakse JC, Rapoport JL (1996): Quantitative brain magnetic resonance imaging in attention‐deficit hyperactivity disorder. Arch Gen Psychiatr 53:607–616. [DOI] [PubMed] [Google Scholar]
- Castellanos FX, Lee PP, Sharp W, Jeffries NO, Greenstein DK, Clasen LS, Blumenthal JD, James RS, Ebens CL, Walter JM, Zijdenbos A, Evans AC, Giedd JN, Rapoport JL (2002): Developmental trajectories of brain volume abnormalities in children and adolescents with attention‐deficit/hyperactivity disorder. JAMA 288:1740–1748. [DOI] [PubMed] [Google Scholar]
- Chamberlain SR, Muller U, Blackwell AD, Clark L, Robbins TW, Sahakian BJ (2006): Neurochemical modulation of response inhibition and probabilistic learning in humans. Science 311:861–863. [DOI] [PMC free article] [PubMed] [Google Scholar]
- Chang C‐W, Ho C‐C, Chen J‐H (2012): ADHD classification by a texture analysis of anatomical brain MRI data. Front Syst Neurosci 6, p 66. [DOI] [PMC free article] [PubMed] [Google Scholar]
- Cheng W, Ji X, Zhang J, Feng J (2012): Individual classification of ADHD patients by integrating multiscale neuroimaging markers and advanced pattern recognition techniques. Front Syst Neurosci 6:58. [DOI] [PMC free article] [PubMed] [Google Scholar]
- Colby JB, Rudie JD, Brown JA, Douglas PK, Cohen MS, Shehzad Z (2012): Insights into multimodal imaging classification of ADHD. Front Syst Neurosci 6:59. [DOI] [PMC free article] [PubMed] [Google Scholar]
- Cristianini N, Shawe‐Taylor J (2000): An Introduction to Support Vector Machines: And Other Kernel‐Based Learning Methods. Cambridge: Cambridge University Press. [Google Scholar]
- D'Agata F, Caroppo P, Boghi A, Coriasco M, Caglio M, Baudino B, Sacco K, Cauda F, Geda E, Bergui M, Geminiani G, Bradac GB, Orsi L, Mortara P (2011): Linking coordinative and executive dysfunctions to atrophy in spinocerebellar ataxia 2 patients. Brain Struct Funct 216:275–288. [DOI] [PubMed] [Google Scholar]
- D, Dai Wang J, Hua J, He H (2012): Classification of ADHD children through multimodal magnetic resonance imaging. Front Syst Neurosci 6, p 63. [DOI] [PMC free article] [PubMed] [Google Scholar]
- Dash M, Liu H (1997): Feature selection for classification. Intell Data Anal 1:131–156. [Google Scholar]
- Del Campo N, Chamberlain SR, Sahakian BJ, Robbins TW (2011): The roles of dopamine and noradrenaline in the pathophysiology and treatment of attention‐deficit/hyperactivity disorder. Biol Psychiatr 69:e145–e157. [DOI] [PubMed] [Google Scholar]
- Döpfner M, Lehmkuhl G (1998): Diagnostik‐System für psychische Störungen im Kindes‐ und Jugendalter nach ICD‐10 und DSM‐IV. Bern: Huber.
- Ecker C, Marquand A, Mourão‐Miranda J, Johnston P, Daly EM, Brammer MJ, Maltezos S, Murphy CM, Robertson D, Williams SC, Murphy DGM (2010): Describing the brain in autism in five dimensions—Magnetic resonance imaging‐assisted diagnosis of autism spectrum disorder using a multiparameter classification approach. J Neurosci 30:10612–10623. [DOI] [PMC free article] [PubMed] [Google Scholar]
- Ellison‐Wright I, Ellison‐Wright Z, Bullmore E (2008): Structural brain change in attention deficit hyperactivity disorder identified by meta‐analysis. BMC Psychiatr 8:51–51. [DOI] [PMC free article] [PubMed] [Google Scholar]
- Eloyan A, Muschelli J, Nebel MB, Liu H, Han F, Zhao T, Barber AD, Joel S, Pekar JJ, Mostofsky SH, Caffo B (2012): Automated diagnoses of attention deficit hyperactive disorder using magnetic resonance imaging. Front Syst Neurosci 6:61. [DOI] [PMC free article] [PubMed] [Google Scholar]
- Fair DA, Bathula D, Nikolas MA, Nigg JT (2012): Distinct neuropsychological subgroups in typically developing youth inform heterogeneity in children with ADHD. Proc Natl Acad Sci USA 109:6769–6774. [DOI] [PMC free article] [PubMed] [Google Scholar]
- Filipek PA, Semrud‐Clikeman M, Steingard RJ, Renshaw PF, Kennedy DN, Biederman J (1997): Volumetric MRI analysis comparing subjects having attention‐deficit hyperactivity disorder with normal controls. Neurology 48:589–601. [DOI] [PubMed] [Google Scholar]
- Frodl T, Skokauskas N (2012): Meta‐analysis of structural MRI studies in children and adults with attention deficit hyperactivity disorder indicates treatment effects. Acta Psychiatr Scand 125:114–126. [DOI] [PubMed] [Google Scholar]
- Gilbert SJ, Spengler S, Simons JS, Steele JD, Lawrie SM, Frith CD, Burgess PW (2006): Functional specialization within rostral prefrontal cortex (area 10): A meta‐analysis. J Cogn Neurosci 18:932–948. [DOI] [PubMed] [Google Scholar]
- Guitart‐Masip M, Chowdhury R, Sharot T, Dayan P, Duzel E, Dolan RJ (2012): Action controls dopaminergic enhancement of reward representations. Proc Natl Acad Sci USA 109:7511–7516. [DOI] [PMC free article] [PubMed] [Google Scholar]
- Guyon I, Elisseeff A (2003): An introduction to variable and feature selection. J Mach Learn Res 3:1157–1182. [Google Scholar]
- Hermann B, Jones J, Dabbs K, Allen CA, Sheth R, Fine J, McMillan A, Seidenberg M (2007): The frequency, complications and aetiology of ADHD in new onset paediatric epilepsy. Brain 130:3135–3148. [DOI] [PubMed] [Google Scholar]
- Hill DE, Yeo RA, Campbell RA, Hart B, Vigil J, Brooks W (2003): Magnetic resonance imaging correlates of attention‐deficit/hyperactivity disorder in children. Neuropsychology 17:496–506. [DOI] [PubMed] [Google Scholar]
- Johnston BA, Mwangi B, Matthews K, Coghill D, Steele JD (2013): Predictive classification of individual magnetic resonance imaging scans from children and adolescents. Eur Child Adolesc Psychiatr 22:733–744. [DOI] [PubMed] [Google Scholar]
- Kaufman J, Birmaher B, Brent D, Rao U, Flynn C, Moreci P, Williamson D, Ryan N (1997): Schedule for affective disorders and schizophrenia for school‐age children‐present and lifetime version (K‐SADS‐PL): Initial reliability and validity data. J Am Acad Child Adolesc Psychiatr 36:980–988. [DOI] [PubMed] [Google Scholar]
- Keren NI, Lozar CT, Harris KC, Morgan PS, Eckert MA (2009): In vivo mapping of the human locus coeruleus. Neuroimage 47:1261–1267. [DOI] [PMC free article] [PubMed] [Google Scholar]
- Klöppel S, Stonnington CM, Chu C, Draganski B, Scahill RI, Rohrer JD, Fox NC, Jack CR Jr, Ashburner J, Frackowiak RS (2008): Automatic classification of MR scans in Alzheimer's disease. Brain 131:681–689. [DOI] [PMC free article] [PubMed] [Google Scholar]
- Konrad K, Neufang S, Hanisch C, Fink GR, Herpertz‐Dahlmann B (2006): Dysfunctional attentional networks in children with attention deficit/hyperactivity disorder: Evidence from an event‐related functional magnetic resonance imaging study. Biol Psychiatr 59:643–651. [DOI] [PubMed] [Google Scholar]
- Koutsouleris N, Borgwardt S, Meisenzahl EM, Bottlender R, Moller H‐J, Riecher‐Rössler A (2012): Disease prediction in the at‐risk mental state for psychosis using neuroanatomical biomarkers: Results from the FePsy study. Schizophrenia Bull 38:1234–1246. [DOI] [PMC free article] [PubMed] [Google Scholar]
- Levy F, Swanson JM (2001): Timing, space and ADHD: the dopamine theory revisited. Aust N Z J Psychiatr 35:504–511. [DOI] [PubMed] [Google Scholar]
- Liang S‐F, Hsieh T‐H, Chen P‐T, Wu M‐L, Kung C‐C, Lin C‐Y, Shaw F‐Z (2012): Differentiation Between Resting‐State fMRI Data From ADHD and Normal Subjects: Based on Functional Connectivity And Machine Learning. Taichung: IEEE. pp 294–298. [Google Scholar]
- Lim L, Marquand A, Cubillo AA, Smith AB, Chantiluke K, Simmons A, Mehta M, Rubia K (2013): Disorder‐specific predictive classification of adolescents with attention deficit hyperactivity disorder (ADHD) relative to autism using structural magnetic resonance imaging. PloS ONE 8:e63660. [DOI] [PMC free article] [PubMed] [Google Scholar]
- Mai JK, Assheuer J, Paxinos G (1997): Atlas of the Human Brain. Dusseldorf: Academic Press. [Google Scholar]
- McRobbie DW, Moore EA, Graves MJ, Prince MR (2010): MRI from Picture to Proton. New York: Cambridge University Press. [Google Scholar]
- Moorhead TWJ, Gountouna V‐E, Job DE, McIntosh AM, Romaniuk L, Lymer GKS, Whalley HC, Waiter GD, Brennan D, Ahearn TS, Cavanagh J, Condon B, Steele JD, Wardlaw JM, Lawrie SM (2009): Prospective multi‐centre voxel based morphometry study employing scanner specific segmentations: Procedure development using CaliBrain structural MRI data. BMC Med Imaging 9:8. [DOI] [PMC free article] [PubMed] [Google Scholar]
- Mostofsky SH, Reiss AL, Lockhart P, Denckla MB (1998): Evaluation of cerebellar size in attention‐deficit hyperactivity disorder. J Child Neurol 13:434–439. [DOI] [PubMed] [Google Scholar]
- Mwangi B, Ebmeier KP, Matthews K, Douglas Steele J (2012): Multi‐centre diagnostic classification of individual structural neuroimaging scans from patients with major depressive disorder. Brain 135:1508–1521. [DOI] [PubMed] [Google Scholar]
- Mwangi B, Tian TS, Soares JC (2014): A review of feature reduction techniques in neuroimaging. Neuroinformatics 12:229–244. [DOI] [PMC free article] [PubMed] [Google Scholar]
- Nakao T, Radua J, Rubia K, Mataix‐Cols D (2011): Gray matter volume abnormalities in ADHD: Voxel‐based meta‐analysis exploring the effects of age and stimulant medication. Am J Psychiatr 168:1154–1163. [DOI] [PubMed] [Google Scholar]
- Oldfield RC (1971): The assessment and analysis of handedness: The Edinburgh inventory. Neuropsychologia 9:97–113. [DOI] [PubMed] [Google Scholar]
- Plessen KJ, Bansal R, Zhu H, Whiteman R, Amat J, Quackenbush GA, Martin L, Durkin K, Blair C, Royal J, Hugdahl K, Peterson BS (2006): Hippocampus and amygdala morphology in attention‐deficit/hyperactivity disorder. Arch Gen Psychiatr 63:795–807. [DOI] [PMC free article] [PubMed] [Google Scholar]
- Riccio CA, Reynolds CR, Lowe P, Moore JJ (2002): The continuous performance test: A window on the neural substrates for attention? Arch Clin Neuropsychol 17:235–272. [PubMed] [Google Scholar]
- Schneider S, Unnewehr S, Margraf J (2009): Diagnostisches interview psychischer Störungen im Kindes‐ und Jugendalter (Kinder‐DIPS). Heidelberg: Springer. [Google Scholar]
- Schwaighofer A (2001): SVM Toolbox.
- Seidman LJ, Valera EM, Makris N (2005): Structural brain imaging of attention‐deficit/hyperactivity disorder. Biol Psychiatr 57:1263–1272. [DOI] [PubMed] [Google Scholar]
- Slotnick SD, Schacter DL (2006): The nature of memory related activity in early visual areas. Neuropsychologia 44:2874–2886. [DOI] [PubMed] [Google Scholar]
- Slotnick SD, Moo LR, Segal JB, Hart J Jr (2003): Distinct prefrontal cortex activity associated with item memory and source memory for visual shapes. Brain Res 17:75–82. [DOI] [PubMed] [Google Scholar]
- Solmaz B, Dey S, Ravishankar Rao A, Shah M (2012): ADHD Classification Using Bag of Words Approach on Network Features. San Diego, California, USA. [Google Scholar]
- Stephan KE, Friston KJ, Frith CD (2009): Dysconnection in schizophrenia: from abnormal synaptic plasticity to failures of self‐monitoring. Schizophrenia Bull 35:509–527. [DOI] [PMC free article] [PubMed] [Google Scholar]
- Tsujimoto S, Genovesio A, Wise SP (2011): Frontal pole cortex: Encoding ends at the end of the endbrain. Trends Cogn Sci 15:169–176. [DOI] [PubMed] [Google Scholar]
- Voeller KK (1991): Toward a neurobiologic nosology of attention deficit hyperactivity disorder. J Child Neurol 6 Suppl:S2‐S8. [DOI] [PubMed] [Google Scholar]
- Volkow ND, Wang G‐J, Newcorn J, Fowler JS, Telang F, Solanto MV, Logan J, Wong C, Ma Y, Swanson JM, Schulz K, Pradhan K (2007a): Brain dopamine transporter levels in treatment and drug naive adults with ADHD. Neuroimage 34:1182–1190. [DOI] [PubMed] [Google Scholar]
- Volkow ND, Wang G‐J, Newcorn J, Telang F, Solanto MV, Fowler JS, Logan J, Ma Y, Schulz K, Pradhan K, Wong C, Swanson JM (2007b): Depressed dopamine activity in caudate and preliminary evidence of limbic involvement in adults with attention‐deficit/hyperactivity disorder. Arch Gen Psychiatr 64:932–940. [DOI] [PubMed] [Google Scholar]
- Wechsler D (1991): WISC‐III: Wechsler intelligence scale for children. San Antonio, TX: Psychological Corporation, Harcourt Brace Jovanovich. 294 p.
- Wechsler D (2004): The Wechsler Intelligence Scale for Children. London: Pearson Assessment. [Google Scholar]
- Weiß RH (1998): Grundintelligenztest Skala 2 (CFT 20) mit Wortschatztest (WS) und Zahlenfolgentest (ZF). Braunschweig: Westermann. [Google Scholar]
- Yerys BE, Jankowski KF, Shook D, Rosenberger LR, Barnes KA, Berl MM, Ritzl EK, Vanmeter J, Vaidya CJ, Gaillard WD (2009): The fMRI success rate of children and adolescents: Typical development, epilepsy, attention deficit/hyperactivity disorder, and autism spectrum disorders. Hum Brain Mapp 30:3426–3435. [DOI] [PMC free article] [PubMed] [Google Scholar]
- Zhang T, Davatzikos C (2013): Optimally‐discriminative voxel‐based morphometry significantly increases the ability to detect group differences in schizophrenia, mild cognitive impairment, and Alzheimer's disease. NeuroImage 79:94–110. [DOI] [PMC free article] [PubMed] [Google Scholar]
- Zhu C‐Z, Zang Y‐F, Cao Q‐J, Yan C‐G, He Y, Jiang T‐Z, Sui M‐Q, Wang Y‐F (2008): Fisher discriminative analysis of resting‐state brain function for attention‐deficit/hyperactivity disorder. Neuroimage 40:110–120. [DOI] [PubMed] [Google Scholar]
Associated Data
This section collects any data citations, data availability statements, or supplementary materials included in this article.
Supplementary Materials
Supplementary Information Figure S1.
Supplementary Information Figure S2.
Supplementary Information Figure S3.
Supplementary Information Figure S4.
Supplementary Information Figure S5.
Supplementary Information Figure S6.
Supplementary Information Figure S7.
Supplementary Information Figure S8.
Supplementary Information Figure S9.
Supplementary Information Figure S10.
Supplementary Information Figure S11.
Supplementary Information Figure S12.
Supplementary Information Figure S13.
Supplementary Information