

Abstract
This study investigated the cortical responses underlying magnitude comparisons of multisensory stimuli and examined the effect that musical expertise has in this process. The comparative judgments were based on a newly learned rule binding the auditory and visual stimuli within the context of magnitude comparisons: “the higher the pitch of the tone, the larger the number presented.” The cortical responses were measured by simultaneous MEG\EEG recordings and a combined source analysis with individualized realistic head models was performed. Musical expertise effects were investigated by comparing musicians to non‐musicians. Congruent audiovisual stimuli, corresponding to the newly learned rule, elicited activity in frontotemporal and occipital areas. In contrast, incongruent stimuli activated temporal and parietal regions. Musicians when compared with nonmusicians showed increased differences between congruent and incongruent stimuli in a prefrontal region, thereby indicating that music expertise may affect multisensory comparative judgments within a generalized representation of analog magnitude. Hum Brain Mapp 35:5389–5400, 2014. © 2014 Wiley Periodicals, Inc.
Keywords: multisensory integration, neuroscience of music, plasticity, audio‐visual EEG, MEG
INTRODUCTION
The human ability to build a single and meaningful interpretation of our multisensory environment relies essentially on the decision regarding which sensory information to integrate, to form a coherent percept and which to segregate and consider as separate events. Recent neuroscientific evidence indicate that our brain may automatically decide which stimuli to integrate on the basis of temporal or spatial proximity [Innes‐Brown and Crewther, 2009; Lee and Noppeney, 2011; Parise and Spence, 2009], previous experience [Naumer et al., 2009], or innate correspondences [Besle et al., 2013; Evans and Treisman, 2010]. Conversely, this decision may constitute an active process that integrates stimuli bound together by explicitly learned relations [Butler and James, 2013; Butler et al., 2011; Raij et al., 2000].
The cognitive representation of numbers is proposed to be based on an analog magnitude code of numerical size [Dehaene, 1992]. Both symbolic and non‐symbolic relations can be coded, and it is still under debate to what extent the neural correlates differ or overlap [Piazza et al., 2007]. Recent evidence indicate that this abstract form of number representation is independent of the notation and modality [Barth et al., 2003; Jordan and Brannon, 2006; Kadosh and Walsh, 2009; Krause et al., 2013b]. Hence, the processing of size related information may be shared with cognitive domains other than the representation of numerocity, such as time, space and quantity [Walsh, 2003]. A recent behavioral study by Krause et al. [2013a] revealed that systematically related numerocieties of symbolic and tactile nature interact. Moreover, this multisensory interaction affects the processing of numerical distance as measured by judgments of numerical inequality [Moyer and Landauer, 1967]. Importantly, Cappelletti et al. [2013] recently revealed that improvements in the numerosity processing system after training may be transferred across domains in basic magnitude judgments.
Musical expertise requires long term musical training and therefore it has been recently developed as a research framework for studying training induced plasticity of multisensory processes [Herholz and Zatorre, 2012; Paraskevopoulos and Herholz, 2013]. Practicing a musical instrument constitutes a rich multisensory experience involving several sensory systems, as well as the motor one [Lee and Noppeney, 2011; Zatorre et al., 2007]. Specifically, music notation reading can provide a very useful model for studying audiovisual phenomena, as it combines auditory and visual information in a highly structured manner [Stewart, 2005]. The extensive and long‐term training that professional musicians have in music reading induces plastic changes in the cerebral cortex [Schön et al., 2002; Stewart et al., 2003].
A recent study by our group [Paraskevopoulos et al., 2012] used magnetoencephalography (MEG) to identify the neural correlates of audiovisual integration of abstract rules that relate auditory and visual information. Subjects in this study had to identify congruent and incongruent audiovisual stimuli according to a rule similar to the one behind musical reading: “the higher the pitch of the tone, the higher the position of a circle”. The violation of this explicitly learned rule produced an audiovisual incongruency response in the time‐window of 130–170 ms post stimulus presentation, located mainly in frontal regions. Results additionally revealed that musicians, compared to non‐musicians, showed greater difference of activities between the congruent and incongruent stimuli in the right superior frontal gyrus, the right superior temporal gyrus, and the right lingual gyrus, indicating that musical expertise affects audiovisual integration.
The above mentioned study [Paraskevopoulos et al., 2012] used the correspondence of pitch height with the height of the visual stimulus to build the abstract rule that bound the auditory and the visual stimuli. The cognitive process that supports comparative judgments seems to be based on a system that estimates magnitude in a quantitative manner [Cantlon et al., 2009; Dehaene, 1996; Pinel et al., 2004]. The neural bases of this process have been extensively studied in the numerical domain and several studies indicate that the intraparietal sulcus plays an important role in this process [Dehaene, 1996; Dehaene et al., 2003; Piazza et al., 2007]. For instance, Pinel et al. [2004] used fMRI to reveal that when performing comparative judgments the cerebral representations of number, size and luminance are overlapping in a distributed parietal network. Studies using EEG [Dehaene, 1996; Hsu and Szűcs, 2012] have also reached similar results highlighting the strong contribution of the parietal cortex in magnitude representation. Nevertheless, the characteristics of the cortical response related with magnitude comparisons when multisensory integration of the stimuli is required are still unclear.
In this study, we investigated the cortical responses underlying magnitude comparisons of multisensory stimuli and examined the effect that musical expertise has in this process. By means of combined EEG/MEG measurements, we studied the cortical response generated by the violation of a newly learned rule that systematically linked pitches of tones to numeric values in an ordinal relationship, that is, “the higher the pitch of the tone, the larger the number presented.”. We hypothesized that musicians compared to a control group of nonmusicians would show stronger activation differences between the stimuli that correspond to and the stimuli that violate the newly learned rule. Specifically, on the basis of our previous studies that investigated musical training effects in abstract audiovisual rules [Paraskevopoulos et al., 2012, in press] we hypothesized that musical expertise would lead to stronger activations in prefrontal regions in the time‐window of 130–170 ms post‐stimulus presentation. This result would suggest that plasticity effects of musical training in multisensory processing can be generalized in newly learned audiovisual associations.
MATERIALS AND METHODS
Subjects
The sample of this study consisted of 27 subjects, 12 musicians, and 15 nonmusicians. Musicians (mean age = 24.81; SD = 2.49; 6 males) were students of the Music Conservatory in Münster (mean musical training = 17.87; SD = 3.53). Prior to their participation in the study, the musicians were screened to have no experience in reading music via tablature as this form of music notation resembles the experimental paradigm used and could have affected the results. Nonmusicians (mean age = 28.27; SD = 2.76; 7 males) had not received any formal musical education apart from the compulsory school lessons. All subjects had normal hearing as evaluated by clinical audiometry, and were right handed according to the Edinburgh Handedness Inventory [Oldfield, 1971]. Subjects provided informed consent in written form prior to their participation in the study. The study protocol was approved by the ethics committee of the Medical Faculty of the University of Münster and the study was conducted according to the Declaration of Helsinki.
Stimuli
Audiovisual congruent and incongruent stimuli were prepared by combining melodies consisting of five tones with five images presenting numbers. Each image presented a number written with Calibri font in white color against a black background (Fig. 1). Three number sets were used ranging from 1 to 4; 3 to 6, and 5 to 8. The different number sets were presented pseudorandomly to equal number of subjects. The 5‐tone melodies were constructed from 4 sinusoidal tones (F5, 698.46 Hz; A5, 880.46 Hz; C6, 1046.50 Hz; and E6, 1318.51 Hz), with the constraint that each individual tone could occur at most twice within a single melody. Tone duration was 400 ms including 10 ms rise and 10 ms decay time. Tones were sampled at 44,100 kHz and coded 16 bit. The inter stimulus interval (ISI) between consecutive tones within the melody was 500 ms and the total duration of each melody was 4 s. Eight different melodies were prepared and the first tone of all melodies was C5.
Figure 1.

Example of an audiovisual congruent and an incongruent trial. A: presents a congruent trial. B: presents an incongruent trial. The line “time” represents the duration of the presentation of the auditory and visual part of the stimulus. The last picture of each trial represents the inter trial stimulus in which subjects had to answer if the trail was congruent or incongruent.
For the audiovisual congruent stimuli, the melodies were combined with the corresponding image of a number according to the rule “the higher the pitch, the larger the number presented.” Tones were assigned to pitches in an ordinal relationship, where the lowest pitch corresponded to the lowest number. During acoustic presentation of a tone the corresponding number was presented visually at the middle of the screen at the same time and for the same duration as the tone. During the ISI a fixation cross was presented. The audiovisual incongruent stimuli were prepared along the same principle as the congruent ones, except that one of the tones of the melody was presented with a number that did not match the pitch of the tone according to the above mentioned rule. The incongruency was never in the first or last tone‐number pair, but occurred at all other three positions with equal probabilities (Fig. 1).
Design
Subjects were exposed to three runs of stimulus presentation, lasting ∼14.5 min each, with short breaks in between. Each run consisted of 64 congruent and 64 incongruent stimulus sequences, in random order. Within 2.5 s after each stimulus sequence was presented, subjects had to answer via button presses if the video was congruent or incongruent. During this intertrial interval, an image was presented to the subjects that reminded them, which button represented which answer. Instructions for the task along with one example of each category were given to the participants prior to the beginning of the MEG recordings. The total number of stimulus sequences of each category was 192 and the total duration of the experiment was ∼45 min.
MEG and EEG Recordings
The source localization of brain signals can be improved by recording them simultaneously by means of EEG and MEG and calculating a combined analysis of the derived data [Goldenholz et al., 2009; Keuper et al., 2014; Sharon et al., 2007]. That is because MEG is sensitive to brain sources that are oriented tangentially to the scalp surface, while EEG is adequately more sensitive to radial ones [Ahlfors et al., 2010]. Moreover, the use of a realistic head model [e.g., boundary element model (BEM)] generated on the basis of the individual anatomy of each subject can further improve the source localization reliability of EEG and MEG signals [Wolters et al., 2006]. The use of individually generated BEMs helps to overcome limitations in source localization accuracy related with conductivity inhomogeneities and anisotropies [Keuper et al., 2014; Rullmann et al., 2009], as well as limitations generated by the incorrect representation of some cortical regions in poorly shaped head models [Dannhauer et al., 2011; Fuchs et al., 2002].
Evoked magnetic fields and electric potentials were continuously and simultaneously recorded with a whole‐head CTF OMEGA system (VSM MedTech, Port Coquitlam, Canada) with 275 MEG channels and 81 EEG electrodes in a magnetically shielded, silent room. A flexible lycra electrocap (easycap, Falk Minow Services, Munich Germany) was used for the EEG including 80 EEG electrodes and six ocular electrodes, placed in accordance with the extended version of the international 10–10 system and referenced to Cz. Electrode impedances were kept below 8 kΩ. The individual electrode positions for each subject were digitized by means of a 3D tracking device (Polhemus, Colchester) for later coregistration with individual anatomical MR images. Data were acquired continuously during each presentation block with a sampling rate of 600 Hz and an on‐line low‐pass filter of 150 Hz. Subjects were seated upright, and their head position was comfortably stabilized with cotton pads inside the MEG dewar.
Auditory stimulation was delivered via 60 cm long silicon tubes at 60 dB SL above the individual hearing threshold that was determined with an accuracy of at least 5 dB at the beginning of each MEG/EEG session for each ear. Visual stimuli were projected with an Optoma EP783S DLP projector and a refresh rate of 60 Hz onto the back of a semitransparent screen positioned ∼90 cm in front of the subjects' nasion. The viewing angle of the numbers ranged from −0.5° to +0.5° in the horizontal direction and from −1.15° to +1.15° in the vertical direction. The continuous recording was time‐locked to the presentation of the second, third, and fourth tones of the audiovisual congruent trials, and the presentation of the incongruent tone of the audiovisual incongruent trials.
MRI Protocol
T1–weighted MR images from each individual were obtained before the experiment in a 3‐Tesla scanner (Gyroscan Intera T30, Philips, Amsterdam, Netherlands). These anatomical scans served for constructing the individualized BEMs that were then used in the source reconstruction. A Turbo Field Echo acquisition protocol was used to collect 400 contiguous T1‐weighted slices of 0.5 mm thickness in the sagittal plane (TR = 7.33.64 ms, TE = 3.31 ms). The field of view was set to 300 × 300 mm with an in‐plane matrix of 512 × 512 setting, thus the native voxel size at 0.5 × 0.58 × 0.58 mm3. Using SPM8 (Statistical Parametric Mapping, http://www.fil.ion.ucl.ac.uk) the intensity bias of the images was then regularized, to account for intensity differences within each tissue and the images were resliced to isotropic voxels of 1.17 × 1.17 × 1.17 mm.
Data Analysis
The Brain Electrical Source Analysis software (BESA research, version 6, Megis Software, Heidelberg, Germany) was used for the preprocessing of the MEG and EEG data. Firstly, the EEG data were re‐referenced offline using a common average reference. Artifacts due to blinks or eye movements were corrected by applying an adaptive artifact‐correction [Ille et al., 2002]. The recorded data were separated in epochs of 800 ms including a prestimulus interval of 200 ms. Epochs were baseline corrected using the interval from −100 to 0 ms. From each congruent trial only one randomly selected tone‐number pair was included in the analysis, producing thus equal number of congruent and incongruent epochs. Data were filtered offline with a high pass forward filter of 1 Hz, a low pass zero‐phase of 30 Hz and an additional notch filter at 50 Hz. Epochs containing signals larger than 2.5 pT in the MEG or 120 μV in the EEG were considered artifact contaminated and excluded from averaging. The congruent and incongruent trials of each run were separately averaged and resampled to 250 Hz.
The software package Curry (version 7; Compumedics Germany GmbH, Hamburg) was used for the source current density reconstructions (CDR). The individual positions of EEG and MEG sensors were coregistered via anatomical landmarks (nasion, left and right preauricular points) to each subject's structural MRI. A BEM consisting of three compartments (skin, skull, and brain) was computed for each participant on the basis of their structural MRI, and used as a volume conductor model. The mesh size was set to 9, 8, and 6 mm for skin, skull and brain, respectively. The conductivity value for the skin compartment was set to 0.33 S/m, for the skull compartment to 0.0042 S/m and for the brain to 0.33 S/m as proposed by [Geddes and Baker, 1967]. A cortical triangle mesh with 3 mm triangle side length was calculated by segmenting the individual gray matter and excluding the brainstem and cerebellum. This cortical mesh was used to constrain the results and limit the source space for the CDR.
CDRs were calculated on the neural responses of each subject separately for each run's congruent and incongruent averages using the LORETA method [Pascual‐Marqui and Michel, 1994]. LORETA directly computes a current distribution throughout the full gray matter volume instead of a limited number of dipolar point sources or a distribution restricted to the surface of the cortex. This method has been used successfully for the mapping of audiovisual responses [Marco‐Pallarés et al., 2005; Paraskevopoulos et al., 2012] and has the advantage of not needing an a priori definition of the number of activated sources. A time window of 40 ms centered at 150 ms after stimulus onset was used for the CDR (130–170 ms). This time window was determined on the basis of our previous study that demonstrated an audiovisual incongruency response at this latency, using comparable stimulus material and stimulation parameters [Paraskevopoulos et al., 2012]. Additionally, the appropriate time window was determined so as to be within the range of 110–220 ms, which is the typical latency window of a MMN, and to include the rising slope and the peak of the grand average global field power (GFP) of the responses within this time‐range. This procedure is common in the MMN literature [Näätänen et al., 1989] and the specific time‐window is often chosen [Rüsseler et al., 2001; Tse et al., 2006]. The Tichonov regularization parameter lambda was calculated on the basis of the noise level in the baseline interval ranging from −100 to 0 ms. Each individual's CDR image over the selected time‐window for each condition and each run was calculated. The CDRs of each run were then averaged, which resulted in one image for each subject and each condition. The resulted CDRs were then normalized to standard MNI space, smoothed by convolving an isotropic Gaussian kernel with 8 mm FWHM and masked with a template of the cerebral cortex that included only the gray matter. This procedure accounts for individual differences in the brain structure and is described in detail in previous articles using the same method [Bruchmann et al., 2010; Keuper et al., 2014].
Statistical Parametric Mapping 8 (SPM8, http://www.fil.ion.ucl.ac.uk/spm) was used for the statistical analysis of the CDRs. Specifically, using the second level analysis of SPM8 a Flexible Factorial Model was designed to explore the main effect of condition and the group × condition interaction. The Flexible Factorial Model is SPM's equivalent analysis to a 2 × 2 mixed model ANOVA with between subject factor group and within subject factor condition. The factors included in the analysis were subject (to control for the repeated measures), group (musicians and nonmusicians), and condition (congruent and incongruent). A permutation method for peak‐cluster level error correction (AlphaSim) at P < 0.05 was applied for this whole head analysis, as implemented in REST software [Song et al., 2011], by taking into account the significance of the peak voxel (threshold P < 0.005 uncorrected) along with the cluster size (threshold size > 164 voxels), thereby controlling for multiple comparisons. The smoothness value used for the AlphaSim calculation was based on the smoothness of the residual image of the statistical analysis as proposed by Nichols [2012]. Results were visualized using MRIcron [Rorden and Brett, 2000].
Additionally, to present the difference of congruent and incongruent conditions in the specific time window unrestricted from the assumptions of the specific source analysis model, we conducted two statistical analyses in sensor space using BESA statistics: one for the event related magnetic fields and one for the corresponding electric potentials. A nonparametric permutation test for paired samples was applied (1,000 permutations) using a cluster Alpha level of P < 0.05; the distance indicating neighbor sensors was set at 4 cm.
RESULTS
Behavioral Responses
The discriminability index d prime was calculated for the analysis of the behavioral responses. Both musicians and non‐musicians scored significantly higher than chance level [musicians: 3.01 (t(11) = 14.401; P < 0.001); nonmusicians: 2.31 (t(14) = 10.774; p < 0.001)]. Moreover, an independent samples t‐test revealed that musicians scored significantly higher than non‐musicians [t(25) = 2.306; p < 0.05] indicating that the musicians were better able to discriminate between the congruent and incongruent trials than the nonmusicians. The behavioral results are presented in Figure 2.
Figure 2.

Mean d prime of the behavioral responses of musicians (dark gray) and nonmusicians (light gray) discriminating between congruent and incongruent trials. Error bars indicate 95% confidence interval. The between group difference is significant at P = 0.05.
Sensor Space Results
EEG results
The statistical analysis of the EEG data in sensor space revealed that the two conditions differed significantly in two clusters of sensors. Specifically, a cluster located in the central parietal sensors showed significantly lower activation in the congruent than the incongruent condition (P < 0.001) while another cluster located in the left frontal sensors showed significantly higher activation in the congruent than the incongruent condition (P < 0.001). The results of this analysis are presented in Figure 3a.
Figure 3.
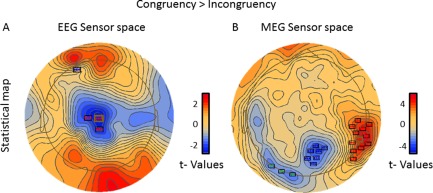
Distribution of the difference between the conditions of the electrical current (right side) and the magnetic field (left side) in sensor space. The stars indicate clusters of sensors where the difference between the congruent and the incongruent condition is significant according to the permutation tests.
MEG results
The statistical analysis of the fluctuation of the magnetic field in sensor space revealed that the two conditions differed significantly in three clusters of sensors. Specifically, a cluster extending from the right posterior parietal to the right occipital sensors showed significantly higher activation in the congruent than the incongruent condition (P < 0.001) while two clusters located in the central parietal (P < 0.001) and left occipital (P < 0.05) sensors showed significantly lower activation in the congruent than the incongruent condition. The results of this analysis are presented in Figure 3b.
Combined MEG/EEG Source Space Results
Audiovisual congruency response generators
The statistical analysis of the main effect of condition for the combined EEG and MEG data indicated that the congruent audiovisual stimuli activated a complex network of sources. Specifically, the main effect of condition with the planned contrast congruent > incongruent revealed four clusters of activity: one in the anterior prefrontal cortex with a peak located in the left medial frontal gyrus [peak coordinates: x = −4, y = 56, z = −15; t(25) = 5.27; cluster size = 7336 voxels; P < 0.05 AlphaSim corrected] two located bilaterally in the middle temporal gyrus [right peak coordinates: x = 56, y = −6, z = −23; t(25) = 3.99; cluster size = 515 voxels; left peak coordinates: x = −48, y = 2, z = −31; t(25) = 3.87; cluster size = 7336 voxels; P < 0.05 AlphaSim corrected]; and one located in the right lingual gyrus [peak coordinates: x = 14, y = −90, z = −5; t(25) = 5.57; cluster size = 3744 voxels; P < 0.05 AlphaSim corrected]. The results are summarized in Table 1 and the statistical map of this analysis presented in Figure 4. All anatomical regions are defined using the AAL atlas [Tzourio‐Mazoyer et al., 2002].
Table 1.
Peak voxels of the clusters with significant activation in the congruent and incongruent condition and the musicians versus nonmusicians comparison
| Condition | Location of activation | Coordinates | Peak voxel t(25) value | Cluster size | ||
|---|---|---|---|---|---|---|
| X | Y | Z | ||||
| Congruent | Left middle frontal gyrus | −4 | 56 | −15 | 5.27 | 7,336 |
| Right middle temporal gyrus | 56 | −6 | −23 | 3.99 | 515 | |
| Left middle temporal gyrus | −48 | 2 | −31 | 3.87 | 7,336 | |
| Right lingual gyrus | 14 | −90 | −5 | 5.57 | 3,744 | |
| Incongruent | Right inferior parietal sulcus | 48 | −40 | 55 | 5.35 | 27,086 |
| Left postcentral gyrus | −26 | −34 | 71 | 5.41 | 27,086 | |
| Left postcentral gyrus | −44 | −34 | 55 | 5.35 | 27,086 | |
| Left superior temporal gyrus | −50 | −28 | 15 | 4.13 | 184 | |
| Musicians vs. nonmusicians | Left superior frontal gyrus | 0 | 30 | 61 | F(1, 25) = 3.60 | 227 |
Figure 4.

Upper side: Statistical parametric maps of the combined EEG\MEG source analysis for the congruent and incongruent condition and the musicians to non‐musicians comparison. Lower side: grand average GFP of the MEG and EEG measurements for congruent (black line) and incongruent (gray line) response for musicians (continuous line) and nonmusicians (dashed line). The time interval where the analysis was performed is marked gray.
Audiovisual incongruency response generators
The statistical analysis of the main effect of condition indicated that the incongruent audiovisual stimuli activated two cortical regions. Specifically, the main effect of condition with the planned contrast incongruent > congruent revealed a relatively broad cluster of activity located bilaterally in the parietal cortex that included three peaks: one located in the right inferior parietal sulcus [peak coordinates: x = 48, y = −40, z = 55; t(25) = 5.46; cluster size = 27,086 voxels; P < 0.05 AlphaSim corrected]; and two located in the left postcentral gyrus [coordinates for peak 1: x = −26, y = −34, z = 71; t(25) = 5.41; coordinates for peak 2: x = −44, y = −34, z = 55; t(25) = 5.35; cluster size = 27,086 voxels; P < 0.05 AlphaSim corrected]. The other cluster was located in the left superior temporal gyrus [peak coordinates: x = −50, y = −28, z = 15; t(25) = 4.13; cluster size = 184 voxels; P < 0.05 AlphaSim corrected]. The results are summarized in Table 1 and the statistical map of this analysis presented in Figure 4.
Musicians versus nonmusicians comparison
The statistical analysis revealed a significant interaction of group × condition, thereby showing that the cortical responses of musicians differed significantly from the responses of the nonmusicians. This analysis revealed one cluster of activity located in the prefrontal cortex, and specifically the left superior frontal gyrus [peak coordinates: x = 0, y = 30, z = 61; F(1, 25) = 13.23; cluster size = 227 voxels; P < 0.05 AlphaSim corrected]. The results are summarized in Table 1 and the statistical map of this analysis is presented in Figure 4. Subsequently, two post hoc t‐contrasts were calculated using the result of the F contrast as a mask, in order to investigate the direction of the difference of the responses between musicians and non‐musicians. The t‐contrast of musicians > nonmusicians indicated significance in the region included in the mask [peak coordinates: x = 0, y = 30, z = 61; t(25) = 3.20], revealing thus that the musicians showed increased activation difference between the two conditions in comparison to the nonmusicians. The opposite contrast (i.e., nonmusicians > musicians) revealed no significant result.
DISCUSSION
This study investigated the cortical responses underlying magnitude comparisons of multisensory stimuli and examined the effect that musical expertise has in this process. The magnitude comparison judgments were based on a newly learned rule that systematically linked pitches of tones to numeric values in an ordinal relationship: “the higher the pitch of the tone, the larger the number presented.” The cortical responses were recorded simultaneously by MEG\EEG and combined source analysis with individualized realistic head models was performed. Musical expertise effects were investigated by comparing musicians to nonmusicians. Results indicated that when the audiovisual stimuli that were presented corresponded to the newly learned rule, a network of frontotemporal and occipital sources was activated. On the contrary, temporal and parietal regions were activated when the stimuli did not correspond to the presented rule, identifying thus a network of cortical regions that contribute to multisensory integration of quantitative judgments that activate both the symbolic and the approximate magnitude systems. Musicians when compared to non‐musicians showed increased differences between the conditions in a prefrontal region, thereby indicating that long term music training may affect comparative judgments of audiovisual stimuli within a generalized representation of analog magnitude.
Behavioral Measures of Audiovisual Magnitude Comparisons
The fact that both groups scored well above chance in the behavioral measurements reveals that both groups were able to discriminate between the congruent and incongruent trials. This shows that, independently of musicianship, subjects were able to apply the new rule that bound the audiovisual stimuli in the context of magnitude comparison and use it to judge the stimuli accordingly. Nevertheless, musicians scored significantly higher than nonmusicians indicating that musicians have benefits that might be related to their extensive experience in reading musical scores [Lee and Noppeney, 2011; Paraskevopoulos et al., 2012; Petrini et al., 2009; Vatakis and Spence, 2006]. Importantly, this indicate, for the first time according to our knowledge, that the behavioral benefits of musical expertise are generalizable to newly learned rules that bind the audiovisual stimuli.
Audiovisual Incongruency of Magnitude Comparisons is Reflected in EEG/MEG Sensor Space
The EEG and MEG results in sensor level demonstrate that significant differences between the conditions are present even prior to the application of the assumptions of the source analysis model. The activity measured by EEG in the vertex is significantly lower in the congruent condition than the incongruent condition, indicating an inhibition of the activity of the auditory cortex that is driven by the congruent visual information. This result complements recent EEG findings [Besle et al., 2004; Stekelenburg and Vroomen, 2007; Van Wassenhove et al., 2005] in the domain of language and suggests a general, supra‐domain mechanism of multisensory integration that has been proposed also by Kayser et al. [2008]. Additionally, the GFP of both EEG and MEG sensor data indicates a group difference at the latency of the P2 component (see Fig. 4). The analysis of this time‐window was not included in our a‐priori hypothesis and therefore it was not statistically tested. Nevertheless, this is an interesting result that is also in agreement with previous neurophysiological studies focusing on the auditory domain, which indicated that musicians show enhanced responses in the auditory evoked potential of P2 in comparison to nonmusicians controls [Baumann et al., 2008; Kuriki et al., 2006; Shahin et al., 2003, 2005]. Our result indicates that musical expertise may be correlated with enhanced processing of audiovisual stimuli in the time‐window of 200 ms. Further investigation in future studies would be necessary in order to study this effect in detail.
Congruent Audiovisual Stimuli Activate Frontotemporal and Occipital Areas
The combined EEG\MEG source analysis indicated that when the subjects perceived a congruent trial, a network of sources located in frontal, temporal, and occipital regions was activated. The regions that were more strongly activated in the congruent condition reflect multisensory integration. This is supported by previous findings on audiovisual processing: The frontal cluster of activity includes the anterior prefrontal cortex that has been shown to reflect audiovisual integration processes in previous fMRI studies [Ojanen et al., 2005; Saito et al., 2005] as well as in our recent MEG study on neural correlates of audiovisual integration [Paraskevopoulos et al., 2012]. This region receives input from the superior temporal cortex and the cingulate cortex, as revealed by a recent DTI study [Liu et al., 2013]. Its functional role is proposed to be the integration of the results of separate cognitive operations that are required to fulfill a behavioral goal [Ramnani and Owen, 2004], which is consistent with the task requirements in this study. The same cluster of activity includes the anterior cingulate cortex that has also been connected with audiovisual integration previously [Benoit et al., 2010; Laurienti et al., 2003; Ojanen et al., 2005; Olson et al., 2002].
Additionally, activations were shown in the medial temporal gyrus bilaterally, a region that is well known for contributing to the processing of audiovisual information [Alpert et al., 2008; Raij et al., 2000; Wright et al., 2003]. Another activation difference between the congruent and incongruent conditions was also found in the lingual gyrus. The contribution of visual areas in an audiovisual task is expected, but the activation difference in the lingual gyrus between the conditions was surprising. The lingual gyrus has direct connection with regions known for multisensory characteristics, such as the superior temporal sulcus [Jones and Powell, 1970], and has been previously shown to reveal activation differences in audiovisual tasks related with motion perception [Baumann and Greenlee, 2007] as well as audiovisual tasks related with speech [Macaluso et al., 2004; Pekkola et al., 2006]. Activation differences in the lingual gyrus have also been found during the perception of change between different notational systems of numbers in the study of Piazza et al. [2007]. Nevertheless, further investigation is needed to elucidate the exact contribution of lingual gyrus to the processing of congruent audiovisual information in the context of magnitude comparison.
Interestingly, a similar cortical network as the one found in this study for the congruent condition was found in the incongruent condition of our previous study that investigated audiovisual integration of abstract rules [Paraskevopoulos et al., 2012]. Hence, this network seems to play a crucial role in audiovisual integration, but its contribution in the two tasks seems to be different. In our previous study, the rule that bound the auditory and visual stimuli was based on the correspondence of pitch and spatial height. This is a well‐known audiovisual correspondence [Parise and Spence, 2009] and it seems to be innate, as it is present already from childhood [Spence and Deroy, 2013; Walker et al., 2010]. Therefore, the processing of stimuli on the basis of this correspondence may be overlearned and partly automated, resulting in the absence of strong activations in the congruent condition. In contrast, the rule binding the auditory and visual information in the present study is a newly learned rule. Hence, processing this new rule might recruit to a greater extent regions related to audiovisual integration in the congruent condition. This may also be one of the reasons why the use of the music notation system based on numbers (i.e., tablature) has gradually been decreased and the music notation system that is based on spatial height prevailed.
Incongruent Audiovisual Stimuli Activate Temporoparietal Areas
Stronger activations in the incongruent condition were found in a broad parietal region along with a cluster in superior temporal gyrus. The highest peak of activity in the parietal region was located in the inferior parietal sulcus. This region has been repeatedly connected with both multisensory integration [Bremmer et al., 2001; Ghazanfar and Schroeder, 2006] as well as with magnitude comparisons in the number domain [Piazza et al., 2007; Pinel et al., 2004]. Additionally, the superior temporal gyrus has also been connected with audiovisual processing [Raij et al., 2000; Wright et al., 2003] and with identification of pitch mismatches in oddball paradigms [Csépe et al., 1992; Näätänen, 1995; Tervaniemi et al., 2005]. The characteristics of the experimental design did not allow us to differentiate which parts of the activations described above were found due to the multisensory integration, which were due to unisensory processing of the mismatches or which were based on both components of the task. Further investigation is needed for the differentiation of the processes within this response. Nevertheless, the result that the inferior parietal sulcus and the superior temporal gyrus were activated during the perception of incongruencies expressed within a context of magnitude comparison is consistent with the literature in the number domain [Dehaene et al., 2003; Piazza et al., 2007], but extends previous findings to multisensory audiovisual processing.
Musical Expertise Effects in Audiovisual Processing of Magnitude Comparisons
The group × condition interaction revealed that musicians showed increased activation difference between the congruent and the incongruent condition in the left superior frontal gyrus. Musical training is strongly based on audiovisual integration, especially when reading a musical score [Schön et al., 2002; Stewart, 2005]. Therefore the musical expertise effect in audiovisual integration that is revealed in this study may be induced by the long‐term extensive training that professional musicians undergo, as recent studies suggest [Lee and Noppeney, 2011; Musacchia et al., 2007]. Tervaniemi et al. [2003] revealed that the presence of musical score has strong effects on pitch processing as indexed by various ERPs. Activity in the superior frontal gyrus was found to be modulated by musical training also in the recent MEG study by our group that investigated the perception of audiovisual incongruencies of abstract rules [Paraskevopoulos et al., 2012]. Differences in the superior frontal gyrus in musically trained compared to untrained individuals may be interpreted as a contribution of motor association areas. The motor association areas are affected from the audio‐visual‐motoric binding that musicians have highly trained by reading music notation [Schön and Besson, 2005; Stewart et al., 2004]. Importantly, the fact that musical expertise may affect magnitude comparisons of multisensory stimuli provides new and important evidence indicating that expertise in one domain can affect the generalized representations of analog magnitude.
Implications for the Cognitive Domain of Numerosity
The experimental paradigm used in the present study dissociated the function of prefrontal and occipital areas from the temporoparietal network. These networks have been found to be simultaneously activated in previous studies of magnitude processing [Dehaene, 1999; Piazza et al., 2007], particularly in more abstract comparisons as revealed in a recent study by Knops and Willmes [2014]. These results further indicated that the prefrontal and occipital network was activated when the symbolic system (numbers, presented visually) was congruent to the nonsymbolic one (pitch height, presented acoustically) suggesting that these regions may be important in cross‐modal judgments integrating approximate and abstract number processing. In contrast, the temporoparietal network was activated when the symbolic system was incongruent to the nonsymbolic one. The importance of the contribution of both frontal and parietal areas in abstract cross‐modal numerical processing has also been recently highlighted by Chick [2014]. The results of the present study complement recent findings [Cappelletti et al., 2013] indicating that the effects of expertise in a trained magnitude task (pitch height comparison) may be transferred to new conditions that combine approximate and abstract number processing. Our results extend these recent findings by revealing that this transfer of expertise effects also applies to multisensory integration of approximate and abstract magnitude processing. Moreover, the early latency of the studied responses (i.e., 130–170 ms) suggests the existence of an implicit neural mechanism that integrates auditory and numerical information. In parallel, the efficiency of this mechanism is be enhanced by musical expertise.
CONCLUSION
This study investigated the cortical responses underlying magnitude comparisons of multisensory stimuli and examined the effect that musical expertise has in this process. The results indicated a network of cortical regions that contribute to multisensory integration of quantitative judgments that activate both the symbolic and the approximate magnitude systems. Additionally, the early latency of the responses implies the existence of an implicit mechanism integrating auditory and visual magnitude information. Musicians showed increased activation differences between the conditions suggesting that their long‐term training may induce neuronal plasticity in cortical regions supporting multisensory integration. These results indicate that expertise may affect comparative judgments within a generalized representation of analog magnitude. Importantly, the fact that the rule binding the auditory and visual stimuli was new for both groups argues that the behavioral and neural benefits of long‐term musical training in audiovisual integration are generalizable to newly learned conditions.
ACKNOWLEDGMENTS
The authors would like to thank their test subjects for their cooperation and their technicians for supporting the data acquisition. The funders had no role in study design, data collection and analysis, decision to publish, or preparation of the manuscript.
REFERENCES
- Ahlfors SP, Han J, Belliveau JW, Hämäläinen MS (2010): Sensitivity of MEG and EEG to source orientation. Brain Topogr 23:227–232. [DOI] [PMC free article] [PubMed] [Google Scholar]
- Alpert GF, Hein G, Tsai N, Naumer MJ, Knight RT (2008): Temporal characteristics of audiovisual information processing. J Neurosci 28:5344–5349. [DOI] [PMC free article] [PubMed] [Google Scholar]
- Barth H, Kanwisher N, Spelke E (2003): The construction of large number representations in adults. Cognition 86:201–221. [DOI] [PubMed] [Google Scholar]
- Baumann O, Greenlee MW (2007): Neural correlates of coherent audiovisual motion perception. Cereb Cortex 17:1433–1443. [DOI] [PubMed] [Google Scholar]
- Baumann S, Meyer M, Jäncke L (2008): Enhancement of auditory‐evoked potentials in musicians reflects an influence of expertise but not selective attention. J Cogn Neurosci 20:2238–2249. [DOI] [PubMed] [Google Scholar]
- Benoit M, Raij T, Lin F, Jääskeläinen IP, Stufflebeam S (2010): Primary and multisensory cortical activity is correlated with audiovisual percepts. Hum Brain Mapp 31:526–538. [DOI] [PMC free article] [PubMed] [Google Scholar]
- Besle J, Fort A, Delpuech C, Giard M‐H (2004): Bimodal speech: Early suppressive visual effects in human auditory cortex. Eur J Neurosci 20:2225–2234. [DOI] [PMC free article] [PubMed] [Google Scholar]
- Besle J, Hussain Z, Giard M, Bertrand O (2013): The representation of audiovisual regularities in the human brain. J Cogn Neurosci 25:365–373. [DOI] [PubMed] [Google Scholar]
- Bremmer F, Schlack A, Shah NJ, Zafiris O, Kubischik M, Hoffmann K‐P, Zilles K, Fink GR (2001): Polymodal motion processing in posterior parietal and premotor cortex. Neuron 29:287–296. [DOI] [PubMed] [Google Scholar]
- Bruchmann M, Herper K, Konrad C, Pantev C, Huster RJ (2010): Individualized EEG source reconstruction of Stroop interference with masked color words. Neuroimage 49:1800–1809. [DOI] [PubMed] [Google Scholar]
- Butler AJ, James KH (2013): Active learning of novel sound‐producing objects: Motor reactivation and enhancement of visuo‐motor connectivity. J Cogn Neurosci 25:203–218. [DOI] [PubMed] [Google Scholar]
- Butler AJ, James TW, James KH (2011): Enhanced multisensory integration and motor reactivation after active motor learning of audiovisual associations. J Cogn Neurosci 23:3515–3528. [DOI] [PubMed] [Google Scholar]
- Cantlon JF, Platt ML, Brannon EM (2009): Beyond the number domain. Trends Cogn Sci 13:83–91. [DOI] [PMC free article] [PubMed] [Google Scholar]
- Cappelletti M, Gessaroli E, Hithersay R, Mitolo M, Didino D, Kanai R, Cohen Kadosh R, Walsh V (2013): Transfer of cognitive training across magnitude dimensions achieved with concurrent brain stimulation of the parietal lobe. J Neurosci 33:14899–14907. [DOI] [PMC free article] [PubMed] [Google Scholar]
- Chick CF (2014): Basic mechanisms of numerical processing: Cross‐modal number comparisons and symbolic versus nonsymbolic numerosity in the intraparietal sulcus. J Neurosci 34:1567–1569. [DOI] [PMC free article] [PubMed] [Google Scholar]
- Csépe V, Pantev C, Hoke M, Hampson S, Ross B (1992): Evoked magnetic responses of the human auditory cortex to minor pitch changes: Localization of the mismatch field. Electroencephalogr Clin Neurophysiol 84:538–548. [DOI] [PubMed] [Google Scholar]
- Dannhauer M, Lanfer B, Wolters CH, Knösche TR (2011): Modeling of the human skull in EEG source analysis. Hum Brain Mapp 32:1383–1399. [DOI] [PMC free article] [PubMed] [Google Scholar]
- Dehaene S (1992): Varieties of numerical abilities. Cognition 44:1–42. [DOI] [PubMed] [Google Scholar]
- Dehaene S (1996): The organization of brain activations in number comparison: Event‐related potentials and the additive‐factors method. J Cogn Neurosci 8:47–68. [DOI] [PubMed] [Google Scholar]
- Dehaene S (1999): Sources of mathematical thinking: Behavioral and brain‐imaging evidence. Science 284:970–974. [DOI] [PubMed] [Google Scholar]
- Dehaene S, Piazza M, Pinel P, Cohen L (2003): Three parietal circuits for number processing. Cogn Neuropsychol 20:487–506. [DOI] [PubMed] [Google Scholar]
- Evans KK, Treisman A (2010): Natural cross‐modal mappings between visual and auditory features. J Vis 10:1–12. [DOI] [PMC free article] [PubMed] [Google Scholar]
- Fuchs M, Kastner J, Wagner M, Hawes S, Ebersole JS (2002): A standardized boundary element method volume conductor model. Clin Neurophysiol 113:702–712. [DOI] [PubMed] [Google Scholar]
- Geddes LA, Baker LE (1967): The specific resistance of biological material‐a compendium of data for the biomedical engineer and physiologist. Med Biol Eng 5:271–293. [DOI] [PubMed] [Google Scholar]
- Ghazanfar AA, Schroeder CE (2006): Is neocortex essentially multisensory? Trends Cogn Sci 10:278–285. [DOI] [PubMed] [Google Scholar]
- Goldenholz DM, Ahlfors SP, Hämäläinen MS, Sharon D, Ishitobi M, Vaina LM, Stufflebeam SM (2009): Mapping the signal‐to‐noise‐ratios of cortical sources in magnetoencephalography and electroencephalography. Hum Brain Mapp 30:1077–1086. [DOI] [PMC free article] [PubMed] [Google Scholar]
- Herholz SC, Zatorre RJ (2012): Musical training as a framework for brain plasticity: Behavior, function, and structure. Neuron 76:486–502. [DOI] [PubMed] [Google Scholar]
- Hsu Y‐F, Szűcs D (2012): The time course of symbolic number adaptation: Oscillatory EEG activity and event‐related potential analysis. Neuroimage 59:3103–3109. [DOI] [PubMed] [Google Scholar]
- Ille N, Berg P, Scherg M (2002): Artifact correction of the ongoing EEG using spatial filters based on artifact and brain signal topographies. J Clin Neurophysiol 19:113–124. [DOI] [PubMed] [Google Scholar]
- Innes‐Brown H, Crewther D (2009): The impact of spatial incongruence on an auditory‐visual illusion. PLoS One 4:e6450. [DOI] [PMC free article] [PubMed] [Google Scholar]
- Jones EG, Powell TP (1970): An anatomical study of converging sensory pathways within the cerebral cortex of the monkey. Brain 93:793–820. [DOI] [PubMed] [Google Scholar]
- Jordan KE, Brannon EM (2006): The multisensory representation of number in infancy. Proc Natl Acad Sci USA 103:3486–3489. [DOI] [PMC free article] [PubMed] [Google Scholar]
- Kadosh R, Walsh V (2009): Numerical representation in the parietal lobes: Abstract or not abstract? Behav Brain Sci 32:313–328. [DOI] [PubMed] [Google Scholar]
- Kayser C, Petkov CI, Logothetis NK (2008): Visual modulation of neurons in auditory cortex. Cereb Cortex 18:1560–1574. [DOI] [PubMed] [Google Scholar]
- Keuper K, Zwanzger P, Nordt M, Eden A, Laeger I, Zwitserlood P, Kissler J, Junghöfer M, Dobel C (2014): How “love” and “hate” differ from “sleep”: Using combined electro/magnetoencephalographic data to reveal the sources of early cortical responses to emotional words. Hum Brain Mapp 35:875–888. [DOI] [PMC free article] [PubMed] [Google Scholar]
- Knops A, Willmes K (2014): Numerical ordering and symbolic arithmetic share frontal and parietal circuits in the right hemisphere. Neuroimage 84:786–795. [DOI] [PubMed] [Google Scholar]
- Krause F, Bekkering H, Lindemann O (2013a): A feeling for numbers: Shared metric for symbolic and tactile numerosities. Front Psychol 4:7. [DOI] [PMC free article] [PubMed] [Google Scholar]
- Krause F, Lindemann O, Toni I, Bekkering H (2013b): Different brains process numbers differently: Structural bases of individual differences in spatial and nonspatial number representations. J Cogn Neurosci 1–9. [DOI] [PubMed] [Google Scholar]
- Kuriki S, Kanda S, Hirata Y (2006): Effects of musical experience on different components of MEG responses elicited by sequential piano‐tones and chords. J Neurosci 26:4046–4053. [DOI] [PMC free article] [PubMed] [Google Scholar]
- Laurienti PJ, Wallace MT, Maldjian JA, Susi CM, Stein BE, Burdette JH (2003): Cross‐modal sensory processing in the anterior cingulate and medial prefrontal cortices. Hum Brain Mapp 19:213–223. [DOI] [PMC free article] [PubMed] [Google Scholar]
- Lee HLH, Noppeney U (2011): Long‐term music training tunes how the brain temporally binds signals from multiple senses. Proc Natl Acad Sci USA 108:E1441–E1450. [DOI] [PMC free article] [PubMed] [Google Scholar]
- Liu H, Qin W, Li W, Fan L, Wang J, Jiang T, Yu C (2013): Connectivity‐based parcellation of the human frontal pole with diffusion tensor imaging. J Neurosci 33:6782–6790. [DOI] [PMC free article] [PubMed] [Google Scholar]
- Macaluso E, George N, Dolan R, Spence C, Driver J (2004): Spatial and temporal factors during processing of audiovisual speech: A PET study. Neuroimage 21:725–732. [DOI] [PubMed] [Google Scholar]
- Marco‐Pallarés J, Grau C, Ruffini G (2005): Combined ICA‐LORETA analysis of mismatch negativity. Neuroimage 25:471–477. [DOI] [PubMed] [Google Scholar]
- Moyer RS, Landauer TK (1967): Time required for judgements of numerical inequality. Nature 215:1519–1520. [DOI] [PubMed] [Google Scholar]
- Musacchia G, Sams M, Skoe E, Kraus N (2007): Musicians have enhanced subcortical auditory and audiovisual processing of speech and music. Proc Natl Acad Sci USA 104:15894–15898. [DOI] [PMC free article] [PubMed] [Google Scholar]
- Näätänen R (1995): The mismatch negativity: A powerful tool for cognitive neuroscience. Ear Hear 16:6. [PubMed] [Google Scholar]
- Näätänen R, Paavilainen P, Reinikainen K (1989): Do event‐related potentials to infrequent decrements in duration of auditory stimuli demonstrate a memory trace in man? Neurosci Lett 107:347–352. [DOI] [PubMed] [Google Scholar]
- Naumer MJ, Doehrmann O, Müller NG, Muckli L, Kaiser J, Hein G (2009): Cortical plasticity of audio‐visual object representations. Cereb cortex 19:1641–1653. [DOI] [PMC free article] [PubMed] [Google Scholar]
- Nichols T (2012): Multiple testing corrections, nonparametric methods, and random field theory. Neuroimage 62:811–815. [DOI] [PubMed] [Google Scholar]
- Ojanen V, Möttönen R, Pekkola J, Jääskeläinen IP, Joensuu R, Autti T, Sams M (2005): Processing of audiovisual speech in Broca's area. Neuroimage 25:333–338. [DOI] [PubMed] [Google Scholar]
- Oldfield R (1971): The assessment and analysis of handedness: The Edinburgh inventory. Neuropsychologia 9:97–113. [DOI] [PubMed] [Google Scholar]
- Olson IR, Gatenby JC, Gore JC (2002): A comparison of bound and unbound audio–visual information processing in the human cerebral cortex. Cogn Brain Res 14:129–138. [DOI] [PubMed] [Google Scholar]
- Paraskevopoulos E, Herholz SC (2013): Multisensory integration and neuroplasticity in the human cerebral cortex. Transl Neurosci 4:337–348. [Google Scholar]
- Paraskevopoulos E, Kuchenbuch A, Herholz SC, Pantev C (2012): Musical expertise induces audiovisual integration of abstract congruency rules. J Neurosci 32:18196–18203. [DOI] [PMC free article] [PubMed] [Google Scholar]
- Paraskevopoulos E, Kuchenbuch A, Herholz SC, Pantev C: Multisensory integration during short‐term music reading training enhances both uni‐ and multisensory cortical processing. J Cogn Neurosci (in press). [DOI] [PubMed] [Google Scholar]
- Parise CV, Spence C (2009): “When birds of a feather flock together”: Synesthetic correspondences modulate audiovisual integration in non‐synesthetes. PLoS One 4:e5664. [DOI] [PMC free article] [PubMed] [Google Scholar]
- Pascual‐Marqui R, Michel C (1994): Low resolution electromagnetic tomography: A new method for localizing electrical activity in the brain. Int J Psychophysiol 18:49–65. [DOI] [PubMed] [Google Scholar]
- Pekkola J, Laasonen M, Ojanen V, Autti T, Jääskeläinen IP, Kujala T, Sams M (2006): Perception of matching and conflicting audiovisual speech in dyslexic and fluent readers: An fMRI study at 3 T. Neuroimage 29:797–807. [DOI] [PubMed] [Google Scholar]
- Petrini K, Dahl S, Rocchesso D, Waadeland CH, Avanzini F, Puce A, Pollick FE (2009): Multisensory integration of drumming actions: Musical expertise affects perceived audiovisual asynchrony. Exp Brain Res 198:339–352. [DOI] [PubMed] [Google Scholar]
- Piazza M, Pinel P, Le Bihan D, Dehaene S (2007): A magnitude code common to numerosities and number symbols in human intraparietal cortex. Neuron 53:293–305. [DOI] [PubMed] [Google Scholar]
- Pinel P, Piazza M, Le Bihan D, Dehaene S (2004): Distributed and overlapping cerebral representations of number, size, and luminance during comparative judgments. Neuron 41:983–993. [DOI] [PubMed] [Google Scholar]
- Raij T, Uutela K, Hari R (2000): Audiovisual integration of letters in the human brain. Neuron 28:617–625. [DOI] [PubMed] [Google Scholar]
- Ramnani N, Owen AM (2004): Anterior prefrontal cortex: Insights into function from anatomy and neuroimaging. Nat Rev Neurosci 5:184–194. [DOI] [PubMed] [Google Scholar]
- Rorden C, Brett M (2000): Stereotaxic display of brain lesions. Behav Neurol 12:191–200. [DOI] [PubMed] [Google Scholar]
- Rullmann M, Anwander A, Dannhauer M, Warfield SK, Duffy FH, Wolters CH (2009): EEG source analysis of epileptiform activity using a 1 mm anisotropic hexahedra finite element head model. Neuroimage 44:399–410. [DOI] [PMC free article] [PubMed] [Google Scholar]
- Rüsseler J, Altenmüller E, Nager W, Kohlmetz C, Münte TF (2001): Event‐related brain potentials to sound omissions differ in musicians and non‐musicians. Neurosci Lett 308:33–36. [DOI] [PubMed] [Google Scholar]
- Saito DN, Yoshimura K, Kochiyama T, Okada T, Honda M, Sadato N (2005): Cross‐modal binding and activated attentional networks during audio‐visual speech integration: A functional MRI study. Cereb cortex 15:1750–1760. [DOI] [PubMed] [Google Scholar]
- Schön D, Besson M (2005): Visually induced auditory expectancy in music reading: A behavioral and electrophysiological study. J Cogn Neurosci 17:694–705. [DOI] [PubMed] [Google Scholar]
- Schön D, Anton JLJL, Roth M, Besson M (2002): An fMRI study of music sight‐reading. Neuroreport 13:2285–2289. [DOI] [PubMed] [Google Scholar]
- Shahin A, Bosnyak DJ, Trainor LJ, Roberts LE (2003): Enhancement of Neuroplastic P2 and N1c Auditory Evoked Potentials in Musicians. J Neurosci 23:5545–5552. [DOI] [PMC free article] [PubMed] [Google Scholar]
- Shahin A, Roberts L, Pantev C, Trainor L, Ross B (2005): Modulation of P2 auditory‐evoked responses by the spectral complexity of musical sounds. Neuroreport 16:1781–1785. [DOI] [PubMed] [Google Scholar]
- Sharon D, Hämäläinen MS, Tootell RBH, Halgren E, Belliveau JW (2007): The advantage of combining MEG and EEG: Comparison to fMRI in focally stimulated visual cortex. Neuroimage 36:1225–1235. [DOI] [PMC free article] [PubMed] [Google Scholar]
- Song X‐W, Dong Z‐Y, Long X‐Y, Li S‐F, Zuo X‐N, Zhu C‐Z, He Y, Yan C‐G, Zang Y‐F (2011): REST: A Toolkit for Resting‐State Functional Magnetic Resonance Imaging Data Processing. PLoS One 6:e25031. [DOI] [PMC free article] [PubMed] [Google Scholar]
- Spence C, Deroy O (2013): How automatic are crossmodal correspondences? Conscious Cogn 22:245–260. [DOI] [PubMed] [Google Scholar]
- Stekelenburg JJ, Vroomen J (2007): Neural correlates of multisensory integration of ecologically valid audiovisual events. J Cogn Neurosci 19:1964–1973. [DOI] [PubMed] [Google Scholar]
- Stewart L (2005): A neurocognitive approach to music reading. Ann N Y Acad Sci 1060:377–386. [DOI] [PubMed] [Google Scholar]
- Stewart L, Henson R, Kampe K, Walsh V, Turner R, Frith U (2003): Brain changes after learning to read and play music. Neuroimage 20:71–83. [DOI] [PubMed] [Google Scholar]
- Stewart L, Walsh V, Frith U (2004): Reading music modifies spatial mapping in pianists. Percept Psychophys 66:183–195. [DOI] [PubMed] [Google Scholar]
- Tervaniemi M, Huotllainen M, Bratiico E, Ilmoniemi RJ, Reinlkainen K, Alho K (2003): Event‐related potentials to expectancy violation in musical context. Music Sci 7:241–261. [Google Scholar]
- Tervaniemi M, Sinkkonen J, Virtanen J, Kallio J, Ilmoniemi R, Salonen O, Näätänen R (2005): Test‐retest stability of the magnetic mismatch response (MMNm). Clin Neurophysiol 116:1897–1905. [DOI] [PubMed] [Google Scholar]
- Tse C‐Y, Tien K‐R, Penney TB (2006): Event‐related optical imaging reveals the temporal dynamics of right temporal and frontal cortex activation in pre‐attentive change detection. Neuroimage 29:314–320. [DOI] [PubMed] [Google Scholar]
- Tzourio‐Mazoyer N, Landeau B, Papathanassiou D, Crivello F, Etard O, Delcroix N, Mazoyer B, Joliot M (2002): Automated anatomical labeling of activations in SPM using a macroscopic anatomical parcellation of the MNI MRI single‐subject brain. Neuroimage 15:273–289. [DOI] [PubMed] [Google Scholar]
- Van Wassenhove V, Grant KW, Poeppel D (2005): Visual speech speeds up the neural processing of auditory speech. Proc Natl Acad Sci USA 102:1181–1186. [DOI] [PMC free article] [PubMed] [Google Scholar]
- Vatakis A, Spence C (2006): Audiovisual synchrony perception for speech and music assessed using a temporal order judgment task. Neurosci Lett 393:40–44. [DOI] [PubMed] [Google Scholar]
- Walker P, Bremner J, Mason U, Spring J, Mattok K, Slater A, Johnson S (2010): Preverbal infants' sensitivity to synaesthetic cross‐modality correspondences. Psychol Sci 21:21–25. [DOI] [PubMed] [Google Scholar]
- Walsh V (2003): A theory of magnitude: Common cortical metrics of time, space and quantity. Trends Cogn Sci 7:483–488. [DOI] [PubMed] [Google Scholar]
- Wolters CH, Anwander A, Tricoche X, Weinstein D, Koch MA, MacLeod RS (2006): Influence of tissue conductivity anisotropy on EEG/MEG field and return current computation in a realistic head model: A simulation and visualization study using high‐resolution finite element modeling. Neuroimage 30:813–826. [DOI] [PubMed] [Google Scholar]
- Wright TM, Pelphrey KA, Allison T, McKeown MJ, McCarthy G. (2003): Polysensory interactions along lateral temporal regions evoked by audiovisual speech. Cereb Cortex 13:1034–1043. [DOI] [PubMed] [Google Scholar]
- Zatorre RJ, Chen J, Penhune V (2007): When the brain plays music: Auditory–motor interactions in music perception and production. Nat Rev Neurosci 8:547–558. [DOI] [PubMed] [Google Scholar]