

Abstract
Increased dopamine availability may be associated with impaired structural maturation of brain white matter connectivity. This study aimed to derive a comprehensive, whole‐brain characterization of large‐scale axonal connectivity differences in attention‐deficit/hyperactivity disorder (ADHD) associated with catechol‐O‐methyltransferase gene (COMT) Val158Met polymorphism. Using diffusion tensor imaging, whole‐brain tractography, and an imaging connectomics approach, we characterized altered white matter connectivity in youth with ADHD who were COMT Val‐homozygous (N = 29) compared with those who were Met‐carriers (N = 29). Additionally, we examined whether dopamine transporter gene (DAT1) and dopamine D4 receptor gene (DRD4) polymorphisms were associated with white matter differences. Level of attention was assessed using the continuous performance test before and after an 8‐week open‐label trial of methylphenidate (MPH). A network of white matter connections linking 18 different brain regions was significantly weakened in youth with ADHD who were COMT Met‐carriers compared to those who were Val‐homozygous (P < 0.05, family‐wise error‐corrected). A measure of white matter integrity, fractional anisotropy, was correlated with impaired pretreatment performance in continuous performance test omission errors and response time variability, as well as with improvement in continuous performance test response time variability after MPH treatment. Altered white matter connectivity was exclusively based on COMT genotypes, and was not evident in DAT1 or DRD4. We demonstrated that white matter connectivity in youth with ADHD is associated with COMT Val158Met genotypes. The present findings suggest that different layers of dopamine‐related genes and interindividual variability in the genetic polymorphisms should be taken into account when investigating the human connectome. Hum Brain Mapp, 36:367–377, 2015. © 2014 Wiley Periodicals, Inc.
Keywords: attention‐deficit/hyperactivity disorder, catechol‐O‐methyltransferase, diffusion tensor imaging, methylphenidate, white matter
INTRODUCTION
Attention‐deficit/hyperactivity disorder (ADHD) is a neurobehavioral condition commonly occurring in children and usually persisting into adulthood, characterized with symptoms of inattention and/or hyperactivity/impulsivity [Polanczyk et al., 2007]. Both alterations in neurotransmitter systems, especially the dopamine system [Froehlich et al., 2010; Swanson et al., 2000], and the brain's structural architecture, such as white matter connectivity [van Ewijk et al., 2012], have been associated with ADHD. Although many studies have explored either the brain's dopamine system or white matter connectivity separately, it is unclear whether and how these two different aspects of the human brain integrate and result in cognitive or behavioral alterations in ADHD patients.
Dopaminergic neurotransmission has been implicated both in the etiology and in the pharmacological treatment response of ADHD, and dopamine transporter gene (DAT1) and dopamine D4 receptor gene (DRD4) are among the most extensively investigated susceptibility genes [Durston, 2010; Froehlich et al., 2010]. DAT1 encodes the major site of action for methylphenidate (MPH) [Volkow et al., 2002] and the variable number of tandem repeat (VNTR) located in the 3′ untranslated region of the DAT1 has been implicated in both ADHD itself [Gizer et al., 2009] and its treatment using MPH [Cheon et al., 2005; Kooij et al., 2008; Roman et al., 2002; Winsberg and Comings, 1999]. DRD4 also encodes a major component of dopamine signaling, particularly involved in the firing rate of dopamine neurons [Froehlich et al., 2010]. Although the 7‐repeat allele at the VNTR in exon III of the DRD4 has been the focus of many published studies [Gizer et al., 2009; Hamarman et al., 2004], this allele is very rare in East Asians [Chang et al., 1996], and homozygosity of the 4‐repeat allele has been associated with a better response to MPH [Cheon et al., 2007; Froehlich et al., 2011]. However, opposing results have also been observed regarding both DAT1 [Bellgrove et al., 2005; Kirley et al., 2003; McGough et al., 2006; Mick et al., 2006; Stein et al., 2005; Zeni et al., 2007] and DRD4 [McGough et al., 2006; Winsberg and Comings, 1999; Zeni et al., 2007] in relation to ADHD, perhaps suggesting the need to incorporate other contributing factors to ADHD pathogenesis.
It has recently been suggested that high levels of brain dopamine may be associated with reduced myelination of white matter tracts [Thomason et al., 2010]. For example, it was demonstrated in vitro that dopamine receptor activation inhibits myelination [Bongarzone et al., 1998]. In humans, a genetic polymorphism in catechol‐O‐methyltransferase (COMT) has been associated with altered development of white matter [Li et al., 2009; Thomason et al., 2010; Zhang et al., 2013]. COMT enzyme plays a key role in the metabolism of dopamine, and a single nucleotide polymorphism leading to a valine (Val) to methionine (Met) substitution at codon 158 (Val158Met) of COMT has been estimated to result in an approximately threefold to fourfold decrease in enzymatic activity [Mannisto and Kaakkola, 1999] and thus increased dopamine availability [Tunbridge et al., 2004]. Using diffusion tensor imaging in healthy children and adolescents, the Met allele of this polymorphism, indicating higher dopamine availability, was found to be associated with reduced fractional anisotropy, a localized measure of white matter integrity thought to reflect reduced myelination [Thomason et al., 2010]. In sum, increased dopamine availability is associated with altered maturation of white matter connectivity both in vitro and in vivo. However, it is largely unknown whether variation in white matter connectivity and microstructure is associated with other genes involved in dopamine transmission, such as the VNTR located in the 3′ untranslated region of the DAT1 and the VNTR in exon III of the DRD4, which are among the most studied polymorphisms in relation to ADHD [Froehlich et al., 2010], making COMT relatively unique to white matter development.
We investigated whether variation in white matter connectivity in youth with ADHD is explained by the COMT Val158Met polymorphism. The dopaminergic involvement both in the pathophysiology and pharmacological treatment of ADHD makes these patients ideal candidates for examining the relationship between COMT polymorphism and brain white matter integrity. We hypothesized that specific axonal circuits are more extensively myelinated in ADHD youth who are homozygous for the Val allele compared to Met‐carriers, in line with the findings observed in vitro and in healthy children [Bongarzone et al., 1998; Thomason et al., 2010]. We sought to test whether this hypothesized variation in the extent of myelination manifests at the level of the human connectome and whether it can be localized to white matter connections showing microstructural differences between the two genotypes. By combining diffusion tensor imaging tractography [Zalesky et al., 2011] and an imaging connectomics approach [Li et al., 2012; Sporns, 2012], detailed and comprehensive maps of inter‐regional brain connectivity were obtained in a relatively large, clinical sample of children and adolescents diagnosed with ADHD, which enabled us to conduct a stringent test of our hypothesis. We then tested whether any variation in white matter connectivity associated with the COMT polymorphism confers functional effects, as evidenced by correlations between measures of white matter integrity and continuous performance test performance or treatment response to MPH. The latter variables were chosen in light of dopaminergic involvement, as continuous performance test performance is a proposed endophenotype of ADHD that is modulated by variation in dopaminergic genes [Kebir et al., 2009; Kollins et al., 2008] and MPH is one of the most widely prescribed therapeutic agents for ADHD [Santosh and Taylor, 2000; Wilens, 2008] that acts by increasing the amount of dopamine in the synapse [Froehlich et al., 2010; Volkow et al., 2002]. A point of note is that although we hypothesized COMT polymorphism rather than DAT1 or DRD4 to be related with white matter integrity in ADHD patients, we also explored DAT1 and DRD4 considering their importance in the dopamine pathway and in ADHD [Durston, 2010; Froehlich et al., 2010; Gizer et al., 2009]. We consider that our specific focus on white matter integrity in the current study may improve our understanding of ADHD, which is pathologically complex with multifaceted etiologies [Thapar et al., 2013].
MATERIALS AND METHODS
Participants
Given recent evidence suggesting that pharmacological treatment for no longer than 6 months may induce brain structural changes in children with ADHD [Hoekzema et al., 2014], we studied only the stimulant‐ (including both MPH and amphetamines) and atomoxetine‐naïve patients (N = 61) among the participants described in detail elsewhere [Hong et al., 2014]. Besides medication history, the exclusion criteria comprised an intelligence quotient below 70, and a past or an ongoing history of tic disorder, obsessive compulsive disorder, language disorder, learning disorder, convulsive disorder, pervasive developmental disorder, schizophrenia, bipolar disorder, or brain damage. The study protocol was approved by the institutional review board for human subjects at the Seoul National University Hospital. Detailed information about the study was given to parents and children, and written informed consents were obtained prior to study entry.
Clinical Evaluations and MPH Administration
We assessed the presence of ADHD and other psychiatric diagnoses using a semistructured diagnostic interview, the K‐SADS‐PL. The validity and reliability of the original and the Korean versions of the K‐SADS‐PL have been established [Kaufman et al., 1997; Kim et al., 2004]. The diagnostic interview using the K‐SADS‐PL was performed by certified child and adolescent psychiatrists. Level of attention was assessed using a standardized visual version of the computerized continuous performance test [Greenberg and Waldman, 1993]. The continuous performance test was standardized for age among Korean children and adolescents, and its reliability and validity as a diagnostic instrument for ADHD has been established [Shin et al., 2000]. In this study, we used two major variables: omission errors (a measure of inattention) and response time variability (a measure of consistency of attention) [Epstein et al., 2003].
The participants were enrolled in an 8‐week, open‐label trial of MPH. Initial doses of MPH were subsequently adjusted every 2 weeks until sufficient therapeutic effects were achieved, and then the doses were maintained for the remainder of the 8 weeks. In this study, MPH was administered after diffusion tensor imaging scanning, and the continuous performance test scores were measured both before and after the MPH trial.
Genotyping of Dopaminergic Genes
We investigated the effects of three polymorphisms: the COMT Val158Met was the polymorphism of primary interest, and we also explored the effects of the VNTR located on the 3′ untranslated region of the DAT1 as well as the VNTR in exon III of the DRD4 to test the specificity of findings with COMT. For details of the procedures used for genotyping, see Supporting Information. For each polymorphism, participants were divided into two groups based on their genotypes, which was in accordance with the methods in previous studies [Cheon et al., 2005, 2007, 2008].
Among the 61 drug‐naïve youth with ADHD, 32 were COMT Val‐homozygous, 27 were Val/Met‐heterozygous, and 2 were Met‐homozygous. The three oldest patients were excluded from the Val‐homozygous group to match the age and sample size with the Met‐carrier group. The genotype frequencies of the polymorphisms in this final sample (N = 58) are presented in Supporting Information Table S1. The distributions of the genotypes were all in agreement with the expected values of the Hardy–Weinberg equilibrium (P > 0.05).
Image Acquisition and Processing
The image acquisition and processing implemented herein, including whole‐brain tractography, was based on standard protocols and methods used in previous work [Zalesky et al., 2011] with a few modifications (see Supporting Information for details), and is identical to our recent analysis performed in a similar cohort [Hong et al., 2014]. In brief, for each individual, we seeded streamlines throughout all of white matter and reconstructed the connectome using a parcellation with 116 different cortical and subcortical regions [Tzourio‐Mazoyer et al., 2002]. A total of 20 streamlines was generated from random locations within each white matter voxel. Streamlines were propagated using the interpolated streamline method and were terminated as soon as they reached a cortical or subcortical voxel. Streamlines were ignored if they terminated in white matter or if they interconnected only a single region. Streamlines were registered to Montreal Neurological Institute space by applying the rotation matrices resulting from the registration of each individual's fractional anisotropy image to a custom template (see Supporting Information), after which the total number of streamlines interconnecting each pair of regions was enumerated using customized software. The connectivity between each pair of regions was quantified by the number of interconnecting streamlines as well as the average fractional anisotropy over the volume delineated by these streamlines. The tract‐averaged fractional anisotropy was calculated by averaging voxel estimates across all voxels intersected by at least one streamline that interconnected the pair of regions associated with the tract.
Data Analyses
The network‐based statistic [Zalesky et al., 2010, 2012] (http://www.nitrc.org/projects/nbs/) was used to identify regional brain networks showing a significant between‐group difference in inter‐regional connectivity strength. Specifically, a t‐test was performed to test for a between‐group difference in the streamline count at each of the N(N − 1)/2 = 6,670 unique regional pairings. Interconnected networks, formally known as graph components, were then identified among the connections with a t‐statistic exceeding a predefined t‐threshold of 2, approximately corresponding to an uncorrected P‐value of 0.05. A graph component represents a set of connections for which the null hypothesis can be rejected at a significance that is not corrected for multiple comparisons. The network‐based statistic corrects for multiple comparisons across the family of all regional pairings by testing for evidence against the null at the level of graph components, rather than at the level of individual connections. To this end, a family‐wise error‐corrected P‐value was calculated for the size of each graph component using permutation testing (10,000 permutations) [Nichols and Holmes, 2002]. A family‐wise error‐corrected P‐value was then estimated for each component as the proportion of permutations that yielded a larger component or one of equal size.
Networks identified with the network‐based statistic defined pairs of cortical and subcortical regions interconnected by a significantly different number of streamlines between the two genotypic groups. A pair of regions interconnected by significantly fewer streamlines suggests that the number of interconnecting axons may also be fewer, less well myelinated or affected by pathology. To differentiate between these alternatives, a tract‐averaged fractional anisotropy value was also extracted for each fiber bundle, by averaging the fractional anisotropy values over all voxels intersected by at least one streamline associated with the bundle.
Pearson's correlation coefficient was used to evaluate any potential association between fractional anisotropy and the continuous performance test scores or the changes in the continuous performance test scores after MPH treatment (i.e., pre‐ minus post‐treatment continuous performance test scores were used to estimate the MPH response). Fractional anisotropy is a continuous measure of white matter integrity, whereas the streamline counts are integer values. Thus, fractional anisotropy was used in the post hoc correlation analysis to avoid potential binning artifacts associated with an integer scale. To avoid making normality assumptions, bootstrapped P‐values were obtained with 10,000 samples. Statistical tests were performed using SPSS 20.0 (SPSS, Chicago, IL) and results are reported with a significance threshold of P < 0.05 (two‐tailed).
RESULTS
Participant Characteristics
Participants either with or without the COMT Val/Val genotype were not significantly different in age, gender distribution, intelligence level, handedness, body weight, parental education, socioeconomic status, maternal age at pregnancy, birth weight, ADHD subtypes, pretreatment continuous performance test scores, comorbidity of oppositional defiant disorder or anxiety disorder, and MPH dose at the end of the eighth week (Table 1). In addition, no significant differences were found in the variables above between the participants either with or without the DAT1 VNTR 10/10 genotype (Supporting Information Table S2), or between the participants either with or without the DRD4 VNTR 4/4 genotype (Supporting Information Table S3).
Table 1.
Demographic and clinical characteristics of the participants
| ADHD (N = 58) | Val/Val (N = 29) | Met/Val + Met/Met (N = 29) | P | ||||
|---|---|---|---|---|---|---|---|
| Age (years), mean (SD) | 8.69 | (2.13) | 8.54 | (1.66) | 8.21 | (2.57) | 0.72 |
| Gender (female), N (%) | 13 | (22.4) | 5 | (17.2) | 8 | (27.6) | 0.34 |
| Body weight (kg), mean (SD) | 32.86 | (11.65) | 34.03 | (10.93) | 31.69 | (12.42) | 0.44 |
| Intelligence quotient, mean (SD) | 105.00 | (12.41) | 106.97 | (11.21) | 103.03 | (13.40) | 0.23 |
| Handedness (right), N (%) | 51 | (87.9) | 25 | (86.2) | 26 | (89.7) | 0.99 |
| Continuous performance test, mean (SD) | |||||||
| Omission errors | 66.84 | (20.42) | 64.55 | (20.90) | 71.86 | (20.70) | 0.18 |
| Response time variability | 66.45 | (17.17) | 64.14 | (17.56) | 66.83 | (17.99) | 0.56 |
| Social variables | |||||||
| Paternal education (years), mean (SD) | 14.91 | (1.90) | 14.89 | (2.02) | 14.92 | (1.80) | 0.95 |
| Maternal education (years), mean (SD) | 14.82 | (1.84) | 14.62 | (1.94) | 15.04 | (1.74) | 0.41 |
| Familial socioeconomic status, N (%) | 0.17 | ||||||
| High (very or moderately) | 14 | (25.9) | 6 | (21.5) | 8 | (30.8) | |
| Middle class | 32 | (59.3) | 20 | (71.4) | 12 | (46.2) | |
| Low (very or moderately) | 8 | (14.8) | 2 | (7.1) | 6 | (23.0) | |
| Obstetric variables, mean (SD) | |||||||
| Maternal age at pregnancy (years) | 29.84 | (3.59) | 29.88 | (3.50) | 29.80 | (3.76) | 0.93 |
| Child's birth weight (kg) | 3.26 | (0.47) | 3.32 | (0.47) | 3.20 | (0.47) | 0.38 |
| ADHD types, N (%) | 0.44 | ||||||
| Combined | 33 | (56.9) | 18 | (62.1) | 15 | (51.7) | |
| Inattentive | 19 | (32.8) | 10 | (34.5) | 9 | (31.0) | |
| Hyperactive‐impulsive | 1 | (1.7) | 0 | (0.0) | 1 | (3.4) | |
| Not otherwise specified | 5 | (8.6) | 1 | (3.4) | 4 | (13.8) | |
| Oppositional defiant disorder, N (%) | 11 | (19.0) | 3 | (10.3) | 8 | (27.6) | 0.09 |
| Anxiety disorder, N (%) | 2 | (3.4) | 0 | (0.0) | 2 | (6.9) | 0.49 |
| Final MPH dose (mg), mean (SD) | 30.44 | (11.49) | 31.10 | (11.37) | 29.61 | (11.85) | 0.64 |
| Final MPH dose per weight (mg/kg), mean (SD) | 0.94 | (0.26) | 0.92 | (0.28) | 0.97 | (0.24) | 0.55 |
Different number of total respondents for paternal education (N = 54), maternal education (N = 51), familial socioeconomic status (N = 54), maternal age at pregnancy (N = 52), child's birth weight (N = 51) and final MPH dose (N = 52). ADHD, attention‐deficit/hyperactivity disorder; MPH, methylphenidate; SD, standard deviation.
The two groups either with or without the COMT Val/Val genotype did not differ in maximum head translation or rotation as well as mean head translation or rotation along the three [x, y, z] axes (P > 0.05), except a significantly greater mean displacement observed in Met‐carriers along the z‐axis (Supporting Information Table S4). No significant difference was found between these two groups in the volume of the binary white matter mask from which streamline seed points were sampled (P > 0.05). In addition, no significant difference was found in the head motion parameters as well as in the volume of the binary white matter mask between the participants either with or without the DAT1 VNTR 10/10 genotype, or between the participants either with or without the DRD4 VNTR 4/4 genotype (P > 0.05).
Differences in White Matter Connectivity According to Genotype
A single network was identified showing significantly (P = 0.048, family‐wise error‐corrected) decreased connectivity in youth with ADHD who were COMT Met‐carriers compared to those who were Val‐homozygous. The network comprised 19 links, involving 18 different brain regions (Fig. 1, Table 2). Figure 1 was visualized with the BrainNet Viewer [Xia et al., 2013] (http://www.nitrc.org/projects/bnv/). We did not identify any network with significantly decreased connectivity in the Val‐homozygous group. In addition, we did not identify any network showing significant differences in connectivity between the participants either with or without the DAT1 VNTR 10/10 genotype (P > 0.05), or between the participants either with or without the DRD4 VNTR 4/4 genotype (P > 0.05).
Figure 1.
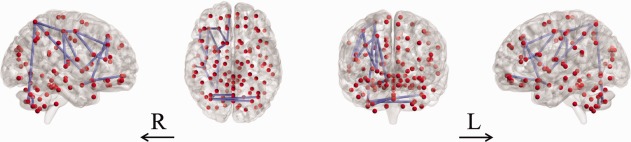
Significantly decreased white matter connectivity in youth with ADHD who were COMT Met‐carriers compared to those who were Val‐homozygous. A single abnormal network was identified (t = 2). ADHD, attention‐deficit/hyperactivity disorder; COMT, catechol‐O‐methyltransferase; L, left; R, right. [Color figure can be viewed in the online issue, which is available at http://wileyonlinelibrary.com.]
Table 2.
Individual links of the white matter network differentiating youth with ADHD who were COMT Met‐carriers from those who were Val‐homozygous
| Network 1 |
|---|
| Precentral gyrus, right ↔ Middle frontal gyrus, right |
| Superior frontal gyrus, right ↔ Middle frontal gyrus, right |
| Precentral gyrus, right ↔ Inferior frontal gyrus (operculum), right |
| Middle frontal gyrus, right ↔ Inferior frontal gyrus (triangular part), right |
| Inferior frontal gyrus (operculum), right ↔ Inferior frontal gyrus (triangular part), right |
| Superior frontal gyrus, right ↔ Olfactory gyrus, right |
| Olfactory gyrus, right ↔ Medial frontal gyrus (orbital part), right |
| Olfactory gyrus, right ↔ Amygdala, right |
| Precentral gyrus, right ↔ Postcentral gyrus, right |
| Rolandic operculum, right ↔ Postcentral gyrus, right |
| Postcentral gyrus, right ↔ Superior parietal gyrus, right |
| Middle frontal gyrus, right ↔ Pallidum, right |
| Superior parietal gyrus, right ↔ Pallidum, right |
| Postcentral gyrus, right ↔ Superior temporal gyrus, right |
| Superior parietal gyrus, right ↔ Cerebellar hemisphere (Crus II), right |
| Cerebellar hemisphere (Crus I), left ↔ Cerebellar hemisphere (Crus II), right |
| Cerebellar hemisphere (Crus II), left ↔ Cerebellar hemisphere (Crus II), right |
| Cerebellar hemisphere (Crus II), right ↔ Cerebellar hemisphere (lobule VIIb), right |
| Cerebellar hemisphere (lobule VIIb), right ↔ Cerebellar vermis (lobule VIII) |
ADHD, attention‐deficit/hyperactivity disorder.
The network differentiating the COMT Val‐homozygous group from the Met‐carriers was predominantly confined to the right hemisphere. We performed an additional exploratory analysis by lowering the statistical threshold (P < 0.10, family‐wise error‐corrected). As a result, a second network was identified showing marginally decreased connectivity (P = 0.073) in youth with ADHD who were COMT Met‐carriers compared to those who were Val‐homozygous (Supporting Information Fig. S1 and Table S5). This network was left‐predominant.
When we performed the analysis including the three oldest subjects in the Val‐homozygous group, both the right‐ and left‐lateralized differences in the network according to COMT genotype were replicated to some extent (Supporting Information Tables S6 and S7, respectively), however, several differences were noted: left‐ instead of right‐predominant network was statistically significant (P = 0.049 and 0.096, respectively, family‐wise error‐corrected); altered subnetwork involving the cerebellum was part of the left‐ instead of right‐predominant network; and new nodes and links were added (28 nodes and 29 links, and 21 nodes and 23 links, in the left‐ and right‐predominant networks, respectively) without eliminating any of the previously included nodes or links. We did not identify any significant (P < 0.05) or trend‐level (P < 0.10) difference in the network according to DAT1 or DRD4 genotype.
Associations with Attentional Performance and MPH Response
Significant negative associations were found between the tract‐averaged fractional anisotropy of each pair‐wise connection in the white matter network that was significantly different between COMT genotype groups and the continuous performance test scores. This subnetwork linked right precentral gyrus, right postcentral gyrus, right superior parietal gyrus, and right pallidum (Fig. 2). Specifically, fractional anisotropy in the fibers connecting right superior parietal gyrus and right pallidum was significantly associated with both omission errors (r = −0.328, P = 0.013) and response time variability (r = −0.259, P = 0.040); fractional anisotropy in the fibers connecting right superior parietal and right postcentral gyri was significantly associated with omission errors (r = −0.317, P = 0.009); and fractional anisotropy in the fibers connecting right postcentral and right precentral gyri was significantly associated with response time variability (r = −0.307, P = 0.022). No significant positive associations were found between fractional anisotropy and the continuous performance test scores.
Figure 2.
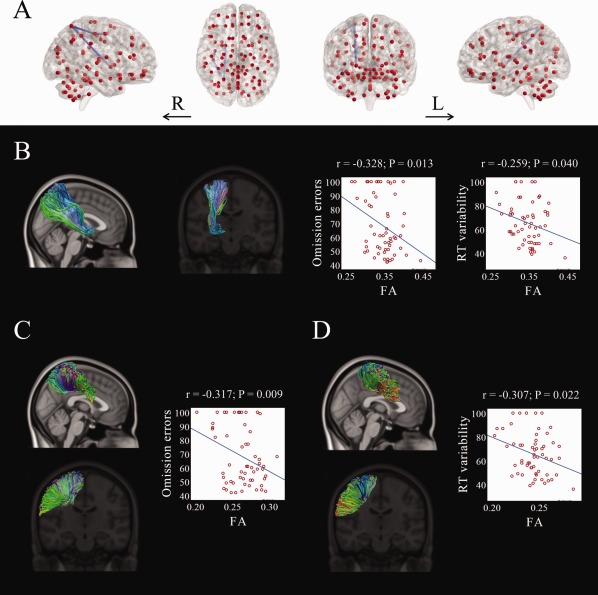
Significant correlations between the tract‐averaged fractional anisotropy value and the continuous performance test scores within the altered white matter network differentiating youth with ADHD who were COMT Met‐carriers from those who were Val‐homozygous. A single subnetwork was identified (A). The fiber tracts linking right pallidum and right superior parietal gyrus (B), right superior parietal gyrus and right postcentral gyrus (C), and right postcentral gyrus and right precentral gyrus (D) are illustrated. ADHD, attention‐deficit/hyperactivity disorder; COMT, catechol‐O‐methyltransferase; L, left; R, right; RT, response time. [Color figure can be viewed in the online issue, which is available at http://wileyonlinelibrary.com.]
Significant positive associations were found between the tract‐averaged fractional anisotropy of each pair‐wise connection in the white matter network that was significantly different between COMT genotype groups and the change in continuous performance test response time variability after the 8‐week trial of MPH. This subnetwork linked right precentral gyrus, right middle frontal gyrus, and right inferior frontal gyrus (Fig. 3). Specifically, fractional anisotropy values in the fibers connecting right precentral and right middle frontal gyri (r = 0.290, P = 0.032), as well as right middle frontal and right inferior frontal gyri (r = 0.321, P = 0.034) were significantly associated with the change in response time variability. No significant negative associations were found between fractional anisotropy and the change in continuous performance test response time variability. No significant associations were found between fractional anisotropy and the change in continuous performance test omission errors.
Figure 3.
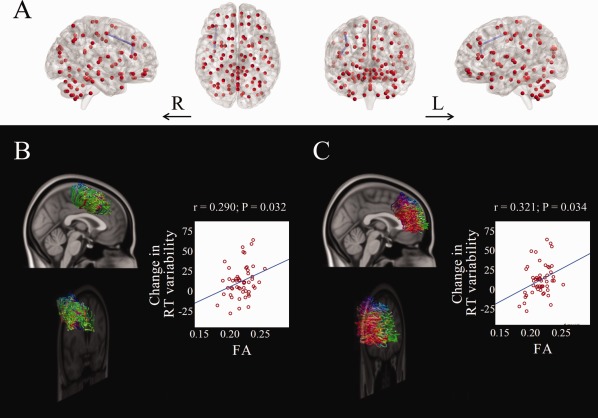
Significant correlations between the tract‐averaged fractional anisotropy value and the changes in continuous performance test response time variability after MPH treatment within the altered white matter network differentiating youth with ADHD who were COMT Met‐carriers from those who were Val‐homozygous. A single subnetwork was identified (A). The fiber tracts linking right precentral gyrus and right middle frontal gyrus (B), and right middle frontal gyrus and right inferior frontal gyrus (C) are illustrated. ADHD, attention‐deficit/hyperactivity disorder; COMT, catechol‐O‐methyltransferase; L, left; MPH, methylphenidate; R, right; RT, response time. [Color figure can be viewed in the online issue, which is available at http://wileyonlinelibrary.com.]
When we partialled out the effect of the pretreatment continuous performance test response time variability using partial correlation analysis, the tract‐averaged fractional anisotropy in the fibers connecting right precentral and right middle frontal gyri as well as right middle frontal and right inferior frontal gyri remained significantly associated with the change in this continuous performance test score (r = 0.375, P = 0.007; r = 0.443, P = 0.001, respectively), with the latter being significant after Bonferroni correction for 38 tests (i.e., 19 links × 2 continuous performance test scores).
DISCUSSION
We found evidence of altered white matter connectivity in youth with ADHD according to their COMT Val158Met genotypes. The network differentiating ADHD patients who were Val‐homozygous from those who were Met‐carriers showed a distributed pattern of white matter microstructural alterations involving a range of cortical, subcortical, and cerebellar brain regions. The findings replicate a previous report on healthy children and adolescents demonstrating that the Met allele of the COMT Val158Met polymorphism was associated with impaired structural maturation of brain white matter connectivity [Thomason et al., 2010], supporting the hypothesis that higher dopamine availability inhibits myelination. The network identified was predominantly right‐lateralized. Although it was a single interconnected network, the overall configuration included an “anterior” frontal‐dominant subnetwork and a “posterior” parietocerebellar subnetwork, which were linked via two brain regions: the globus pallidus and sensorimotor cortex (i.e., precentral and postcentral gyri). The functional significance of these anterior and posterior subnetworks was highlighted by their separate associations with MPH response and continuous performance test performance, respectively. Variation in white matter connectivity according to genotype was specific to COMT, and was not found in DAT1 or DRD4.
Among genes involved in the dopaminergic neurotransmission system, DAT1 has been more strongly implicated than COMT in the neurobiological mechanisms of ADHD [Froehlich et al., 2010]. The COMT enzyme, however, has been postulated to affect the dopamine signal [Matsumoto et al., 2003] especially in brain regions where DAT1 expression is low [Karoum et al., 1994]. COMT expression is widespread and relatively uniform within the human brain [Hong et al., 1998]. COMT is particularly important in regulating cortical dopamine concentrations, whereas DATs regulate dopamine levels in the striatum [Chen et al., 2011]. Moreover, the membrane‐bound COMT, which is the main form in the brain, is evenly located in the cell body, axons and dendrites of cortical neurons, and with its C‐terminal catalytic domain in the extracellular space, the membrane‐bound COMT can inactivate synaptic as well as extrasynaptic or diffused dopamine [Chen et al., 2011]. Therefore, as white matter is distributed throughout the brain rather than localized to a certain part of it, it is conceivable that the influence of dopamine availability on white matter integrity may be better mediated by COMT rather than DAT1.
In contrast to the functional neuroimaging studies of ADHD pointing to clear abnormalities of frontostriatal regions, research on brain white matter have indicated a distributed pattern of abnormalities involving large fiber tracts [van Ewijk et al., 2012] rather than direct frontostriatal connectivity [Hong et al., 2014]. This implies that a brain‐wide causal factor may better account for the white matter abnormalities of ADHD, which is in accordance with the present finding that suggests COMT, but not DAT1 or DRD4, is the culprit. However, COMT and white matter abnormalities may need to be considered in the context of the more complex and multifaceted contributing factors to ADHD pathogenesis.
Besides a single right‐lateralized network that differentiated ADHD patients who were Val‐homozygous from those who were Met‐carriers, we found a second left‐lateralized network that marginally differentiated the two genotypic groups. Therefore, COMT appears to affect white matter in a brain‐wide manner, although we cannot rule out a more prominent influence on the right hemisphere. Even though COMT is almost uniformly expressed within the human brain, the cerebellum has a relatively higher, and the amygdala, thalamus, and occipital lobe relatively lower levels of COMT expression [Hong et al., 1998]. Interestingly, the altered network found in the present study did not include the thalamus, despite the extensive interconnections between the thalamus and other brain structures [Behrens et al., 2003; Young et al., 2004], nor the occipital lobe, although all three other cerebral lobes were included in the network identified; conversely, the altered network showed a prominent involvement of the white matter tracts within the cerebellum, in line with the known expression levels of COMT in the human brain. Our supplementary analysis including the three oldest subjects in the Val‐homozygous group further supports the possibility that COMT affects white matter in a brain‐wide manner, rather than favoring either of the cerebral as well as cerebellar hemispheres.
A posterior subnetwork linking the globus pallidus, superior parietal gyrus, precentral gyrus, and postcentral gyrus was identified, where the fractional anisotropy values negatively correlated with the continuous performance test scores before treatment with MPH. In addition, an anterior subnetwork linking the precentral gyrus, middle frontal gyrus, and inferior frontal gyrus was also identified, where the fractional anisotropy values positively correlated with the change in continuous performance test score after MPH treatment. These findings perhaps imply that the COMT‐related white matter abnormalities in ADHD are not confined to the prefrontal regions, but treatment response to MPH depends on prefrontal resources, which is similar to the prefrontal compensation strategy adopted by ADHD children in a functional magnetic resonance imaging study of intraindividual response time variability [Suskauer et al., 2008].
Some of the limitations regarding diffusion tensor imaging acquisition and processing, revealed in our recent report [Hong et al., 2014], still apply to this work. In brief, one possible issue is that we used diffusion tensor imaging rather than diffusion spectrum imaging. Although diffusion spectrum imaging was shown to be more successful in resolving the crossing of tracts [Wedeen et al., 2008], acquisition of diffusion spectrum imaging requires individuals to lie motionless in the scanner for a longer period of time, which is particularly challenging for youth with ADHD. In addition, diffusion tensor imaging networks were evidenced with better reproducibility [Bassett et al., 2011]. To minimize acquisition time and the risk of motion‐induced artifacts, we used anisotropic voxel dimensions and acquired relatively low angular resolution data, which were at the cost of introducing possible tracking biases in the out‐of‐plane orientation and of failing to reconstruct white matter pathways with complex geometries, respectively. However, these limitations are common to both genotypic groups that were compared, and are therefore unlikely to introduce spurious between‐group differences. The lack of a gold standard for regional parcellation is another limitation of the study. Lastly, we cannot conclude whether our results are general; in particular, the genotypic variation in white matter connectivity identified in this study might not be specific to youth with ADHD, but rather a general effect expressed in other populations. As dopamine is thought to be core to the neurobiology of ADHD, and the levels of this neurotransmitter have been linked to variation in axonal myelination, testing our hypotheses in an ADHD population is likely to have yielded the strongest effects. In addition, considering the high clinical heterogeneity of ADHD, whether this heterogeneity can be explained by genotypic polymorphisms and variability in white matter connectivity is in itself a valid and important research question. However, similar studies need to be conducted in different populations.
CONCLUSION
Our findings indicate that white matter connectivity in youth with ADHD is affected by COMT Val158Met polymorphism, in a way that the Met allele is associated with decreased connectivity of a brain‐wide white matter network. The present findings suggest that dopamine‐related genes and interindividual variability in the genetic polymorphisms should be taken into account when investigating the human connectome. In addition, our finding provides evidence for the utility of prefrontal white matter connectivity and response time variability as treatment biomarkers for ADHD.
Supporting information
Supplementary Information
Supplementary Information
Clinical trial registration: http://ClinicalTrials.gov http://www.clinicaltrials.gov/ NCT01912352.
Disclosure: The funding organizations had no influence on the design and conduct of the study; collection, management, analysis, and interpretation of the data; and preparation, review, or approval of the manuscript. S.B.H. had full access to all of the data in the study and takes responsibility for the integrity of the data and the accuracy of the data analysis. The authors have no conflicts to disclose.
REFERENCES
- Bassett DS, Brown JA, Deshpande V, Carlson JM, Grafton ST (2011): Conserved and variable architecture of human white matter connectivity. Neuroimage 54:1262–1279. [DOI] [PubMed] [Google Scholar]
- Behrens TE, Johansen‐Berg H, Woolrich MW, Smith SM, Wheeler‐Kingshott CA, Boulby PA, Barker GJ, Sillery EL, Sheehan K, Ciccarelli O, Thompson AJ, Brady JM, Matthews PM (2003): Non‐invasive mapping of connections between human thalamus and cortex using diffusion imaging. Nat Neurosci 6:750–757. [DOI] [PubMed] [Google Scholar]
- Bellgrove MA, Hawi Z, Kirley A, Fitzgerald M, Gill M, Robertson IH (2005): Association between dopamine transporter (DAT1) genotype, left‐sided inattention, and an enhanced response to methylphenidate in attention‐deficit hyperactivity disorder. Neuropsychopharmacology 30:2290–2297. [DOI] [PubMed] [Google Scholar]
- Bongarzone ER, Howard SG, Schonmann V, Campagnoni AT (1998): Identification of the dopamine D3 receptor in oligodendrocyte precursors: Potential role in regulating differentiation and myelin formation. J Neurosci 18:5344–5353. [DOI] [PMC free article] [PubMed] [Google Scholar]
- Chang FM, Kidd JR, Livak KJ, Pakstis AJ, Kidd KK (1996): The world‐wide distribution of allele frequencies at the human dopamine D4 receptor locus. Hum Genet 98:91–101. [DOI] [PubMed] [Google Scholar]
- Chen J, Song J, Yuan P, Tian Q, Ji Y, Ren‐Patterson R, Liu G, Sei Y, Weinberger DR (2011): Orientation and cellular distribution of membrane‐bound catechol‐O‐methyltransferase in cortical neurons: Implications for drug development. J Biol Chem 286:34752–34760. [DOI] [PMC free article] [PubMed] [Google Scholar]
- Cheon KA, Ryu YH, Kim JW, Cho DY (2005): The homozygosity for 10‐repeat allele at dopamine transporter gene and dopamine transporter density in Korean children with attention deficit hyperactivity disorder: Relating to treatment response to methylphenidate. Eur Neuropsychopharmacol 15:95–101. [DOI] [PubMed] [Google Scholar]
- Cheon KA, Kim BN, Cho SC (2007): Association of 4‐repeat allele of the dopamine D4 receptor gene exon III polymorphism and response to methylphenidate treatment in Korean ADHD children. Neuropsychopharmacology 32:1377–1383. [DOI] [PubMed] [Google Scholar]
- Cheon KA, Jun JY, Cho DY (2008): Association of the catechol‐O‐methyltransferase polymorphism with methylphenidate response in a classroom setting in children with attention‐deficit hyperactivity disorder. Int Clin Psychopharmacol 23:291–298. [DOI] [PubMed] [Google Scholar]
- Durston S (2010): Imaging genetics in ADHD. Neuroimage 53:832–838. [DOI] [PubMed] [Google Scholar]
- Epstein JN, Erkanli A, Conners CK, Klaric J, Costello JE, Angold A (2003): Relations between continuous performance test performance measures and ADHD behaviors. J Abnorm Child Psychol 31:543–554. [DOI] [PubMed] [Google Scholar]
- Froehlich TE, Epstein JN, Nick TG, Melguizo Castro MS, Stein MA, Brinkman WB, Graham AJ, Langberg JM, Kahn RS (2011): Pharmacogenetic predictors of methylphenidate dose‐response in attention‐deficit/hyperactivity disorder. J Am Acad Child Adolesc Psychiatry 50:1129–1139 e1122. [DOI] [PMC free article] [PubMed] [Google Scholar]
- Froehlich TE, McGough JJ, Stein MA (2010): Progress and promise of attention‐deficit hyperactivity disorder pharmacogenetics. CNS Drugs 24:99–117. [DOI] [PMC free article] [PubMed] [Google Scholar]
- Gizer IR, Ficks C, Waldman ID (2009): Candidate gene studies of ADHD: A meta‐analytic review. Hum Genet 126:51–90. [DOI] [PubMed] [Google Scholar]
- Greenberg LM, Waldman ID (1993): Developmental normative data on the test of variables of attention (T.O.V.A.). J Child Psychol Psychiatry 34:1019–1030. [DOI] [PubMed] [Google Scholar]
- Hamarman S, Fossella J, Ulger C, Brimacombe M, Dermody J (2004): Dopamine receptor 4 (DRD4) 7‐repeat allele predicts methylphenidate dose response in children with attention deficit hyperactivity disorder: A pharmacogenetic study. J Child Adolesc Psychopharmacol 14:564–574. [DOI] [PubMed] [Google Scholar]
- Hoekzema E, Carmona S, Ramos‐Quiroga JA, Canals C, Moreno A, Richarte Fernandez V, Picado M, Bosch R, Duno L, Soliva JC, Rovira M, Bulbena A, Tobena A, Casas M, Vilarroya O (2014): Stimulant drugs trigger transient volumetric changes in the human ventral striatum. Brain Struct Funct 219:23–34. [DOI] [PubMed] [Google Scholar]
- Hong J, Shu‐Leong H, Tao X, Lap‐Ping Y (1998): Distribution of catechol‐O‐methyltransferase expression in human central nervous system. Neuroreport 9:2861–2864. [DOI] [PubMed] [Google Scholar]
- Hong SB, Zalesky A, Fornito A, Park S, Yang YH, Park MH, Song IC, Sohn CH, Shin MS, Kim BN, Cho SC, Han DH, Cheong JH, Kim JW (2014): Connectomic disturbances in attention‐deficit/hyperactivity disorder: A whole‐brain tractography analysis. Biol Psychiatry (Doi: 10.1016/j.biopsych.2013.12.013). [DOI] [PubMed] [Google Scholar]
- Karoum F, Chrapusta SJ, Egan MF (1994): 3‐Methoxytyramine is the major metabolite of released dopamine in the rat frontal cortex: Reassessment of the effects of antipsychotics on the dynamics of dopamine release and metabolism in the frontal cortex, nucleus accumbens, and striatum by a simple two pool model. J Neurochem 63:972–979. [DOI] [PubMed] [Google Scholar]
- Kaufman J, Birmaher B, Brent D, Rao U, Flynn C, Moreci P, Williamson D, Ryan N (1997): Schedule for affective disorders and schizophrenia for school‐age children‐present and lifetime version (K‐SADS‐PL): Initial reliability and validity data. J Am Acad Child Adolesc Psychiatry 36:980–988. [DOI] [PubMed] [Google Scholar]
- Kebir O, Tabbane K, Sengupta S, Joober R (2009): Candidate genes and neuropsychological phenotypes in children with ADHD: Review of association studies. J Psychiatry Neurosci 34:88–101. [PMC free article] [PubMed] [Google Scholar]
- Kim YS, Cheon KA, Kim BN, Chang SA, Yoo HJ, Kim JW, Cho SC, Seo DH, Bae MO, So YK, Noh JS, Koh YJ, McBurnett K, Leventhal B (2004): The reliability and validity of kiddie‐schedule for affective disorders and schizophrenia‐present and lifetime version‐ Korean version (K‐SADS‐PL‐K). Yonsei Med J 45:81–89. [DOI] [PubMed] [Google Scholar]
- Kirley A, Lowe N, Hawi Z, Mullins C, Daly G, Waldman I, McCarron M, O'Donnell D, Fitzgerald M, Gill M (2003): Association of the 480 bp DAT1 allele with methylphenidate response in a sample of Irish children with ADHD. Am J Med Genet B Neuropsychiatry Genet 121B:50–54. [DOI] [PubMed] [Google Scholar]
- Kollins SH, Anastopoulos AD, Lachiewicz AM, FitzGerald D, Morrissey‐Kane E, Garrett ME, Keatts SL, Ashley‐Koch AE (2008): SNPs in dopamine D2 receptor gene (DRD2) and norepinephrine transporter gene (NET) are associated with continuous performance task (CPT) phenotypes in ADHD children and their families. Am J Med Genet B Neuropsychiatry Genet 147B:1580–1588. [DOI] [PMC free article] [PubMed] [Google Scholar]
- Kooij JS, Boonstra AM, Vermeulen SH, Heister AG, Burger H, Buitelaar JK, Franke B (2008): Response to methylphenidate in adults with ADHD is associated with a polymorphism in SLC6A3 (DAT1). Am J Med Genet B Neuropsychiatry Genet 147B:201–208. [DOI] [PubMed] [Google Scholar]
- Li J, Yu C, Li Y, Liu B, Liu Y, Shu N, Song M, Zhou Y, Zhu W, Li K, Jiang T (2009): COMT val158met modulates association between brain white matter architecture and IQ. Am J Med Genet B Neuropsychiatry Genet 150B:375–380. [DOI] [PubMed] [Google Scholar]
- Li L, Rilling JK, Preuss TM, Glasser MF, Hu X (2012): The effects of connection reconstruction method on the interregional connectivity of brain networks via diffusion tractography. Hum Brain Mapp 33:1894–1913. [DOI] [PMC free article] [PubMed] [Google Scholar]
- Mannisto PT, Kaakkola S (1999): Catechol‐O‐methyltransferase (COMT): Biochemistry, molecular biology, pharmacology, and clinical efficacy of the new selective COMT inhibitors. Pharmacol Rev 51:593–628. [PubMed] [Google Scholar]
- Matsumoto M, Weickert CS, Akil M, Lipska BK, Hyde TM, Herman MM, Kleinman JE, Weinberger DR (2003): Catechol O‐methyltransferase mRNA expression in human and rat brain: Evidence for a role in cortical neuronal function. Neuroscience 116:127–137. [DOI] [PubMed] [Google Scholar]
- McGough J, McCracken J, Swanson J, Riddle M, Kollins S, Greenhill L, Abikoff H, Davies M, Chuang S, Wigal T, Wigal S, Posner K, Skrobala A, Kastelic E, Ghuman J, Cunningham C, Shigawa S, Moyzis R, Vitiello B (2006): Pharmacogenetics of methylphenidate response in preschoolers with ADHD. J Am Acad Child Adolesc Psychiatry 45:1314–1322. [DOI] [PubMed] [Google Scholar]
- Mick E, Biederman J, Spencer T, Faraone SV, Sklar P (2006): Absence of association with DAT1 polymorphism and response to methylphenidate in a sample of adults with ADHD. Am J Med Genet B Neuropsychiatr Genet 141B:890–894. [DOI] [PMC free article] [PubMed] [Google Scholar]
- Nichols TE, Holmes AP (2002): Nonparametric permutation tests for functional neuroimaging: A primer with examples. Hum Brain Mapp 15:1–25. [DOI] [PMC free article] [PubMed] [Google Scholar]
- Polanczyk G, de Lima MS, Horta BL, Biederman J, Rohde LA (2007): The worldwide prevalence of ADHD: A systematic review and metaregression analysis. Am J Psychiatry 164:942–948. [DOI] [PubMed] [Google Scholar]
- Roman T, Szobot C, Martins D, Biederman J, Rohde LA, Hutz MH (2002): Dopamine transporter gene and response to methylphenidate in attention‐deficit/hyperactivity disorder. Pharmacogenetics 12:497–499. [DOI] [PubMed] [Google Scholar]
- Santosh PJ, Taylor E (2000): Stimulant drugs. Eur Child Adolesc Psychiatry 9 Suppl 1:I27–I43. [DOI] [PubMed] [Google Scholar]
- Shin MS, Cho S, Chun SY, Hong KE (2000): A study of the development and standardization of ADHD diagnostic system. Korean J Child Adolesc Psychiatry 11:91–99. [Google Scholar]
- Sporns O (2012): Discovering the Human Connectome. Cambridge, MA: MIT Press. [Google Scholar]
- Stein MA, Waldman ID, Sarampote CS, Seymour KE, Robb AS, Conlon C, Kim SJ, Cook EH (2005): Dopamine transporter genotype and methylphenidate dose response in children with ADHD. Neuropsychopharmacology 30:1374–1382. [DOI] [PubMed] [Google Scholar]
- Suskauer SJ, Simmonds DJ, Caffo BS, Denckla MB, Pekar JJ, Mostofsky SH (2008): fMRI of intrasubject variability in ADHD: Anomalous premotor activity with prefrontal compensation. J Am Acad Child Adolesc Psychiatry 47:1141–1150. [DOI] [PMC free article] [PubMed] [Google Scholar]
- Swanson JM, Flodman P, Kennedy J, Spence MA, Moyzis R, Schuck S, Murias M, Moriarity J, Barr C, Smith M, Posner M (2000): Dopamine genes and ADHD. Neurosci Biobehav Rev 24:21–25. [DOI] [PubMed] [Google Scholar]
- Thapar A, Cooper M, Eyre O, Langley K (2013): What have we learnt about the causes of ADHD? J Child Psychol Psychiatry 54:3–16. [DOI] [PMC free article] [PubMed] [Google Scholar]
- Thomason ME, Dougherty RF, Colich NL, Perry LM, Rykhlevskaia EI, Louro HM, Hallmayer JF, Waugh CE, Bammer R, Glover GH, Gotlib IH (2010): COMT genotype affects prefrontal white matter pathways in children and adolescents. Neuroimage 53:926–934. [DOI] [PMC free article] [PubMed] [Google Scholar]
- Tunbridge EM, Bannerman DM, Sharp T, Harrison PJ (2004): Catechol‐o‐methyltransferase inhibition improves set‐shifting performance and elevates stimulated dopamine release in the rat prefrontal cortex. J Neurosci 24:5331–5335. [DOI] [PMC free article] [PubMed] [Google Scholar]
- Tzourio‐Mazoyer N, Landeau B, Papathanassiou D, Crivello F, Etard O, Delcroix N, Mazoyer B, Joliot M (2002): Automated anatomical labeling of activations in SPM using a macroscopic anatomical parcellation of the MNI MRI single‐subject brain. Neuroimage 15:273–289. [DOI] [PubMed] [Google Scholar]
- van Ewijk H, Heslenfeld DJ, Zwiers MP, Buitelaar JK, Oosterlaan J (2012): Diffusion tensor imaging in attention deficit/hyperactivity disorder: A systematic review and meta‐analysis. Neurosci Biobehav Rev 36:1093–1106. [DOI] [PubMed] [Google Scholar]
- Volkow ND, Fowler JS, Wang G, Ding Y, Gatley SJ (2002): Mechanism of action of methylphenidate: Insights from PET imaging studies. J Atten Disord 6 Suppl 1:S31–S43. [DOI] [PubMed] [Google Scholar]
- Wedeen VJ, Wang RP, Schmahmann JD, Benner T, Tseng WY, Dai G, Pandya DN, Hagmann P, D'Arceuil H, de Crespigny AJ (2008): Diffusion spectrum magnetic resonance imaging (DSI) tractography of crossing fibers. Neuroimage 41:1267–1277. [DOI] [PubMed] [Google Scholar]
- Wilens TE (2008): Effects of methylphenidate on the catecholaminergic system in attention‐deficit/hyperactivity disorder. J Clin Psychopharmacol 28:S46–53. [DOI] [PubMed] [Google Scholar]
- Winsberg BG, Comings DE (1999): Association of the dopamine transporter gene (DAT1) with poor methylphenidate response. J Am Acad Child Adolesc Psychiatry 38:1474–1477. [DOI] [PubMed] [Google Scholar]
- Xia M, Wang J, He Y (2013): BrainNet viewer: A network visualization tool for human brain connectomics. PLoS One 8:e68910. [DOI] [PMC free article] [PubMed] [Google Scholar]
- Young KA, Holcomb LA, Yazdani U, Hicks PB, German DC (2004): Elevated neuron number in the limbic thalamus in major depression. Am J Psychiatry 161:1270–1277. [DOI] [PubMed] [Google Scholar]
- Zalesky A, Fornito A, Bullmore ET (2010): Network‐based statistic: Identifying differences in brain networks. Neuroimage 53:1197–1207. [DOI] [PubMed] [Google Scholar]
- Zalesky A, Fornito A, Seal ML, Cocchi L, Westin CF, Bullmore ET, Egan GF, Pantelis C (2011): Disrupted axonal fiber connectivity in schizophrenia. Biol Psychiatry 69:80–89. [DOI] [PMC free article] [PubMed] [Google Scholar]
- Zalesky A, Cocchi L, Fornito A, Murray MM, Bullmore E (2012): Connectivity differences in brain networks. Neuroimage 60:1055–1062. [DOI] [PubMed] [Google Scholar]
- Zeni CP, Guimaraes AP, Polanczyk GV, Genro JP, Roman T, Hutz MH, Rohde LA (2007): No significant association between response to methylphenidate and genes of the dopaminergic and serotonergic systems in a sample of Brazilian children with attention‐deficit/hyperactivity disorder. Am J Med Genet B Neuropsychiatr Genet 144B:391–394. [DOI] [PubMed] [Google Scholar]
- Zhang X, Lee MR, Salmeron BJ, Stein DJ, Hong LE, Geng X, Ross TJ, Li N, Hodgkinson C, Shen PH, Yang Y, Goldman D, Stein EA (2013): Prefrontal white matter impairment in substance users depends upon the catechol‐o‐methyl transferase (COMT) val158met polymorphism. Neuroimage 69:62–69. [DOI] [PMC free article] [PubMed] [Google Scholar]
Associated Data
This section collects any data citations, data availability statements, or supplementary materials included in this article.
Supplementary Materials
Supplementary Information
Supplementary Information