

Abstract
During prism adaptation two types of learning processes can be distinguished. First, fast strategic motor control responses are predominant in the early course of prism adaptation to achieve rapid error correction within few trials. Second, slower spatial realignment occurs among the misaligned visual and proprioceptive sensorimotor coordinate system. The aim of the present ultra‐highfield (7T) functional magnetic resonance imaging (fMRI) study was to explore cerebellar cortical and dentate nucleus activation during the course of prism adaptation in relation to a similar visuomotor task without prism exposure. Nineteen young healthy participants were included into the study. Recently developed normalization procedures were applied for the cerebellar cortex and the dentate nucleus. By means of subtraction analysis (early prism adaptation > visuomotor, early prism adaptation > late prism adaptation) we identified ipsilateral activation associated with strategic motor control responses within the posterior cerebellar cortex (lobules VIII and IX) and the ventro‐caudal dentate nucleus. During the late phase of adaptation we observed pronounced activation of posterior parts of lobule VI, although subtraction analyses (late prism adaptation > visuomotor) remained negative. These results are in good accordance with the concept of a representation of non‐motor functions, here strategic control, within the ventro‐caudal dentate nucleus. Hum Brain Mapp 35:1574–1586, 2014. © 2013 Wiley‐Liss, Inc.
Keywords: visuomotor, realignment, strategic motor control, cerebellum, cerebellar nuclei
INTRODUCTION
Optical displacing prisms can be used to misalign the visual and proprioceptive sensorimotor coordinate system. Therefore, pointing to a visual target during prism exposure leads to initial misreaching in the direction of displacement. During prism adaptation two types of learning processes can be distinguished [Redding and Wallace, 2002]. First, fast strategic motor control responses are predominant in the early course of prism adaptation to achieve rapid error correction within few trials, the so called direct effects of prism adaptation. The awareness of initial misreaching leads to strategy based motor learning by conscious alteration of movements [Taylor and Ivry, 2012]. Second, slower spatial realignment occurs among the misaligned visual and proprioceptive sensorimotor coordinate system. After effects of prism adaptation (that is misreaching in the opposite direction of the prism displacement after removal of the prism) become fully apparent only after complete spatial realignment. Strategic motor control responses and spatial realignment overlap during the course of prism adaptation. Yet, it is important to note that error correction is completed after few (about 5–15) pointing trials dependent on the experimental setup [Chapman et al., 2010; Danckert et al., 2008; Luauté et al., 2009; Redding et al., 2005], while complete spatial realignment requires a prolonged prism exposure.
Cerebellar contribution to visuomotor adaptation using optical prisms has been established in studies based on (1) cerebellar lesions in animals and (2) humans, as well as (3) human functional magnetic resonance imaging (fMRI) studies. Results are not consistent with regard to the anatomical subregions of the cerebellum, which are thought to promote visuomotor adaptation. Results of Martin et al. 1996 point to impaired prism adaptation in cerebellar patients with lesions in the territory of the posterior inferior cerebellar artery while lesions in the territory of the superior cerebellar artery had no impact on adaptation. Similar findings were obtained in a lesional study in monkeys [Baizer et al., 1999]. In contrast, Pisella et al. 2005 reported on a patient with superior cerebellar artery stroke whose ability to adapt to optical prisms was abolished on the ipsilesional side. Likewise, fMRI studies in humans revealed heterogeneous results [Chapman et al., 2010; Danckert et al., 2008; Luauté et al., 2009].
So far, experiments studying cerebellar influence on prism adaptation focused exclusively on the cerebellar cortex. However, the cerebellar nuclei, relaying input from the cerebellar cortex to the cerebral cortex, likely play an important role in prism adaptation. In particular the dentate nucleus has connections to the posterior parietal cortex, a neocortical region suggested to play a pivotal role in successful prism adaptation [Clower et al., 1996; Danckert et al., 2008; Luauté et al., 2009; Newport and Jackson, 2006]. Therefore the aim of the present study was to explore dentate nucleus activation patterns during the early and late phase of prism adaptation.
METHODS
Participants
A total of 23 healthy participants (mean age of 26.5 ± 4.0 years, female/male: 8/15) were included. Exclusion criteria were known neurological or psychiatric disorders, compromised vision or motor deficits that would impair the behavioral demands of prism adaptation, and age under 18 years. Informed consent was obtained from all the participants. The study was approved by the local ethics committee. All participants were right‐handed as assessed by the Edinburgh handedness scale [Oldfield, 1971]. Four participants were excluded because of movement artifacts (head translation > 2 mm). Data of 19 participants (mean age 26.6 ± 3.8 years, female/male: 7/12) were included in group statistical analysis.
Prism Adaptation
For prism adaptation participants lay supine in the scanner bore. An optic prism with a 20 degree rightward shift was used for the right eye. The left eye was occluded from sight. The prism was mounted on the head coil together with a mirror system that enabled participants to look to their feet in supine position without bending their head or eye movement (Fig. 1). The prism could be pneumatically removed from the scanner control room from its position to perform pointing trials without prism exposure. Two visual targets were used in a random alternating manner for pointing trials. The targets consisted of a fiber optic cable that was illuminated in red from the scanner control room. The targets were mounted in a fiber glass frame 3 cm left and right from the central position. The frame was attached to the scanner table. Targets were placed individually within comfortable pointing distance above the participants' thigh. Pointing movements started from a resting position at the participants' umbiculus and were performed with the right index finger toward the visual target. To monitor the behavioral performance an optic fiber cable illuminated in red was attached to the participants' index finger. A camera system recorded the pointing trials toward the visual targets from behind the scanner table (Fig. 1).
Figure 1.

Experimental setup for optical recording of pointing movements. Participants lay supine in the scanner. The targets consisted of a fiber optic cable that was illuminated in red toward the participant and toward the camera that was positioned in front of the scanner table. The targets were mounted in a fiber glass frame. The frame was attached to the scanner table. To monitor the behavioral performance an optic fiber cable illuminated in red was attached to the participants' index finger. The piece of cardboard used to block the vision of the movement path to minimize online corrections is shown in the lower part of the figure only. [Color figure can be viewed in the online issue, which is available at http://wileyonlinelibrary.com.]
Participants' sight was blocked by a patch of cardboard installed behind the mirror system in a way that only the visual targets would be visible and not the movement path of the right hand. Participants saw their pointing finger only at the terminal stage of movement. This was done to minimize online corrective movements. Minor online corrections at the end of the movement, however, cannot be excluded.
Before fMRI scanning started participants were familiarized with the experimental setup and conducted practice pointing movements within the scanner bore without prismatic displacement.
Experimental Conditions
A block design was used with 30 alternating rest and active blocks lasting 30 s each. All blocks were performed within one 15:15 min fMRI session (total of 305 scans). During an active block 10 pointing trials were performed. Movement frequency was controlled by illumination of the visual target (duration 1 s), which was the signal for participants to start a pointing movement. The fMRI run started with three blocks (Fig. 2) of pointing trials without prism exposure (baseline visuomotor). Thereafter two blocks with prism exposure were performed (early prism and late prism adaptation) followed by two blocks of pointing without prism exposure (deadaptation). Adaption and deadaptation blocks were repeated three times to maximize statistical power in fMRI data analysis. The reason why we used 10 pointing trials per block was based on observations in a pilot study in four participants. In this pilot study pointing error reduction to zero during the early phase of prism adaptation was well observed within 10 pointing trials, which is paralleled by behavioral results reported in fMRI studies using a similar experimental setup [Danckert et al., 2008; Luauté et al., 2009]. That means we expected that strategic control responses would occur in the early adaptation block and not in the late adaptation block, in which spatial realignment is expected to be predominant for adaptation.
Figure 2.

FMRI block design: active and passive blocks lasted 30 s each. During each active blocks 10 pointing trials were performed. The fMRI run started with three blocks of pointing trials without prism exposure (baseline visuomotor). Thereafter two blocks with prism exposure were performed (early prism and late prism) followed by two blocks of pointing without prism exposure for deadaptation. Adaption and deadaptation blocks were repeated three times.
The shift of the participants subjective proprioceptive straight ahead of their own body's midline was assessed, as a measure of realignment magnitude [Chapman et al., 2010; Redding et al., 2005]. This was done after fMRI scanning with the participants still lying in the scanner. To do so the deadaptated participants were asked to point straight ahead with their right index finger with eyes closed. Following another adaptation to the optical prism within 20 pointing trials participants were again asked to point straight ahead with eyes closed. Movement endpoints for the straight ahead pointing trials were recorded as described above. The shift of subjective proprioceptive straight ahead was calculated as the lateral deviation in cm of movement endpoints before and after reintroduction of the prism.
Behavioral Data Analysis
Pointing trials were videotaped and analyzed offline using Labview Software. Lateral displacement of movement endpoints relative to the respective visual target was measured in cm for each pointing trial. Lateral displacements of endpoints were averaged for the respective conditions (baseline visuomotor, early prism, late prism, deadaptation), each of which were performed three times during the fMRI session. Significant lateral displacement during adaptation or deadaptation was defined as a displacement that was greater than the mean displacement observed during baseline visuomotor trials (±1 standard deviation).
FMRI Acquisition
A whole‐body 7T MR scanner (Magnetom 7T, Siemens Healthcare, Erlangen, Germany) was used to acquire blood‐oxygenation‐level‐dependent (BOLD)‐contrast‐weighted echoplanar images (EPIs) for functional scans. Head movements were reduced with the help of wedge‐shaped bolsters. All fMRI images were acquired with an eight‐channel transmit/receive head coil (Rapid Biomed, Wuerzburg, Germany). Each EPI session consisted of 305 scans with 45 coronal slices: TR = 3,000 ms, TE = 22 ms, FOV = 256 × 256 mm2, matrix 128 × 128, parallel MRI (pMRI) GRAPPA R = 2, TA 15:15 min, bandwidth 1,562 Hz/pixel. The excitation pulse angle alpha was 78°. Slice thickness was 1.9 mm, resulting in a voxel size of 2.0 × 2.0 × 1.9 mm3 with 10% distance factor acquired in ascending order. The read‐out gradients used were sinusoidal. Because of magnetization relaxation effects, the first four volumes in each session were discarded from further analysis. The scans covered the entire cerebellum. To avoid ghost artefacts, coronal slices were measured with the phase‐encoding direction F >> H [see Thürling et al., 2011 for more detailed explanation] and phase correction. In addition, a three‐dimensional (3D) transverse volume of the entire brain was acquired using a T1‐weighted magnetization prepared rapid acquisition gradient echo sequence (MPRAGE; 176 sagittal slices, TR = 3,500 ms, TE = 3.71 ms, TI = 1,100 ms, bandwidth 200 Hz/pixel, FOV = 256 × 176 mm2, pMRI GRAPPA R = 2, TA 6:30 min, flip angle 8°, voxel size of 1 × 1 × 1 mm3).
FMRI Analysis
Image analysis was performed using SPM8 (Wellcome Department of Cognitive Neurology, London, UK). The EPI images were realigned to correct for head motion, resulting in creation of a mean EPI image. The first image was selected as a reference and all images from all paradigms were realigned to this. The origin was set at the apex of the fourth ventricle. The mean image was then used as a reference image to coregister the realigned functional images to the anatomical T1 image of the individual participant. For the statistical first‐level analyses, a general linear model was applied [Friston et al., 1995] to the realigned and coregistered, but otherwise unsmoothed, EPI images. Before the statistical analyses started, the parameter “defaults.mask.thresh” in SPM was changed from 0.8 to 0.5 to avoid signal drop‐outs within the hypointense cerebellar nuclei. The time series of each voxel was fitted with a corresponding task regressor that modelled a box car convolved with a canonical hemodynamic response function. A temporal high‐pass filter (cut off 128 s) was used to correct for the low frequency drifts in the data, and serial autocorrelations were taken into account by means of an autoregressive model first‐order correction (AR(1)).
For each of the experimental tasks (baseline visuomotor, early prism, late prism, deadaptation) a significant change of the BOLD effect compared to the rest condition was tested. Furthermore, the following contrasts were computed by subtraction analyses:
Early prism > baseline visuomotor: this contrast was chosen to show activation that is specific to the early adaptation phase by controlling for general visuomotor demands.
Late prism > baseline visuomotor: this contrast was chosen to show activation that is specific to the late adaptation phase by controlling for general visuomotor demands.
Early prism > late prism: this contrast was chosen to control for activation that is associated with spatial realignment within the early adaptation phase so that remaining activation would reflect strategic motor control responses.
For the contrast specified by subtraction analyses the reverse computations were also considered.
Cerebellar Cortex
For the normalization of the cerebellar cortical data, the T1‐weighted images were deformed to fit the spatially unbiased atlas template (SUIT) of the human cerebellum using the SUIT toolbox in SPM8 [Diedrichsen, 2006 ]. At first the program isolates the cerebellum and creates a mask. These masks were manually corrected with the help of CARET software (http://brainvis.wustl.edu/wiki/index.php/Caret:About). The non‐linear deformation was then applied to each contrast image from the individual participants. The normalized images were resampled at 1 × 1 × 1 mm3 resolution and then smoothed by a three‐dimensional convolution with an isotropic Gaussian Kernel of 4 mm Full Width at Half Maximum (FWHM). After normalization, one‐sample t‐tests of contrasts were calculated in second‐level analysis. The probabilistic atlas of the cerebellar cortex introduced by Diedrichsen et al. 2009 was used to define anatomical location of cerebellar lobules. The cerebellar cortical activations are shown at a threshold of P < 0.01, false discovery rate (FDR) corrected. This equates to paradigm dependent thresholds of t = 4.34/4.24/4.38/4.40 (baseline visuomotor/early prism/late prism/deadaptation). For contrasts defined by subtraction analysis the respective threshold of the minuend paradigm was used (e.g. t = 4.24 for early prism > baseline visuomotor). Using the SUIT‐normalization for the cerebellar cortex we were also able to identify activations corresponding to the probabilistic location of the dentate nuclei [Diedrichsen et al., 2011]. Yet, in order to increase the sensitivity of BOLD‐signal detection within the cerebellar nuclei we applied a different normalization approach for the dentate nucleus as described below.
Dentate Nuclei
The dentate nuclei were identified as hypointensities on the EPI mean image and marked as regions of interest (ROIs) using MRIcroN‐software (available at: http://www.sph.sc.edu/comd/rorden/mricron/). For normalization, a recently developed modified version of the SUIT method described above was used. This normalization algorithm tries to deform the T1 image so that it fits to the SUIT template, while optimizing the overlap between the ROI and a dentate template [Diedrichsen et al., 2011]. To avoid activation surrounding the dentate nucleus being smoothed into the ROI, the functional images were masked with the dentate ROI before normalization. The normalized functional data from the dentate nuclei were resampled at 1 × 1 × 1 mm3 resolution and then smoothed with a three‐dimensional convolution with an isotropic Gaussian Kernel of 4 mm FWHM.
Small volume correction (SVC) was performed using the dentate template as ROI. The option explicit masking was used in SPM. The random field theory was considered not suitable for this dataset, because the search volume was very small. Bootstrap analysis was therefore used to correct the significance level for multiple tests [Hayasaka and Nichols, 2003]. Sets of 19 random samples were drawn from all contrast images (with replacement) and multiplied with 1 or −1 to randomize the sign. For each of these fake data sets, a t‐map was calculated and the corrected t‐value at the uncorrected threshold (t (19) = 2.88, P = 0.005) was determined, searching both in the left and right dentate. Repeating this process 1,000 times, the t‐value threshold that would only occur in 5% of the random data sets was determined. The corrected peak t‐value was 3.68.
To describe the localization of dentate activations, the dentate template was divided into four sections. The dentate was subdivided into a dorso‐rostral (DRDN), dorso‐caudal (DCDN), ventro‐rostral (VRDN), and ventro‐caudal (VCDN) section as described previously [Küper et al., 2011).
RESULTS
Behavioral Data
Pointing accuracy is shown in Figure 3. During baseline trials there was a lateral deviation of 0.02 ± 0.83 cm (mean ± standard deviation) to the right of the respective optical target. During prism exposure in the phase of early adaptation there was a significant pointing error (2.35 ± 3.16 cm, mean ± standard deviation for the first trial) to the right (that is in the direction of displacement). Significant lateral deviation was visible for the first two trials followed by a successive reduction of pointing error to almost zero within six trials. Although we refer to data averaged over three blocks, it is important to note that direct effects were evident in each early adaptation block. However direct effects were strongest during the first block followed by the second and third block which can be explained by “savings” after repeated prism exposure [Huang et al., 2011]. No significant pointing errors occurred during the late adaptation phase. For the first pointing trial after removal of the prism there was a clear pointing error (0.56 ± 1.2 cm, mean ± standard deviation for the first trial) to the left (that is against the direction of displacement), suggestive of after effects, which was reduced to zero within five trials. Yet, it is important to note that the pointing errors to the left observed in the deadaptation phase did not reach significance.
Figure 3.
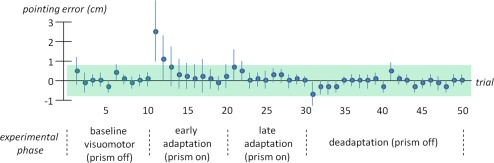
Accuracy of pointing trials for participants included in imaging analysis (n = 19): Mean lateral displacement to the right (positive numbers) and left (negative numbers) is represented on the y‐axis. Error bars denote one standard deviation. Successive pointing trials are plotted on the x‐axis. Note that pointing trials were averaged over three fMRI blocks for each experimental phase. The range of mean lateral displacement ± one standard deviation for baseline visuomotor trials is shown in green. Significant lateral displacement is considered for pointing trials out of this range. [Color figure can be viewed in the online issue, which is available at http://wileyonlinelibrary.com.]
The analyses of the subjective shift of participants' proprioceptive straight ahead revealed a shift to the left of 0.4 ± 1.77 cm (mean ± standard deviation).
These results demonstrate rapid error correction as expected direct effects in the early phase of prism adaptation, which are primarily generated by strategic motor control responses. Spatial realignment processes were obviously not completed since there were only modest after effects detectable in pointing trials following prism removal and proprioceptive shift of subjective straight ahead. Therefore the interpretation of the deadaptation fMRI data is limited. The study analysis is therefore focused on the early and late adaptation phase in relation to baseline visuomotor trials.
Cerebellar Cortical Activation
Considering the baseline visuomotor condition, cerebellar cortical activation (upper row in Fig. 4, Table 1) was detected ipsilaterally in the known upper limb motor representation within the anterior (lobules III–VI) and posterior (lobule VII–IX) cerebellum [Grodd et al., 2001; Rijntjes et al., 1999; Stoodley and Schmahmann, 2009]. Activation comprised the vermis as well as the intermediate and lateral cerebellar cortex. On the contralateral side (left) activation also extended into lobule V of the anterior cerebellum. Activation was evident at a location that involves the rostral part of the dentate nucleus with the neighboring interposed nuclei (Fig. 4 at y = −55) according to the probabilistic atlas of the cerebellar nuclei [Diedrichsen et al., 2011].
Figure 4.

Cerebellar cortical activations following pointing movements finger performed with the right side without prism (baseline visuomotor, red), during early prism adaptation (early prism, blue) and late prism adaptation (late prism, green) plotted on the SUIT template in coronal slices [Diedrichsen, 2006], thresholded at P < 0.01 FDR corrected. Colour code denotes t‐values. Lower row shows overlap of all three conditions (threshold and peak at P < 0.01 FDR corrected). Areas of common activation across the conditions appear in gray. White numbers indicate y‐coordinates. Roman numbers indicate cerebellar lobules. Right side of the image is right side of the brain. [Color figure can be viewed in the online issue, which is available at http://wileyonlinelibrary.com.]
Table 1.
Local activation maxima within the cerebellar cortex (P < 0.01 FDR corrected, minimum volume 10 voxels)
| Contrast | x, y, z | Location | Cluster size | t‐Value |
|---|---|---|---|---|
| Baseline visuomotor | 4, 59, −26 | Vermis: III, IV, V, VI, VII, VIII, IX. Ipsi: V, VI, VIII, IX, rDN. Contra: V, rDN | 12,409 mm3 | 10.52 |
| 31, −41, −46 | Ipsi: VIII | 30 mm3 | 5.53 | |
| 19, −47, −49 | Ipsi: VIII | 13 mm3 | 5.06 | |
| 25, −49, −47 | Ipsi: VIII | 14 mm3 | 4.67 | |
| −18, −44, −15 | Ipsi: V | 12 mm3 | 4.48 | |
| Early prism | 2, −60, −18 | Vermis: IV, V, VI, VII, VIII, IX. ipsi: V, VI, VIII, IX, aWM, cDN. Contra: V, aWM, and cDN | 15,263 mm3 | 11.63 |
| 3, −79, −22 | Vermis: VI | 33 mm3 | 6.64 | |
| 25, −73, −19 | Ipsi: VI | 78 mm3 | 6.53 | |
| 20, −47, −51 | Ipsi: VIII | 78 mm3 | 5.45 | |
| −9, −45, −28 | Contra: rDN | 12 mm3 | 5.42 | |
| 12, −60, −51 | Ipsi: VIII | 11 mm3 | 5.19 | |
| −11, −79, −18 | Contra: VI | 34 mm3 | 5.09 | |
| −10, −37, −25 | Contra: III | 15 mm3 | 4.93 | |
| −2, −69, −47 | Vermis: VIII | 12 mm3 | 4.40 | |
| Late prism | 3, −60, −19 | Vermis: IV, V, VI, VII, VIII, IX. ipsi: V, VI, VIII, IX. Contra: V | 11,331 mm3 | 10.31 |
| −5, −48, −25 | Contra: rDN | 37 mm3 | 6.30 | |
| −10, −54, −34 | Contra: rDN | 12 mm3 | 4.73 | |
| Deadaptation | 2, −61, −18 | Vermis: IV, V, VI, VII, VIII, IX. Ipsi: V, VI, VIII, IX, cDN. Contra: V, rDN | 11,144 mm3 | 10.17 |
| 3, −78, −22 | Vermis: VI | 83 mm3 | 6.79 | |
| 25, −35, −43 | Ipsi: X | 37 mm3 | 5.29 | |
| 30, −35, −31 | Ipsi: V | 53 mm3 | 5.11 | |
| Early prism > baseline visuomotor | 31, −56, −52 | Ipsi: VIII | 23 mm3 | 5.67 |
| 31, −49, −51 | Ipsi: VIII | 30 mm3 | 5.67 | |
| 13, −67, −31 | cDN | 100 mm3 | 8.46 | |
| Early prism > late prism | 31, −57, −52 | Ipsi: VIII | 14 mm3 | 5.21 |
| 6, −62, −42 | Vermis: VIII | 13 mm3 | 5.07 | |
| 13, −67, −32 | cDN | 31 mm3 | 6.75 |
Peak location is underlined when several lobules are involved. Roman numbers denote cerebellar lobules according to the probabilistic atlas of the cerebellum (Diedrichsen et al., 2009].
Ipsi = ipsilateral (right), contra = contralateral (left), rDN = rostral dentate nucleus, cDN = caudal dentate nucleus.
For the early prism adaptation there was comparable activation present within the anterior cerebellum. Within the posterior cerebellum activation tended to be more extensive in lobule VIII (Fig. 4 at y = −55, −60) and lobule IX (Fig. 4 at y = −55, −60).
Furthermore an additional small cluster (second row in Fig. 4 at y = −70, Table 1) situated in the posterior aspect of lobule VI was present. More caudal (posterior) parts of the dentate nucleus were activated (Fig. 4 at y = −65).
For the late adaptation phase the activation pattern was very similar to that found during baseline trials. Yet, more posterior parts of lobule VI were activated (third row in Fig. 4 at y = −65) and there was lesser activation within the dentate nucleus location. Comparable results were obtained for the deadaptation phase with an additional small cluster located in right lobule X (Table 1).
When controlling for visuomotor demands during early prism adaptation by subtraction analysis (early prism > baseline visuomotor) two clusters within lobule VIII (Fig. 5, Table 1) remain present together with a cluster located within the caudal dentate nucleus. Also, when controlling for visuomotor demands and potential effects of spatial realignment (early prism > late prism) there was one suprathreshold cluster detected in lobule VIII (Fig. 5) and one caudal dentate nucleus cluster. Further contrasts considered for subtraction analyses did not reveal any suprathreshold cluster.
Figure 5.

Cerebellar cortical activations following subtraction analyses plotted on the SUIT template in axial slices at z = −52 [Diedrichsen, 2006], thresholded at P < 0.01 FDR corrected. Colour code denotes t‐values. Roman numbers indicate cerebellar lobules. Right side of the image is right side of the brain. [Color figure can be viewed in the online issue, which is available at http://wileyonlinelibrary.com.]
Dentate Nucleus Activation
Following baseline visuomotor trials there was prominent activation bilaterally within the dorso‐rostral part of the dentate nucleus (upper row in Fig. 6, Table 2). On the ipsilateral (right) side there was an additional smaller cluster present within the ventro‐caudal domain. The observed pattern of activation is consistent with the upper limb dentate nucleus motor representation reported in a previous study of our group [Küper et al., 2012].
Figure 6.

Significant dentate nucleus activation following pointing movements finger performed with the right side without prism (baseline visuomotor, red), during early prism adaptation (early prism, blue) and late prism adaptation (late prism, green) plotted on probabilistic dentate nucleus template [Diedrichsen et al., 2011], shown in axial slices (white numbers indicate z‐coordinate). Overlay row shows overlap of all three conditions (threshold and peak t‐value = 3.68). Lower rows show remaining activation (violet) after subtraction analyses for early prism > baseline visuomotor (EP > BV) and early prism > late prism (EP > LP). Colour code denotes t‐values (threshold 3.68, peak 5). Right side of the image is right side of the brain. r = rostral, c = caudal. [Color figure can be viewed in the online issue, which is available at http://wileyonlinelibrary.com.]
Table 2.
Local maxima of dentate nucleus activation
| Contrast | Side | x, y, z | Domain | Cluster size | t‐Value |
|---|---|---|---|---|---|
| Baseline visuomotor | Contralateral (left) | −9, −55, −33 | Dorso‐rostral | 197 mm3 | 6.93 |
| Ipsilateral (right) | 8, −58, −29 | Dorso‐rostral | 201 mm3 | 6.47 | |
| Ipsilateral (right) | 16, −66, −38 | Ventro‐caudal | 33 mm3 | 4.64 | |
| Early prism | Ipsilateral (right) | 17, −67, −37 | Ventro‐caudal | 110 mm3 | 8.07 |
| Contralateral (left) | 9, −54, −33 | Dorso‐rostral | 38 mm3 | 4.75 | |
| Ipsilateral (right) | 11, −56, −31 | Dorso‐rostral | 126 mm3 | 4.52 | |
| Late prism | Contralateral (left) | −10, −54, −35 | Dorso‐rostral | 65 mm3 | 5.34 |
| Ipsilateral (right) | 8, −56, −29 | Dorso‐rostral | 96 mm3 | 5.12 | |
| Ipsilateral (right) | 18, −65, −39 | Ventro‐caudal | 16 mm3 | 4.49 | |
| Deadaptation | Ipsilateral (right) | 15, −65, −39 | Ventro‐caudal | 42 mm3 | 5.24 |
| Ipsilateral (right) | 8, −58, −29 | Dorso‐rostral | 60 mm3 | 4.52 | |
| Contralateral (left) | −10, −55, −35 | Dorso‐rostral | 16 mm3 | 4.61 | |
| Early prism > baseline visuomotor | Ipsilateral (right) | 18, −66, −36 | Ventro‐caudal | 12 mm3 | 5.55 |
| Early prism > late prism | Ipsilateral (right) | 18, −66, −36 | Ventro‐caudal | 16 mm3 | 5.21 |
During the early phase of prism adaptation the largest and most significant cluster of dentate activation was found in the ventro‐caudal part, whereas bilateral dorso‐rostral activation was weaker compared to baseline trials (second row in Fig. 6, Table 2).
In the late phase of prism adaptation the largest cluster of activation was again detected in the dorso‐rostral part bilaterally with a smaller ventro‐caudal cluster similar to the baseline visuomotor trials (third row in Fig. 6, Table 2). Comparable results were obtained for the deadaptation phase (Table 2).
Subtraction analyses focusing on the effects of strategic motor response during the early phase of prism adaptation (early prism > baseline visuomotor and early prism > late prism) revealed one suprathreshold cluster within the ventro‐caudal nucleus close to the caudal pole (fifth and sixth row in Fig. 6, Table 2). Further contrasts considered for subtraction analyses did not reveal any suprathreshold cluster.
Median Split Analysis
Imaging analysis of the late prism contrast revealed only minor differences in comparison to visuomotor baseline. In order to further explore the process of realignment during late prism adaptation we performed a median split analysis based on the magnitude of after effects. Participants exhibiting higher after effects are thought to have achieved better realignment to the visual perturbation. This allows to distinguish between “good adapters” and “bad adapters.” The median value for the after effect magnitude was 0.54 cm lateral deviation to the left. For the group of good adapters (n = 9) lateral deviation was 1.21 ± 0.48 cm to the left (mean ± standard deviation) and for the bad adapters (n = 9) 0.17 ± 0.33 cm to the right.
We observed more extensive activation within ipsilateral lobules V and VI comparing good versus bad adapters during late prism adaptation (Fig. 7). Interestingly, we also observed a cluster of contralateral activation within lobule VI, which was exclusive for good adapters (Fig. 7 at y = −55). These findings were confirmed in subtraction analysis (good adapters > bad adapters). Likewise, for the dentate nucleus there was contralateral activation evident only for the good adapters, which was also confirmed in subtraction analysis (Fig. 7 at z = −36). Activation was located centrally in the nucleus.
Figure 7.

Cerebellar cortical and dentate nucleus activations for the median‐split subgroup analysis considering “good adapters” (n = 9) and “bad adapters” (n = 9). Cortical activation is plotted on the SUIT template in coronal slices [Diedrichsen, 2006] with white numbers indicating y‐coordinates, thresholded at P < 0.01 FDR corrected. Dentate nucleus activation is plotted on probabilistic dentate nucleus template [Diedrichsen et al., 2011], shown in axial slices (white numbers indicate z‐coordinate). Dentate activation was thresholded using bootstrap analysis (see Methods). Colour code denotes t‐values. Roman numbers indicate cerebellar lobules. Right side of the image is right side of the brain. [Color figure can be viewed in the online issue, which is available at http://wileyonlinelibrary.com.]
In the subgroup of bad adapters cerebellar cortical activation was more prominent within ipsilateral lobule VIII together with ventro‐caudal dentate activation.
DISCUSSION
The main finding of the current study is that activation of the ventro‐caudal dentate together with the posterior cerebellum (lobule IX, VIII) is related to the early phase of prism adaptation and therefore likely represents contributions to strategic learning. For successful spatial realignment activation of the superior parts of the posterior cerebellar lobe (lobule VI) seems to be important.
Strategic Motor Control
We observed a shift of activation from the dorso‐rostral dentate nucleus during baseline visuomotor trials to its ventro‐caudal part during the early phase of prism adaptation. As outlined in the introduction during the early phase strategic learning is most prominent [Redding and Wallace, 2002]. After successful error correction without further need for strategic motor control activation within the ventro‐caudal dentate became again weaker during the late adaptation phase. Consistently we observed exclusive ventro‐caudal activation near the caudal dentate pole following subtraction analysis (early prism > late prism). This contrast controls for basic visuomotor demands and spatial realignment during early prism adaptation. Thus, ventro‐caudal dentate activation appears to be associated with the execution of strategic motor control responses occurring during early prism adaptation.
It is important to note that a subdivision into a motor and non‐motor domain has been proposed for the dentate nucleus based on its efferent connectivity to the neocortex [Dum and Strick, 2003]. While more dorso‐rostral dentate regions primarily projecting to M1, the ventral premotor area and the supplementary motor area make up the motor‐domain, ventro‐caudal regions connected with the prefrontal and posterior parietal cortex form the non‐motor domain [Strick et al., 2009]. Recent fMRI studies of our group support the hypothesis of a ventro‐caudal dentate non‐motor domain [Küper et al., 2011; Thürling et al., 2011]. Other authors relate the ventro‐caudal dentate especially to visuomotor function [Glickstein et al., 2011].
Cognitive (or non‐motor) demands during the course of prism adaptation are primarily evident during the early error correction phase termed as “conscious correction” [Welch, 1978], “high‐level strategic motor control responses” [Redding et al., 2005], or “strategic motor learning” [Taylor and Ivry, 2012]. Strategic motor control includes the selection, modification or learning of movement plans in the face of aware motor performance error. Thus, ventro‐caudal dentate activation during the early phase of prism adaptation is consistent with the proposed representation of non‐motor function within this domain. Especially connectivity from the more ventro‐caudal dentate nucleus to the posterior parietal cortex as demonstrated by retrograde transport of neurotropic viruses in monkeys [Clower et al., 2001; Dum and Strick, 2003; Prevosto et al., 2010] can be regarded as functionally relevant for strategic motor control. Prism adaptation fMRI studies considering the whole cerebrum consistently reported (posterior) parietal activation during the early phase of prism adaptation in response to error correction [Chapman et al., 2010; Clower et al., 1996; Danckert et al., 2008; Luauté et al., 2009]. In fact there is agreement that one function of the posterior parietal cortex is the forming of high‐level cognitive plans for movement including correction of erroneous reaching movements [Andersen and Buneo, 2002; Grefkes and Fink, 2005]. Another neocortical area that thought to contribute to strategic motor learning is the prefrontal cortex [Taylor and Ivry, 2012]. However prefrontal activation during early prism adaptation has not been observed so far in fMRI studies [Chapman et al., 2010; Clower et al., 1996; Danckert et al., 2008; Luauté et al., 2009].
Three fMRI studies found posterior‐parietal and cerebellar coactivation during the error correction phase, although the reported locations were variable [Chapman et al., 2010: right anterior and left posterior cerebellum, Luauté et al., 2009: right hemispheral lobules IV/V, Danckert et al., 2010: right vermal lobule V]. In the present study we found pronounced activation within the inferior and posterior cerebellum (lobule VIII and IX) during early prism adaptation in comparison to baseline visuomotor pointing. This result was somewhat surprising since lobule VIII is traditionally thought to support primarily “basic” sensorimotor function but not non‐motor functions (apart from working memory contribution via a phonological loop) of the cerebellum based on fMRI [Stoodley and Schmahmann, 2009], human lesional [Stoodley and Schmahmann, 2010], and anatomical studies in monkeys demonstrating strong connectivity to M1 [Kelly and Strick, 2003; Lu et al., 2007]. However, recently an anatomical pathway in monkeys connecting lobule VIII and IX (among other lobules) via the more ventro‐caudal dentate nucleus to the posterior parietal cortex has been demonstrated [Prevosto et al., 2010]. Authors pointed out that posterior cerebellar cortical areas providing input to the posterior parietal cortex as well as M1 also have the required connectivity for the visual guidance of reaching. Specifically there is a projection from the dorsolateral pons relaying elaborate visual spatial representations from parietal dorsal stream areas and visuomotor inputs from the superior colliculus [Glickstein et al., 1994]. Thus, lobule VIII is situated in an ideal position to participate in visuomotor error correction by altering motor output planning. Consistent with this assumption impairment of prism adaptation was reported following lesions of the posterior cerebellum (including lobule VIII) in monkeys [Baizer et al., 1999]. In a human lesional study [Martin et al., 1996] deficits in prism adaptation were observed in patients with lesions in the territory supplied by the posterior inferior cerebellar artery (PICA), that comprises inferior parts of the posterior lobe [lobules Crus II‐X and ventro‐caudal parts of the dentate nucleus; Amarenco et al., 1993]. Although no clear conclusions can be drawn which kind of adaptive process (strategic motor control response or spatial realignment) was affected, it is remarkable that the majority of patients with PICA territory lesions in Martin's study had a prolonged or incomplete error correction but showed substantial aftereffects. Likewise, Werner et al. 2010 found deficits in adaptive improvement in patients with PICA lesions with unaffected after effects in a visuomotor adaptation task. This kind of impaired prism adaptation would be expected if strategic motor control responses for error correction are insufficient but spatial realignment (demonstrated by after effects) remains preserved. Taken together, the present study provides good evidence for a cerebellar contribution in strategic motor control responses which is represented within the posterior inferior cerebellar cortex (lobule VIII) and the ventro‐caudal dentate nucleus. Since lobule VIII also receives mossy fiber input from posterior parietal areas [Glickstein et al., 1994; Sasaki et al., 1977] it can be supposed that cerebellar computations are embedded in a closed cerebellar–parietal loop [Strick et al., 2009].
Spatial Realignment
Evidence for cerebellar contribution to spatial realignment derived from the present study is less clear. Specifically we observed activation in more posterior parts of ipsilateral lobule VI during the late phase of prism activation. This activation was not present during baseline visuomotor pointing and early prism adaptation. Yet, subtraction analyses focusing on spatial realignment remained negative. Luauté et al. 2009 observed increasing cerebellar activation in association to progressive spatial realignment in right anterior lobules IV/V using fMRI. There is some agreement that the ipsilateral cerebellar lobules IV–VI take part in the process of spatial realignment [Donchin et al., 2012]. The results of the current study do not contradict this assumption, since it is likely that activation associated with spatial realignment within these lobules could not be distinguished from the extensive activation associated with basic visuomotor performance by subtraction analyses. The same principle can be applied to the dorso‐rostral dentate. That means neurons responding to spatial realignment and those supporting visuomotor execution are presumably intermingled within lobules IV‐VI and the dorso‐rostral dentate nucleus, consistent with the concept of a fractured cerebellar cortical [Shambes et al., 1978] and nuclear [Thach et al., 1982] somatotopy. Yet, results of the current study implies that more posterior parts of lobule VI may be more involved in spatial realignment during visuomotor adaptation in contrast to anterior parts. A similar finding was observed in the human lesional study conducted by Donchin et al. 2012.
Results of post hoc median split analysis pointed to additional engagement of the contralateral lobule VI and the contralateral dentate nucleus. Bilateral cerebellar contribution during spatial realignment is in agreement with prior fMRI [Chapman et al., 2010] and human lesional studies [Werner et al., 2010]. Especially Werner et al. 2010 reported that both ipsi‐ and contralesional infarctions within the territory of the superior cerebellar artery (SCA) (supplying lobules V and VI) lead to degradation of after effects as a measure of realignment. Dentate nucleus activation detected in the group of good adapters on the contralateral side had a central location different from the ventro‐caudal activation during the early prism phase. Interestingly, the bad adapters exhibited an activation‐pattern which is similar to that detected during early prism activation (lobule VIII together with ventro‐caudal dentate nucleus). This is suggestive of strategic motor control still predominating during late adaptation in this subgroup and would explain missing after effects. As pointed out above strategic motor control and spatial realignment overlap in the course of prism adaptation with realignment occurring primarily in the later stages of adaptation.
CONCLUSION
The present study provides evidence for cerebellar participation in strategic motor control responses during the early error correction phase of prism adaptation that is presumably embedded in a posterior cerebellar cortical—ventro‐caudal dentate nucleus—posterior parietal loop. Our findings support the hypothesis that dentate nucleus non‐motor functions are represented within the ventro‐caudal part of the nucleus.
REFERENCES
- Amarenco P, Hauw J, Caplan L (1993): Cerebellar infarctions In: Lechtenberg R, editor. Handbook of Cerebellar Diseases. New York:Marcel Dekker; pp251–290. [Google Scholar]
- Andersen RA, Buneo CA (2002): Intentional maps in posterior parietal cortex. Annu Rev Neurosci 25:189–220. [DOI] [PubMed] [Google Scholar]
- Baizer JS, Kralj‐Hans I, Glickstein M (1999): Cerebellar lesions and prism adaptation in macaque monkeys. J Neurophysiol 81:1960–1965. [DOI] [PubMed] [Google Scholar]
- Chapman HL, Eramudugolla R, Gavrilescu M, Strudwick MW, Loftus A, Cunnington R, Mattingley JB (2010): Neural mechanisms underlying spatial realignment during adaptation to optical wedge prisms. Neuropsychologia 48:2595–2601. [DOI] [PubMed] [Google Scholar]
- Clower DM, Hoffman JM, Votaw JR, Faber TL, Woods RP, Alexander GE (1996): Role of posterior parietal cortex in the recalibration of visually guided reaching. Nature 383:618–621. [DOI] [PubMed] [Google Scholar]
- Clower DM, West RA, Lynch JC, Strick PL (2001): The inferior parietal lobule is the target of output from the superior colliculus, hippocampus, and cerebellum. J Neurosci 21:6283–6291. [DOI] [PMC free article] [PubMed] [Google Scholar]
- Danckert J, Ferber S, Goodale MA (2008): Direct effects of prismatic lenses on visuomotor control: an event‐related functional MRI study. Eur J Neurosci 28:1696–1704. [DOI] [PubMed] [Google Scholar]
- Diedrichsen J (2006): A spatially unbiased atlas template of the human cerebellum. Neuroimage 33:127–138. [DOI] [PubMed] [Google Scholar]
- Diedrichsen J, Balsters JH, Flavell J, Cussans E, Ramnani N (2009): A probabilistic MR atlas of the human cerebellum. Neuroimage 46:39–46. [DOI] [PubMed] [Google Scholar]
- Diedrichsen J, Maderwald S, Küper M, Thürling M, Rabe K, Gizewski ER, Ladd ME, Timmann, D (2011): Imaging the deep cerebellar nuclei: A probabilistic atlas and normalization procedure. Neuroimage 54:1786–1794. [DOI] [PubMed] [Google Scholar]
- Donchin O, Rabe K, Diedrichsen J, Lally N, Schoch B, Gizewski ER, Timmann D (2012): Cerebellar regions involved in adaptation to force field and visuomotor perturbation. J Neurophysiol 107:134–147. [DOI] [PubMed] [Google Scholar]
- Dum RP, Strick PL (2003): An unfolded map of the cerebellar dentate nucleus and its projections to the cerebral cortex. J Neurophysiol 89:634–639. [DOI] [PubMed] [Google Scholar]
- Friston KJ, Holmes AP, Poline JB, Grasby PJ, Williams SC, Frackowiak RS, Turner R (1995): Analysis of fMRI time‐series revisited. Neuroimage 2:45–53. [DOI] [PubMed] [Google Scholar]
- Glickstein M, Gerrits N, Kralj‐Hans I, Mercier B, Stein J, Voogd J (1994): Visual pontocerebellar projections in the macaque. J Comp Neurol 349:51–72. [DOI] [PubMed] [Google Scholar]
- Glickstein M, Sultan F, Voogd J (2011): Functional localization in the cerebellum. Cortex 47:59–80. [DOI] [PubMed] [Google Scholar]
- Grefkes C, Fink GR (2005): The functional organization of the intraparietal sulcus in humans and monkeys. J Anat 207:3–17. [DOI] [PMC free article] [PubMed] [Google Scholar]
- Grodd W, Hülsmann E, Lotze M, Wildgruber D, Erb M (2001): Sensorimotor mapping of the human cerebellum: fMRI evidence of somatotopic organization. Hum Brain Mapp 13:55–73. [DOI] [PMC free article] [PubMed] [Google Scholar]
- Hayasaka S, Nichols TE (2003): Validating cluster size inference: Random field and permutation methods. Neuroimage 20:2343–2356. [DOI] [PubMed] [Google Scholar]
- Huang VS, Haith A, Mazzoni P, Krakauer JW (2011): Rethinking motor learning and savings in adaptation paradigms: Model‐free memory for successful actions combines with internal models. Neuron 70:787–801. [DOI] [PMC free article] [PubMed] [Google Scholar]
- Kelly RM, Strick PL (2003): Cerebellar loops with motor cortex and prefrontal cortex of a nonhuman primate. J Neurosci 23:8432–8444. [DOI] [PMC free article] [PubMed] [Google Scholar]
- Küper M, Dimitrova A, Thürling M, Maderwald S, Roths J, Elles HG, Gizewski ER, Ladd ME, Diedrichsen J, Timmann D (2011): Evidence for a motor and a non‐motor domain in the human dentate nucleus‐‐An fMRI study. Neuroimage 54:2612–2622. [DOI] [PubMed] [Google Scholar]
- Küper M, Thürling M, Stefanescu R, Maderwald S, Roths J, Elles HG, Ladd ME, Diedrichsen J, Timmann D (2012): Evidence for a motor somatotopy in the cerebellar dentate nucleus‐An fMRI study in humans. Hum Brain Map 33:2741–2749. [DOI] [PMC free article] [PubMed] [Google Scholar]
- Lu X, Miyachi S, Ito Y, Nambu A, Takada M (2007): Topographic distribution of output neurons in cerebellar nuclei and cortex to somatotopic map of primary motor cortex. Eur J Neurosci 25:2374–2382. [DOI] [PubMed] [Google Scholar]
- Luauté J, Schwartz S, Rossetti Y, Spiridon M, Rode G, Boisson D, Vuilleumier P (2009): Dynamic changes in brain activity during prism adaptation. J Neurosci 29:169–178. [DOI] [PMC free article] [PubMed] [Google Scholar]
- Martin TA, Keating JG, Goodkin HP, Bastian AJ, Thach WT (1996): Throwing while looking through prisms. I. Focal olivocerebellar lesions impair adaptation. Brain 119:1183–1198. [DOI] [PubMed] [Google Scholar]
- Newport R, Jackson SR (2006): Posterior parietal cortex and the dissociable components of prism adaptation. Neuropsychologia 44:2757–2765. [DOI] [PubMed] [Google Scholar]
- Oldfield RC (1971): The assessment and analysis of handedness: The Edinburgh inventory. Neuropsychologia 9:97–113. [DOI] [PubMed] [Google Scholar]
- Pisella L, Rossetti Y, Michel C, Rode G, Boisson D, Pélisson D, Tilikete C (2005): Ipsidirectional impairment of prism adaptation after unilateral lesion of anterior cerebellum. Neurology 65:150–152. [DOI] [PubMed] [Google Scholar]
- Prevosto V, Graf W, Ugolini G (2010): Cerebellar inputs to intraparietal cortex areas LIP and MIP: functional frameworks for adaptive control of eye movements, reaching, and arm/eye/head movement coordination. Cereb Cortex 20:214–228. [DOI] [PMC free article] [PubMed] [Google Scholar]
- Redding GM, Rossetti Y, Wallace B (2005): Applications of prism adaptation: A tutorial in theory and method. Neurosci Biobehav Rev 29:431–444. [DOI] [PubMed] [Google Scholar]
- Redding GM, Wallace B (2002): Strategic calibration and spatial alignment: A model from prism adaptation. J Mot Behav 34:126–138. [DOI] [PubMed] [Google Scholar]
- Rijntjes M, Buechel C, Kiebel S, Weiller C (1999): Multiple somatotopic representations in the human cerebellum. Neuroreport 10:3653–3658. [DOI] [PubMed] [Google Scholar]
- Sasaki K, Oka H, Kawaguchi S, Jinnai K, Yasuda T (1977): Mossy fibre and climbing fibre responses produced in the cerebeller cortex by stimulation of the cerebral cortex in monkeys. Exp Brain Res 29:419–428. [DOI] [PubMed] [Google Scholar]
- Shambes GM, Gibson JM, Welker W (1978): Fractured somatotopy in granule cell tactile areas of rat cerebellar hemispheres revealed by micromapping. Brain Behav Evol 15:94–140. [DOI] [PubMed] [Google Scholar]
- Stoodley CJ, Schmahmann JD (2009): Functional topography in the human cerebellum: A meta‐analysis of neuroimaging studies. Neuroimage 44:489–501. [DOI] [PubMed] [Google Scholar]
- Stoodley CJ, Schmahmann JD (2010): Evidence for topographic organization in the cerebellum of motor control versus cognitive and affective processing. Cortex 46:831–844. [DOI] [PMC free article] [PubMed] [Google Scholar]
- Strick PL, Dum RP, Fiez JA (2009): Cerebellum and nonmotor function. Annu Rev Neurosci 32:413–434. [DOI] [PubMed] [Google Scholar]
- Taylor JA, Ivry RB (2012): The role of strategies in motor learning. Ann NY Acad Sci 1251:1–12. [DOI] [PMC free article] [PubMed] [Google Scholar]
- Thach WT, Perry JG, Schieber MH (1982): Cerebellar output: body maps and muscle spindles In: Palay SL, Chan‐Palay V, editors. The Cerebellum: New Vistas New York:Springer; Exp Brain Res Suppl6:440–454. [Google Scholar]
- Thürling M, Küper M, Stefanescu R, Maderwald S, Gizewski ER, Ladd ME, Timmann D (2011): Activation of the dentate nucleus in a verb generation task: A 7T MRI study. Neuroimage 57:1184–1191. [DOI] [PubMed] [Google Scholar]
- Welch RB.1978. Perceptual Modification: Adapting to Altered Sensory Environment. New York:Academic Press. [Google Scholar]
- Werner S, Bock O, Gizewski ER, Schoch B, Timmann D (2010): Visuomotor adaptive improvement and aftereffects are impaired differentially following cerebellar lesions in SCA and PICA territory. Exp Brain Res 201:429–439. [DOI] [PMC free article] [PubMed] [Google Scholar]