

Abstract
Among the various asymmetrical structures of the human brain, the planum temporale, an anatomical region associated with a variety of auditory and language‐related processes, has received particular attention. While its surface area has been shown to be greater in the left hemisphere compared to the right in about two‐thirds of the general population, altered patterns of asymmetry were revealed by post mortem analyses in individuals with developmental dyslexia. These findings have been inconsistently replicated in magnetic resonance imaging studies of this disorder. In this report, we attempt to resolve past inconsistencies by analyzing the T1‐weighted MR images of 81 children (mean age: 11 years, sd: 17 months), including 46 control (25 boys) and 35 dyslexic children (20 boys). We manually outlined Heschl's gyri, the planum temporale and the posterior rami of the Sylvian fissure on participants' brain images, using the same anatomical criteria as in post mortem studies. Results revealed an altered pattern of asymmetry of the planum temporale surface area in dyslexic boys only, with a greater proportion of rightward asymmetrical cases among dyslexic boys compared to control boys. Additionally, analyses of cortical thickness showed no asymmetry differences between groups for any of the regions of interest. Finally, a greater number of Heschl's gyrus full duplications emerged for the right hemisphere of dyslexic boys compared to controls. The present findings confirm and extend early post mortem observations. They also stress the importance of taking gender into account in studies of developmental dyslexia. Hum Brain Mapp 35:5717–5735, 2014. © 2014 Wiley Periodicals, Inc.
Keywords: developmental dyslexia, planum temporale, structural magnetic resonance imaging, gender, reading
Abbreviations
- ADHD
attention deficit hyperactivity disorder
- H1
first Heschl's gyrus
- H2
second Heschl's gyrus
- PR
posterior rami of the Sylvian fissure
- PT
planum temporale
INTRODUCTION
A variety of asymmetrical features have been observed in the human brain, both in anatomy and function. Among the various brain regions concerned, the planum temporale (PT) has received particular attention. This triangular structure lies on the upper surface of the posterior superior temporal gyrus, within the Sylvian fossa. It is an associative auditory area, located posterior to Heschl's gyrus. As suggested by lesion and functional studies, the PT is implicated in a number of processes, including auditory and phonological processing, language comprehension, and subvocal articulation [Price, 2010; Griffiths and Warren, 2002]. The post mortem study of Geschwind and Levitsky [1968] was among the first to outline a leftward anatomical asymmetry of this structure in the general population. By measuring the length of the lateral border of the PT in 100 brains' photographs, the authors reported a leftward asymmetry in 65 cases, a rightward one in 11, while 24 brains were approximately symmetrical. These findings were replicated in additional post mortem studies of adults [Galaburda et al., 1987], infants [Wada et al., 1975; Witelson and Pallie, 1973], and fetuses [Chi et al., 1977].
The asymmetry in PT surface area was initially considered as a potential correlate of the well‐established functional asymmetry in the language network, which favors the left hemisphere over the right. Some evidence for a relationship between functional and structural asymmetries in this region exists [Foundas et al., 1994; Moffat et al., 1998; but see Jäncke and Steinmetz, 1993]. However, a few recent studies [Dorsaint‐Pierre et al., 2006; Dos Santos Sequeira et al., 2006; Eckert et al., 2006; Keller et al., 2011] with larger groups of participants, assessing language lateralization with different techniques, have revealed a greater prevalence of leftward anatomical asymmetry in most participants, regardless of the functional organization of language.
Rather than a simple correlate of functional specialization, PT anatomical asymmetry is likely to be influenced by multiple interacting factors, among which handedness and gender. It has indeed been suggested that the degree of leftward asymmetry is related to handedness [Foundas et al., 2002; Steinmetz et al., 1991], although further exploration of this issue in large samples might be beneficial. Regarding gender, a more marked PT or posterior Sylvian fissure surface area asymmetry in males compared to females has been reported [Good et al., 2001; Kovalev et al., 2003; Kulynych et al., 1994; Li et al., 2014], although still a matter of debate [Chiarello et al., 2009; Sommer et al., 2008]. The sex difference in asymmetry coefficients may arise from a smaller right PT surface area in males than in females, a fetal testosterone related effect [Lombardo et al., 2012]. This hypothesis would also be in line with early post mortem evidence of a negative correlation between right PT surface area and the degree of leftward PT asymmetry [Galaburda et al., 1987].
Interestingly, interactions between gender, handedness, and also language lateralization are starting to emerge. Dos Santos Siquiera et al. [2006] observed a correlation between language lateralization as measured by dichotic listening and PT asymmetry, only in right‐handed men (N = 23). This finding is supported by the studies of Chiarello et al. [2004, 2009], where an association between behavioral lateralization (estimated by divided visual field lexical tasks) and PT asymmetry was also identified in right‐handed men (N = 20 and 85, respectively).
These observations, if confirmed by future studies, would support the traditional view that PT asymmetry may to some extent be related to language function, at least in some populations. Interestingly, in their post mortem analysis of the macroanatomical and microanatomical features of the dyslexic brain, Galaburda et al. [1985; Humphreys et al., 1990] observed symmetrical plana temporale in seven patients (4 males and 3 females) with developmental dyslexia, a specific learning disorder that affects reading abilities. Many attempts have been made to replicate this finding in vivo, with the help of neuroimaging techniques. Results have, however, been very contradictory, as summarized in Table 1.
Table 1.
Previous studies of planum temporale anatomical asymmetry in developmental dyslexia
| Year | Authors | Participants (ctr‐dys) | Males (ctr‐dys) | Strictly right‐handed (ctr‐dys) | Mean age (ctr‐dys) |
|---|---|---|---|---|---|
| 1990 | Hynd et al. | 10‐10 | 8‐8 | 10‐7 | 11.8–9.9 |
| 1990 | Larsen et al. | 17–19 | 15(?)−15 | 10(?)−6 | 15.4–15.1 |
| 1991 | Semrud‐Clikeman et al. | 10‐10 | 8‐8 | 10‐7 | 11.7–9.9 |
| 1993 | Leonard et al. | 12‐9 | 5–7 | All | 37.1–36 |
| 1994 | Schulz et al. | 14–17 | 7–10 | All | 8.9‐8.6 |
| 1997 | Rumsey et al. | 14–16 | 14–16 | Most participants | 24–27 |
| 1998 | Hugdahl et al. | 25‐25 | 20‐20 | 23‐23 | 11.7–11.8 |
| 1999 | Green et al. | 8‐8 | 8‐8 | All | 24‐23.5 |
| 1999 | Best and Demb et al. | 5‐5 | 3‐3 | 4–5 | 26.8–22.2 |
| 2000 | Heiervang et al. | 20‐20 | 20‐20 | 20‐20 | 11.7–11.8 |
| 2000 | Robichon et al. | 14–16 | 14–16 | 10‐9 | 23.6–21 |
| 2001 | Leonard et al. | 15‐13 | 8‐7 | Most participants | 22–24 |
| 2002 | Leonard et al. (Study 1) | 0–14a | 7 | Most participants | 10.6 |
| 2002 | Foster et al. | 12–19b | 5–15 | 8–18 | 9.9‐9.6 |
| 2003 | Hugdahl et al. | 23‐23 | 20‐19 | 22‐22 | 11.8–11.8 |
| 2003 | Eckert et al. | 32‐18 | 19‐14 | 32‐17 | 11.4–11.3 |
| 2004 | Kibby et al. | 9‐8c | 6–8 | Most participants | 10‐9.5 |
| 2006 | Leonard et al. | 0–22d | 14 | 18 | 13 |
| 2013 | Sanchez Bloom et al. | 29‐26 | 16–18 | Most participants (96%) | 10.2–10.8 |
| Year | Authors | Inclusion criteria for dyslexia |
|---|---|---|
| 1990 | Hynd et al. | Familial history, IQ > 85, discrepancy between IQ and WA + reading comprehension >20 points. |
| 1990 | Larsen et al. | Accuracy and speed in nonword decoding <−1.8 z‐scores, normal intelligence (Raven). |
| 1991 | Semrud‐Clikeman et al. | Familial history, IQ > 85, discrepancy with WA and reading comprehension >20 standard points, no ADHD comorbidity. |
| 1993 | Leonard et al. | Familial history, low performance in LAC and WRMT. No IQ test. |
| 1994 | Schulz et al. | IQ > 85, discrepancy between IQ and WI + WA, OR scores in one of the two below the 25th percentile. |
| 1997 | Rumsey et al. | IQ > 90, discrepancy with GORT‐3 passage scores >15 points. |
| 1998 | Hugdahl et al. | IQ > 85, score 2sd below age mean in standardized screening reading tests. |
| 1999 | Green et al. | History of dyslexia. Discrepancy between verbal IQ and reading and writing rate + phonologic awareness + auditory retrieval. |
| 1999 | Best and Demb et al. | Childhood history and adult diagnosis of dyslexia, participants prescreened for fMRI experiment. |
| 2000 | Heiervang et al. | IQ > 85, score 2sd below age mean in standardized screening reading tests. |
| 2000 | Robichon et al. | Childhood diagnosis and familial history, IQ > 90 or Raven matrices >50. |
| 2001 | Leonard et al. | Poor word recognition (GORT, WRAT‐SP, WRAT‐RD, Woodcock), WRMT‐WA<90. Normal intelligence (WJ‐Cog). |
| 2002 | Leonard et al. (Study 1) | From previous longitudinal study, children qualifying for remediation. (Better reading accuracy and lower verbal ability scores than children with research diagnoses). |
| 2002 | Foster et al. | IQ > 75, discrepancy between IQ and WRAT + WRMT >20 points |
| 2003 | Hugdahl et al. | IQ > 85, 2 sd below mean in Norwegian standardized reading test. |
| 2003 | Eckert et al. | IQ > 90, at least 1 sd discrepancy between verbal IQ and WRMT‐R + TOWRE + WRAT‐SP. SLI excluded. |
| 2004 | Kibby et al. | IQ > 85, >20 points discrepancy between IQ and WA and read comprehension |
| 2006 | Leonard et al. | Children identified by teachers as potential participants for previous intervention study. |
| 2013 | Sanchez Bloom et al. | IQ > 85, GORT<85, discrepancy of at least 15 points between the two. |
| Year | Authors | Groups matched for | Anatomical criteria |
|---|---|---|---|
| 1990 | Hynd et al. | Gender | “Heschl's sulcus” (excluding H2) to end of Sylvian fissure |
| 1990 | Larsen et al. | Age, gender, SES, intelligence (Raven) | ridge of Heschl's gyrus (excluding H2) to end of Sylvian fissure |
| 1991 | Semrud‐Clikeman et al. | Gender | “Heschl's sulcus” (excluding H2) to end of Sylvian fissure |
| 1993 | Leonard et al. | Age, handedness | Heschl's sulcus to intersection between PDR and PAR |
| 1994 | Schulz et al. | Age, gender, handedness, IQ | Rostral‐most slice not including the insula to end of PAR |
| 1997 | Rumsey et al. | Age, gender, handedness, SES | Heschl's sulcus to intersection between PDR and PAR |
| 1998 | Hugdahl et al. | Age, gender, handedness, pIQ | Heschl's sulcus to end of PDR |
| 1999 | Green et al. | Age, gender, handedness, education | Heschl's sulcus (excluding H2) to end of PAR |
| 1999 | Best and Demb et al. | Age, gender | 1) Heschl's sulcus to end of PDR |
| 2) and 3) Heschl's sulcus to intersection between PDR and PAR | |||
| 2000 | Heiervang et al. | Age, gender, handedness | Heschl's sulcus to end of PDR |
| 2000 | Robichon et al. | Age, gender | Heschl's sulcus to end of PAR |
| 2001 | Leonard et al. | Age, gender, handedness, IQ | 1) Heschl's sulcus to intersection between PDR and PAR |
| 2) Heschl's sulcus to end of PAR | |||
| 2002 | Leonard et al. (Study 1) | SES, IQ | Heschl's sulcus to intersection between PDR and PAR |
| 2002 | Foster et al. | Age, handedness, IQ | Heschl's sulcus to intersection between PDR and PAR |
| 2003 | Hugdahl et al. | Age, gender, handedness, IQ | Heschl's sulcus to end of PDR |
| 2003 | Eckert et al. | Age, handedness, verbal IQ | Heschl's sulcus to intersection between PDR and PAR |
| 2004 | Kibby et al. | Age, handedness, IQ | Heschl's sulcus to intersection between PDR and PAR |
| 2006 | Leonard et al. | “Heschl's sulcus” (excluding H2) to intersection between PDR and PAR | |
| 2013 | Sanchez Bloom et al. | Age, gender, handedness, IQ | Heschl's sulcus to end of PDR |
| Year | Authors | Labelling: Section used and protocol |
|---|---|---|
| 1990 | Hynd et al. | Sagittal, length of outer border from extreme sagittal slices |
| 1990 | Larsen et al. | Coronal, width measurement. not into depth of sulci. |
| 1991 | Semrud‐Clikeman et al. | Sagittal, length of outer border from extreme sagittal slices |
| 1993 | Leonard et al. | Sagittal, mean length between standard sagittal positions 2.75–3.25, not into depth of sulci. |
| 1994 | Schulz et al. | Coronal, area estimation from labelling*slice thickness, attempt accounting for curvature. |
| 1997 | Rumsey et al. | Convoluted area estimation from 3D rendering. |
| 1998 | Hugdahl et al. | Sagittal, area estimation from labelling*slice thickness, attempt accounting for curvature. |
| 1999 | Green et al. | sagittal, convoluted area estimation from 3D mesh (created by manual segmentation). |
| 1999 | Best and Demb et al. | 1) Sagittal, length between standard medial positions, then length*thickness. |
| 2) Straight line, not accounting for curvature. | ||
| 3) Accounting for curvature but excluding depth of Heschl's sulcus. | ||
| 2000 | Heiervang et al. | Sagittal, convoluted length*slice thickness. |
| 2000 | Robichon et al. | Sagittal, while viewing axial and coronal too. Convoluted tracing*slice thickness. |
| 2001 | Leonard et al. | Sagittal, mean length between Tal x = 46–56 |
| 2002 | Leonard et al. (Study 1) | Sagittal, mean length between Tal x = 46–56 |
| 2002 | Foster et al. | Sagittal, mean length on best view and 2 further slices lateral and medial to the best. not into depth of sulci. |
| 2003 | Hugdahl et al. | Sagittal, convoluted length*thickness. |
| 2003 | Eckert et al. | Sagittal, convoluted length between Tal x = 46–56. |
| 2004 | Kibby et al. | Sagittal, mean length on best view, not into depth of sulci. |
| 2006 | Leonard et al. | Sagittal, mean length between Tal x = 46–56. |
| 2013 | Sanchez Bloom et al. | Sagittal, convoluted length*slice thickness. |
| Year | Authors | Imaging protocol | Asymmetry values CONTROLS | Asymmetry values DYSLEXICS |
|---|---|---|---|---|
| 1990 | Hynd et al. | 0.6 T, 7.5 mm axial | Not reported | Not reported |
| 1990 | Larsen et al. | 1.5 T, 3mm coronal with 0.3 mm gaps | Not reported | Not reported |
| 1991 | Semrud‐Clikeman et al. | 0.5 T, 5 mm axial | Not reported | Not reported |
| 1993 | Leonard et al. | 1 T, 1.25 mm sagittal | 0.17 ± 0.22 | 0.48 ± 0.25 |
| 1994 | Schulz et al. | 1.5 T, 5 mm coronal | Boys 0.18 ± 0.3 girls 0.23 ± 0.3 | Boys 0.33 ± 0.4 girls 0.02 ± 0.4 |
| 1997 | Rumsey et al. | 1.5 T, 1.5 mm axial reoriented | 0.28 | 0.24 |
| 1998 | Hugdahl et al. | 1.5 T, 1.25 mm sagittal | Not reported | Not reported |
| 1999 | Green et al. | 1.5 T, 1.07 mm in‐plane resolution | −0.1 | −0.03 |
| 1999 | Best and Demb et al. | 1.5 T, 1 mm sagittal | 1) 0.17 ± 0.29 | 1) 0.26 ± 0.14 |
| 2) 0.14 ± 0.31 | 2) 0.17 ± 0.26 | |||
| 3) 0.1 ± 0.3 | 3) 0.1 ± 0.31 | |||
| 2000 | Heiervang et al. | 1 T, 1.25 mm | 0.34 ± 0.31 | 0.30 ± 0.27 |
| 2000 | Robichon et al. | 1.5 T, 1.17 mm axial | Not reported | Not reported |
| 2001 | Leonard et al. | 3 T, 1 mm | 1) 0.52 ± 0.7 | 1) 0.72 ± 0.5 |
| 2) 0.22 ± 0.36 | 2) 0.32 ± 0.3 | |||
| 2002 | Leonard et al. (Study 1) | 1 or 1.5 T, 1 mm | 0.35 ± 0.47 | |
| 2002 | Foster et al. | 0.6 T, 3.1 mm sagittal | Not reported | Not reported |
| 2003 | Hugdahl et al. | 1 T, 1.25 mm sagittal | Not reported | Not reported |
| 2003 | Eckert et al. | 1.5 T, 1.2 mm sagittal | Boys 0.33 ± 0.5 girls 0.21 ± 0.4 | Boys 0.23 ± 0.6 girls 0.34 ± 0.5 |
| 2004 | Kibby et al. | 0.6 T, 3.1 mm sagittal | Not reported | Not reported |
| 2006 | Leonard et al. | 1.5 T, 1 mm | 0.53 ± 0.5 | |
| 2013 | Sanchez Bloom et al. | 1.5 T, 1.5 mm | −0.1341 ± 0.25 | −0.009 ± 0.2 |
| Year | Authors | Results |
|---|---|---|
| 1990 | Hynd et al. | Dyslexic participants symmetrical or rightward asymmetrical in length, left PT smaller. |
| 1990 | Larsen et al. | Dyslexic participants symmetrical, greater right PT in symmetrical participants. |
| 1991 | Semrud‐Clikeman et al. | 9/10 dyslexic participants symmetrical or rightward asymmetrical in length. |
| 1993 | Leonard et al. | Leftward asymmetry in dyslexics; rightward asymmetry of PR; greater PR than PT tissue in the right hemisphere of dyslexics. |
| 1994 | Schulz et al. | No differences between groups, trend for symmetry in dyslexic girls (not significant). |
| 1997 | Rumsey et al. | No differences in PT or PR asymmetry; smaller left PT in dyslexic participants. |
| 1998 | Hugdahl et al. | Reduced left PT in dyslexic participants; reduced leftward asymmetry in dyslexic participants. |
| 1999 | Green et al. | No difference in PT asymmetry; larger PT+PR area in dyslexic participants. |
| 1999 | Best and Demb et al. | No difference in PT asymmetry, regardless of method. |
| 2000 | Heiervang et al. | No difference in asymmetry of PT (leftward) or PT+PR (leftward). Fewer dyslexics had a rightward PR asymmetry.Smaller left PT in dys. |
| 2000 | Robichon et al. | No difference in PT asymmetry. |
| 2001 | Leonard et al. | Greater leftward asymmetry of PT+PR in dyslexics. No difference in PT‐to‐PR ratio. Greater H2 surface area. |
| 2002 | Leonard et al. (Study 1) | Significantly leftward PT asymmetry in dyslexic participants. |
| 2002 | Foster et al. | No difference in PT or PT+PP asymmetry. |
| 2003 | Hugdahl et al. | No difference in PT asymmetry., smaller left PT in dyslexics. |
| 2003 | Eckert et al. | No difference in PT asymmetry. No group effect nor group*gender interaction. |
| 2004 | Kibby et al. | No difference in PT asymmetry or pars triangularis asymmetry. |
| 2006 | Leonard et al. | Leftward asymmetry of PT. |
| 2013 | Sanchez Bloom et al. | Dyslexic participants symmetrical, greater right PT in symmetrical cases. |
Dyslexic participants were compared to 21 children with SLI.
10 dyslexic participants were also affected by ADHD.
Eight control and 6 dyslexic participants were affected by ADHD, 1 control by expressive language impairment.
Study of anatomical risk factors in a population of dyslexic and SLI children.
Abbreviations: GORT, Gray Oral Reading Test; LAC, Lindamood Auditory Conceptualization Test; TOWRE, Test of Word Reading Efficiency; WA, Woodcock Word Attack; WI, Woodcock Word identification; WJ‐Cog, Woodcock‐Johnson test of cognitive abilities; WRAT, Wide Range Achievement Test, ‐SP, spelling, RD, reading; WRMT, Woodcock Reading Mastery Tests.
Multiple rows characterize studies with more than one tracing strategy.
Abbreviations: PAR, posterior ascending ramus; PDR, posterior descending ramus. Both posterior rami can be seen in Figure 1a.
Several factors may explain these inconsistencies, including issues of sample size and of groups' matching in terms of age, gender, handedness, and IQ. Furthermore, considerable variability is found in the type of measurement and in the choice of anatomical criteria, which, as we will show below, are of great importance.
In this study, we attempted to resolve past inconsistencies by analyzing the magnetic resonance imaging (MRI) images of a large set of dyslexic and control children, free of major comorbidities (specific language impairment or SLI and attention deficit hyperactivity disorder or ADHD) and matched for age, gender, handedness, maternal education, and performance IQ. For all participants, we manually segmented a number of regions: first, the PT; second, any posterior ramus (PR) of the Sylvian fissure; third, the most anterior gyrus of Heschl (H1) and any additional transverse gyri (H2). These multiple measures allow for comparisons with many previous reports, in spite of the heterogeneity of the anatomical criteria that they used.
In addition to evaluating surface area asymmetry of all regions of interest, we performed exploratory analyses on cortical thickness and its asymmetry, similarly to previous studies focusing on other populations [Barta et al., 1997; Qiu et al., 2008; Ratnanather et al., 2013].
Following the work of Schultz et al. [1994], age and global brain measures (mean hemispheric surface area or mean hemispheric thickness) were included as covariates in all analyses. Moreover, given the emerging literature on gender differences in dyslexia [Altarelli et al., 2013; Evans et al., 2014] and its influence on PT surface area, as aforementioned, we also included this factor in all analyses.
Based on the post mortem literature, our predictions were that significant differences in PT surface area asymmetry between control and dyslexic children would be observed, potentially driven by variations in the right PT surface area [Galaburda et al., 1985; Galaburda et al., 1987; Humphreys et al., 1990].
MATERIALS AND METHODS
Participants
Children in this report were drawn from two datasets, differing in age and imaging protocols. The first population came from a larger study on the neuroanatomical and genetic bases of dyslexia, which consisted of 64 children (32 dyslexics). The second population was drawn from the study of Monzalvo et al. [2012], comprising 46 children (23 dyslexics). No child with a history of neurological, psychiatric, or behavioral disorder, with a hearing or uncorrected visual deficit was included.
Children in this experiment were selected based on the following criteria:
high quality of their T1 images (population one: 64 children, population two: 41)
above threshold cognitive performances, as detailed below (population one: 61 children, population two: 36)
right handedness (population one: 56 children, population two: 35)
no history of SLI or ADHD, as ascertained through specific questionnaires (population one: 46 children, population two: 35).
Therefore, 46 children from population one (29 controls) and 35 children from population two (17 controls) participated in this analysis.
All dyslexic children had been previously diagnosed by a specialized learning disability centre (Dr Billard, CHU Bicêtre). They were selected on the basis of their reading lag, as estimated by a standardized French reading test [“L'alouette,” Lefavrais, 1965], in which a meaningless text of 265 words has to be read as quickly and accurately as possible, within 3 min. Age‐related norms have been established, allowing estimation of a child's reading age and lag relative to his/her peers. A delay of 18 months or more was chosen for inclusion, which is widely used as a criterion for dyslexia in childhood. Nonverbal IQ was also taken into account: standard scores in the block design subtest (or the mean of block design and matrices when available) from the Wechsler Intelligence Scale for Children [WISC‐III or IV; Wechsler, 2005] needed to be greater than or equal to 7, that is within 1 standard deviation from the age‐adjusted mean.
Dyslexic children (N = 35, 20 boys) and controls (N = 46, 25 boys) were matched for age (average: 11 years, sd: 17 months), gender, nonverbal IQ, maternal education (assessed through a sociodemographic questionnaire), and handedness (evaluated either by direct oral questions on laterality or by the Edinburgh handedness inventory).
All participants and their parents gave written informed consent prior to the tests; the experimental procedures received approval from the local hospital ethics committee.
Behavioral Tests
A large battery of tests was run in each dataset; only the overlapping measures are reported here and in Table 2. Apart from nonverbal and reading abilities, children's verbal skills and working memory were evaluated, respectively, by the similarities and digit span subtests of WISC; rapid automatized naming was tested on pictures [Plaza and Robert‐Jahier, 2006; Pech‐Georgel and George, 2006]; phonological skills were assessed using a phoneme deletion task from both consonant‐vowel‐consonant and consonant‐consonant‐vowel pseudowords [EVALEC, Sprenger‐Charolles et al., 2005].
Table 2.
Results of the comparison between control and dyslexic participants, for all behavioral variables
| Ctr | Dys | F | P‐value | |
|---|---|---|---|---|
| Nonverbal IQ | 11 (2) | 10 (2) | 1 | >0.3 |
| Similarities | 13 (3) | 11 (4) | 18.7 | <0.001 |
| Rapid picture naming (sec/picture) | 0.8 (0.1) | 1 (0.2) | 69 | <0.001 |
| Phoneme deletion (correct items/24) | 22 (2) | 18 (5) | 21.9 | <0.001 |
| Digitspan | 10 (3) | 7(2) | 22.8 | <0.001 |
| Reading lag (months) | 7 (13) | −37 (10) | 285.4 | <0.001 |
| Reading speed (words correctly identified in 3 min) | 365 (79) | 94 (74) | 374.3 | <0.001 |
| Reading accuracy (% of correctly identified words) | 96 (2) | 78 (13) | 67.9 | <0.001 |
Mean and standard deviation (in brackets) for each group are reported, as well as F and P values.
MRI Procedure
All children were familiarized with the scanner environment in a mock MRI setup and then underwent a 3 T MRI exam that included MP‐RAGE T1 imaging on the same scanner (Siemens Tim Trio, Erlangen, Germany). As participants were drawn from two different datasets, for 46 of them whole‐brain images were acquired using a 32‐channels head coil (parameters: acquisition matrix = 230 × 230 × 224, repetition time (TR) = 2300 ms, echo time (TE) = 3.05 ms, flip angle = 9 deg, field of view (FOV) = 230 mm, voxel size = 0.9 × 0.9 × 0.9 mm), while for the remaining 35 children a 12‐channel head coil was used (parameters: acquisition matrix: 256 × 256 × 176, TR = 2300 ms, TE = 4.18 ms, flip angle = 9 deg, FOV = 256 mm, voxel size: 1 × 1 × 1 mm). To account for these differences, sequence type was included as a factor in all analyses.
General Procedure for the Labeling of Anatomical Regions
A cortical reconstruction procedure was applied using Brainvisa software (http://brainvisa.info), so that each subject's left and right cortical surfaces were obtained from the T1 images. Using dedicated visualization and labeling tools in Anatomist [Le Troter et al., 2012], a number of specific anatomical areas in the posterior part of the Sylvian fissure (described below) were marked for each child and hemisphere. The labeling procedure was carried out on the gray matter‐CSF surface meshes, while simultaneously viewing the T1 images in the three classic orthogonal views (coronal, axial, and sagittal). As pointed out by various authors [Galaburda et al., 1993; Honeycutt et al., 2000; Kulynych et al., 1993; Westbury et al., 1999], taking advantage of multiple views is of crucial importance to identify the relevant anatomical landmarks in the Sylvian fissure. Anatomist tools allowed the localization of a given coordinate on all views as well as on the cortical surface mesh at the same time.
A clipping plane was defined on the cortical mesh, so as to view the whole superior temporal plane while hiding the frontal and parietal lobes from view (as depicted in Fig. 1a,b); this plane as well as the mesh itself could be moved in any desired direction for better visualization. Our labeling strategy and surface area calculation allowed us to follow the cortical surface and take any convolution and the curvature of the temporal plane into account.
Tracing was carried out by one rater (I.A.) blind to participants' diagnostic group and gender. A second rater (F.L.) carried out the labeling on a subset of participants (18), allowing the estimation of the inter‐rater reliability for the PT surface: intra‐class correlation= 0.8, P < 0.0001.
We labeled four main anatomical regions:
The most anterior Heschl's gyrus (H1)
Any additional Heschl's gyri (H2)
The planum temporale (PT)
The posterior rami of the Sylvian fissure (PR), ascending or descending.
Specific Criteria for the Labeling of Anatomical Regions
First, we labeled Heschl's gyrus, or H1. This gyrus, which is bordered posteriorly by Heschl's sulcus, can be easily identified on coronal slices and on cortical mesh models. Laterally and anteriorly H1 flattens out and becomes level with the superior temporal gyrus, which makes it difficult to delineate its lateral and anterior borders in brain images. Given these constraints, and taking into consideration cytoarchitectonic studies [Rademacher et al., 1993, 2001] indicating that most of the primary auditory cortex lies on the medial half of H1, we decided to label only this easily delineated medial region. To do so, we identified the most anterior coronal section in which the lateral extension of the PT could be seen and arbitrarily labeled the anterior border of Heschl's gyrus on that section, giving rise to a well‐defined and replicable antero‐lateral margin (red line in Fig. 1b).
Figure 1.

(a) Left cortical mesh model, seen from the lateral view. The black dotted line illustrates the cutting plane applied to visualize the superior temporal plane. At the caudal end of the Sylvian fissure, both the posterior ascending and descending rami are visible, overlaid in green. (b) The result of the aforementioned cutting operation is shown, seen from above, with Heschl's gyrus (red), the planum temporale (blue), and the posterior rami (green) labeled. The red dotted line shows our criterion for the anterior limit of Heschl's gyrus, and is the plane of the coronal section represented in c. (c) Coronal section through the same brain (left hemisphere depicted on the right side), the most anterior section in which the planum temporale (in blue) can be seen.
Any additional gyri of Heschl (posterior to Heschl's sulcus) were labeled as H2; no participant in our cohort presented more than one additional Heschl's gyrus. Consistent with Pfeifer's criterion [Pfeifer, 1936] and with cytoarchitectonic studies [Rademacher et al., 1993, 2001], we considered H2 to be part of the PT. The presence of an additional Heschl's gyrus (H2) was identified by its medial origin in the retroinsular region in axial slices (full posterior duplication). However, when an intermediate sulcus (or sulcus of Beck) split Heschl's gyrus into a posterior and an anterior circumvolution, but without reaching the medial retroinsular region (common‐stem duplication), the posterior circumvolution was counted as part of the first Heschl's gyrus (H1) and not of PT, in accordance with myelogenetic and cytoarchitectonic work on these regions [Galaburda and Sanides, 1980; Pfeifer 1920, 1936]. These configurations are depicted in Figure 2. As distinct labels were used to mark H2 and PT, we were also able to analyse the asymmetry of PT without the inclusion of H2 (PT‐H2).
Figure 2.
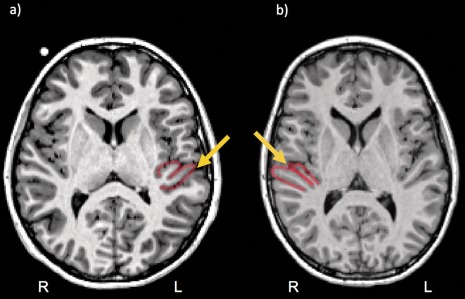
Example of (a) a common‐stem duplication and (b) a full posterior duplication. The head of the yellow arrow indicates Heschl's sulcus.
As aforementioned, Heschl's sulcus was considered as the anterior border of PT. For the definition of the posterior border, a variety of strategies have been developed in the past. Here, we established a number of simple procedural rules for defining the posterior limit of PT, as follows:
On coronal and sagittal views, the point at which temporal cortex merges with parietal cortex, either medially or laterally (see Fig. 3a). At that point, the PT is the narrowest, and any posterior increase indicates the appearance of an irrelevant parietal sulcus related to the supramarginal gyrus.
On coronal views, the point at which a change in slope of the continuous plane characterizing the planum is seen (i.e., from a plane, right behind H1, either horizontal or slightly inclined toward the midline of the brain, to one inclined toward the lateral part—see Fig. 3b). Together with (1) above, this change in orientation indicates the intrusion of an irrelevant parietal sulcus.
Figure 3.
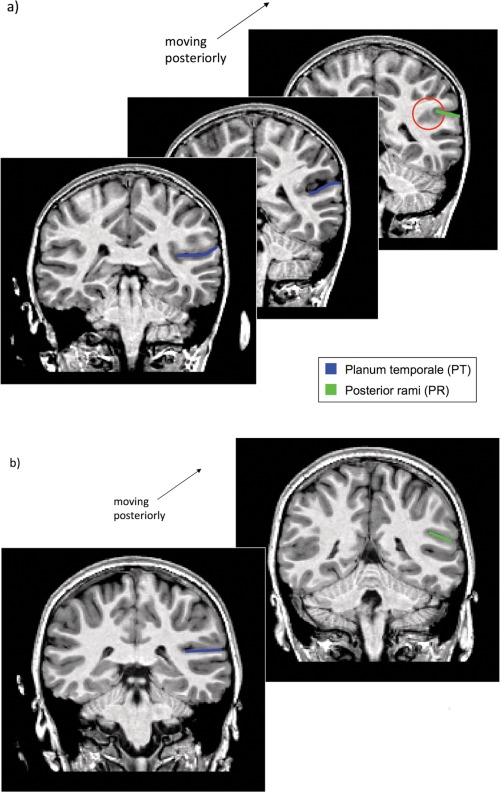
(a) Series of coronal sections with the PT marked in blue. The red circle shows the fusion between temporal and parietal lobes, which determines the posterior limit of the PT. (b) Coronal sections. Left, the PT is marked in blue. Right, a change in slope of the continuous plane characterizing the planum is seen, thus determining its posterior limit and the beginning of the posterior ramus.
Whenever one of these criteria was met, the rostrally preceding coronal section was considered as the last one in which the PT should be marked.
Finally, any further territory on the floor of the Sylvian fissure posterior to that limit, including any ascending and descending posterior rami, was labeled as posterior rami (PR). This allowed us to evaluate the asymmetry of this region, as well as of the whole PT+PR territory [as in Robichon et al., 2000; Steinmetz et al., 1990] or PT‐H2+PR [as in Green et al., 1999; Hynd et al., 1990; Larsen et al., 1990; Semrud‐Clikeman et al., 1991].
This approach offers a three‐dimensional (3D) adaptation of the knife‐cut method, without the potential issues related to the angle of anatomical dissection or of photographic plane, which can present serious drawbacks in the case of curved planes. Three‐dimensional measurements have also been shown to provide surface area estimates that are less influenced by differences in angulation when compared to the widely applied quasi‐3D estimations, where length of the tracing in the sagittal or coronal plane is multiplied by slice thickness [Loftus et al., 1993]. Moreover, the application of our criteria for the posterior limit of the PT does not require the sometimes troublesome classification of the configuration of the Sylvian fissure that is necessary when the definition relies on the bifurcation of an ascending and, when present, a descending branch [as schematically exemplified by Westbury et al., 1999].
Thus, in accordance with previous work [Galaburda et al., 1987; Honeycutt et al., 2000; Kulynych et al., 1993; Loftus et al., 1993; Steinmetz et al., 1990] we believe that our criteria provide a relatively simple and systematic approach to the complex question of establishing a posterior limit for the PT.
Estimation of Morphometric Measures and Asymmetry Indices
For each participant, the surface area of left and right hemisphere regions was estimated as the sum of the surface area of each triangular unit in the corresponding mesh.
Additionally, Freesurfer software was applied [Dale et al., 1999] to get an estimation of cortical thickness for each region of interest. After qualitative and quantitative evaluation, five participants had to be excluded from this analysis because of errors in Freesurfer segmentation procedure (such as skull stripping failures, inclusion of dura or of blood vessels into the pial surface). For the remaining participants, the cortical thickness for each region of interest was calculated as the mean distance between the pial and the white cortical surface meshes.
For surface area estimates of each labeled region, we also computed asymmetry indices, as follows: (right − left)/0.5 (right + left).
Statistical Analyses
Statistical analyses were conducted in SPSS (version 8, SPSS, Chicago IL). Potential demographic differences between dyslexic participants and controls were tested through independent samples t‐tests, chi‐square, or Fisher's exact tests.
Analyses of covariance were first applied to behavioral measures and to global hemispheric measurements, with diagnosis, gender and sequence as between‐subject factors, and age as covariate.
The main goal of the study was to evaluate PT surface area asymmetry differences between groups. For this purpose, a mixed analysis of covariance was run, with hemisphere as within‐subject factor, diagnosis, gender and sequence as between‐subject factors, and age and mean hemispheric surface as covariates. Significant interactions were further investigated through post hoc pair‐wise comparisons, applying Bonferroni correction. This main analysis was followed by a number of exploratory analyses to better characterize the patterns observed and the factors underlying them.
Regarding asymmetry indices, one‐sample t‐tests against zero were conducted to test for significant asymmetry in each group; between‐participant analyses of covariance with the factors and covariates aforementioned (except hemisphere) were applied to test for differences in asymmetry indices between groups.
To better characterize the different patterns of PT surface area asymmetry found in our sample, we divided participants according to their PT asymmetry index value (i.e., as in Galaburda et al., 1987: leftward asymmetry if index ≤ −0.1, rightward asymmetry if index ≥ 0.1, symmetrical if comprised between −0.1 and 0.1) and we tested differences in frequencies of leftward, symmetrical, and rightward cases between groups, using Fisher's exact test. Additionally, to explore the influence of left and right PT surface areas on asymmetry, a regression analysis was run, with PT asymmetry as a dependent variable and left and right PT surface areas as independent variables.
To be able to compare results with previous studies using different anatomical criteria, additional mixed analyses of covariance were run on the surface area of PT‐H2, H1 and PR as well as on combinations of these (PT+PR and PT‐H2+PR).
Finally, to explore potential differences in cortical thickness asymmetries in our sample, the same mixed analyses of covariance as above were applied to PT, H1, and PR cortical thickness, with the same factors as above and mean hemispheric cortical thickness and age as covariates.
RESULTS
Demographic and Behavioral Results
Control and dyslexic children were matched for age (t = −0.48 P > 0.6), gender (χ2(1, n = 81) = 0.06 P = 0.8), and maternal education (Fisher exact test P > 0.1). Concerning the behavioral measures, as expected significant differences between groups emerged in reading abilities, as well as in verbal IQ, phonological awareness, working memory, and rapid automatized naming. Importantly, control and dyslexic participants did not differ in nonverbal IQ as measured by subtests of Wechsler's WISC III or IV. Results are reported in Table 2.
Additionally, a gender effect was found in reading abilities (reading lag F(1,72) = 4.3 P = 0.04), driven by differences among controls (diagnosis × gender interaction F(1,72) =8.2 P = 0.005), with girls presenting higher scores than boys. However, it should be noted that no difference was found between dyslexic boys and girls in any of the aforementioned behavioral measures.
Cortical Surface Area Results
Significant differences were found for left and right cortical hemispheric surfaces (respectively, F(1,72) =3.8 P = 0.05; F(1,72) =4 P = 0.05), with dyslexic participants presenting smaller global surface areas than controls [mean left hemispheric surface: dyslexic children 885 cm2 (sd 103), controls 944 cm2 (sd 106); right hemispheric surface: dyslexic children 884 cm2 (sd 103), controls 943 cm2 (sd 105)]. This finding is in line with a number of reports measuring brain volume in control and dyslexic participants [Casanova et al., 2004; Eckert et al., 2003; Eckert et al., 2005; Eliez et al., 2000; but see Frye et al., 2010], a measure known to be closely related to surface area both phenotypically and genetically [Winkler et al., 2010]. A gender effect was also observed, with girls showing smaller hemispheric surface areas than boys (left F(1,72) = 24.2 P < 0.001, right F(1,72) = 23.8 P < 0.001). Mean hemispheric surface area was included in all analyses.
The main finding of the mixed analysis of covariance on PT surface area was a significant three‐way interaction between gender, diagnosis, and hemisphere (F(1,71) = 4.2, P = 0.04). Further analyses revealed a diagnosis × hemisphere interaction in boys (F(1,39) = 6.1, P = 0.02), but not in girls (F(1,30) < 1, P > 0.8). As shown in Figure 4, this interaction reflects an opposite asymmetry pattern in dyslexic boys (right PT > left PT, P = 0.03) as compared to control boys (left PT > right PT, P = 0.05). It should be noted that within each hemisphere there were no differences in PT surface area between groups (left, F(1,71)=1.2, P > 0.2; right, F(1,71) = 1.4, P > 0.2), nor any diagnosis × gender interactions (left, F(1,71) = 1, P = 0.3; right, F(1,71) =1.8, P > 0.1).
Figure 4.
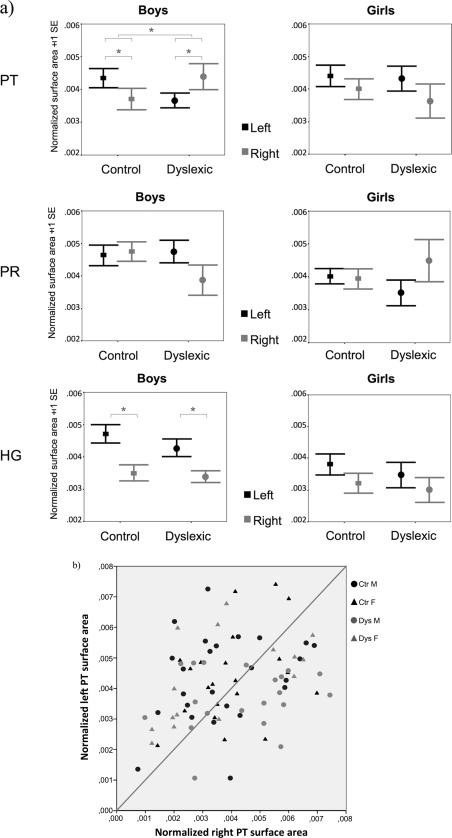
(a) Mean surface areas of the left and right PT, PR, and H1 for control and dyslexic boys and girls. (b) Scatterplot illustrating individual variability for the left and right PT surface areas. Values are normalized for mean hemispheric surface area.
The results of the mixed analyses of covariance for H1, PT, PT‐H2, and PR surface area are presented in Table 3.
Table 3.
Results of the omnibus analyses of surface area in each region
| H1 | PT | PT‐H2 | PR | |
|---|---|---|---|---|
| Hemi | n.s. | n.s. | n.s. | n.s. |
| Diagnosis*Hemi | n.s. | n.s. | n.s. | n.s. |
| Gender*Hemi | F (1,71) = 3.9, P = 0.05 | n.s. | n.s. | n.s. |
| Diagnosis*Gender*Hemi | n.s. | F (1,71) = 4.2, P = 0.04 | n.s. | F (1,71) = 3.4 P = 0.07 |
| Boys Diagnosis*Hemi | F (1,39) = 6.1, P = 0.02 | n.s. | F (1,39)=2.4, P = 0.1 | |
| Girls Diagnosis*Hemi | n.s. | n.s. | n.s. | |
| Controls Gender*Hemi | n.s. | n.s. | n.s. | |
| Dyslexics Gender*Hemi | F (1,29) = 5.2, P = 0.03 | n.s. | F (1,29) = 2.2 P = 0.15 |
Hemi stands for hemisphere, n.s. for non significant.
When considering different subdivisions of the auditory regions (PT‐H2, PT+PR, and PT‐H2+PR), no significant result emerged. This underlines in particular the role played by H2 in determining the aforementioned PT surface area asymmetry results.
Cortical Surface Area Results: Asymmetry Indices
Congruently with most previous literature, we also computed asymmetry indices. We used t‐tests against zero to assess the significance of asymmetry for each labeled region. These tests revealed significant leftward PT asymmetry (t (45)=‐2.2 P = 0.03) and H1 leftward asymmetry (t (45)=−3.6 P = 0.001) in controls, while only H1 leftward asymmetry (t (34)=−2.6, P = 0.01) was significant in dyslexic children.
Between‐subject analyses of asymmetry indices confirmed the aforementioned within‐participants results for PT. No effect of diagnosis was observed (F (1,71)=1.8, P > 0.1), but a significant diagnosis × gender interaction was found (F (1,71) = 4.6, P = 0.04), while the same interaction was not significant for PT‐H2 (F (1,71) = 2.9, P = 0.09). Post hoc analyses revealed a significant difference in PT asymmetry indices between control and dyslexic boys (P = 0.01), but not between control and dyslexic girls (P > 0.6). Moreover, a significant diagnosis × gender interaction was found for PR (F (1,71) = 5.3, P = 0.02), due to differences between dyslexic boys and girls (P = 0.03), that were not observed in controls (P > 0.2).
To better characterize the distribution of PT asymmetry patterns across participants, we divided participants according to their PT asymmetry index value. Fisher's exact test revealed a significantly greater proportion of rightward asymmetrical cases in dyslexic boys compared to control boys (P = 0.05, two‐tailed), while no difference existed between dyslexic and control girls (P > 0.9, two‐tailed). Histograms illustrating the frequencies of each asymmetry category in control and dyslexic boys and girls are presented in Figure 5.
Figure 5.

Histograms illustrating the frequency of planum temporale leftward, symmetrical and rightward asymmetrical cases in each group.
Contribution of Right and Left PT Surface Area to PT Asymmetry
Finally, to determine whether variations in PT asymmetry depended on variations in left or right PT surface area or in both, we ran a regression analysis on all participants, in which these two independent variables were entered into the equation simultaneously. Both left and right PT surface areas were found to significantly predict PT asymmetry (R 2 = 0.9), with right PT presenting a stronger weight than left PT (standardized β = 0.96, P < 0.001; standardized β =−0.67, P < 0.001, respectively). Thus, both surfaces contributed to explaining variance in PT asymmetry, although the right PT surface area did so to a greater extent than the left.
Cortical Thickness Results
We then ran the same set of analyses on cortical thickness as on surface area. No significant difference between control and dyslexic children was observed for left and right mean hemispheric cortical thickness (respectively, F (1,69) = 3.6 P > 0.05; F (1,69) = 3.7 P > 0.05), coherently with the results of Frye et al. [2010].
The omnibus analyses for H1, PT, and PR cortical thickness did not reveal any significant difference between groups nor any significant interaction.
Common‐Stem versus Full Posterior Duplication Results
As we have mentioned in the Methods section, multiple configurations exist for Heschl's gyri, which can be simple (H1 only), or exhibit a common‐stem (variant of H1 only) or full posterior duplication (H1 plus H2). For each subject, through careful examination of the brain images in the three planes, we extracted the number of Heschl's gyri for left and right hemispheres. Given the role played by H2 in determining our surface area asymmetry results in dyslexic versus control boys, we ran a Fisher exact test on these two groups, comparing the number of H1 and H1+H2 configurations. A significant difference between groups was found on the right hemisphere (P = 0.03, two‐tailed), with dyslexic boys showing more H1+H2 (4/20) than controls (0/25), while this was not the case on the left hemisphere (P = 0.07, two‐tailed: dyslexic boys 0/20, control boys 1/25). No difference emerged for girls (left: P > 0.9, two‐tailed, right: P > 0.5, two‐tailed). Finally, the number of common‐stem duplications was not significantly different between control and dyslexic children, boys and girls (dyslexic versus control boys, left hemisphere, P = 0.3, two‐tailed, right hemisphere, P > 0.9, two‐tailed; dyslexic versus control girls, left hemisphere, P > 0.6, two‐tailed, right hemisphere, P > 0.4, two‐tailed).
Correlations with Behavioral Measures
Finally, no correlation between surface area nor cortical thickness asymmetry indices and behavioral measures was identified for the whole group, or within the dyslexic or control groups.
DISCUSSION
In this study, we measured the cortical surface area and cortical thickness of three territories in the Sylvian fissure (Heschl's gyri, PT, and posterior rami) in a population of control and dyslexic children, and we analyzed the asymmetry of both measures in these regions. Results showed that, whereas control participants exhibited the expected surface area leftward asymmetry of the PT, dyslexic boys did not. No differences across groups were observed when considering the whole region extending between Heschl's sulcus and the closure of the Sylvian fissure (PT+PR) posteriorly, nor when considering the PT without the inclusion of an additional Heschl's gyrus when present (PT‐H2 or PT‐H2+PR). Interestingly, in both groups of children, dyslexic and controls, the analysis of asymmetry indices revealed a leftward surface area asymmetry of the first Heschl's gyrus, consistent with previous studies [Chance et al., 2006; Meyer et al., [Link]].
The finding of an altered pattern of PT asymmetry in dyslexia is in line with early post mortem evidence in dyslexic men (N = 4, Galaburda et al., 1985). Our findings do not align, however, with one post mortem report on three female cases of developmental dyslexia, in which symmetry of the PT was also described [Humphreys et al., 1990]. It must be noted that phenotypic heterogeneity existed in the latter post mortem study (one patient had severe depression, another one delayed language acquisition and suspicious for ADHD), which might be playing a role in this discrepancy. It remains that given the small samples tested in the post mortem experiments, further investigations of the same anatomical aspects in vivo are important.
As aforementioned, the MRI literature on the PT surface area in dyslexia has been inconsistent, with some studies reporting differences between control and dyslexic participants [Hynd et al., 1990; Larsen et al., 1990; Semrud‐Clikeman et al., 1991], and many failing to do so [Best and Demb, 1999; Eckert et al., 2003; Green et al., 1999; Heiervang et al., 2000; Hugdahl et al., 1998, 2003; Leonard et al., 1993, 2001; Rumsey et al., 1997; Robichon et al., 2000; Schulz et al. 1994]. A number of factors potentially relevant for explaining these inconsistencies will be outlined below.
First, the inclusion criteria used to select dyslexic participants, as well as the matching with control participants has not always been ideal. Cases of comorbidities with ADHD were present in some studies [Best and Demb, 1999; Foster et al., 2002; Kibby et al., 2004; Sanchez Bloom et al., 2013]. Despite the high comorbidity with SLI in the dyslexic population [about 50%, McArthur et al., 2000], exclusion of participants affected by this disorder is rarely mentioned (notable exceptions are the work of Eckert et al., 2003 and of Leonard et al., 2002, 2006). Furthermore, in some studies, group differences existed in performance IQ [Heiervang et al., 2000; Hynd et al., 1990; Semrud‐Clikeman et al., 1991;], age [Hynd et al., 1990], gender [Foster et al., 2002; Leonard et al., 1993], or handedness [Hynd et al., 1990; Larsen et al., 1990], which were rarely taken into account in the analyses of the data. Finally, in the light of the effect size calculated for the difference in PT surface area asymmetry in our sample of 25 control and 20 dyslexic right‐handed boys (Cohen's f = 0.3, observed power = 0.5) and if setting α to 0.05, 45 control and 45 dyslexic boys would be needed to reach a power of 0.8, a number of participants that was seen in none of the previous reports.
Second, evidence from previous work on control participants together with our results underline the crucial role played by anatomical criteria. In the general population, the leftward asymmetry in surface area observed for the PT appears to be partly counterbalanced by a mild rightward asymmetry of the posterior branches of the Sylvian fissure (PR), resulting in a much decreased or even absent asymmetry pattern in the whole PT+PR region [Honeycutt et al., 2000; Kulynych et al., 1993; Steinmetz et al., 1990]. Thus, evaluating the asymmetry of the whole region is likely to obscure asymmetries present in subregions. Additionally, our results suggest that the anterior limit of the PT is also of importance, that is, including or not any additional Heschl's gyri. In our sample, the occasional presence of a duplicated Heschl's gyrus (H2) influences the size of the asymmetry difference observed between control and dyslexic boys. We argue that H2 is part of the PT and should be included in measurements of the PT, whereas a Heschl's gyrus split by a sulcus that does not reach all the way to the medial root of the gyrus should not. This is because it has been argued that H2 does not contain primary auditory cortex, whereas both crowns of a split H1 do [Galaburda and Sanides, 1980; Pfeifer, 1920, 1936]. Overall, we think that it is not possible to compare the results of studies that used different criteria (for the anatomical criteria applied in each study, see Table 1). In our experiment, we decided to label the various subregions of the posterior Sylvian fissure so as to be able to pinpoint the origin of potential asymmetry differences between groups and to allow comparisons with previous reports. Clearly, analyses of the underlying cytoarchitecture would be most informative in this context.
Finally, previous reports have applied different area reconstruction techniques. As already mentioned, many of the authors have relied entirely on sagittal sections (1 to 7.5 mm thick), often measuring the length of the planum on the limited number of slices where it can be incontrovertibly identified [Best and Demb, 1999; Eckert et al., 2003; Foster et al., 2002; Hynd et al., 1990; Leonard et al., 1993, 2001, 2002, 2006; Semrud‐Clikeman et al., 1991]. However, this approach leaves out a substantial portion of the lateral extension of the PT and is, therefore, less accurate than measurements based on surface renderings [Kulynych et al., 1993; Loftus et al., 1993]. Therefore, it is very plausible that several of the aforementioned factors contribute to the inconsistencies found in past MRI work on asymmetries in dyslexia.
A few additional points appear to be of importance. We have outlined above the importance of H2 when comparing PT asymmetry between control and dyslexic boys. We also found the frequency of full posterior duplications (H1+H2) in the right hemisphere to be greater in dyslexic than in control boys, whereas this was not the case for common‐stem duplications. A similar observation (i.e., of a greater frequency of H2 gyri) has been reported before in individuals with dyslexia, although not specifically in the right hemisphere [Leonard et al., 1993, 2001]. A few studies have shown that the morphology of Heschl's gyri is highly variable in the general population [Leonard et al., 1998; Marie et al., [Link]; Penhune et al., 1996]. Additionally, it has been suggested that duplications in the left hemisphere might be related to better skills in phonetic learning and in the auditory processing of speech [Golestani et al., 2007, 2011]. In the sample of male dyslexic participants considered in this study, duplications were more frequent in the right hemisphere. Replicating this observation and uncovering whether this neuroanatomical trait has functional implications for dyslexia would be of interest for future research.
Moreover, by considering asymmetries in both surface area and cortical thickness, we found that differences between groups were limited to the former measure, with no significant result emerging for the latter. This is not very surprising given that the two measures are essentially unrelated genetically [Panizzon et al., 2009]. A potential limitation of our thickness analyses is having extracted average values for each labeled region. The work of Qiu et al. [2008] has shown that cortical thinning characterizes only the anterior part of the left PT in schizophrenic individuals compared to controls, while the opposite pattern is seen on the posterior portion. Thus, applying finer‐grained, vertex‐wise analyses of cortical thickness in the PT region might reveal interesting information.
Finally, it is important to stress that gender‐by‐diagnosis interactions have seldom been investigated in the context of brain asymmetries in developmental dyslexia. Only two studies on PT asymmetry have tested diagnosis‐by‐gender interactions: Schultz et al. [1994] uncovered significant effects of gender and diagnosis‐by‐gender interactions on the right PT+PR surface area, but not on its asymmetry, consistent with our own results. Moreover, the authors came to the conclusion that gender (as well as age and total brain size) are relevant factors that should be taken into account in studies of brain morphology. Eckert et al. [2003] also tested diagnosis‐by‐gender interactions on PT asymmetry indices, but did not report any significant results. As outlined above, it is possible that viewing and tracing the anatomical borders on sagittal sections only and measuring length on a limited number of sections (between Talairach x = 46 and 56) has influenced these results.
Nevertheless, in the general population, gender differences in PT surface area asymmetry [Good et al., 2001; Kulynych et al., 1994; Witelson and Kigar, 1992] and Heschl's gyrus surface area asymmetry [Kovalev et al., 2003] have been repeatedly suggested, pointing toward more marked leftward asymmetries in males. Recent evidence supports the view that PT differences between sexes in asymmetry might emerge very early in the course of development, even prenatally [Li et al., 2014] and that they might be influenced by fetal environmental factors such as testosterone [Lombardo et al., 2012]. In this study, we observed a numerical trend toward greater PT asymmetry in boys, but we may not have had enough statistical power to reliably observe such differences [Chiarello et al., 2009]. Gender differences have also been reported microscopically, with greater cell packing density in females bilaterally [Witelson et al., 1995] and reduced microstructural asymmetry [Chance et al., 2006].
While evidence for macrostructural asymmetries in the primary auditory and language areas is broad, the picture regarding the underlying microstructural correlates is less clear. Nevertheless, a number of studies have highlighted that asymmetry in the posterior language regions is present at different levels. At the cellular level, it has been shown that greater numbers of large pyramidal cells can be found in these areas in the left hemisphere compared to the right [Hutsler, 2003]. Additionally, the work of Buxhoeveden et al. [2001], following some early studies by Seldon [1981], suggested that microcolumns, which are thought to be the potential anatomical correlates of the smallest information processing units in the cortex, present greater width and distance between them in these same regions in the left hemisphere compared to the right. A consequence of these disparities is that the connectivity pattern of dendrites and the distribution of afferent input might differ between hemispheres, with potentially less redundant and finer processing on the left [Hutsler and Galuske, 2003]. Moreover, post mortem analyses have revealed asymmetries in the extent of cytoarchitectonic area Tpt, matching macrostructural asymmetries [Galaburda et al., 1978]. Finally, short and long‐range connectivities from these regions differ between hemispheres, with for instance asymmetry of fibers in the arcuate fasciculus [Takao et al., 2011]. The aforementioned factors (and especially microcolumn spacing and Tpt extent) could influence the PT surface area observed macroscopically. Additionally, the number and length of connections could also exert some influence on the sulcal and gyral configuration of these areas [Van Essen et al., 1997], again impacting what is measured as PT territory in brain images.
One might hypothesize that asymmetry at some or all of the aforementioned microstructural levels might be disrupted in dyslexic males. Interestingly, indication of alterations in microcolumnar organization in the posterior Sylvian fissure of one dyslexic man exists, with increased columnar width and cell spacing bilaterally [Casanova et al., 2002], which might be related to the PT symmetry observed in the same patient [Galaburda et al., 1985]. Moreover, it is worth mentioning that post mortem work revealed cortical anomalies in the brains of dyslexic individuals in a number of areas, including the posterior Sylvian fissure. The type of anomalies observed did not entirely coincide when examining male [Galaburda et al., 1985] and female [Humphreys et al., 1990] dyslexic individuals, as a greater number of myelinated glial scars characterized the brains of the latter, as opposed to ectopias in the former. Thus, it is possible that different kinds of cortical anomalies in the brains of males and females with dyslexia might be at the origin of different patterns of PT asymmetry. Further investigations of the potential microanatomical characteristics of the PT in dyslexic individuals are needed to fully understand the underpinnings of the asymmetry differences reported in the present experiments.
A final question regards the functional implications of the described anatomical abnormalities. If PT surface area reflects microscopic structure and connectivity at some level, it is conceivable that its alteration would impact local microcircuitry, thus potentially having local as well as broader functional consequences. With the behavioral measures assessed in this study, we were unable to uncover significant correlations between asymmetry and phonological or reading abilities. However, a recent study uncovered a positive correlation between left, but not right, PT surface area and performance in a phonemic categorization task, in a group of musicians [Elmer et al., 2013]. Recent MEG and fMRI‐EEG work indicated cortical oscillations abnormalities in the dyslexic population, in particular a failure to show left PT specialization for phoneme‐level modulation frequencies [Lehongre et al., 2011, 2013], a deficit that could well be a consequence of abnormal interactions within and across cortical columns [Giraud and Poeppel, 2012].
CONCLUSIONS
To conclude, by studying the morphometry of a few regions in the Sylvian fissure, we have confirmed abnormal surface area asymmetry of the PT in dyslexic boys, but not in girls. These results also confirm that gender is an essential factor to be taken into account in studies of developmental dyslexia [Altarelli et al., 2013; Evans et al., 2014]. Although based on a relatively large group of participants compared to previous studies, replication of these results will be needed, given the wealth of previous contradictory findings. To this end, we have stressed the crucial importance of both anatomical criteria and tracing strategies applied, together with the fine selection and matching of patients and control participants. Finally, to test the specific hypotheses formulated here and deepen our understanding of developmental dyslexia, further cytoarchitectonic work or finer‐grained MR imaging would be of great interest.
ACKNOWLEDGMENTS
We thank Nadège Villiermet, Camille Chabernaud, Laure Bricout and Stéphanie Iannuzzi for their contribution to study design and data collection, and Antoine Collomb‐Clerc for his help with image preprocessing. We also thank the clinical and technical staff at Bicêtre Hospital and at Neurospin centre for their contribution to children testing in a welcoming environment, and all children and families for their participation.
REFERENCES
- Altarelli I, Monzalvo K, Iannuzzi S, Fluss J, Billard C, Ramus F, Dehaene‐Lambertz G (2013): A functionally guided approach to the morphometry of occipito‐temporal regions in developmental dyslexia: Evidence for differential effects in boys and girls. J Neurosci 33:11296–11301. [DOI] [PMC free article] [PubMed] [Google Scholar]
- Barta PE, Pearlson GD, Brill LB 2nd, Royall R, McGilchrist IK, Pulver AE, Powers RE, Casanova MF, Tien AY, Frangou S, Petty RG (1997): Planum temporale asymmetry reversal in schizophrenia: Replication and relationship to gray matter abnormalities. Am J Psychiatry 154:661–667. [DOI] [PubMed] [Google Scholar]
- Best M, Demb JB (1999): Normal planum temporale asymmetry in dyslexics with a magnocellular pathway deficit. Neuroreport 10:607–612. [DOI] [PubMed] [Google Scholar]
- Buxhoeveden D, Switala A, Litaker M, Roy E, Casanova MF (2001): Lateralization of minicolumns in human planum temporale is absent in nonhuman primate cortex. Brain Behav Evol 57:349–358. [DOI] [PubMed] [Google Scholar]
- Casanova MF, Buxhoeveden DP, Cohen M, Switala AE, Roy EL (2002): Minicolumnar pathology in dyslexia. Ann Neurol 52:108–110. [DOI] [PubMed] [Google Scholar]
- Casanova MF, Araque J, Giedd J, Rumsey JM (2004): Reduced brain size and gyrification in the brains of dyslexic patients. J Child Neurol 19:275–281. [DOI] [PubMed] [Google Scholar]
- Chance SA, Casanova MF, Switala AE, Crow TJ (2006): Minicolumnar structure in Heschl's gyrus and planum temporale: Asymmetries in relation to sex and callosal fiber number. Neuroscience 143:1041–1050. [DOI] [PubMed] [Google Scholar]
- Chi JG, Dooling EC, Gilles FH (1977): Left‐right asymmetries of the temporal speech areas of the human fetus. Arch Neurol 34:346–348. [DOI] [PubMed] [Google Scholar]
- Chiarello C, Kacinik N, Manowitz B, Otto R, Leonard C (2004): Cerebral asymmetries for language: Evidence for structural‐behavioral correlations. Neuropsychology 18:219–231. [DOI] [PubMed] [Google Scholar]
- Chiarello C, Welcome S, Halderman L, Towler S, Julagay J, Otto R, Leonard C (2009): A large‐scale investigation of lateralization in cortical anatomy and word reading: Are there sex differences? Neuropsychology 23:210–222. [DOI] [PMC free article] [PubMed] [Google Scholar]
- Dale AM, Fischl B, Sereno M (1999): Cortical surface‐based analysis: I. Segmentation and surface reconstruction. Neuroimage 9:179–194. [DOI] [PubMed] [Google Scholar]
- Dorsaint‐Pierre R, Penhune VB, Watkins KE, Neelin P, Lerch JP, Bouffard M, Zatorre RJ (2006): Asymmetries of the planum temporale and Heschl's gyrus: Relationship to language lateralization. Brain 129(Pt 5):1164–1176. [DOI] [PubMed] [Google Scholar]
- Dos Santos Sequeira S, Woerner W, Walter C, Kreuder F, Lueken U, Westerhausen R, Wittling RA, Schweiger E, Wittling W (2006): Handedness, dichotic‐listening ear advantage, and gender effects on planum temporale asymmetry—A volumetric investigation using structural magnetic resonance imaging. Neuropsychologia 44:622–636. [DOI] [PubMed] [Google Scholar]
- Eckert MA, Leonard CM, Richards TL, Aylward EH, Thomson J, Berninger VW (2003): Anatomical correlates of dyslexia: Frontal and cerebellar findings. Brain 126(Pt 2):482–494. [DOI] [PubMed] [Google Scholar]
- Eckert MA, Leonard CM, Wilke M, Eckert M, Richards T, Richards A, Berninger V (2005): Anatomical signatures of dyslexia in children: Unique information from manual and voxel based morphometry brain measures. Cortex 41:304–315. [DOI] [PubMed] [Google Scholar]
- Eckert MA, Leonard CM, Possing ET, Binder JR (2006): Uncoupled leftward asymmetries for planum morphology and functional language processing. Brain Lang 98:102–111. [DOI] [PMC free article] [PubMed] [Google Scholar]
- Eliez S, Rumsey JM, Giedd JN, Schmitt JE, Patwardhan AJ, Reiss AL (2000): Morphological alteration of temporal lobe gray matter in dyslexia: An MRI study. J Child Psychol Psychiatry 41:637–644. [DOI] [PubMed] [Google Scholar]
- Elmer S, Hänggi J, Meyer M, Jäncke L (2013): Increased cortical surface area of the left planum temporale in musicians facilitates the categorization of phonetic and temporal speech sounds. Cortex 49:2812–2821. [DOI] [PubMed] [Google Scholar]
- Evans TM, Flowers DL, Napoliello EM, Eden GF (2014): Sex‐specific gray matter volume differences in females with developmental dyslexia. Brain Struct Funct 219:1041–1054. [DOI] [PMC free article] [PubMed] [Google Scholar]
- Foster LM, Hynd GW, Morgan AE, Hugdahl K (2002): Planum temporale asymmetry and ear advantage in dichotic listening in Developmental Dyslexia and Attention‐Deficit/Hyperactivity Disorder (ADHD). JINS 8:22–36. [PubMed] [Google Scholar]
- Foundas AL, Leonard CM, Gilmore R, Fennell E, Heilman KM (1994): Planum temporale asymmetry and language dominance. Neuropsychologia 32:1225–1231. [DOI] [PubMed] [Google Scholar]
- Foundas AL, Leonard CM, Hanna‐Pladdy B (2002): Variability in the anatomy of the planum temporale and posterior ascending ramus: Do right and left handers differ? Brain Lang 83:403–424. [DOI] [PubMed] [Google Scholar]
- Frye RE, Liederman J, Malmberg B, McLean J, Strickland D, Beauchamp MS (2010): Surface area accounts for the relation of gray matter volume to reading‐related skills and history of dyslexia. Cereb Cortex 20:2625–2635. [DOI] [PMC free article] [PubMed] [Google Scholar]
- Galaburda AM (1993): The planum temporale. Arch Neurol 50:457. [DOI] [PubMed] [Google Scholar]
- Galaburda A, Sanides F (1980): Cytoarchitectonic organization of the human auditory cortex. J Comp Neurol 190:597–610. [DOI] [PubMed] [Google Scholar]
- Galaburda AM, Sanides F, Geschwind N (1978): Human brain: Cytoarchitectonic left‐right asymmetries in the temporal speech region. Arch Neurol 35:812–817. [DOI] [PubMed] [Google Scholar]
- Galaburda AM, Sherman GF, Rosen GD, Aboitiz F, Geschwind N (1985): Developmental dyslexia: Four consecutive patients with cortical anomalies. Ann Neurol 18:222–233. [DOI] [PubMed] [Google Scholar]
- Galaburda AM, Corsiglia J, Rosen GD, Sherman GF (1987): Planum temporale asymmetry, reappraisal since Geschwind and Levitsky. Neuropsychologia 25:853–868. [Google Scholar]
- Geschwind N, Levitsky W (1968): Human brain: Left‐right asymmetries in temporal speech regions. Science 161:186–187. [DOI] [PubMed] [Google Scholar]
- Giraud AL, Poeppel D (2012): Cortical oscillations and speech processing: Emerging computational principles and operations. Nat Neurosci 15:511–517. [DOI] [PMC free article] [PubMed] [Google Scholar]
- Golestani N, Molko N, Dehaene S, LeBihan D, Pallier C (2007): Brain structure predicts the learning of foreign speech sounds. Cereb Cortex 17:575–582. [DOI] [PubMed] [Google Scholar]
- Golestani N, Price CJ, Scott SK (2011): Born with an ear for dialects? Structural plasticity in the expert phonetician brain. J Neurosci 31:4213–4220. [DOI] [PMC free article] [PubMed] [Google Scholar]
- Good CD, Johnsrude I, Ashburner J, Henson RN, Friston KJ, Frackowiak RS (2001): Cerebral asymmetry and the effects of sex and handedness on brain structure: A voxel‐based morphometric analysis of 465 normal adult human brains. Neuroimage 14:685–700. [DOI] [PubMed] [Google Scholar]
- Green R, Hutsler J, Loftus W, Tramo M, Thomas C, Silberfarb A, Nordgren R, Gazzaniga MS (1999): The caudal infrasylvian surface in dyslexia: Novel magnetic resonance imaging‐based findings. Neurology 53:974–981. [DOI] [PubMed] [Google Scholar]
- Griffiths TD, Warren JD (2002): The planum temporale as a computational hub. Trends Neurosci 25:348–353. [DOI] [PubMed] [Google Scholar]
- Heiervang E, Hugdahl K, Steinmetz H, Inge Smievoll A, Stevenson J, Lund A, Ersland L, Lundervold A (2000): Planum temporale, planum parietale and dichotic listening in dyslexia. Neuropsychologia 38:1704–1713. [DOI] [PubMed] [Google Scholar]
- Honeycutt NA, Musick A, Barta PE, Pearlson GD (2000): Measurement of the planum temporale (PT) on magnetic resonance imaging scans. Psychiatry Res 98:103–116. [DOI] [PubMed] [Google Scholar]
- Hugdahl K, Heiervang E, Nordby H, Smievoll AI, Steinmetz H, Stevenson J, Lund A (1998): Central auditory processing, MRI morphometry and brain laterality: Applications to dyslexia. Scand Audiol Suppl 49:26–34. [DOI] [PubMed] [Google Scholar]
- Hugdahl K, Heiervang E, Ersland L, Lundervold A, Steinmetz H, Smievoll AI (2003): Significant relation between MR measures of planum temporale area and dichotic processing of syllables in dyslexic children. Neuropsychologia 41:666–675. [DOI] [PubMed] [Google Scholar]
- Humphreys P, Kaufmann WE, Galaburda AM (1990): Developmental dyslexia in women: Neuropathological findings in three patients. Ann Neurol 28:727–738. [DOI] [PubMed] [Google Scholar]
- Hutsler JJ (2003): The specialized structure of human language cortex: Pyramidal cell size asymmetries within auditory and language‐associated regions of the temporal lobes. Brain Lang 86:226–242. [DOI] [PubMed] [Google Scholar]
- Hutsler JJ, Galuske RA (2003): Hemispheric asymmetries in cerebral cortical networks. Trends Neurosci 26:429–435. [DOI] [PubMed] [Google Scholar]
- Hynd GW, Semrud‐Clikeman M, Lorys AR, Novey ES, Eliopulos D (1990): Brain morphology in developmental dyslexia and attention deficit disorder/hyperactivity. Arch Neurol 47:919–926. [DOI] [PubMed] [Google Scholar]
- Jäncke L, Steinmetz H (1993): Auditory lateralization and planum temporale asymmetry. Neuroreport 5:169–172. [DOI] [PubMed] [Google Scholar]
- Keller SS, Roberts N, Garcia‐Finana M, Mohammadi S, Ringelstein EB, Knecht S (2011): Can the language‐dominant hemisphere be predicted by brain anatomy? J Cogn Neurosci 23:2013–2029. [DOI] [PubMed] [Google Scholar]
- Kibby MY, Kroese JM, Morgan AE, Hiemenz JR, Cohen MJ, Hynd GW (2004): The relationship between perisylvian morphology and verbal short‐term memory functioning in children with neurodevelopmental disorders. Brain Lang 89:122–135. [DOI] [PubMed] [Google Scholar]
- Kovalev VA, Kruggel F, von Cramon DY (2003): Gender and age effects in structural brain asymmetry as measured by MRI texture analysis. Neuroimage 19:895–905. [DOI] [PubMed] [Google Scholar]
- Kulynych JJ, Vladar K, Jones DW, Weinberger DR (1993): Three‐dimensional surface rendering in MRI morphometry: A study of the planum temporale. J Comput Assist Tomogr 17:529–535. [DOI] [PubMed] [Google Scholar]
- Kulynych JJ, Vladar K, Jones D, Weinberger D (1994): Gender differences in the normal lateralization of the supratemporal cortex: MRI surface‐rendering morphometry of Heschl's gyrus and the planum temporale. Cerebral cortex 4:107–118. [DOI] [PubMed] [Google Scholar]
- Larsen JP, Hoien T, Lundberg I, Odegaard H (1990): MRI Evaluation of the size and symmetry of the planum temporale in adolescents with developmental dyslexia. Brain Lang 39:289–301. [DOI] [PubMed] [Google Scholar]
- Le Troter A, Auzias G, Coulon O (2012): Automatic sulcal line extraction on cortical surfaces using geodesic path density maps. Neuroimage 61:941–949. [DOI] [PubMed] [Google Scholar]
- Lefavrais P (1965): Description, définition et mesure de la dyslexie. Utilisation du test "L'Alouette". Revue de Psychologie Appliquée 15:33–44. [Google Scholar]
- Lehongre K, Ramus F, Villiermet N, Schwartz D, Giraud AL (2011): Altered low‐γ sampling in auditory cortex accounts for the three main facets of dyslexia. Neuron 72:1080–1090. [DOI] [PubMed] [Google Scholar]
- Lehongre K, Morillon B, Giraud AL, Ramus F (2013): Impaired auditory sampling in dyslexia: Further evidence from combined fMRI and EEG. Front Hum Neurosci 7:454. [DOI] [PMC free article] [PubMed] [Google Scholar]
- Leonard CM, Voeller KKS, Lombardino LJ, Morris MK, Hynd GW, Alexander AW, Andersen HG, Garofalakis M, Honeyman JC, Mao J, Agee OF, Staab EV. (1993): Anomalous cerebral structure in dyslexia revealed with magnetic resonance imaging. Arch Neurol 50:461–469. [DOI] [PubMed] [Google Scholar]
- Leonard CM, Puranik C, Kuldau JM, Lombardino LJ (1998): Normal variation in the frequency and location of human auditory cortex landmarks. Heschl's gyrus: Where is it? Cereb Cortex 8:397–406. [DOI] [PubMed] [Google Scholar]
- Leonard CM, Eckert MA, Lombardino LJ, Oakland T, Kranzler J, Mohr CM, King WM, Freeman A (2001): Anatomical risk factors for phonological dyslexia. Cereb Cortex 11:148–157. [DOI] [PubMed] [Google Scholar]
- Leonard CM, Lombardino LJ, Walsh K, Eckert MA, Mockler JL, Rowe LA, Williams S, DeBose CB (2002): Anatomical risk factors that distinguish dyslexia from SLI predict reading skill in normal children. J Commun Disord 35:501–531. [DOI] [PubMed] [Google Scholar]
- Leonard CM, Eckert MA, Given B, Virginia B, Eden G (2006): Individual differences in anatomy predict reading and oral language impairments in children. Brain 129(Pt 12):3329–3342. [DOI] [PubMed] [Google Scholar]
- Li G, Nie J, Wang L, Shi F, Lyall A E, Lin W, Gilmore JH, Shen D (2014): Mapping longitudinal hemispheric structural asymmetries of the human cerebral cortex from birth to 2 years of age. Cereb Cortex 24:1289–1300. [DOI] [PMC free article] [PubMed] [Google Scholar]
- Loftus WC, Tramo MJ, Thomas CE, Green RL, Nordgren RA, Gazzaniga MS (1993): Three‐dimensional quantitative analysis of hemispheric asymmetry in the human superior temporal region. Cereb Cortex 3:348–355. [DOI] [PubMed] [Google Scholar]
- Lombardo MV, Ashwin E, Auyeung B, Chakrabarti B, Taylor K, Hackett G, Bullmore ET, Baron‐Cohen S (2012): Fetal testosterone influences sexually dimorphic gray matter in the human brain. J Neurosci 32:674–680. [DOI] [PMC free article] [PubMed] [Google Scholar]
- Marie D, Jobard G, Crivello F, Perchey G, Petit L, Mellet E, Joliot M, Zago L, Mazoyer B, Tzourio‐Mazoyer N: Descriptive anatomy of Heschl's gyri in 430 healthy volunteers, including 198 left‐handers. Brain Struct Funct, in press. [DOI] [PMC free article] [PubMed] [Google Scholar]
- McArthur GM, Hogben JH, Edwards VT, Heath SM, Mengler ED (2000): On the "specifics" of specific reading disability and specific language impairment. J Child Psychol Psychiatry 41:869–874. [PubMed] [Google Scholar]
- Meyer M, Liem F, Hirsiger S, Jäncke L, Hänggi J: Cortical surface area and cortical thickness demonstrate differential structural asymmetry in auditory‐related areas of the human cortex. Cereb Cortex, in press. [DOI] [PubMed] [Google Scholar]
- Moffat SD, Hampson E, Lee DH (1998): Morphology of the planum temporale and corpus callosum in left handers with evidence of left and right hemisphere speech representation. Brain 121(Pt 12):2369–2379. [DOI] [PubMed] [Google Scholar]
- Monzalvo K, Fluss J, Billard C, Dehaene S, Dehaene‐Lambertz G (2012): Cortical networks for vision and language in dyslexic and normal children of variable socio‐economic status. Neuroimage 61:258–274. [DOI] [PubMed] [Google Scholar]
- Panizzon MS, Fennema‐Notestine C, Eyler LT, Jernigan TL, Prom‐Wormley E, Neale M, Jacobson K, Lyons MJ, Grant MD, Franz CE, Xian H, Tsuang M, Fischl B, Seidman L, Dale A, Kremen WS (2009): Distinct genetic influences on cortical surface area and cortical thickness. Cereb Cortex 19:2728–2735. [DOI] [PMC free article] [PubMed] [Google Scholar]
- Pech‐Georgel C, George F (2006): Belo: Batterie d'évaluation de la lecture et de l'orthographe. Marseille: Solal. [Google Scholar]
- Penhune VB, Zatorre RJ, MacDonald JD, Evans AC (1996): Interhemispheric anatomical differences in human primary auditory cortex: Probabilistic mapping and volume measurement from magnetic resonance scans. Cereb Cortex 6:661–672. [DOI] [PubMed] [Google Scholar]
- Pfeifer RA (1920). Mylogenetisch‐anatomische Untersuchungen über das kortikale Ende der Hörleitung. Acad Wiss 37:1–54. [Google Scholar]
- Pfeifer RA (1936): Pathologie der Hörstrahlung und der kortikalen Hösphäre In Handbuch der Neurologie, edited by Bumke O. und Foerster O. Berlin: Springer Verlag. [Google Scholar]
- Plaza M, Robert‐Jahier AM (2006): DRA enfants test de dénomination rapide automatisé. Paris: Adeprio. [Google Scholar]
- Price CJ (2010): The anatomy of language: A review of 100 fMRI studies published in 2009. Ann N Y Acad Sci 1191:62–88. [DOI] [PubMed] [Google Scholar]
- Qiu A, Vaillant M, Barta P, Ratnanather JT, Miller MI (2008): Region‐of‐interest‐based analysis with application of cortical thickness variation of left planum temporale in schizophrenia and psychotic bipolar disorder. Hum Brain Mapp 29:973–985. [DOI] [PMC free article] [PubMed] [Google Scholar]
- Rademacher J, Caviness VS Jr, Steinmetz H, Galaburda AM (1993): Topographical variation of the human primary cortices: Implications for neuroimaging, brain mapping, and neurobiology. Cereb Cortex 3:313–329. [DOI] [PubMed] [Google Scholar]
- Rademacher J, Morosan P, Schormann T, Schleicher A, Werner C, Freund HJ, Zilles K (2001): Probabilistic mapping and volume measurement of human primary auditory cortex. Neuroimage 13:669–683. [DOI] [PubMed] [Google Scholar]
- Ratnanather JT, Poynton CB, Pisano DV, Crocker B, Postell E, Cebron S, Ceyhan E, Honeycutt NA, Mahon PB, Barta PE (2013): Morphometry of superior temporal gyrus and planum temporale in schizophrenia and psychotic bipolar disorder. Schizophr Res 150:476–483. [DOI] [PMC free article] [PubMed] [Google Scholar]
- Robichon F, Levrier O, Farnarier P, Habib M (2000): Developmental dyslexia: Atypical cortical asymmetries and functional significance. Eur J Neurol 7:35–46. [DOI] [PubMed] [Google Scholar]
- Rumsey JM, Donohue BC, Brady DR, Nace K, Giedd JN, Andreason P (1997): A magnetic resonance imaging study of planum temporale asymmetry in men with developmental dyslexia. Arch Neurol 54:1481–149. [DOI] [PubMed] [Google Scholar]
- Sanchez Bloom J, Garcia‐Barrera MA, Miller CJ, Miller SR, Hynd GW (2013): Planum temporale morphology in children with developmental dyslexia. Neuropsychologia 51:1684–1692. [DOI] [PMC free article] [PubMed] [Google Scholar]
- Schultz RT, Cho NK, Staib LH, Kier LE, Fletcher JM, Shaywitz SE, Shankweiler DP, Katz L, Gore JC, Duncan JS, Shaywitz BA. (1994): Brain morphology in normal and dyslexic children: The influence of sex and age. Ann Neurol 35(6):732–42. [DOI] [PubMed] [Google Scholar]
- Seldon HL (1981): Structure of human auditory cortex I: Cytoarchitectonics and dendritic distributions. Brain Res 229:277–294. [DOI] [PubMed] [Google Scholar]
- Semrud‐Clikeman M, Hynd GW, Novey ES, Eliopulos D (1991): Dyslexia and brain morphology: Relationships between neuroanatomical variation and neurolinguistic tasks. Learn Individ Differ 3:225–242. [Google Scholar]
- Sommer IE, Aleman A, Somers M, Boks MP, Kahn RS (2008): Sex differences in handedness, asymmetry of the planum temporale and functional language lateralization. Brain Res 1206:76–88. [DOI] [PubMed] [Google Scholar]
- Sprenger‐Charolles L, Colé P, Béchennec D, Kipffer‐Piquard A (2005): French normative data on reading and related skills from EVALEC, a new computerized battery of tests. Revue Européenne de Psychologie Appliquée 55:157–186. [Google Scholar]
- Steinmetz H, Jäncke L, Thron A (1990): Total surface of temporoparietal lntrasylvian cortex: Diverging left‐right asymmetries. Brain Lang 39:357–72. [DOI] [PubMed] [Google Scholar]
- Steinmetz H, Volkmann J, Jäncke L, Freund HJ (1991): Anatomical left‐right asymmetry of language‐related temporal cortex is different in left and right‐handers. Ann Neurol 29:315–319. [DOI] [PubMed] [Google Scholar]
- Takao H, Abe O, Yamasue H, Aoki S, Sasaki H, Kasai K, Yoshioka N, Ohtomo K (2011): Gray and white matter asymmetries in healthy individuals aged 21–29 years: A voxel‐based morphometry and diffusion tensor imaging study. Hum Brain Mapp 32:1762–1773. [DOI] [PMC free article] [PubMed] [Google Scholar]
- Van Essen DC (1997): A tension‐based theory of morphogenesis and compact wiring in the central nervous system. Nature 385:313–318. [DOI] [PubMed] [Google Scholar]
- Wada JA, Clarke R, Hamm A (1975): Cerebral hemispheric asymmetry in humans. Cortical speech zones in 100 adults and 100 infant brains. Arch Neurol 32:239–246. [DOI] [PubMed] [Google Scholar]
- Wechsler D (2005): WISC‐IV: Echelle d'Intelligence de Wechsler pour Enfants – Quatrième Edition. Paris: Editions du Centre de Psychologie Appliquée. [Google Scholar]
- Westbury CF, Zatorre RJ, Evans AC (1999): Quantifying variability in the planum temporale: A probability map. Cereb Cortex 9:392–405. [DOI] [PubMed] [Google Scholar]
- Winkler AM, Kochunov P, Blangero J, Almasy L, Zilles K, Fox PT, Duggirala R, Glahn DC (2010): Cortical thickness or grey matter volume? The importance of selecting the phenotype for imaging genetics studies. Neuroimage 53:1135–1146. [DOI] [PMC free article] [PubMed] [Google Scholar]
- Witelson SF, Kigar DL (1992): Sylvian fissure morphology and asymmetry in men and women: Bilateral differences in relation to handedness in men. J Comp Neurol 323:326–40. [DOI] [PubMed] [Google Scholar]
- Witelson SF, Pallie W (1973): Left hemisphere specialization for language in the newborn. Neuroanatomical evidence of asymmetry. Brain 96:641–646. [DOI] [PubMed] [Google Scholar]
- Witelson SF, Glezer II, Kigar DL (1995): Women have greater density of neurons in posterior temporal cortex. J Neurosci 15(Pt 1):3418–3428. [DOI] [PMC free article] [PubMed] [Google Scholar]