

Abstract
The hippocampus supports several important cognitive functions known to undergo substantial development during childhood and adolescence, for example, encoding and consolidation of vivid personal memories. However, diverging developmental effects on hippocampal volume have been observed across studies. It is possible that the inconsistent findings may attribute to varying developmental processes and functions related to different hippocampal subregions. Most studies to date have measured global hippocampal volume. We aimed to explore early hippocampal development both globally and regionally within subfields. Using cross‐sectional 1.5 T magnetic resonance imaging data from 244 healthy participants aged 4–22 years, we performed automated hippocampal segmentation of seven subfield volumes; cornu ammonis (CA) 1, CA2/3, CA4/dentate gyrus (DG), presubiculum, subiculum, fimbria, and hippocampal fissure. For validation purposes, seven subjects were scanned at both 1.5 and 3 T, and all subfields except fimbria showed strong correlations across field strengths. Effects of age, left and right hemisphere, sex and their interactions were explored. Nonparametric local smoothing models (smoothing spline) were used to depict age‐trajectories. Results suggested nonlinear age functions for most subfields where volume increases until 13–15 years, followed by little age‐related changes during adolescence. Further, the results showed greater right than left hippocampal volumes that seemed to be augmenting in older age. Sex differences were also found for subfields; CA2/3, CA4/DG, presubiculum, subiculum, and CA1, mainly driven by participants under 13 years. These results provide a detailed characterization of hippocampal subfield development from early childhood. Hum Brain Mapp 35:5646–5657, 2014. © 2014 Wiley Periodicals, Inc.
Keywords: brain maturation, children, dentate gyrus, hippocampus, magnetic resonance imaging
INTRODUCTION
A growing number of studies suggest that diverse cognitive functions are selectively associated with distinct hippocampal subregions [Fanselow and Dong, 2010; Kesner, 2007; Maguire et al., 2000; Poppenk and Moscovitch, 2011; Rempel‐Clower et al., 1996; Strange et al., 1999; Teicher et al., 2012], indicating that the hippocampal formation should not always be treated as a single functional entity [Gogtay et al., 2006]. For instance, Poppenk and Moscovitch [2011] recently showed in a sample of young adults that while overall hippocampal volume did not predict memory performance, larger posterior and smaller anterior hippocampal segments did. These findings raise the fundamental question of how hippocampal subregions develop. Complex interactions among genetic factors, environmental conditions, as well as changes in these factors, contribute to volume changes in subcomponents of the brain [Lenroot and Giedd, 2006]. This might also result in individual variations in hippocampal development. The exact neurobiological processes are not yet known, but likely include synaptic growth, dendritic arborisation, pruning, vascularisation and myelination [Benes et al., 1994; Huttenlocher, 1990; Lenroot and Giedd, 2006]. Postnatal neurogenesis is known to be largely restricted to dentate gyrus (DG) and there have been reported prolonged myelination in subiculum and presubiculum [Benes et al., 1994; Cayre et al., 2009; Toni et al., 2008; van Praag et al., 2005]. Magnetic resonance imaging (MRI) enables in vivo characterization of overall hippocampal volume [Giedd et al., 1999; Jernigan et al., 1991; Sowell et al., 2002]. Recently, a computational method for segmenting hippocampal subfields was presented, making a finer differentiation possible [Van Leemput et al., 2009]. Previous research has reported differential volumetric changes in posterior and anterior hippocampal subregions [Gogtay et al., 2006]. Functional MRI studies of healthy adults, patients with amnestic mild cognitive impairment (aMCI), and rodent studies have suggested that hippocampal subfields may partly have different involvement in cognition. For instance, CA3 and DG has been associated with learning and recall over shorter time intervals [Eldridge et al., 2005; Yassa et al., 2010], while CA1 possibly plays a more central role in consolidation and late retrieval [Kesner and Hunsaker, 2010]. However, no MRI study covers early brain development in hippocampal subfields, limiting our understanding of the structural brain foundation for the development of diverse memory‐related functions.
The aim of this study was to characterize early hippocampal development globally and regionally within subfields in the age range from 4 to 22 years. Previous developmental MRI studies have found early volume increases in grey matter, followed by decreases in older children and adolescents [Giedd et al., 1999; Jernigan et al., 1991; Lenroot et al., 2007; Reiss et al., 1996; Shaw et al., 2008; Sowell et al., 2002; Tamnes et al., 2013; Tamnes et al., 2010; Wilke et al., 2007], but subcortical structures show heterogeneous developmental patterns [Brain Development Cooperative Group, 2012; Østby et al., 2009]. Specifically, cross‐sectional and longitudinal studies indicate that the hippocampi have a prolonged volumetric increase, followed by relatively smaller age‐related changes in adolescence [Østby et al., 2009; Tamnes et al., 2013; Uematsu et al., 2012]. Hippocampal volume has also been found to be larger for boys compared to girls in developmental samples [Giedd et al., 2012; Hu et al., 2013]. Based on these findings, we tentatively hypothesised; (1) a nonlinear increase in volume of the hippocampus as a whole, with decelerating increase in early adolescence. This tendency should also be seen for different subfields, but regional variation is expected due to differential neurobiological processes. It is unknown whether MRI measures are sensitive to such differences. (2) Greater hippocampal volumes in males than females in development, in accordance with previously found sex differences [Giedd et al., 2012; Giedd et al., 1996; Murphy et al., 1996; Uematsu et al., 2012]. We will further explore whether sex differences are uniform across subfields and age. (3) Hemisphere effects with greater right hippocampal volumes, possibly interacting with age and sex [Thompson et al., 2009; Uematsu et al., 2012; Utsunomiya et al., 1999]. In sum, we will investigate whether age, sex, and hemisphere effects differ across hippocampal subfields.
MATERIAL AND METHODS
Participants
Two hundred and forty four participants (128 females) were included in this study. The age range was from 4 to 22 years of age (M = 12.3, SD = 4.8), and subjects were drawn from two different projects run by Research Group for Lifespan Changes in Brain and Cognition (LCBC) at the Department of Psychology, University of Oslo, Norway. The youngest children (N = 77, with age M = 6.7, SD = 1.4, range = 4.1–9.3, 41 females) were recruited from the Norwegian Mother and Child Cohort Study (MoBa) undertaken by the Norwegian Institute of Public Health [Magnus et al., 2006]. Older children and adolescents (N = 167, with age M = 14.8, SD = 3.4, range = 8.2–21.6, 87 females) were included from the project Neurocognitive Development [Østby et al., 2009; Tamnes et al., 2010]. The research projects were approved by the Regional Committee for Medical and Health Research Ethics. Written informed consent was obtained from all participants from 12 years of age and from the parent/guardian for participants <18 years. Oral informed consent was given by participants <12 years of age. Participants included in this analysis were required to be fluent Norwegian speakers and have normal or corrected to normal vision and hearing. Exclusion criteria were history of injury or disease known to affect central nervous system (CNS) function, including neurological or psychiatric illness or serious head trauma, being under psychiatric treatment, use of psychoactive drugs known to affect CNS functioning, preterm birth (less than 37 completed weeks) or low birth weight (less than 2500 g), and MRI contraindications. Children and adolescents from the Neurocognitive Development project were all recruited to be right handed. Participants recruited for the MoBa study were not excluded based on handedness but left handed participants (n = 4, age M = 6.3) were excluded from all analysis where volumes were not averaged across hemispheres. All children underwent a practice session in a mock scanner to get familiarized with the scan procedure, small space and the sounds of the MRI‐scanner.
Among the 254 children and adolescents who met the inclusion criteria, two participants (both 4 years old) had no useable MRI scans because of movement artifacts. Because great caution must be taken when conducting MRI on children to ensure high quality, all scans were manually checked for movement artifacts. All participants' scans were also examined by a neuroradiologist, which led to the exclusion of two additional participants. All segmentation results were visually inspected by a trained operator Stine Kleppe Krogsrud (SKK) and rejected if errors were observed. Data from six participants were excluded due to minor segmentation errors identifying by the borders of hippocampal subfields; where either the subfield mistakenly included white matter and/or cerebral cortex, overestimating total hippocampal volume, or the segmentation underestimated total hippocampal volume where cerebral cortex was extended into the hippocampus. To quantify possible outlier values, Studentized Deleted Residuals (SDR) from hippocampal volume predicted by age were calculated. None of the subjects had SDR values at or exceeding +/−3 (SDR ranged from 2,73 to −2,52), leaving the total number of participants to 244.
MRI Acquisition and Processing
MRI data were collected using a 12‐channel head coil on the same 1.5T Siemens Avanto scanner (Siemens Medical Solutions). The pulse sequence used for morphometric analyses were two 3D T1‐weighted magnetization prepared rapid acquisition gradient echo (MP‐RAGE) scans with the following parameters: repetition time (TR), 2,400 ms; echo time (TE), 3.61 ms; inversion time (TI), 1,000 ms; flip angle, 8°; acquisition duration of 7 min 42 s. Each volume consisted of 160 sagittal slices with voxel sizes of 1.25 × 1.25 × 1.20 mm. The total scan time was on average 50 min. For the children recruited for the MoBa study we used a parallel imaging technique (iPAT), using the same scan parameters, acquiring multiple T1‐scans within a short scan time (acquisition duration of 4 min 18 s.), enabling us to discard scans with residual movement and average the scans with sufficient quality. Here, the total scan time was on average 30 min. For both projects, the T1‐scans were acquired first in the scanning protocol. Raw datasets were deidentified and transferred to Linux workstations for processing and analyses at the Neuroimaging Analysis Laboratory, LCBC, University of Oslo. Each MP‐RAGE was visually inspected and only scans deemed to have no or minimal movement artifacts were included in the analyses. The two MP‐RAGE volumes were averaged to increase signal‐to‐noise ratio and brain volume estimation reliability in both samples. In our experience, artifacts in smaller children due to movement can be greatly reduced by running several shorter sequences with iPAT. This is important when scanning children down to the age of four, as in this study.
Volumetric Analysis
All brain volumes were estimated using FreeSurfer 5.1 (http://surfer.nmr.mgh.harvard.edu/). First, the whole hippocampal formation was segmented using the standard segmentation procedure [Fischl et al., 2002]. The procedure automatically labels each voxel in the brain as one of 37 structures [Fischl et al., 2002] using a probabilistic brain atlas [Han et al., 2006]. The segmentation puts constraints on allowable locations of structures in relation to each other based on the training set (e.g., hippocampus is never anterior to amygdala). The border between the amygdala and hippocampus has been found difficult to segment due to the similar subcortical intensity of the structures [Fischl et al., 2002]. Still, FreeSurfer is more accurate in hippocampus segmentation than other automated tools, especially in the head and tail of hippocampus [Morey et al., 2009]. The automated segmentations have been found to be statistically indistinguishable from manual labeling [Fischl et al., 2002], and reproducibility errors between scan sessions has been shown to be less than 2.3% for left hippocampus and less than 1.2% for right hippocampus in young adults [Jovicich et al., 2009]. The hippocampal segmentation procedure from our analysis was manually inspected for accuracy for each participant before automated segmentation of hippocampal subfields was performed using a recent technique in FreeSurfer 5.1. This procedure uses Bayesian inference and a probabilistic atlas of the hippocampal formation based on manual delineations of subfields in ultrahigh T1‐weighted MRI scans from a number of different subjects [Van Leemput et al., 2009]. Seven hippocampal subfield volumes are calculated: cornu ammonis (CA) 1, CA2/3, CA4/DG, presubiculum, subiculum, fimbria, and the hippocampal fissure. The segmentation of the larger subfields (e.g., CA2/3 and subiculum, presubiculum, and CA1, respectively) has been shown to correlate well with manual volume estimates (Dice coefficients ranging from 0.74 to 0.62), while segmentation of the smallest subfields (e.g., fimbria and the hippocampal fissure) is not as accurate (Dice coefficients of 0.51 and 0.53) (see Discussion) [Van Leemput et al., 2009]. All seven subfields generated from FreeSurfer were included in this study, although fimbria and the hippocampal fissure must be interpreted with great caution due to reliability issues.
We hypothesized substantial volume increases over the age‐range studied, but these are not expected to be so large as to invalidate the subfield segmentation results for the youngest participants. The myelination of white matter progresses rapidly in the neonate and infant brain, but at age two a relatively normal adult appearance can be seen in the intensity of white matter relative to that of gray matter [Holland et al., 1986]. Volume of the hippocampal formations also increases sharply until the age of 2 years and continues to increase more slowly thereafter [Utsunomiya et al., 1999]. While further infolding of the hippocampus undergoes between infancy and 7 years of age [Thompson et al.,2014 in press]. Therefore, tissue contrast and overall subfield organization is not expected to change dramatically in the currently investigated age‐range. These features, in combination with manual inspections of the individual segmentations, have convinced us that the subfield segmentations are accurate even for the youngest participants, not being subject to any age‐bias. A study specifically addressing the question of image registration procedures in the age‐range 4–11 years across commonly used software concluded that registering children's brains to a common space does not result in an age‐associated bias between older and younger children, making it feasible to accurately compare structural properties and patterns of brain activation in children from ages 4 to 11 [Ghosh et al., 2010]. Still, it should be noted that the presently used subfield segmentation scheme has not been validated on children, and validation studies comparing the automated procedure with manual labeling down to the age of 4 years would be welcome.
Segmentation results from hippocampal subfields were also visually inspected for errors in all datasets, yielding exclusions (see earlier), but to keep the results unbiased, no manual edits were done. Figure 1 shows the hippocampal subfield segmentation in one of the participants. Differences in size and reliability of the subfield segmentations may influence results, and this will be discussed. Finally, total intracranial volume (ICV) was estimated by use of an atlas‐based normalization procedure, where the atlas scaling factor is used as a proxy for ICV, shown to correlate highly with manually derived ICV (r = 0.93) [Buckner et al., 2004].
Figure 1.

The figure shows the result of the hippocampus segmentation for one subject superimposed on the subject's T1‐weighted scan in sagittal, coronal, and axial views, respectively. Right column: Colour coded hippocampal subfield segmentation. The last volume labelled “hippo rest” is the tail of the hippocampus where the delineation no longer discerns between the different subfields. CA = cornu ammonis, DG = dentate gyrus, Fissure = hippocampal fissure.
Validation Analysis
We have previous good experience with using the FreeSurfer hippocampal subfield segmentation on 1.5T MR scans [Engvig et al., 2012], but it is unknown which effect differences in image resolution have on the segmentation results. Therefore, we conducted a validation study where seven children (5 males), from 6 to 10 years of age (M = 8.4) were scanned on both the 1.5T Siemens Avanto scanner and a 3T Siemens Skyra scanner. The same iPAT technique was used on both scanners. On the 3T Siemens Skyra scanner a 16‐channel head coil was used and the pulse sequence for the morphometric analysis was a 3D T1‐weighted MP‐RAGE scan with the following parameters: TR, 2300 ms; TE, 2.98 ms; TI, 850 ms; flip angle, 8°; acquisition duration of 5 min 30 s. Each volume consisted of 176 sagittal slices with voxel sizes of 1 × 1 × 1 mm.
To test for effects of field strength differences, hippocampal subfield segmentation results were correlated across the two imaging resolutions. The results showed a strong significant positive correlation between segmentation results from 1.5 and 3 T for total hippocampal volume (r = 0.837, P = 0.019). Strong significant positive correlations (P = <0.05) were also found for six subfields; CA1 (r = 0.834), CA2 3 (r = 0.971), CA4 DG (r = 0.959), presubiculum (r = 0.854), subiculum (r = 0.809), and hippocampal fissure (r = 0.803). No significant correlation was found for fimbria (r = 0.339, P = 0.458). These validation results will be further discussed.
In addition, we tested the correspondence of the hippocampal subfield segmentation across the MP‐RAGE sequence and the iPAT sequence (see MRI acquisition and processing for scanning parameters) where 24 children (15 males), from 4 to 9 years of age (M = 7.4) were scanned with both sequences. The results showed strong positive correlations between segmentation results from the MP‐RAGE and iPAT for total hippocampal volume (r = 0.98) and for all subfields; CA1 (r = 0.90), CA2 3 (r = 0.98), CA4 DG (r = 0.98), presubiculum (r = 0.93), subiculum (r = 0.96), fimbria (r = 0.89) and hippocampal fissure (r = 0.70). These validation results will be further discussed (see Discussion)
Statistical Analyses
PASW Statistics 18.0 (SPSS, Chicago, IL) and MATLAB (Mathworks) were used for the statistical analyses. For some analyses, left and right raw volumes were summarized, making total volume for each subfield. Total hippocampal volume was calculated by adding all seven subfields and the remainder of the hippocampus as segmented in FreeSurfer. The remainder is the tail of the hippocampus where the delineation no longer discerns between the different subfields [Van Leemput et al., 2009].
A smoothing spline approach implemented in MATLAB [Fjell et al., 2010] was used for estimation of age trajectories. To test for nonlinear age‐functions, we compared the Aikake's Information Criterion (AIC) between the linear and smoothing spline models for each subfield. To alleviate the need for arbitrary choosing an appropriate smoothing level, we used an algorithm that optimizes smoothing level based on a version of AIC, that is, the smoothing level that minimizes AIC for each analysis was chosen. AIC offers a relative measure of amount of information lost when a model is used to describe a set of data, and can be said to describe the tradeoff between bias and variance in the construction of statistical models. AIC rewards goodness of fit, but also includes a penalty that is an increasing function of the number of estimated parameters. Thus, AIC attempts to find the model that best explains the data with a minimum of free parameters, in this case, with greatest possible smoothing level. With no smoothing, the smoothing spline will yield an extremely good apparent fit to the data, but the model would be predictively inaccurate. AIC takes this into account by penalizing for degrees of freedom [Fjell et al., 2010]. To ease comparison of AIC between ordinary least squares (OLS) linear models and smoothing spline models, we used ΔI, which is the difference between AIC for the model and the lowest AIC—in this case, the difference between the smoothing spline model and the linear OLS model. As a rule of thumb, ΔI ≤ 2 would indicate that the two models are essentially indistinguishable with regard to goodness of fit, ΔI ≥ 4 would indicate considerable differences between the models, and ΔI ≥ 10 would indicate that the model has essentially no support. These criteria were based on [Burnham and Anderson, 2002], justified from likelihood‐ration theory, from which is can be shown that these offers protection from overfitting that aligns with the conventional alpha level of 0.05 for significance.
In PASW Statistics, we ran partial correlations between age and each subfield volume (CA1, CA2/3, CA4/DG, presubiculum, subiculum, fimbria, and hippocampal fissure) as well as raw total volume, controlling for sex. The subfield analyses were Bonferroni‐corrected by a factor of 7 (reflecting the seven subfields). These analyses were repeated additionally controlling for ICV and in a separate analysis controlling for total hippocampal volume. The break point of the smoothing spline curves were inspected to identify an age that distinguish early and later hippocampal subfield development. Based on visual inspection of the soothing spline curve for total hippocampal volume, the hippocampal volume increase leveled off around the age of 13 years. The same partial correlation analyses were run for age and each subfield raw total volume for each of the two age groups separated by this point (<13 years vs. ≥13 years), controlling for sex. To test effects of hemisphere, sex, age group, and their interactions, we conducted general linear model (GLM) analyses with left and right hemisphere (left, right) × age group (<13 years, ≥13 years) × sex (female, male). Here, the left and right hemisphere refers to left total hippocampal volume and right total hippocampal volume, and the seven left and right hippocampal subfield volumes (CA1, CA2/3, CA4/DG, presubiculum, subiculum, fimbria, and hippocampal fissure).
RESULTS
Scatterplots including the local smoothing model for hippocampal subfields and total hippocampal volume are shown in Figure 2. Comparing AIC values for the linear and smoothing spline models for each raw subfield volumes, the results suggested considerably better fits for the smoothing spline model for the hippocampus as a whole, and for six out of seven subfields (Table 1), all showing steeper age‐related volume increases in early childhood. For CA1, CA2/3, CA4/DG, presubiculum, subiculum, and fimbria, as well as total hippocampal volume, the models estimated gradually decelerating volume increases until 13–15 years, followed by little age‐related changes (Fig. 2). For the hippocampal fissure, a linear age‐related volume decrease was found. Correlations between both subfields and total hippocampal volume and age, controlling for sex, are shown in Table 1 for the total sample as well as divided in subgroups of children (<13 years) and adolescents (≥13 years). The results showed significant corrected (P < 0.007) age‐related volume increases for total hippocampal volume and all subfields except the hippocampal fissure for the total sample. The hippocampal fissure showed a significant age‐related volume decrease. The subgroup analyses confirmed that total hippocampal volume and all subfields except the hippocampal fissure showed significant corrected (P < 0.007) age‐related volume increases in childhood (<13 years), followed by only small changes in the age range 13–22 years (n.s). Further, the ICV corrected analysis (Table 2) for the total sample showed significant corrected (P < 0.007) age‐related volume increases for total hippocampal volume and subiculum, and significant uncorrected (P < 0.05) age‐related volume increases for all subfields except from fimbria, and hippocampal fissure showed age‐related volume decrease. The ICV corrected subgroup analysis showed significant uncorrected (P < 0.05) age‐related volume increases for CA1, presubiculum, subiculum and total hippocampal volume in childhood (<13 years). No significant age‐related volume differences were found after the age of 13 years. For the total hippocampal volume corrected analysis (see Supporting Information Table 1) for the total sample, results showed significant corrected (P < 0.007) age‐related volume decrease for hippocampal fissure, and significant uncorrected (P < 0.05) age‐related volume decrease for CA4/DG. No significant age‐related volume differences were found for CA1, CA2/3, presubiculum, subiculum, and hippocampal fissure in the total hippocampal volume corrected analysis for the total sample. The same significant (P < 0.007) age‐related volume decrease for hippocampal fissure was found for the total hippocampal volume corrected subgroup analyses in childhood (<13 years). No significant age‐related volume differences were found for CA1, CA2/3, CA4/DG, presubiculum, subiculum, and fimbria for the total hippocampal volume corrected subgroup analysis in childhood (<13 years). No significant age‐related volume differences were found for the total hippocampal volume corrected subgroup analysis in adolescents (>13 years).
Figure 2.
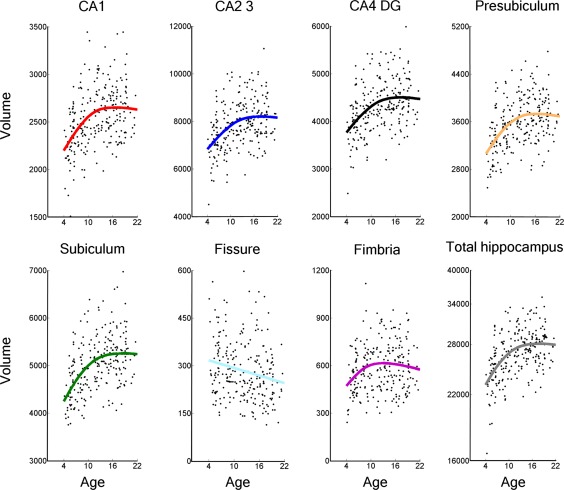
Scatterplots showing hippocampal subfields and total hippocampal volume against age, with local smoothing models. Volume is reported in number of 0.5 mm3 voxels and age is shown in years. Fissure = hippocampal fissure. Total hippocampus = total hippocampal volume where all subfields, including the tail of the hippocampus, is added together.
Table 1.
Relationships between total hippocampal and subfield volumes and age
| Total sample | Children | Adolescents | |||
|---|---|---|---|---|---|
| (n = 244) | (n = 131) | (n = 113) | |||
| r | r | r | AIC smoothing spline | AIC linear fit | |
| Total hippocampus | 0.503 | 0.513 | 0.057 | 5175.84 | 5190.28 |
| CA1 | 0.428 | 0.471 | 0.041 | 4091.40 | 4103.89 |
| CA2/3 | 0.437 | 0.438 | 0.029 | 4659.52 | 4669.05 |
| CA4/DG | 0.429 | 0.440 | 0.035 | 4348.70 | 4358.48 |
| Presubiculum | 0.442 | 0.488 | 0.014 | 4224.78 | 4239.69 |
| Subiculum | 0.483 | 0.496 | 0.051 | 4390.74 | 4404.11 |
| Fimbria | 0.174 | 0.283 | −0.045 | 3780.68 | 3788.00 |
| Fissure | −0.204 | −0.118 | −0.120 | 3541.19 | 3541.19 |
Age 4–22 years (N=244). The table shows partial correlation (r) between age (children < 13 years, adolescent ≥ 13 years) and volume of total hippocampus and each subfield, controlling for sex. AIC smoothing spline; and AIC linear fit; showing a better fit for the smoothing spline models for all subfields, including total hippocampus (total hippocampal volume). Fissure = Hippocampal Fissure. Significant correlations corrected (P < 0.007) for multiple comparisons are shown in bold.
Table 2.
Relationships between hippocampal total and subfield volumes and age, controlling for ICV and sex
| Total sample | Children | Adolescents | |
|---|---|---|---|
| (n = 244) | (n = 131) | (n = 113) | |
| r | r | r | |
| Total hippocampus | 0.215 | 0.220 | 0.063 |
| CA1 | 0.164 | 0.229 | 0.041 |
| CA2/3 | 0.138 | 0.134 | 0.030 |
| CA4/DG | 0.140 | 0.148 | 0.037 |
| Presubiculum | 0.170 | 0.227 | 0.013 |
| Subiculum | 0.216 | 0.209 | 0.056 |
| Fimbria | 0.023 | 0.139 | −0.047 |
| Fissure | −0.196 | −0.110 | −0.119 |
Age 4–22 years (N = 244). The table shows partial correlation (r) between age (children < 13 years, adolescent ≥ 13 years) and total hippocampus volume and volume of each subfield, controlling for intracranial volume (ICV) and sex. Fissure = hippocampal fissure. Significant correlations uncorrected (P < 0.05) are shown in italic, significant correlations corrected (P < 0.007) for multiple comparisons are shown in bold.
GLM with left and right hemisphere (left, right) × age group (<13 years, ≥13 years) × sex (female, male) for total hippocampal volume showed a main effect of hemisphere (F (1,540) = 11.87; P = 0.001) with different sizes of total hippocampal volume in left and right hemisphere. As can be seen from Table 3, there were larger right total hippocampus volume than total left hippocampus volume. The results also showed a main effect of age group (F (1,240) = 41.37; P = 0.001), caused by larger total hippocampus volume in adolescents (≥13 years) than in children (<13 years). In addition, a main effect of sex (F (1,240) = 61.09; P = 0.001) was found, showing larger total hippocampal volumes in both left and right hemisphere for males than females in both age groups (see Table 3). There was a trend toward an interaction of hemisphere × age groups (F (1,540) = 3.51; P = 0.062), caused by a tendency for larger right total hippocampus volume than left total hippocampus volume being augmented in older age. The results also showed a trend toward interaction of hemisphere × sex (F (1,540) = 3.76; P = 0.054), caused by an overall larger difference in total hippocampus volume favouring right total hippocampus volume for males. There was only a trend toward an interaction of hemisphere × age groups × sex (F (1,540) = 31.51; P = 0.062). For the child group (<13 years) males showed marginal differences between right total hippocampus volume and left total hippocampus volume, whereas right total hippocampus volume was larger than left total hippocampus volume for females. For the adolescent group (≥13 years) right total hippocampus volume was larger than left total hippocampus volume for both males and females.
Table 3.
Raw volumes of hippocampus and subfields
| Children (<13 years) | Adolescent (≥13 years) | |||||||
|---|---|---|---|---|---|---|---|---|
| Female N = 64 | Male N = 67 | Female N = 64 | Male N = 49 | |||||
| Left | Right | Left | Right | Left | Right | Left | Right | |
| M (SD) | M (SD) | M (SD) | M (SD) | M (SD) | M (SD) | M (SD) | M (SD) | |
| Total hippo | 24334 (2835) | 24836 (2405) | 27080 (3099) | 27202 (2995) | 26579 (2257) | 27294 (2057) | 28893 (2692) | 29556 (2546) |
| CA 1 | 2272 (304) | 2378 (280) | 2592 (358) | 2615 (316) | 2481 (254) | 2587 (280) | 2994 (475) | 2801 (281) |
| CA2/3 | 6980 (958) | 7332 (805) | 7843 (1073) | 8122 (995) | 7539 (782) | 8009 (715) | 8408 (931) | 8900 (908) |
| CA4/DG | 3874 (508) | 4023 (427) | 4354 (580) | 4441 (563) | 4189 (419) | 4426 (396) | 4594 (528) | 4806 (478) |
| Presubiculum | 3361 (455) | 3288 (382) | 3663 (413) | 3496 (433) | 3649 (395) | 3524 (293) | 3944 (404) | 3804 (389) |
| Subiculum | 4630 (600) | 4556 (516) | 5119 (615) | 4921 (573) | 5092 (490) | 5073 (485) | 5450 (600) | 5373 (519) |
| Fimbria | 545 (145) | 520 (160) | 641 (183) | 578 (188) | 611 (148) | 503 (142) | 717 (200) | 595 (159) |
| Fissure | 291 (107) | 290 (97,31) | 284 (98,66) | 328 (127) | 248 (115) | 253 (95,36) | 293 (110) | 280 (106) |
Mean volumes (measured in number of 0.5 mm3 voxels) in each raw volume for total hippocampus and seven subfields (SD), divided into two age groups (children < 13 years, adolescent ≥ 13 years), sex (female, male), and hemisphere (left, right). Total hippo = total hippocampal volume. Fissure = hippocampal fissure.
Further, the results showed a main effect of subfield (F (6,540) = 14264.6; P = 0.001). As can be seen from Table 3, the largest volumes were found for CA2/3 and subiculum, while the smallest subfields are fimbria and hippocampal fissure. There was an interaction effect of subfield × age groups (<13 years, ≥13 years) (F (6,540) = 27.84; P = 0.001), with greatest age differences for CA2/3, CA4/DG, subiculum, presubiculum, and CA1, respectively, whereas there were almost no differences in volume for fimbria and hippocampal fissure between the age groups. The interaction effect of subfield × sex (F (6,540) = 37.48; P = 0.001) appears to be caused by smaller subfield volumes for females, especially for CA2/3, CA4/DG, presubiculum, subiculum and CA1 compared to males. There was a significant interaction of hemisphere × subfield × age groups (F (6,540) = 5.33; P = 0.001), where the results indicated greater right than left hemisphere volumes for CA1, CA2/3, and CA4/DG that were augmented in older age. Presubiculum and subiculum had larger left than right hemisphere volume. For the latter, the difference between left and right hemisphere volume decreased with older age, while the difference in presubiculum between left and right hemisphere volume did not change with older age. The fimbria showed an opposite pattern than the rest of the subfields, where left hemisphere volume increased with age and right hemisphere volume decreased with age. The hippocampal fissure showed decrease in both left and right hemisphere volumes with age and the right hemisphere volume appeared to decrease more than left hemisphere volume in older age. There were no significant interactions of subfield × age groups × sex (P > 0.2).
DISCUSSION
This study showed that hippocampus undergoes rapid estimated growth in early childhood, before leveling off in adolescence, with regional differences across subfields, hemisphere and sex. These results indicate that age does not have a linear impact on hippocampal maturation, and that the speed of estimated growth varies substantially across developmental phases. Interestingly, there were similarities in age‐trajectories between subfields but also notable differences. The implications of the results are discussed in relation to the initial hypotheses.
Is there a nonlinear increase in volume of the hippocampus as a whole, with decelerating increase in adolescence, and to what extent is this seen for different subfields?
The results showed a nonlinear increase in volume of the hippocampus as a whole, with rapid initial volume increase, which gradually decelerated until age 13–15 years, after which little age‐related changes were seen. As for the subfield development trajectories, a nonlinear increase was seen for six out of seven subfields. For the hippocampal fissure, a linear age‐related volume decrease was found. The greatest age‐related differences were found for CA2/3, CA4/DG, subiculum, presubiculum, and CA1, respectively. The nonlinear developmental pattern is in accordance with the findings on total hippocampal volume from infancy by Uematsu et al. [2012]. However, they found hippocampal volume increase until approximately 9 to 11 years of age. In contrast, hippocampal volume increase restricted to the right hemisphere only in females in the age range between 4 and 18 years has also been reported [Giedd et al., 1996], while others have demonstrated a significant volume increase in the hippocampus between 13–14 and 18–21 years only in males [Suzuki et al., 2005].
To our knowledge, there has been no study investigating hippocampal subfield development within a large sample of children and adolescents. Research on gene expression and anatomical projection patterns supports that the hippocampus can be divided into separate anatomical structures and studies also suggest that diverse cognitive functions may be associated with different hippocampal subregions [Cayre et al., 2009; Dong et al., 2009; Eldridge et al., 2005; Fanselow and Dong, 2010; Kesner and Hunsaker, 2010; Lenroot and Giedd, 2006; Poppenk and Moscovitch, 2011; Thompson et al., 2008; Toni et al., 2008; Uematsu et al., 2012; Yassa et al., 2010]. Importantly, previous research has reported differential volumetric changes in posterior and anterior hippocampal subregions. In one study, the total hippocampal volume remained unchanged bilaterally between ages 4 and 25, while they found notable variability along the horizontal axis of the hippocampus over time [Gogtay et al., 2006]. In contrast, our results indicated that most of the subfields, with some exceptions, showed similar structural developmental patterns as total hippocampal volume, although the presently used subfield demarcations do not adhere to an anterior–posterior division. The small age‐related differences between subfields could be caused by neurobiological processes such as neurogenesis in DG, and myelination in subiculum and presubiculum that are known to continue until adulthood [Benes et al., 1994; Toni et al., 2008; van Praag et al., 2005].
Although the general developmental patterns were similar across subfields, there were some exceptions. Subfield volumes differ greatly and it is important to consider the differences in size and reliability when interpreting the developmental subfield trajectories. The biggest volumes are found for CA2/3, subiculum and CA4/DG, while the smallest subfields are fimbria and hippocampal fissure. The structures that are most difficult to segment reliably by the human operator are likely also the most difficult for the automated method. Automated segmentations for the smaller subfields are therefore expected to be less reliable. When calculating the average distance between the boundary of each structure's manual segmentation and the boundary of the corresponding automated segmentation, results indicate that the relatively poor segmentation evaluation scores for hippocampal fissure are apparently caused by a systematic underestimation of the volume of the hippocampal fissure by the automated method [Van Leemput et al., 2009].
Are hippocampal volumes greater in males than females in development and to what extent are sex differences uniform across subfields? Are there differential hemispheric effects with greater right hippocampal volumes, and do these interact with age and sex?
Our results showed consistently larger right total hippocampus volume than left total hippocampus volume, and males showed substantially larger right total hippocampus volume than females. Further, trend effects indicated that the greater right than left total hippocampus volume seemed to be augmented in adolescents, and also a trend for an overall larger hemispheric difference for females than males, mainly driven by the child group. Sex differences were also found for most subfields, especially for CA2/3, CA4/DG, presubiculum, subiculum and CA1, whereas no sex differences were found for fimbria and hippocampal fissure. There were also interactions of hemisphere, subfields and age groups indicating greater right than left subfield volumes for CA1, CA2/3 and CA4/DG that seemed to be augmented in older age, whereas other subfields showed slightly greater left than right subfield volumes with different developmental patters between left and right hemisphere.
In accordance with the findings of Uematsu et al. [2012], our results showed rightward volumetric hippocampal asymmetry in both males and females, although a somewhat smaller laterality difference was seen in young boys. Also, Thompson et al. [in press] have reported larger volume growth in the right than left hippocampus from birth to seven years of age. These results were not consistent with previous findings, where Giedd et al. [1999] reported that the right hippocampus correlated with age only in females, and that the left hippocampus did not increase with age between 4 to 18 years in males. Further, they also found greater right‐than‐left asymmetry in hippocampus, which did not change with age. Hu et al. [2013] have found a quadratic relation between volume and age for both boys and girls in hippocampus. Between 4 and 10 years, the volumetric growth pattern for hippocampus was parallel for boys and girls with larger hippocampal volume for boys, which is in accordance with our findings. Although, with increasing puberty as measured by a self‐rating scale, they reported decrease of hippocampal volumes for boys, while for girls, the volumes of hippocampus were found to increase with the increasing puberty score. These latter findings might suggest that the rising levels of testosterone in boys and estrogen in girls might have opposite effects for hippocampus development [Hu et al., 2013]. This implies that both sex and laterality can influence the developmental trajectories of hippocampus. Future studies should directly investigate effects of hormone levels on structural development of hippocampus and the rest of the limbic system, which could possibly contribute to explain the sex effects observed. Laterality might depend on the period of development, gestational age at birth, and mental health, and larger right hippocampal volume compared to left hippocampal volume has also been found in infants [Thompson et al., 2009].
LIMITATIONS AND CONCLUSIONS
Further investigations are needed to confirm the present results in a longitudinal design, as longitudinal studies have the advantage of being more sensitive to individual differences in hippocampal developmental trajectories. In this study, we used 1.5T scans (1.25 × 1.25 × 1.20 mm resolution) as compared with the 3T images (380 µm in‐plane resolution; slice thickness 0.8 mm) used for the development of the subfield technique employed. However, we have previous good experience with using this segmentation approach to hippocampal subfields from 1.5T MR scans [Engvig et al., 2012] and visual inspection of our results (see Fig. 1) suggest subfield identification and separation in agreement with results reported at 3T (see Hanseeuw et al. [2011]. The current FreeSurfer algorithm seems to provide adequate segmentation results at 1.5T. Also, when directly comparing the hippocampal subfield segmentation across field strengths, the current validation results showed strong correlations between the segmentation at 1.5 and 3T. This was found for total hippocampal volume and six subfields. Fimbria showed a weaker correlation compared with the rest of the subfields. As one of the smallest structures, fimbria has the lowest correlation between manual and automated volume estimates according to Van Leemput et al. [2009]. The current weak correspondence across field strength in fimbria may thus possibly be partly attributed to the segmentation procedure and not image resolution alone. To avoid movement artifacts in the young age group (4–9 years of age), we ran several shorter sequences with iPAT. When comparing the hippocampal subfield segmentation between the MP‐RAGE sequence and the iPAT sequence, the validation results showed strong correlations between segmentation results from the MP‐RAGE and iPAT for total hippocampal volume and all subfields. The correlations were similar to what would be expected if the same child was scanned twice with the identical sequence [Jovicich et al., 2009] for total hippocampal volume (r = 0.98), CA2 3 (0.98), and CA4 DG (0.98). Correlations from 0.89 to 0.96 were obtained for CA1, presubiculum, subiculum and fimbria, also indicating substantial similarity. However, a lower correlation was observed for the hippocampal fissure (0.70). The value for this subfield may hence be partially affected by the differing imaging protocols, as well as an overall less reliable automated segmentation procedure for this specific subfield. With this exception, however, the validation analysis indicated that the imaging protocol differences did only minutely affect the total hippocampus and subfield volume estimates. Results obtained with the segmentation procedure used in the present study should also be directly compared with other available protocols, as variability exists in both nomenclature and boundary rules.
To use this segmentation procedure on children, we took great care to visually inspect every slice of every volume of every subject in the study to ensure that the subfield segmentations were accurate. Within the field of clinical MRI, the hippocampal subfield technique has also improved sensitivity to detect small changes, such as atrophy in specific subfields. Compared to total hippocampal volume, hippocampal subfields segmentation has been shown to increase the sensitivity to diagnose aMCI from 40% to 73% [Hanseeuw et al., 2011]. Exposure to childhood maltreatment has also been associated with reduced volume of certain hippocampal subfields in adulthood. Maltreatment was associated with an average volume reduction of 6% in CA2/CA3 and CA4/DG compared to participants that did not experience childhood trauma [Teicher et al., 2012]. Using the same hippocampal subfield technique, 2014Schoene‐Bake et al. [in press] have found significant volume loss of almost all subfields ipsilateral to the hemisphere with hippocampal sclerosis in patients with mesial temporal pathology. Approximately three quarters of the patients had MRI volume abnormalities of CA1, CA2/3, CA4/DG, subiculum, and presubiculum [Schoene‐Bake et al., in press]. The results from hippocampal segmentation in clinical groups demonstrated the sensibility and accuracy of the segmentation technique and we have reasons to believe that it captured the anatomical variability of the children and adolescents studied. Vulnerability of hippocampal subfields has been associated with psychiatric disorders such as depression [Huang et al., 2013] and schizophrenia [Kühn et al., 2012], and also with Alzheimer's disease [West et al., 1994]. Early detection of circumscribed hippocampal subfield pathology may potentially provide important diagnostic information, and be of value for clinical evaluation and surgical consideration [Schoene‐Bake et al., in press; Thompson et al., in press]. Our cross‐sectional data from the present age range yielded results that shed new light on normal hippocampal development both globally and regionally within subfields.
In conclusion, our results showed that hippocampus undergoes rapid estimated growth in early childhood, before leveling off in adolescence. Regional differences were found for hemisphere, volume and sex. Except for the hippocampal fissure, other subfields, including CA1, CA2/3, CA4/DG, presubiculum, subiculum, and fimbria showed similar age–trajectories during childhood.
Supporting information
Supplementary Information
Supplementary Information
Conflict of interest: The authors declare no competing financial interests.
REFERENCES
- Benes F, Turtle M, Khan Y, Farol P (1994): Myelination of a key relay zone in the hippocampal formation occurs in the human brain during childhood, adolescence, and adulthood. Arch Gen Psychiatry 51:477–484. [DOI] [PubMed] [Google Scholar]
- Brain Development Cooperative Group (2012): Total and regional brain volumes in a population‐based normative sample from 4 to 18 years: The NIH MRI study of normal brain development. Cereb Cortex 22:1–12. [DOI] [PMC free article] [PubMed] [Google Scholar]
- Buckner RL, Head D, Parker J, Fotenos AF, Marcus D, Morris JC, Snyder AZ (2004): A unified approach for morphometric and functional data analysis in young, old, and demented adults using automated atlas‐based head size normalization: Reliability and validation against manual measurement of total intracranial volume. NeuroImage 23:724–738. [DOI] [PubMed] [Google Scholar]
- Burnham KP, Anderson DR (2002): Model Selection and Multi‐Model Inference: A Practical Information‐Theoretic. New York: Springer Science, Inc. [Google Scholar]
- Cayre M, Canoll P, Goldman JE (2009): Cell migration in the normal and pathological postnatal mammalian brain. Prog Neurobiol 88:41–63. [DOI] [PMC free article] [PubMed] [Google Scholar]
- Dong H‐W, Swanson LW, Chen L, Fanselow MS, Toga AW (2009): Genomic–anatomic evidence for distinct functional domains in hippocampal field CA1. Proc Natl Acad Sci USA 106:11794–11799. [DOI] [PMC free article] [PubMed] [Google Scholar]
- Eldridge LL, Engel, SA , Zeineh MM, Bookheimer SY, Knowlton J (2005): A dissociation of encoding and retrieval processes in the human hippocampus. J Neurosci 25:3280–3286. [DOI] [PMC free article] [PubMed] [Google Scholar]
- Engvig A, Fjell AM, Westlye LT, Skaane NV, Sundseth Ø, Walhovd KB (2012): Hippocampal subfield volumes correlate with memory training benefit in subjective memory impairment. NeuroImage 61:188–194. [DOI] [PubMed] [Google Scholar]
- Fanselow MS, Dong H‐W (2010): Are the dorsal and ventral hippocampus functionally distinct structures? Neuron 65:7–19. [DOI] [PMC free article] [PubMed] [Google Scholar]
- Fischl B, Salat DH, Busa E, Albert M, Dieterich M, Haselgrove C, van der Kouwe A, Killiany R, Kennedy D, Klaveness S, Montillo A, Makris N, Rosen B, Dale AM (2002): Whole brain segmentation: Automated labeling of neuroanatomical structures in the human brain. Neuron 33:341–355. [DOI] [PubMed] [Google Scholar]
- Fjell AM, Walhovd KB, Westlye LT, Østby Y, Tamnes CK, Jernigan TL, Gamst A, Dale AM (2010): When does brain aging accelerate? Dangers of quadratic fits in cross‐sectional studies. NeuroImage 50:1376–1383. [DOI] [PubMed] [Google Scholar]
- Ghosh SS, Kakunoori S, Augustinack J, Nieto‐Castanon A, Kovelman I, Gaab N, Christodoulou JA, Triantafyllou C, Gabrieli JDE, Fischl B (2010): Evaluating the validity of volume‐based and surface‐based brain image registration for developmental cognitive neuroscience studies in children 4 to 11 years of age. NeuroImage 53:85–93. [DOI] [PMC free article] [PubMed] [Google Scholar]
- Giedd JN, Snell JW, Lange N, Rajapakse JC, Casey BJ, Kozuch PL, Vaituzis AC, Vauss YC, Hamburger SD, Kaysen D, Rapoport JL (1996): Quantitative magnetic resonance imaging of human brain development: Ages 4–18. Cereb Cortex 6:551–560. [DOI] [PubMed] [Google Scholar]
- Giedd JN, Blumenthal J, Jeffries NO, Castellanos FX, Liu H, Zijdenbos A, Paus T, Evans AC, Rapoport JL (1999): Brain development during childhood and adolescence: A longitudinal MRI study. Nat Neurosci 2:861–863. [DOI] [PubMed] [Google Scholar]
- Giedd JN, Raznahan A, Mills K, Lenroot R (2012): Review: Magnetic resonance imaging of male/female differences in human adolescent brain anatomy. Biol Sex Differ 3:19. [DOI] [PMC free article] [PubMed] [Google Scholar]
- Gogtay N, Nugent TF, Herman DH, Ordonez A, Greenstein D, Hayashi KM, Clasen L, Toga AW, Giedd JN, Rapoport JL, Thompson PM (2006): Dynamic mapping of normal human hippocampal development. Hippocampus 16:664–672. [DOI] [PubMed] [Google Scholar]
- Han X, Jovicich J, Salat D, van der Kouwe A, Quinn B, Czanner S, Busa E, Pacheco J, Albert M, Killiany R, Maguire P, Rosas D, Makris N, Dale A, Dickerson B, Fischl B (2006): Reliability of MRI‐derived measurements of human cerebral cortical thickness: The effects of field strength, scanner upgrade and manufacturer. NeuroImage 32:180–194. [DOI] [PubMed] [Google Scholar]
- Hanseeuw BJ, Van Leemput K, Kavec M, Grandin C, Seron X, Ivanoiu A (2011): Mild cognitive impairment: Differential atrophy in the hippocampal subfields. Am J Neuroradiol 32:1658–1661. [DOI] [PMC free article] [PubMed] [Google Scholar]
- Holland BA, Haas DK, Norman D, Brant‐Zawadzki M, Newton TH (1986): MRI of normal brain maturation. Am J Neuroradiol 7:201–208. [PMC free article] [PubMed] [Google Scholar]
- Hu S, Pruessner JC, Coupé P, Collins DL (2013): Volumetric analysis of medial temporal lobe structures in brain development from childhood to adolescence. NeuroImage 74:276–287. [DOI] [PubMed] [Google Scholar]
- Huang Y, Coupland NJ, Lebel RM, Carter R, Seres P, Wilman AH, Malykhin NV (2013): Structural changes in hippocampal subfields in major depressive disorder: A high‐field magnetic resonance imaging study. Biol Psychiatry 74:62–68. [DOI] [PubMed] [Google Scholar]
- Huttenlocher PR (1990): Morphometric study of human cerebral cortex development. Neuropsychologia 28:517–527. [DOI] [PubMed] [Google Scholar]
- Jernigan TL, Trauner DA, Hesselink JR, Tallal PA (1991): Maturation of human cerebrum observed in vivo during adolescence. Brain 114:2037–2049. [DOI] [PubMed] [Google Scholar]
- Jovicich J, Czanner S, Han X, Salat D, van der Kouwe A, Quinn B, Pacheco J, Albert M, Killiany R, Blacker D, Maguire P, Rosas D, Makris N, Gollub R, Dale A, Dickerson BC, Fischl B (2009): MRI‐derived measurements of human subcortical, ventricular and intracranial brain volumes: Reliability effects of scan sessions, acquisition sequences, data analyses, scanner upgrade, scanner vendors and field strengths. NeuroImage 46:177–192. [DOI] [PMC free article] [PubMed] [Google Scholar]
- Kesner RP (2007): Behavioral functions of the CA3 subregion of the hippocampus. Learn Mem 14:771–781. [DOI] [PubMed] [Google Scholar]
- Kesner RP, Hunsaker MR (2010): The temporal attributes of episodic memory. Behav Brain Res 215:299–309. [DOI] [PubMed] [Google Scholar]
- Kühn S, Musso F, Mobascher A, Warbrick T, Winterer G, Gallinat J (2012): Hippocampal subfields predict positive symptoms in schizophrenia: First evidence from brain morphometry. Transl Psychiatry 2:e127. [DOI] [PMC free article] [PubMed] [Google Scholar]
- Lenroot RK, Giedd JN (2006): Brain development in children and adolescents: Insights from anatomical magnetic resonance imaging. Neurosci Biobehav Rev 30:718–729. [DOI] [PubMed] [Google Scholar]
- Lenroot RK, Gogtay N, Greenstein DK, Wells EM, Wallace GL, Clasen LS, Blumenthal JD, Lerch J, Zijdenbos AP, Evans AC, Thompson PM, Giedd JN (2007): Sexual dimorphism of brain developmental trajectories during childhood and adolescence. NeuroImage 36:1065–1073. [DOI] [PMC free article] [PubMed] [Google Scholar]
- Magnus P, Irgens LM, Haug K, Nystad W, Skjærven R, Stoltenberg C, Group TMS (2006): Cohort profile: The Norwegian Mother and Child Cohort Study (MoBa). Int J Epidemiol 35:1146–1150. [DOI] [PubMed] [Google Scholar]
- Maguire EA, Gadian DG, Johnsrude IS, Good CD, Ashburner J, Frackowiak RSJ, Frith CD (2000): Navigation‐related structural change in the hippocampi of taxi drivers. Proc Natl Acad Sci USA 97:4398–4403. [DOI] [PMC free article] [PubMed] [Google Scholar]
- Morey RA, Petty CM, Xu Y, Pannu Hayes J, Wagner Ii HR, Lewis DV, LaBar KS, Styner M, McCarthy G (2009): A comparison of automated segmentation and manual tracing for quantifying hippocampal and amygdala volumes. NeuroImage 45:855–866. [DOI] [PMC free article] [PubMed] [Google Scholar]
- Murphy D, DeCarli C, Mclntosh AR, Daly E, Metis MJ, Pietrini P, Szczepanik J, Schapiro MB, Grady CL, Horwitz BP, Rapoport SI (1996): Sex differences in human brain morphometry and metabolism: An in vivo quantitative magnetic resonance imaging and positron emission tomography study on the effect of aging. Arch Gen Psychiatry 53:585–594. [DOI] [PubMed] [Google Scholar]
- Østby Y, Tamnes CK, Fjell AM, Westlye LT, Due‐Tønnessen P, Walhovd KB (2009): Heterogeneity in subcortical brain development: A structural magnetic resonance imaging study of brain maturation from 8 to 30 Years. J Neurosci 29:11772–11782. [DOI] [PMC free article] [PubMed] [Google Scholar]
- Poppenk J, Moscovitch M (2011): A hippocampal marker of recollection memory ability among healthy young adults: Contributions of posterior and anterior segments. Neuron 72:931–937. [DOI] [PubMed] [Google Scholar]
- Reiss AL, Abrams MT, Singer HS, Ross JL, Denckla MB (1996): Brain development, gender and IQ in children: A volumetric imaging study. Brain 119:1763–1774. [DOI] [PubMed] [Google Scholar]
- Rempel‐Clower NL, Zola SM, Squire LR, Amaral DG (1996): Three cases of enduring memory impairment after bilateral damage limited to the hippocampal formation. J Neurosci 16:5233–5255. [DOI] [PMC free article] [PubMed] [Google Scholar]
- Schoene‐Bake JC, Keller SS, Niehusmann P, Volmering E, Elger C, Deppe M, Weber B (2014): In vivo mapping of hippocampal subfields in mesial temporal lobe epilepsy: Relation to histopathology. Hum Brain Mapp, doi: 10.1002/hbm.22506. [DOI] [PMC free article] [PubMed] [Google Scholar]
- Shaw P, Kabani NJ, Lerch JP, Eckstrand K, Lenroot R, Gogtay N, Greenstein D, Clasen L, Evans A, Rapoport JL, Giedd JN, Wise SP (2008): Neurodevelopmental trajectories of the human cerebral cortex. J Neurosci 28:3586–3594. [DOI] [PMC free article] [PubMed] [Google Scholar]
- Sowell ER, Trauner DA, Gamst A, Jernigan TL (2002): Development of cortical and subcortical brain structures in childhood and adolescence: A structural MRI study. Dev Med Child Neurol 44:4–16. [DOI] [PubMed] [Google Scholar]
- Strange BA, Fletcher PC, Henson RNA, Friston KJ, Dolan RJ (1999): Segregating the functions of human hippocampus. Proc Natl Acad Sci USA 96:4034–4039. [DOI] [PMC free article] [PubMed] [Google Scholar]
- Suzuki M, Hagino H, Nohara S, Zhou S‐Y, Kawasaki Y, Takahashi T, Matsui M, Seto H, Ono T, Kurachi M (2005): Male‐specific volume expansion of the human hippocampus during adolescence. Cereb Cortex 15:187–193. [DOI] [PubMed] [Google Scholar]
- Tamnes CK, Østby Y, Fjell AM, Westlye LT, Due‐Tønnessen P, Walhovd KB (2010): Brain maturation in adolescence and young adulthood: Regional age‐related changes in cortical thickness and white matter volume and microstructure. Cereb Cortex 20:534–548. [DOI] [PubMed] [Google Scholar]
- Tamnes CK, Walhovd KB, Dale AM, Østby Y, Grydeland H, Richardson G, Westlye LT, Roddey JC, Hagler DJ Jr, Due‐Tønnessen P, Holland D, Fjell AM (2013): Brain development and aging: Overlapping and unique patterns of change. NeuroImage 68:63–74. [DOI] [PMC free article] [PubMed] [Google Scholar]
- Teicher MH, Anderson CM, Polcari A (2012): Childhood maltreatment is associated with reduced volume in the hippocampal subfields CA3, dentate gyrus, and subiculum. Proc Natl Acad Sci USA 109:E563–E572. [DOI] [PMC free article] [PubMed] [Google Scholar]
- Thompson CL, Pathak SD, Jeromin A, Ng LL, MacPherson CR, Mortrud MT, Cusick A, Riley ZL, Sunkin SM, Bernard A, Puchalski RB, Gage FH, Jones AR, Bajic VB, Hawrylycz MJ, Lein ES (2008): Genomic anatomy of the hippocampus. Neuron 60:1010–1021. [DOI] [PubMed] [Google Scholar]
- Thompson DK, Wood SJ, Doyle LW, Warfield SK, Egan GF, Inder TE (2009): MR‐determined hippocampal asymmetry in full‐term and preterm neonates. Hippocampus 19:118–123. [DOI] [PMC free article] [PubMed] [Google Scholar]
- Thompson DK, Omizzolo C, Adamson C, Lee KJ., Stargatt R, Egan GF, Doyle LW, Inder TE, Anderson, PJ (2014): Longitudinal growth and morphology of the hippocampus through childhood: Impact of prematurity and implications for memory and learning. Hum Brain Mapp, doi: 10.1002/hbm.22464. [DOI] [PMC free article] [PubMed] [Google Scholar]
- Toni N, Laplagne DA, Zhao C, Lombardi G, Ribak CE, Gage FH, Schinder AF (2008): Neurons born in the adult dentate gyrus form functional synapses with target cells. Nat Neurosci 11:901–907. [DOI] [PMC free article] [PubMed] [Google Scholar]
- Uematsu A, Matsui M, Tanaka C, Takahashi T, Noguchi K, Suzuki M, Nishijo H (2012): Developmental trajectories of amygdala and hippocampus from infancy to early adulthood in healthy individuals. PLoS ONE 7:e46970. [DOI] [PMC free article] [PubMed] [Google Scholar]
- Utsunomiya H, Takano K, Okazaki M, Mitsudome A (1999): Development of the temporal lobe in infants and children: Analysis by MR‐based volumetry. Am J Neuroradiol 20:717–723. [PMC free article] [PubMed] [Google Scholar]
- Van Leemput K, Bakkour A, Benner T, Wiggins G, Wald LL, Augustinack J, Dickerson BC, Golland P, Fischl B (2009): Automated segmentation of hippocampal subfields from ultra‐high resolution in vivo MRI. Hippocampus 19:549–557. [DOI] [PMC free article] [PubMed] [Google Scholar]
- van Praag H, Shubert T, Zhao C, Gage FH (2005): Exercise enhances learning and hippocampal neurogenesis in aged mice. J Neurosci 25:8680–8685. [DOI] [PMC free article] [PubMed] [Google Scholar]
- West MJ, Coleman PD, Flood DG, Troncoso JC (1994): Differences in the pattern of hippocampal neuronal loss in normal ageing and Alzheimer's disease. Lancet 344:769–772. [DOI] [PubMed] [Google Scholar]
- Wilke M, Krägeloh‐Mann I, Holland S (2007): Global and local development of gray and white matter volume in normal children and adolescents. Exp Brain Res 178:296–307. [DOI] [PMC free article] [PubMed] [Google Scholar]
- Yassa MA, Stark SM, Bakker A, Albert MS, Gallagher M, Stark CEL (2010): High‐resolution structural and functional MRI of hippocampal CA3 and dentate gyrus in patients with amnestic mild cognitive impairment. NeuroImage 51:1242–1252. [DOI] [PMC free article] [PubMed] [Google Scholar]
Associated Data
This section collects any data citations, data availability statements, or supplementary materials included in this article.
Supplementary Materials
Supplementary Information
Supplementary Information