

Abstract
Semantic processing is central to cognition and is supported by widely distributed gray matter (GM) regions and white matter (WM) tracts. The exact manner in which GM regions are anatomically connected to process semantics remains unknown. We mapped the semantic anatomical network (connectome) by conducting diffusion imaging tractography in 48 healthy participants across 90 GM “nodes,” and correlating the integrity of each obtained WM edge and semantic performance across 80 brain‐damaged patients. Fifty‐three WM edges were obtained whose lower integrity associated with semantic deficits and together with their linked GM nodes constitute a semantic WM network. Graph analyses of this network revealed three structurally segregated modules that point to distinct semantic processing components and identified network hubs and connectors that are central in the communication across the subnetworks. Together, our results provide an anatomical framework of human semantic network, advancing the understanding of the structural substrates supporting semantic processing. Hum Brain Mapp 36:3499–3515, 2015. © 2015 Wiley Periodicals, Inc.
Keywords: semantics, white‐matter network, module, connectomics, diffusion tensor imaging
INTRODUCTION
Semantic processing entails the access to general knowledge of objects, people, and facts in various contexts and is central to a wide range of cognitive processes. Decades of studies have investigated the cortical regions and major white matter (WM) tracts that support semantic processing. Functional neuroimaging studies during task and resting states and neuropsychological studies have converged to find that widely distributed left‐lateralized gray matter (GM) regions in the lateral and ventral temporal, inferior parietal, and inferior and medial frontal cortices are implicated in this process [Binder et al., 2009; Dronkers et al., 2004; Mahon and Caramazza, 2009; Martin, 2007; Wei et al., 2012]. In diffusion tensor imaging (DTI) and electrostimulation studies on healthy and brain‐damaged patients, several major WM pathways have been observed to support semantics, including the left inferior fronto‐occipital fasciculus (IFOF; also referred to as the extreme capsule fiber system), the left uncinate fasciculus (UF), and the left anterior thalamic radiation (ATR), such that the disruptions of these tracts have been associated with inferior semantic processing abilities [Acosta‐Cabronero et al., 2010, 2011; Aralasmak et al., 2006; de Zubicaray et al., 2011; Duffau et al., 2002, 2005; Friederici and Gierhan, 2013; Han et al., 2013].
A critical gap between these GM findings and the WM pathway findings is that their correspondence is elusive, and the most crucial information—the precise GM regions that are anatomically connected to process semantics—has rarely been tested directly, but rather through various deductions. The major WM pathways that are commonly studied and identified are composed of large numbers of fiber bundles connecting large numbers of GM areas, with the exact terminations controversial and various subcomponents with distinct functions being identified [Catani and Thiebaut de Schotten, 2008; Fernández‐Miranda et al., 2008; Martino et al., 2010; Sarubbo et al., 2013]. For instance, these previously identified semantic‐associated WM tracts, such as the IFOF, UF, and ATR, all connect frontal regions with other cortices, but it is not known whether it is the same frontal regions that connect these different systems for semantics. Several studies performed WM tracking between specific GM regions of interest, defined from lesions or task‐based functional MRI studies, and found WM pathways, including the IFOF, arcuate fasciculus (AF), middle, inferior longitudinal fasciculi, the transcallosal, and a ventral pathway via the extreme capsule among these regions [Binney et al., 2012; Graves et al., 2014; Saur et al., 2008; Turken and Dronkers, 2011]. Kümmerer et al., [2013] subsequently reported a negative correlation between the lesion volume in the tract that connected anterior/posterior middle temporal gyrus with ventrolateral prefrontal cortex and semantic performance, indicating a critical role of the WM pathway among these ventral cortical regions in semantic processing. These studies significantly advanced the understanding of the anatomical properties of the semantic anatomical connections. However, the fiber tract of interest spanned multiple regions, and the specific connections between GM node pairs that support semantics remained unplotted. With such a gap, a semantic WM network has yet to be constructed.
An anatomical network, or connectome [Sporns et al., 2005], for semantic processing can be constructed if both the WM connections (edges) and the GM regions (nodes) that they connect are elucidated. Once such a network is mapped, graph analyses can be performed to characterize its underlying topological architecture [Bullmore and Sporns, 2009; He and Evans, 2010], including the potential anatomical/functional subdivisions (i.e., modules), which may in turn shed light on the anatomical substrate of cognitive components within the semantic system.
The goal of the current study is to construct an anatomical network (connectome) for object semantic processing, on the basis of which we could understand the specific communication patterns across GM regions in support of semantics, including the potential subdivisions. We first tracked WM connections (edges) among 90 GM regions (nodes, based on Automated Anatomical Labeling [AAL] atlas) using diffusion imaging data from 48 healthy participants. This network contained 688 WM “edges” across 90 GM “nodes.” We then tested the relationship between the integrity of the WM edges (lesion volume from structural imaging and mean fractional anisotropy [FA] from diffusion imaging) and semantic performance across 80 brain damaged patients. Such analyses render WM edges necessary for semantic processing, and the GM nodes that they connect are elucidated. Finally, to understand whether the semantic WM network is further organized by subcomponents, we performed graph analyses to detect the potential modular partition of the semantic WM network. The analysis scheme is shown in Figure 1.
Figure 1.
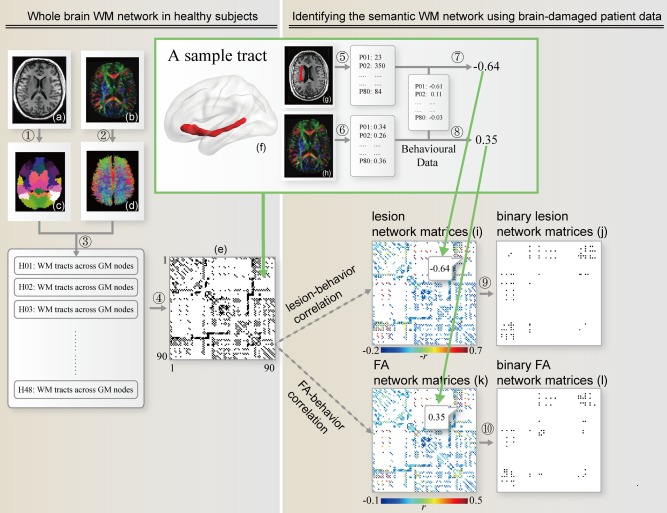
A flowchart for the construction of the semantic WM network. ① Transforming the AAL atlas in the MNI space to the native diffusion space by applying the inverse transformation obtained from the native T1‐weighted image (a), resulting in a subject‐specific AAL mask in the DTI native space (c). ② Reconstructing all WM fibers (d) in the whole brain from the native FA image (b) using DTI deterministic tractography. ③ Determining the WM fibers connecting every pair of gray matter regions for each healthy subject. All tracts in the native space were transformed to the MNI space. ④ Identifying the network matrix (e, black: 1; white: 0) and building binary tract maps. The inset shows a 3D view of an exemplar tract map (f), which connects the orbital part of the inferior frontal gyrus and the middle temporal gyrus. ⑤ Calculating the lesion volume in a tract for each patient by overlapping the binary tract map with the lesion image (g) in the MNI space. ⑥ Calculating the mean FA in a tract for each patient by overlapping the binary tract map with the FA image (h) in the MNI space. ⑦ ⑧ Correlating the lesion volumes/FA values and the semantic PCA score (extracted from eight behavioral tasks), controlling for confounding variables (see Method for details) in each tract and constructing weighted lesion network matrices (i) and FA network matrices (k) using partial correlation coefficients. ⑨ ⑩Transforming the weighted network matrices into binary network matrices by applying statistical thresholds (FDR corrected qs < 0.05), resulting in 41 semantic tracts in the lesion network matrices (j) and 36 tracts in the FA network matrices (l). [Color figure can be viewed in the online issue, which is available at http://wileyonlinelibrary.com.]
MATERIALS AND METHODS
Participants
Forty‐eight healthy subjects and 80 patients with brain damage participated in the present study. Neuroimaging data for both subject groups were collected using identical procedures, and behavioral data were collected for patients. All participants were native Chinese speakers, were paid for their participation, and provided informed written consent. This study was approved by the Institutional Review Board of the State Key Laboratory of Cognitive Neuroscience and Leaning, Beijing Normal University.
Healthy participants
For the 48 healthy subjects (25 males), the mean age was 50 years (SD = 11; range: 26‐72 years), and mean years of formal education was 13 (SD = 4; range: 6‐22). They were recruited from patients’ acquaintances and the local community, had normal or corrected‐normal vision and hearing, and had no history of psychiatric or neurological diseases. The Chinese version of the Mini‐Mental State Examination (MMSE) [Folstein et al., 1975] was administered as a measure of general cognitive state (mean = 28.46; SD = 1.35; range: 24–30). All subjects were right handed, with laterality quotient [LQ = (R – L)/(R + L) × 100] higher than 40 [Edinburgh Handedness Inventory, Oldfield, 1971].
Patients
Eighty patients with brain damage (see Supporting Information Table 1 for details; 60 males) were recruited from the China Rehabilitation Research Center with the following inclusion criteria: no previous brain injury; at least 1 month post‐onset (mean = 6.09 months; SD = 11.69; range: 1–86 months; number of patients in the chronic phase, that is, > 4 months postonset: 41; we did not have exact post onset time information of five patient and all reported to be longer than 1 month); no other neurological or psychiatric disease; able to follow task instructions; and premorbidly right handed. The majority suffered from stroke (n = 67), and others suffered from traumatic brain injury (n = 13). The patients’ mean age was 45 years (SD = 13; range: 19–76 years), and mean years of formal education was 13 (SD = 3; range: 2–19). The mean score on the MMSE was 21.90 (SD = 7.58; range: 3–30). The patients and healthy groups were comparable in education years (t = −0.29, P = 0.77) and different in age (t = −2.135, P = 0.04) and gender distributions (χ2(1) = 7.1, P = 0.01).
Behavioral Data Collection
The semantic processing abilities of patients were determined using PCA based on eight cognitive tasks that vary in the degree of semantic involvement and input/output modalities (visual and auditory; verbal and nonverbal): oral picture naming, oral naming to definition, oral sound naming, picture associative matching, word associative matching, word‐picture verification, oral word repetition and oral word reading. The details of each task and procedures are presented in Supporting Information Methods. The semantic PCA factor was defined as a component that had a high loading weight on the tasks in which semantic processing is highly relevant (oral picture naming, oral sound naming, oral naming to definition, picture associative matching, word associative matching, and word‐picture verification) relative to those tasks in which semantic processing is not central (oral word reading and oral word repetition). The semantic PCA score was computed as the linear combination of the standardized task scores and factor score coefficients. The nonverbal semantic task (picture associative matching) was also analyzed separately for validation purpose.
Imaging Data Collection
Each subject was scanned using a 1.5 T GE SIGNA EXCITE scanner with 8‐channel split head coil at the China Rehabilitation Research Center. We collected three types of images: (1) high‐resolution 3D T1‐weighted MPRAGE images in the sagittal plane with a matrix size = 512 × 512, voxel size = 0.49 × 0.49 × 0.70 mm3, repetition time = 12.26 ms, echo time = 4.2 ms, inversion time = 400 ms, field of view = 250 × 250 mm2, flip angle=15°, and slice number = 248 slices; (2) FLAIR T2‐weighted images in the axial plane with a matrix size = 512 × 512, voxel size = 0.49 × 0.49 × 5 mm3, repetition time = 8002 ms, echo time = 127.57 ms, inversion= 2 s, field of view = 250 × 250 mm2, flip angle = 90°, and slice number = 28 slices; and (3) diffusion‐weighted imaging with two separate sequences with different diffusion weighting direction sets. The parameters for the first acquisition were 15 diffusion weighting directions, matrix size = 128 × 128, voxel size = 1.95 × 1.95 × 2.6 mm3, repetition time = 13000 ms, echo time = 69.3 ms, inversion time = 0 s, field of view = 250 × 250 mm2, flip angle = 90°, and slice number = 53 slices. The other acquisition had the same parameters but included 17 different directions. The first two volumes were b0 volumes, and the b‐value of the other volumes was 1000 s/mm2 in each sequence. All of the sequences except the FLAIR T2 images were scanned twice to improve the quality of the images.
Imaging Data Preprocessing
Structural MRI data
We first coregistered the two T1 images using a trilinear interpolation method in SPM5 (http://www.fil.ion.ucl.ac.uk/spm/software/spm5) and then averaged them. The FLAIR T2 images were coregistered and resliced to the native space of the averaged T1 images. Two trained personnel manually drew each patient's lesion contour on averaged T1 images slice‐by‐slice, visually referring to the FLAIR T2 images. Both investigators reached a reasonable degree of inter‐rater reliability with an experienced radiologist during the training phase (mean percentage volume difference, 9% ± 8% and 4% ± 3%; mean percentage of discrepant voxels, 7% ± 4% and 6% ± 2%, with discrepant voxels defined as two voxels from the other manually drawn lesion volume [Fiez et al., 2000]. The lesion drawing of each patient was double checked by the radiologist. To deal with the challenges in registration of brains with lesions, we applied a two‐step method including the manual registration and the automated non‐linear transformation First, each patient's structural images were resliced into 1 × 1 × 1 mm3 voxels and then manually normalized into Talairach space via the “3D Volume Tools” in BrainVoyager QX v2.0 (http://www.brainvoyager.com), and the manual registration was completed on the 3D visual interface. Then, we used the ANTs software (Advanced Normalization Tools, http://www.picsl.upenn.edu/ANTS/) to estimate the affine transformation between the native and Talairach spaces, which was further applied to transform the lesion masks into the Talairach space using the “WarpImageMultiTransform” program. The lesion masks were then transformed into Montreal Neurological Institute (MNI) space. We manually checked the registration quality for each subject.
Diffusion MRI data
For the diffusion‐weighted imaging data of each participant, we first merged each of the 15 directions and 17 direction‐paired sequences into a single 4D image and then preprocessed the images, as typically performed using PANDA [Cui et al., 2013] (http://www.nitrc.org/projects/panda/). The pre‐processing procedure included (1) BET, skull removal; (2) Eddycorrect, correction of eddy current distortion; (3) DTIFIT, building diffusion tensor models and obtaining the FA maps; and (4) Registration of all the individual images to MNI space with target voxel size of 2 × 2 × 2 mm3.
Constructing the Whole‐Brain WM Network Using Data From Healthy Participants
We followed the approach used by Gong et al. [2009] to construct the whole brain anatomical network.
Gray‐matter node selection
We adopted the AAL atlas [Tzourio‐Mazoyer et al., 2002] to define GM (cortical and subcortical) nodes for our network construction. This atlas was chosen for our anatomical network study because it is an anatomy (gyrus/sulcus)‐based GM parcellation template and is commonly used in patient studies [Caeyenberghs and Leemans, 2014; Cao et al., 2014; Lo et al., 2010; Zhang et al., 2011]. We parceled the entire cerebral GM into 90 regions to define GM (cortical and subcortical) nodes for our network construction. We dilated (thickened) each of the regions by three voxels (voxel size: 2 × 2 × 2 mm3) using the “fslmaths” tool of FSL (http://www.fmrib.ox.ac.uk/fsl/data/atlas-descriptions.html#wm). For the pairs of regions whose intervals fewer than six voxels, the dilation stopped once the two regions touched so that different regions did not have overlapping voxels. For each individual, the 90 dilated nodes in MNI space obtained were masked and then transformed back to the native diffusion space, with each representing a network node.
White‐matter connections extracted from diffusion MRI tractography
Deterministic tractography was performed in the native diffusion space for each healthy participant using the FACT tracking algorithm [Mori et al., 1999]. Fiber tracking was terminated when the angle between two consecutive orientations was greater than 45° or when the FA value was smaller than 0.20. Given that the outcome of tractography is affected by the initial position of the seed points within the voxel [Cheng et al., 2012], 100 seeds were randomly selected within each voxel to avoid biases from initial seed positioning.
For every two AAL region masks, the tracts were filtered out as connecting the two regions if one of their endpoints terminated within one region and the other endpoint terminated within the other region. In total, 4,005 regional pairs were determined. For each node pair (regions a and b), the filtered‐out tract (if it existed) was projected onto the voxels in the native diffusion space, resulting in a binary map. This binary map was further transformed to MNI space. The binary maps of the MNI space for all subjects were then overlaid to generate a count map, in which the value of each voxel represented the number of subjects who had WM fibers in that area. Finally, a group‐level threshold was set at voxel value > 25% of subjects (i.e., 12 subjects); cluster size > 300 voxels (2,400 mm3), which was used to determine whether the node pair was anatomically connected. The procedure was repeated for all of the 4,005 node pairs, with 688 pairs passing the threshold and therefore being considered directly connected by WM tracts (Figure 2A).
Figure 2.
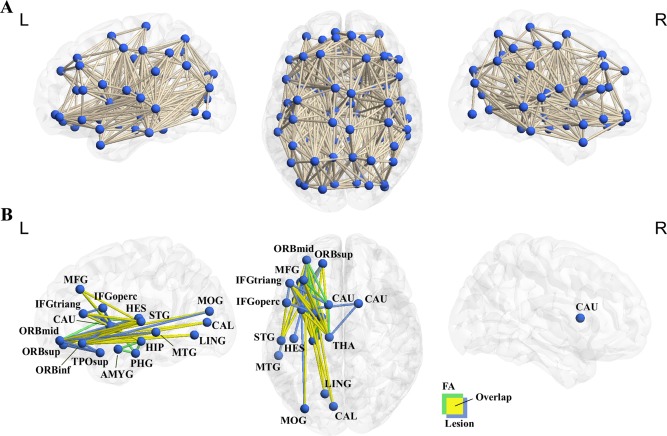
Whole brain anatomical network and the semantic anatomical network. (a) Six hundred and eighty‐eight WM tracts were successfully tracked between the 90 AAL regions in 48 healthy adults, resulting in a whole‐brain anatomical network. (b) The WM tracts whose integrity values (lesion volume or mean FA value) significantly correlated with the semantic PCA scores across 80 patients, regressing out demographic variables and lesion volume variables (FDR corrected qs < 0.05). Most semantic tracts (24 tracts) were observed in both lesion volume and FA analyses (yellow); 17 were significant only in the lesion volume analysis (blue); 12 only in the FA analysis (green; see Supporting Information Table 3 for details). These edges and the gray matter nodes they connect constitute the semantic anatomical network. The network was visualized using in‐house BrainNet Viewer [Xia et al., 2013]. [Color figure can be viewed in the online issue, which is available at http://wileyonlinelibrary.com.]
Identifying Semantic Anatomical Networks Using Brain‐Damaged Patient Data
Tract integrity (lesion volume and mean FA) and semantic performance correlation analyses
The main procedures are shown in Figure 1. To elucidate which of the between‐node tracts identified in healthy controls (in total 688) are related to semantic processing, we correlated two types of measures of the tract integrity and semantic performances across patients: lesion volume, reflected by structural imaging, and the FA value, reflected by diffusion imaging. Only tracts with more than five patients with lesions were included in the lesion volume analyses. Demographic variables, including age, gender, and education level were always included as covariates in the analyses. Additionally, the whole brain lesion volume (total number of damaged voxels in the whole brain excluding the two connecting nodes) and the lesion volume of the two GM nodes (number of damaged voxels in each node) were included as covariates to reveal specific effects of the WM tracts. The false discovery rate (FDR), with a threshold of q < 0.05, was adopted to correct for multiple comparisons.
Overlaps with major WM tracts
To understand how the observed semantics‐related WM tracts may converge with the classical major tracts, we calculated the extent of overlay for each observed tract with conventional WM tracts in the ‘JHU WM tractography atlas’ from FSL. The 25%‐threshold subtemplate was used, which contained 20 major tracts [see Han et al., 2013 for details]. Each of observed tracts and atlas tracts was masked. The overlay percentage of each observed tract with each atlas tract was computed using the formula: (the number of common voxels between the observed tract and the atlas tract)/(the total number of voxels in the atlas tract). Observed tracts with more than 5% of overlay percentages were presented (Supporting Information Table 3).
Controlling for the effects of types and post‐onset time of brain damage
Because we included both stroke and traumatic brain injury patients, we examined whether the semantic tracts identified above were influenced by the type of brain damage by performing two further analyses. In the first analysis, we computed partial correlations between the patients’ semantic PCA scores and lesion volume or mean FA values, with lesion type as an additional covariate. Lesion type was coded as 1 for stroke and 2 for trauma. In a second analysis, we computed the lesion volume and FA‐behavior correlation in only the 67 stroke patients. The threshold was set at FDR correction q < 0.05 (corrected across all 688 WM tracts). In both analyses other confounding variables were also controlled for (demographic variables, the whole brain lesion volume, and the lesion volumes of the two GM nodes). Given the large variation in terms of post‐onset time of brain damage (1–86 months), we further excluded potential confounding effects of this variable by correlating the patients’ semantic PCA scores and lesion volume or mean FA values with covariates being the time post‐onset (month), the demographic variables, the whole brain lesion volume, and the lesion volumes of the two GM nodes.
Testing the relative specificity of the semantic anatomical network
To examine the extent to which the observed WM tracts were specifically relevant for semantic processing, we computed the partial correlation coefficients between semantic PCA scores and lesion volumes or mean FA values with patients’ performances on two cognitive tasks in which semantic involvement was not central (oral word reading and oral word repetition) as covariates in addition to the other confounding variables. The threshold was set at FDR correction q < 0.05 (corrected across all 688 WM tracts).
Characterizing the Semantic Anatomical Network Using Graph Analysis
In this section, we applied graph‐analysis measures to characterize the modular pattern of the semantic network to determine whether the semantic network is composed of relatively independent sub‐components (modules). First, we reconstructed the semantic anatomical network comprising all semantic‐tracts found in the above lesion‐ and/or FA‐ analyses. Then, we transformed the network as a binary and undirected graph, where edges represented semantic‐related WM tracts and nodes represented the GM regions that these WM tracts connected. To evaluate the stability of the critical nodes and network modular pattern, we considered semantic networks that were derived from two additional thresholds in addition to the current threshold in the lesion‐ and FA‐behavior correlation analyses (FDR corrected, q < 0.05, equaling uncorrected P < 0.0028 in lesion analysis and P < 0.0026 in FA analysis): a more stringent threshold (uncorrected P < 0.001) and a more liberal threshold (uncorrected P < 0.01).
We partitioned the semantic anatomical network into subnetworks using Newman's spectral optimization algorithm [Newman, 2006]. Modularity (Q) is a measure that compares the number of within‐module and between‐module connections to reveal the strength of a graph's modular organization, and the maximum Q is used to choose an appropriate division of the network. Intramodularity and intermodularity are identified after the division of the network. To test whether the modular Q was significantly higher than random networks, ten thousand random networks were constructed. Each of the random networks was constructed to have the same number of nodes and edges and the same degree distribution as the actual network using Maslov's wiring algorithm [Maslov and Sneppen, 2002]. A Z score was then generated by the Q in the real network relative to the Q in the random networks to determine the significance level.
After various modules within the semantic networks were identified, we elucidated the roles of each node in the communication across different modules by computing their participation coefficient (PC) [Guimera and Nunes Amaral, 2005]:
where ki is the total number of connections of node i and kis is the number of connections between node i and nodes in module s. The PC value is 0 when the connections of a node are restricted to one module and 1 when all of the connections of a node are with other modules. The modularity analysis and the PC scores were computed using the “Network ‐ Modularity” package and the “gretna_parcoeff” function in Gretna toolkit, respectively (http://www.nitrc.org/projects/gretna/).
RESULTS
Behavioral Results
The semantic processing abilities of patients were determined using principal component analysis [Jolliffe, 2002], which was based on eight cognitive tasks varying in the degree of semantic involvement and input/output modalities (Supporting Information Table 2). The Kaiser–Meyer–Olkin measure of sampling adequacy (0.87) and Bartlett's test of sphericity (χ2(28) = 560, P < 0.001) showed that the behavioral dataset was suited for PCA analysis (Supporting Information Table 2). Two components show eigenvalues > 1 and were extracted: Component 1 accounted for 40% of the model variance (under varimax rotation), with the five oral production tasks having higher loading values (0.74–0.80) and the three tasks that did not require oral production having lower loading values (−0.01 to 0.34). We thus labeled this component as the oral production component. The second component accounted for 39% of the model variance, with the six semantic tasks (oral picture naming, oral naming to definition, oral sound naming, picture associative matching, word associative matching, and word‐picture verification) having higher loading values (0.51–0.87) and the two non‐semantic tasks (oral word reading, oral word repetition) having lower loading values (−0.13 to 0.33). We considered this component to be the semantic component and derived scores for each patient's semantic processing ability based on this component. The remaining components (3–8) had eigenvalues below one and did not show any trend associating with semantic processes. Note that five of the six semantic tasks involve language (word) processing, a caveat to consider is that the semantic component may primarily be driven by lexical‐semantic processes. We thus also carried out the main brain‐behavior analyses using the nonverbal semantic task—picture associative matching—for validation. Moreover, given that PCA results may be influenced by the tasks being included, we further conducted a PCA analyses including two additional perceptual tasks (face verification and the visual form perception from the size match task A of Birmingham object recognition battery) [Riddoch and Humphreys, 1993] to maximize the variation in degree of reliance on various processing components. In face verification, stimuli were six male faces, each with three different views. The participants were asked to judge whether the two faces had the same identity by touching the “yes” or “no” bottom on the screen (70 trials); in visual form perception, two circle dots with same or different sizes were presented on the screen. The participants were asked to judge whether the two dots were the same sizes by touching the “yes” or “no” bottom on the screen (35 trials). In this new PCA analysis, we obtained three components, one had high loading on the semantic tasks and was identified as the semantic component. The correlation between this component and the “semantic PCA factor” obtained with the 8 tasks was extremely high (r = 0.95), consolidating our PCA results, and thus we used the PCA scores with the 8 tasks in the brain‐behavior analyses for simplicity.
Identifying the Semantic WM Network Using Brain‐Damaged Patient Data
We tested which of the 688 tracts among the 90 AAL regions are crucial for semantic processing by correlating the tract integrity (lesion volume and mean FA values) and semantic PCA scores across the 80 brain‐damaged subjects. The lesion overlap map derived from structural scans is displayed in Figure 3 and shows wide distributions covering most WM and GM areas, with most patients having lesions in the bilateral insula and its surrounding WM tissues. Among the 673 tracts that had more than five patients with lesions, 106 (16%) had more than 50% of patients with lesions, 276 (41%) had 30–50% of patients with lesions, and 275 (41%) had 10‐–30% of patients with lesions.
Figure 3.
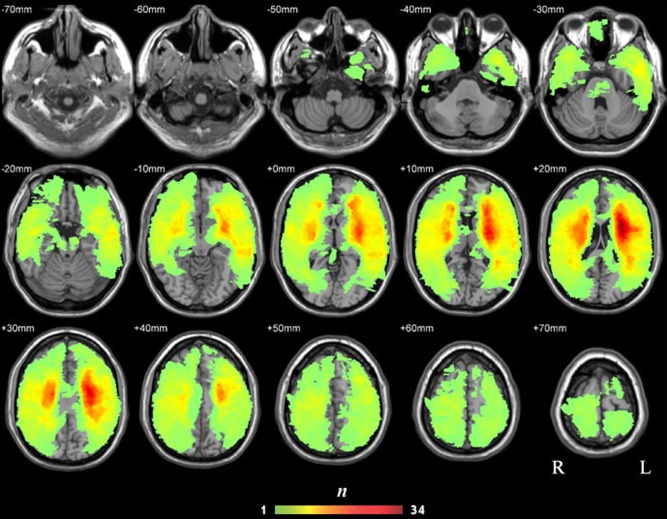
Lesion overlap map of the 80 patients (the n value of each voxel denotes the number of patients with lesions on that voxel). [Color figure can be viewed in the online issue, which is available at http://wileyonlinelibrary.com.]
The results of the correlation analyses between tract integrity measures (lesion volume and mean FA values) and semantic PCA scores for the 673 tracts are presented in Figure 2B and Supporting Information Table 3.
Lesion volume‐behavior correlation
The lesion volume of 41 WM tracts significantly negatively correlated with semantic PCA scores across patients when the effects of demographic variables (age, gender, and education level) and whole brain lesion volume, as well as lesion volumes on the GM nodes were partialed out (partial rs: −0.35 to −0.71; FDR corrected qs < 0.05). Larger lesions were associated with more severe semantic deficits. There were five intra‐lobe tracts (one connecting frontal lobe regions and four connecting subcortical regions) and 36 interlobe tracts (15 connecting frontal and subcortical regions, 13 connecting frontal and temporal regions, six connecting frontal and occipital regions, and two connecting temporal and subcortical regions). By overlaying our results with the major WM tract mask in the JHU tractography atlas, we found that the 41 tracts observed here were mainly located on three left hemisphere major tracts: the ATR (94% overlapping voxels), the UF (89%), and the IFOF (88%). Minimal overlaps were found with the left inferior longitudinal fasciculus (ILF, 7%) and the left superior longitudinal fasciculus (SLF, 6%) (Supporting Information Table 3). Note that JHU atlas, the SLF were divided into “Superior longitudinal fasciculus” and “Superior longitudinal fasciculus (temporal part),” and we found the effects of SLF, not the SLF (temporal part) here and hereafter.
Mean FA‐behavior correlation
The mean FA value of 36 WM tracts significantly positively correlated with semantic PCA scores across patients, with the effects of demographic variables (age, gender, and education level) and lesion volumes of the whole brain and of the two connecting nodes partialed out (partial rs: 0.35 to 0.55, corrected qs < 0.05). Lower mean FA values were associated with poorer semantic performances. All tracts were left lateralized, with seven intralobe tracts (three connecting temporal regions and four connecting subcortical regions) and 29 inter‐lobe tracts (12 connecting frontal and subcortical regions, nine connecting frontal and temporal regions, five connecting frontal and occipital regions, and three connecting temporal and subcortical regions). The tracts were predominantly located on the left ATR (100% overlapping voxels), cingulum (hippocampus) (94%), IFOF (85%), UF (47%) and corticospinal tract (46%), and minimally on the minor forceps (5%) and ILF (7%).
Convergence between Lesion‐ and FA‐behavioral analyses and with the nonverbal semantic task
Twenty‐four tracts showed significant effects (FDR corrected qs < 0.05) in both the lesion volume and the mean FA analyses (Supporting Information Table 3): one tract connecting subcortical regions and 23 interlobe tracts, including eight connecting frontal and subcortical regions, nine connecting frontal and temporal regions, five connecting frontal and occipital regions and one connecting temporal and subcortical regions. Seventeen tracts were significant in only the lesion analyses and 12 in only the FA analyses, and were likely to reflect properties that were more sensitive to one specific measure. For instance, lesion analyses address properties of WM tract integrity beyond FA; FA values may capture the influence of lesion on intact voxels in a WM tract. We thus treated the union of the two measures, resulting in 53 WM tracts whose integrity is associated with semantic PCA score in either of the analyses. These 53 tracts were located on four major left tracts on the JHU tractography atlas: the ATR (90%, overlay percentage), IFOF (85%), UF (47%), and ILF (5%). Note that several language‐relevant tracts like the middle longitudinal fasciculus or the AF were not included in the JHU tractography atlas, and thus the correspondences were not tested.
When the nonverbal semantic task—picture associative matching—was considered on its own, its scores significantly correlated with 36 tracts in the lesion analysis (partial rs: partial rs −0.34 to −0.63, corrected qs < 0.05) and 53 tracts in the FA analysis (partial rs 0.34 to 0.53, corrected qs < 0.05). In total 58 WM tracts were significant in either the lesion volume or FA analyses, 50 of which overlapped the ones found with the semantic PCA scores analyses (Supporting Information Figure 1), suggesting that the results obtained with the semantic PCA score were not likely driven by only lexical variables but rather reflected semantic processing more generally.
Controlling for the types and the post‐onset time of brain damage
There was no systematic difference in the semantic PCA scores across stroke and traumatic brain injury patients (t = 0.30, P = 0.76). When lesion type was included as a covariate in addition to the demographic variables (age, gender, and education level) and the lesion volumes of the two nodes and whole brain, the effects in the tracts observed above remained significant. For the 41 tracts obtained in the lesion analyses, the partial correlation coefficients between lesion volume and semantic scores were −0.35 to −0.71 (corrected qs < 0.05); for the 36 tracts obtained in the FA analyses, the partial correlation coefficients between mean FA values and semantic scores were 0.35 to 0.55 (corrected qs < 0.05; Supporting Information Table 3). The pattern persisted at an uncorrected threshold when we considered only the 67 stroke patients (lesion volume tracts: partial rs: −0.31 to −0.76, uncorrected Ps < 0.01; mean FA: partial rs: 0.33 to 0.59, uncorrected Ps < 0.01). When included the post‐onset time as a further covariate in addition to the demographic variables (age, gender, and education years) and the lesion volume of the two nodes and the whole brain, the overall pattern remained. For the 41 tracts of lesion analyses, the partial correlation coefficients between lesion volume and semantic scores were −0.22 to −0.62 (uncorrected Ps < 0.07). For the 36 tracts in the FA analyses, the partial correlation coefficients between mean FA values and semantic scores were 0.24 to 0.43 (uncorrected Ps < 0.05). Virtually identical results were obtained when all the potentially confounding variables (the types and the post‐onset time of brain damage, the demographic variables and the lesion volume of the two nodes and whole brain) were controlled together in one model.
Testing the relative specificity of the semantic tracts
We examined whether the semantic‐relevant tracts obtained above were at least relatively specific to semantic processing, as opposed to cognitive processing in general, by considering the two tasks (word reading and repetition) in which semantic involvement was not central and the semantic component loadings were lower. When the scores on these two tasks were included as covariates in addition to demographic variables (age, gender, and education level) and lesion volume values of the two nodes and the whole brain, the correlation with semantic composite scores remained significant for both the 41 tracts obtained in the lesion analyses (partial rs between the semantic score and lesion volume: −0.36 to −0.66, corrected qs < 0.05) and the 36 tracts obtained in the FA analyses (partial rs between the semantic score and mean FA: 0.35 to 0.61, corrected qs < 0.05; Supporting Information Table 3).
Finer analyses within the temporal gyrus
We used the AAL template in the study because it is widely used in the brain structural connectome research, allowing us to compare our results with the literature [Gong et al., 2009; He et al., 2009; Lo et al., 2010]. There is an important concern that AAL regions are rather large and may contain heterogeneous functional subregions. In the context of semantic processing, looking within the temporal regions further is particularly motivated because the roles of anterior and posterior middle/superior temporal regions have been highlighted in past research and yet in AAL template MTG spans widely on the anterior–posterior axis (STG: MNI y = −60 to 16; MTG: MNI y = −82 to 16; excluding temporal pole area which is a specific AAL region). We thus carried out an analysis dividing the STG and MTG into halves (STG: MNI y = −22; MTG: MNI y = −33) to check whether the six semantic‐relevant WM tracts from left STG and MTG we obtained originated from the middle or posterior parts. Deterministic tracking from subdivided regions revealed two WM tracts using the original group‐level threshold (cluster size > 300 voxels, voxel value > 12 subjects), between the posterior MTG and orbital part of inferior frontal gyrus, between the middle part of STG and orbital part of inferior frontal gyrus. At a slightly lower threshold (cluster size > 150 voxels, voxel value > 10 subjects), eight tracts were obtained: the posterior MTG connecting with the orbital parts of inferior/middle frontal gyrus, both middle and posterior STG connecting with the frontal lobe (the middle STG connects the orbital parts of inferior/middle/superior frontal gyrus; the posterior STG connects orbital parts of inferior/middle frontal gyrus and triangular part of inferior frontal gyrus). We then tested the role of these tracts in semantic processing and found that the lesion volume of these tracts significantly negatively correlated with the semantic PCA factor (partial rs: −0.54 to −0.68; P < 0.001), the mean FA value of these tracts significantly positively correlated with the semantic PCA factor (partial rs: 0.29 to 0.45; P < 0.05), when the confounding variables were included as covariates. These results converge with the literature about the important roles that posterior MTG and large portion STG play in semantic processing [e.g., Binder et al., 2009; Dronkers et al., 2004; Turken and Dronkers, 2011].
Topological Characteristics of the Semantic Anatomical Network
The 53 WM tracts showing effects in semantic processing observed in the lesion volume and/or FA‐behavior analyses above and the 22 GM regions with which they connect form a WM anatomical network (Fig. 2B). Using graph analysis, we can characterize the network's topological properties, including its subcomponents (modules) and hub nodes (connectors) for communication between different modules [Bullmore and Sporns, 2009]. A binary network was reconstructed for this purpose.
Modularity analysis (Newman's spectral optimization algorithm, [Newman, 2006] showed that the semantic anatomical network could be subdivided into three separate modules (Fig. 4A, Q = 0.27; Z score = 2.30, P < 0.028 relative to 10,000 random networks). The network contained 34 intramodule and 19 intermodule connections. The first module (labeled as the orbital frontal‐temporal/occipital module) comprised edges connecting the orbital part of the frontal lobe with the (posterior) temporal or occipital lobes. The second module (the opercular/triangular/middle frontal‐subcortical module) mainly contained tracts connecting prefrontal regions with subcortical regions (thalamus, putamen, and caudate). The third module (medial temporal lobe [MTL] module) contained tracts mainly within the limbic system, especially the MTL (hippocampus, amygdala, parahippocampal gyrus and pallidum). To identify connector nodes that are important in communication across these different modules, we further computed PC for each node. The results are shown in Figure 4B. Six regions had PC values higher than 1 SD (PC > 0.56), including hippocampus, orbital part of the superior frontal gyrus, insula, pallidum, orbital part of the middle frontal gyrus, and thalamus, indicating that they are important in integration across modules.
Figure 4.
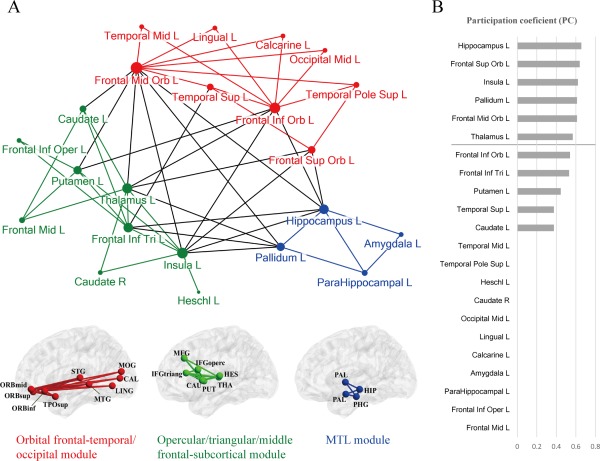
The results of the graph analysis for the semantic anatomical network. (a) Three separate modules shown on a two‐dimensional pseudostructural map and a three‐dimensional structural brain. The edges and nodes are colored according to their module membership. The radius of each node denotes its degree value. (b) The participation coefficients of the network nodes, ranked by value. The line denotes > 1 SD. [Color figure can be viewed in the online issue, which is available at http://wileyonlinelibrary.com.]
Validation analyses
To confirm that our results are robust across various threshold settings, in addition to the conventional threshold adopted above in the lesion‐ and FA‐ behavior correlation analyses (FDR corrected qs < 0.05, corresponding to an uncorrected P < 0.0028 in lesion analysis and P < 0.0026 in FA analysis; with 22 nodes and 53 edges), we performed the same graph analyses at a more stringent threshold (uncorrected P < 0.001, with 21 nodes and 46 edges) and a more liberal threshold (uncorrected P < 0.01, with 27 nodes and 67 edges). The modularity and connectors results were largely consistent across these different thresholds (Supporting Information Figure 2), with the exception that at the more liberal threshold the opercular/triangular/middle frontal‐subcortical module further split into two components.
DISCUSSION
Combining the structural and diffusion imaging data of healthy subjects and patients with brain damage, we mapped the WM anatomical networks of semantic processing. We first performed deterministic fiber tracking in 48 healthy participants among 90 AAL GM regions, obtaining 688 WM tracts connecting these GM nodes. Across 80 patients with brain damage, we found that the integrity of 53 tracts associated with semantic performance, such that greater lesion and/or lower mean FA values correlated with more severe semantic deficits. Most tracts are left lateralized, densely connecting inferior and middle prefrontal regions with temporal, occipital, and subcortical regions. The effects of these WM tracts could not be attributed to the effects of GM lesions, total lesion volume, type of brain damage, or cognitive abilities in general. Using graph analyses on the constructed WM network, we observed that the semantic anatomical network could be partitioned into three modules: an orbital frontal‐temporal/occipital module, an opercular/triangular/middle frontal‐subcortical module and an MTL module, with hippocampus, insula, middle frontal gyrus, and thalamus being important in integration across modules.
Our results are consistent with the rich literature on the involvement of several major WM pathways necessary for semantic processing—the left IFOF, ATR, and UF [Acosta‐Cabronero et al., 2011; Agosta et al., 2010; Aralasmak et al., 2006; de Zubicaray et al., 2011; Duffau, 2008; Duffau et al., 2002, 2005, 2009, 2013; Friederici and Gierhan, 2013; Han et al., 2013; Mandonnet et al., 2007]. The semantic‐relevant WM edges showed the greatest overlap with these pathways. While the GM endpoints of these large WM pathways are diverse and ambiguous, our study elucidated the effects of WM connections among specific GM regions underlying semantic processing. While the IFOF, ATR, and UF all connect the frontal lobe with other regions, our results show that the temporal and occipital regions connected with the orbital inferior frontal part of the frontal cortex (part of the IFOF and UF), and the subcortical regions connected with the opercular/triangular/middle part of the frontal cortex (ATR), to support semantics. Our analyses also revealed smaller tracts that are not fully covered by the major WM pathways, showing the effects of connections between the hippocampus and parahippocampal gyrus and the amygdala and pallidum. These results, combined with the previous understanding of the functions of finer regions within the frontal and temporal cortices, allow for a more specific hypothesis and interpretation of the potential organizational principles of the semantic framework.
With knowledge of both WM connections (edges) and the GM that they connect (nodes), we can establish the semantic anatomical connectome and analyze its internal network architecture using mathematical graph approaches. Modularity analyses revealed that the anatomical connections associated with semantic preprocessing were clustered into three components: an orbital frontal‐temporal/occipital module, an opercular/triangular/middle frontal‐subcortical module, and a MTL module, which may roughly follows three key WM bundles—IFOF, striatal‐frontal connections and the cingulum bundle. While the semantic system can be dissected along multiple cognitive dimensions such as modality of knowledge and/or relationship with verbal and other cognitive systems, the manner in which the anatomical semantic network is structured sheds light on the organizational dimensions of the cognitive system. Below, we discuss the potential roles of each of these subnetworks in light of their distinct effects implicated in semantic processing.
Orbital Frontal‐Temporal/Occipital Module
This module is composed of 14 WM edges among 9 GM nodes, primarily between the left orbital frontal regions and distributed occipital and lateral temporal regions. The occipital ends include the middle occipital gyrus, lingual gyrus, and calcarine; the temporal ends include a large portion of the temporal lobes, encompassing the anterior temporal and superior/middle temporal gyrus. This stream has been referred as the “ventral semantic stream” [e.g., Duffau et al., 2013]. The occipital regions are classical visual regions processing visual shape, color, and the spatial properties of objects [Renier et al., 2010; Wang et al., 2013] and have been shown to be activated when such object properties are retrieved by verbal stimuli [Chao and Martin, 1999; Hsu et al., 2011; Wang et al., 2013]. The superior and middle temporal gyri, especially the posterior portions, are robustly involved in semantic tasks with various input and output modalities, including visual words and pictures [Vandenberghe et al., 1996], auditory words [Hickok and Poeppel, 2004], and tactile inputs [Stoeckel et al., 2003]. Damage to this territory commonly leads to language comprehension and semantic deficits [Bates et al., 2003; Chertkow et al., 1997; Dronkers et al., 2004; Hart and Gordon, 1990; Schwartz et al., 2009]. Using resting‐state fMRI, we previously demonstrated that both the intrinsic fluctuation amplitude of the region and its functional connectivity strength with frontal and parietal regions, including the orbital frontal cortex, correlate with semantic behavior across healthy individuals [Wei et al., 2012]. The anterior temporal lobe has been presumed to be a potential hub region for binding together various modalities of semantic knowledge, primarily motivated by the semantic dementia profile, with peak atrophy in this region associated with cross‐modal semantic impairment [Lambon Ralph, 2014; Lambon Ralph et al., 2010; Patterson et al., 2007]. While semantic dementia involves atrophy and functional abnormalities beyond the anterior temporal lobe [Guo et al., 2013; Mion et al., 2010; Seeley et al., 2009], which may be the actual cause of semantic deficits, functional imaging studies with healthy subjects have also shown that it processes abstract property knowledge of objects [Peelen and Caramazza, 2012; Simmons et al., 2010] and that its anterolateral subregion is functionally connected with the semantic network during the resting‐state [Pascual et al., 2015]. The orbital frontal gyrus is frequently active in imaging studies [Vandenberghe et al., 1996, but see Price et al., 1999]. Intriguingly, both posterior and anterior temporal regions, as well as the orbital frontal cortex, are strongly implicated in semantic processing across tasks and approaches in the literature, and have been considered potential hub regions binding various modalities of object properties, including the visual properties in the occipital regions in the current module. The orbital frontal cortex is particularly important because many temporal and occipital regions are anatomically connected through this area and showed relatively high PC. Taken together, this module is likely to be a “core” system that assembles various aspects of object properties.
Opercular/Triangular/Middle Frontal‐Subcortical Module
This module connects the opercular/triangular/middle frontal regions (middle frontal gyrus and dorsal inferior frontal gyrus (BA44/BA45)) and subcortical regions including the thalamus, insula and the basal ganglia (putamen and caudate). These regions have been termed the “basal ganglia thalamocortical circuit” given their anatomical adjacency [Ullman, 2006]. They tend to be implicated in tasks with high cognitive control in various contexts. For instance, they are coactivated by semantic word generation tasks where heavy semantic control is involved. For the dorsal inferior frontal gyrus, its activation is positively modulated by the difficulty of the semantic tasks, possibly due to the increased demand of semantic memory and execution of control [Poldrack et al., 1999]. The TMS on the dorsal inferior frontal gyrus disrupts semantic tasks that are executively demanding [Whitney et al., 2011]. For thalamus, its lesion leads to semantic deficits, at least in the lexical tasks [Cox and Heilman, 2011; Crosson, 1984; Nadeau and Crosson, 1997; Segal et al., 2003], and it is activated by semantic associative matching [Assaf et al., 2006; Kraut et al., 2003] and semantic object memory tasks [Hart et al., 2007]. The insula engages in the control and suppression of natural urges [Lerner et al., 2009] and is an integral hub for saliency, switching, attention, and control functions [Menon and Uddin, 2010]. Lesions in the basal ganglia may cause sentence comprehension deficits [Grossman et al., 2002]. Specifically, the left caudate has been suggested to be a “language control” region in bilingual studies, being important in the switching between different languages [e.g., Crinion et al., 2006]. This “opercular/triangular/middle frontal‐subcortical module” may thus serve as the anatomical basis of the executive control component in semantic processing, controlling the retrieval of the appropriate semantic properties for specific tasks and/or contexts. This component is likely to communicate with other semantic components through the insula and thalamus because they show rich between‐module connections and are classified as connectors.
MTL Module
Another module identified links the hippocampus, parahippocampal gyrus, amygdala, and pallidum. The MTL is classically viewed as critical for episodic memory, being involved in the consolidation of information from short‐term memory [Squire et al., 2004; Tubridy and Davachi, 2011]. There is a tight interaction between episodic memory and semantic memory, and accumulated evidence has shown the MTL's role as the “crossroad” between the two memory systems [de Curtis and Paré, 2004; Ranganath and Ritchey, 2012]. The anterior hippocampus is intrinsically functionally connected with the anterior‐temporal lobe, amygdala, anterior parts of the middle and inferior temporal gyrus, and the ventromedial frontal cortex. Semantic dementia is associated with a reduction of this functional network, while Alzheimer's disease is associated with reduction of functional connectivity of the posterior hippocampus [La Joie et al., 2014]. Tan et al., [2014] further showed that atrophy of the left anterior thalamus and the body of the hippocampus positively correlated with the severity of semantic dementia. Intriguingly, human neurophysiological studies have found in these regions so‐called concept cells, neurons that respond to concepts that are salient for episodic memory across various input modalities [e.g., Quiroga et al., 2008]. There are several explanations of the specific mechanism of the episodic system in semantic processing that are not mutually exclusive; subjects rely on episodic memory to help retrieve semantic information [Ryan et al., 2010]; episodic memory is critical to form new semantic memories, particularly in the construction of detailed and complex semantic representations [Henke, 2010]. The MTL may also support the creation of multi‐attribute representations by indexing memories stored in the neocortex [Giovanello et al., 2004; Wixted and Squire, 2011].
Taken together, the WM network for semantic processing is partitioned into structurally segregated modules that encompass regions more salient in processing general knowledge for objects, controlling for semantic activation for specific task contexts, and interacting with the episodic memory. Such modularity analysis results motivate new hypotheses regarding the organization principles of the semantic system and invites studies that empirically test these specific functions for these subnetworks, which might be more informative than focusing on isolated GM regions.
Note that while we observed a predominantly left‐lateralized WM semantic network, task‐based neuroimaging studies have reported bilateral activation in semantic processing [e.g., Binder et al., 2009]. Neuropsychological studies also found that the right hemispheric lesions such as right temporal pole and fusiform gyrus associated with semantic processing deficits [e.g., Duffau et al., 2008; Mion et al., 2010; Thiel et al., 2005; Tranel et al., 1997; Winhuisen et al., 2007]. To examine whether the potential right hemisphere effects were shadowed by left hemisphere effects, we carried out an analysis on the 15 patients with unilateral right hemisphere lesions. In these patients, no significant correlation was found between semantic scores and lesion volume or mean FA values with the confounding variables controlled for (demographic variables, whole brain lesion volume, and lesion volumes on the GM nodes). It remains to be further investigated whether right hemisphere WM effects becomes visible with larger sample size.
Finally, there are several methodological caveats to consider. Patient studies, by nature, are constrained by the lesion distribution patterns [Rudrauf et al., 2008]. In stroke patients, the lesion is strongly associate with attracted vascular territory [Phan et al., 2005]. Certain WM connections are less likely to be injured by brain damage, and thus their effects less easily assessed. Furthermore, the diffusion imaging is an indirect measure of real fiber connections, is especially prone to errors in resolving fiber crossings [Mori and van Zijl, 2002] and may have great signal loss in certain regions including anterior and ventral temporal cortex because they were close to air‐tissue boundaries [Embleton et al., 2010]. These might explain why WM connections with parietal regions, especially the angular gyrus and ventral temporal cortex which have been shown to be important in semantic processing in healthy adults [e.g., Binder et al., 2009; Seghier et al., 2010] were not revealed in our study. Additionally, our study is based on the AAL template, and while it is widely used in the brain structural connectome research, its regions are rather large and may contain heterogeneous functional subregions. Thus convergent evidence from other imaging techniques and parcellation schemes are warranted.
In conclusion, by combining structural and diffusion imaging of both healthy and patient populations, we mapped an anatomical network for semantic processing, with GM “nodes” and WM “edges” elucidated. This anatomical network is composed of three subnetworks that correspond to general semantic knowledge representation, semantic control, and interplay with the episodic system. Our findings highlight the critical roles of distributed WM connections among specific temporal and frontal regions and the modular organization in semantic processing. Our results provide an anatomical framework for the human semantic network, advancing our understanding of the structural substrates underlying normal and impaired semantic processing.
Supporting information
Supporting Information
ACKNOWLEDGEMENTS
We thank Dr. Litao Zhu for help with the imaging methodology, and all BNU‐CNLab members for data collection and imaging preprocessing, particularly Yangwen Xu and Jing Chen. We are also grateful to all research participants. The authors declare no competing interests.
Yuxing Fang and Zaizhu Han contributed equally to this work.
REFERENCES
- Acosta‐Cabronero J, Williams GB, Pengas G, Nestor PJ (2010): Absolute diffusivities define the landscape of white matter degeneration in alzheimer's disease. Brain 133(Pt 2):529–539. [DOI] [PubMed] [Google Scholar]
- Acosta‐Cabronero J, Patterson K, Fryer TD, Hodges JR, Pengas G, Williams GB, Nestor PJ (2011): Atrophy, hypometabolism and white matter abnormalities in semantic dementia tell a coherent story. Brain 134(Pt 7):2025–2035. [DOI] [PubMed] [Google Scholar]
- Agosta F, Henry RG, Migliaccio R, Neuhaus J, Miller BL, Dronkers NF, Brambati SM, Filippi M, Ogar JM Wilson SM, Gorno‐Tempini ML (2010): Language networks in semantic dementia. Brain 133(Pt 1):286–299. [DOI] [PMC free article] [PubMed] [Google Scholar]
- Aralasmak A, Ulmer JL, Kocak M, Salvan CV, Hillis AE, Yousem DM (2006): Association, commissural, and projection pathways and their functional deficit reported in literature. J Comput Assist Tomogr 30:695–715. [DOI] [PubMed] [Google Scholar]
- Assaf M, Calhoun VD, Kuzu CH, Kraut MA, Rivkin PR, Hart J Jr, Pearlson GD (2006): Neural correlates of the object‐recall process in semantic memory. Psychiatry Res 147:115–126. [DOI] [PubMed] [Google Scholar]
- Bates E, Wilson SM, Saygin AP, Dick F, Sereno MI, Knight RT, Dronkers NF (2003): Voxel‐based lesion‐symptom mapping. Nat Neurosci 6:448–450. [DOI] [PubMed] [Google Scholar]
- Binder JR, Desai RH, Graves WW, Conant LL (2009): Where is the semantic system? A critical review and meta‐analysis of 120 functional neuroimaging studies. Cereb Cortex 19:2767–2796. [DOI] [PMC free article] [PubMed] [Google Scholar]
- Binney RJ, Parker GJ, Lambon Ralph MA (2012): Convergent connectivity and graded specialization in the rostral human temporal lobe as revealed by diffusion‐weighted imaging probabilistic tractography. J Cogn Neurosci 24:1998–2014. [DOI] [PubMed] [Google Scholar]
- Bullmore E, Sporns O (2009): Complex brain networks: Graph theoretical analysis of structural and functional systems. Nat Rev Neurosci 10:186–198. [DOI] [PubMed] [Google Scholar]
- Caeyenberghs K, Leemans A (2014): Hemispheric lateralization of topological organization in structural brain networks. Hum Brain Mapp 35:4944–4957. [DOI] [PMC free article] [PubMed] [Google Scholar]
- Cao M, Shu N, Cao Q, Wang Y, He Y (2014): Imaging functional and structural brain connectomics in Attention‐deficit/hyperactivity disorder. Mol Neurobiol 50:1111–1123. [DOI] [PubMed] [Google Scholar]
- Catani M, Thiebaut de Schotten M (2008): A diffusion tensor imaging tractography atlas for virtual in vivo dissections. Cortex 44:1105–1132. [DOI] [PubMed] [Google Scholar]
- Chao LL, Martin A (1999): Cortical regions associated with perceiving, naming, and knowing about colors. J Cognitive Neurosci 11:25–35. [DOI] [PubMed] [Google Scholar]
- Cheng H, Wang Y, Sheng J, Sporns O, Kronenberger WG, Mathews VP, Hummer TA, Saykin AJ (2012): Optimization of seed density in DTI tractography for structural networks. J Neurosci Methods 203:264–272. [DOI] [PMC free article] [PubMed] [Google Scholar]
- Chertkow H, Bub D, Deaudon C, Whitehead V (1997): On the status of object concepts in aphasia. Brain Lang 58:203–232. [DOI] [PubMed] [Google Scholar]
- Cox DE, Heilman KM (2011): Dynamic‐intentional thalamic aphasia: A failure of lexical‐semantic self‐activation. Neurocase 17:313–317. [DOI] [PubMed] [Google Scholar]
- Crinion J, Turner R, Grogan A, Hanakawa T, Noppeney U, Devlin JT, Aso T, Urayama S, Fukuyama H, Stockton K, Usui K, Green DW, Price CJ (2006): Language control in the bilingual brain. Science 312:1537–1540. [DOI] [PubMed] [Google Scholar]
- Crosson B (1984): Role of the dominant thalamus in language: A review. Psychol Bull 96:491–517. [PubMed] [Google Scholar]
- Cui Z, Zhong S, Xu P, He Y, Gong G (2013): PANDA: A pipeline toolbox for analyzing brain diffusion images. Front Hum Neurosci 7:42. [DOI] [PMC free article] [PubMed] [Google Scholar]
- de Curtis M, Paré D (2004): The rhinal cortices: A wall of inhibition between the neocortex and the hippocampus. Prog Neurobiol 74:101–110. [DOI] [PubMed] [Google Scholar]
- de Zubicaray GI, Rose SE, McMahon KL (2011): The structure and connectivity of semantic memory in the healthy older adult brain. Neuroimage 54:1488–1494. [DOI] [PubMed] [Google Scholar]
- Dronkers NF, Wilkins DP, Van Valin RD Jr, Redfern BB, Jaeger JJ (2004): Lesion analysis of the brain areas involved in language comprehension. Cognition 92:145–177. [DOI] [PubMed] [Google Scholar]
- Duffau H (2008): The anatomo‐functional connectivity of language revisited. New insights provided by electrostimulation and tractography. Neuropsychologia 46:927–934. [DOI] [PubMed] [Google Scholar]
- Duffau H, Capelle L, Sichez N, Denvil D, Lopes M, Sichez JP, Bitar A, Fohanno D (2002): Intraoperative mapping of the subcortical language pathways using direct stimulations—An anatomo‐functional study. Brain 125:199–214. [DOI] [PubMed] [Google Scholar]
- Duffau H, Gatignol P, Mandonnet E, Peruzzi P, Tzourio‐Mazoyer N, Capelle L (2005): New insights into the anatomo‐functional connectivity of the semantic system: A study using cortico‐subcortical electrostimulations. Brain 128(Pt 4):797–810. [DOI] [PubMed] [Google Scholar]
- Duffau H, Leroy M, Gatignol P (2008): Cortico‐subcortical organization of language networks in the right hemisphere: An electrostimulation study in left‐handers. Neuropsychologia 46:3197–3209. [DOI] [PubMed] [Google Scholar]
- Duffau H, Gatignol P, Moritz‐Gasser S, Mandonnet E (2009): Is the left uncinate fasciculus essential for language? A cerebral stimulation study. J Neurol 256:382–389. [DOI] [PubMed] [Google Scholar]
- Duffau H, Herbet G, Moritz‐Gasser S (2013): Toward a pluri‐component, multimodal, and dynamic organization of the ventral semantic stream in humans: Lessons from stimulation mapping in awake patients. Front Syst Neurosci 7:44. [DOI] [PMC free article] [PubMed] [Google Scholar]
- Embleton KV, Haroon HA, Morris DM, Ralph MA, Parker GJ (2010): Distortion correction for diffusion‐weighted MRI tractography and fMRI in the temporal lobes. Hum Brain Mapp 31:1570–1587. [DOI] [PMC free article] [PubMed] [Google Scholar]
- Fernández‐Miranda JC, Rhoton AL Jr, Alvarez‐Linera J, Kakizawa Y, Choi C, de Oliveira EP (2008): Three‐dimensional microsurgical and tractographic anatomy of the white matter of the human brain. Neurosurgery 62(Suppl 3):989–1026. discussion 1026‐8. [DOI] [PubMed] [Google Scholar]
- Fiez JA, Damasio H, Grabowski TJ (2000): Lesion segmentation and manual warping to a reference brain: Intra‐ and interobserver reliability. Hum Brain Mapp 9:192–211. [DOI] [PMC free article] [PubMed] [Google Scholar]
- Folstein MF, Folstein SE, McHugh PR (1975): “Mini‐mental state”: A practical method for grading the cognitive state of patients for the clinician. J Psychiat Res 12:189–198. [DOI] [PubMed] [Google Scholar]
- Friederici AD, Gierhan SM (2013): The language network. Curr Opin Neurobiol 23:250–254. [DOI] [PubMed] [Google Scholar]
- Giovanello KS, Schnyer DM, Verfaellie M (2004): A critical role for the anterior hippocampus in relational memory: Evidence from an fMRI study comparing associative and item recognition. Hippocampus 14:5–8. [DOI] [PubMed] [Google Scholar]
- Gong G, He Y, Concha L, Lebel C, Gross DW, Evans AC, Beaulieu C (2009): Mapping anatomical connectivity patterns of human cerebral cortex using in vivo diffusion tensor imaging tractography. Cereb Cortex 19:524–536. [DOI] [PMC free article] [PubMed] [Google Scholar]
- Graves WW, Binder JR, Desai RH, Humphries C, Stengel BC, Seidenberg MS (2014): Anatomy is strategy: Skilled reading differences associated with structural connectivity differences in the reading network. Brain Lang 133:1–13. [DOI] [PMC free article] [PubMed] [Google Scholar]
- Grossman M, Lee C, Morris J, Stern MB, Hurtig HI (2002): Assessing resource demands during sentence processing in parkinson's disease. Brain Lang 80:603–616. [DOI] [PubMed] [Google Scholar]
- Guimera R, Nunes Amaral LA (2005): Functional cartography of complex metabolic networks. Nature 433:895–900. [DOI] [PMC free article] [PubMed] [Google Scholar]
- Guo CC, Gorno‐Tempini ML, Gesierich B, Henry M, Trujillo A, Shany‐Ur T, Jovicich J, Robinson SD, Kramer JH Rankin KP, Miller BL, Seeley WW (2013): Anterior temporal lobe degeneration produces widespread network‐driven dysfunction. Brain 136(Pt 10):2979–2991. [DOI] [PMC free article] [PubMed] [Google Scholar]
- Han Z, Ma Y, Gong G, He Y, Caramazza A, Bi Y (2013): White matter structural connectivity underlying semantic processing: Evidence from brain damaged patients. Brain 136(Pt 10):2952–2965. [DOI] [PubMed] [Google Scholar]
- Hart J, Gordon B (1990): Delineation of single‐word semantic comprehension deficits in aphasia, with anatomical correlation. Ann Neurol 27:226–231. [DOI] [PubMed] [Google Scholar]
- Hart J, Anand R, Zoccoli S, Maguire M, Gamino J, Tillman G King R, Kraut MA (2007): Neural substrates of semantic memory. J Int Neuropsychol Soc 13:865–880. [DOI] [PubMed] [Google Scholar]
- He Y, Evans A (2010): Graph theoretical modeling of brain connectivity. Curr Opin Neurol 23:341–350. [DOI] [PubMed] [Google Scholar]
- Y He, J Wang, L Wang, ZJ Chen, C Yan, H Yang, H Tang, C Zhu, Q Gong, Y Zang (2009): Uncovering intrinsic modular organization of spontaneous brain activity in humans. PloS one 4:e5226. [DOI] [PMC free article] [PubMed] [Google Scholar]
- Henke K (2010): A model for memory systems based on processing modes rather than consciousness. Nat Rev Neurosci 11:523–532. [DOI] [PubMed] [Google Scholar]
- Hickok G, Poeppel D (2004): Dorsal and ventral streams: A framework for understanding aspects of the functional anatomy of language. Cognition 92:67–99. [DOI] [PubMed] [Google Scholar]
- Hsu NS, Kraemer DJ, Oliver RT, Schlichting ML, Thompson‐Schill SL (2011): Color, context, and cognitive style: Variations in color knowledge retrieval as a function of task and subject variables. J Cogn Neurosci 23:2544–2557. [DOI] [PubMed] [Google Scholar]
- Jolliffe IT (2002): Principal Component Analysis, 2nd Edition. Springer, New York. [Google Scholar]
- Kümmerer D, Hartwigsen G, Kellmeyer P, Glauche V, Mader I, Kloppel S, Suchan J, Karnath HO, Weiller C, Saur D (2013): Damage to ventral and dorsal language pathways in acute aphasia. Brain 136(Pt 2):619–629. [DOI] [PMC free article] [PubMed] [Google Scholar]
- Kraut MA, Calhoun V, Pitcock JA, Cusick C, Hart J Jr (2003): Neural hybrid model of semantic object memory: Implications from event‐related timing using fMRI. J Int Neuropsychol Soc 9:1031–1040. [DOI] [PubMed] [Google Scholar]
- La Joie R, Landeau B, Perrotin A, Bejanin A, Egret S, Pelerin A, Mezenge F, Belliard S, de La Sayette V Eustache F, Desgranges B, Chételat G (2014): Intrinsic connectivity identifies the hippocampus as a main crossroad between alzheimer's and semantic dementia‐targeted networks. Neuron 81:1417–1428. [DOI] [PubMed] [Google Scholar]
- Lambon Ralph MA (2014): Neurocognitive insights on conceptual knowledge and its breakdown. Philos Trans R Soc Lond B Biol Sci 369:20120392 [DOI] [PMC free article] [PubMed] [Google Scholar]
- Lambon Ralph MA, Cipolotti L, Manes F, Patterson K (2010): Taking both sides: Do unilateral anterior temporal lobe lesions disrupt semantic memory? Brain 133:3243–3255. [DOI] [PubMed] [Google Scholar]
- Lerner A, Bagic A, Hanakawa T, Boudreau EA, Pagan F, Mari Z, Bara‐Jimenez W, Aksu M, Sato S, Murphy DL, Hallett M (2009): Involvement of insula and cingulate cortices in control and suppression of natural urges. Cereb Cortex 19:218–223. [DOI] [PMC free article] [PubMed] [Google Scholar]
- Lo C, Wang P, Chou K, Wang J, He Y, Lin C (2010): Diffusion tensor tractography reveals abnormal topological organization in structural cortical networks in alzheimer's disease. J Neurosci 30:16876–16885. [DOI] [PMC free article] [PubMed] [Google Scholar]
- Mahon BZ, Caramazza A (2009): Concepts and categories: A cognitive neuropsychological perspective. Annu Rev Psychol 60:27–51. [DOI] [PMC free article] [PubMed] [Google Scholar]
- Mandonnet E, Nouet A, Gatignol P, Capelle L, Duffau H (2007): Does the left inferior longitudinal fasciculus play a role in language? A brain stimulation study. Brain 130(Pt 3):623–629. [DOI] [PubMed] [Google Scholar]
- Martin A (2007): The representation of object concepts in the brain. Annu Rev Psychol 58:25–45. [DOI] [PubMed] [Google Scholar]
- Martino J, Brogna C, Robles SG, Vergani F, Duffau H (2010): Anatomic dissection of the inferior fronto‐occipital fasciculus revisited in the lights of brain stimulation data. Cortex 46:691–699. [DOI] [PubMed] [Google Scholar]
- Maslov S, Sneppen K (2002): Specificity and stability in topology of protein networks. Science 296:910–913. [DOI] [PubMed] [Google Scholar]
- Menon V, Uddin LQ (2010): Saliency, switching, attention and control: A network model of insula function. Brain Struct Funct 214:655–667. [DOI] [PMC free article] [PubMed] [Google Scholar]
- Mion M, Patterson K, Acosta‐Cabronero J, Pengas G, Izquierdo‐Garcia D, Hong YT, Fryer TD, Williams GB, Hodges JR, Nestor PJ (2010): What the left and right anterior fusiform gyri tell us about semantic memory. Brain 133:3256–3268. [DOI] [PubMed] [Google Scholar]
- Mori S, van Zijl PC (2002): Fiber tracking: Principles and strategies—A technical review. NMR Biomed 15:468–480. [DOI] [PubMed] [Google Scholar]
- Mori S, Crain BJ, Chacko VP, van Zijl PC (1999): Three‐dimensional tracking of axonal projections in the brain by magnetic resonance imaging. Ann Neurol 45:265–269. [DOI] [PubMed] [Google Scholar]
- Nadeau SE, Crosson B (1997): Subcortical aphasia. Brain Lang 58:355–402. discussion 418‐23. [DOI] [PubMed] [Google Scholar]
- Newman ME (2006): Modularity and community structure in networks. Proc Natl Acad Sci USA 103:8577–8582. [DOI] [PMC free article] [PubMed] [Google Scholar]
- Oldfield RC (1971): The assessment and analysis of handedness: The edinburgh inventory. Neuropsychologia 9:97–113. [DOI] [PubMed] [Google Scholar]
- Pascual B, Masdeu JC, Hollenbeck M, Makris N, Insausti R, Ding S‐L, Dickerson BC (2015): Large‐scale brain networks of the human left temporal pole: A functional connectivity MRI study. Cereb Cortex 25:680–702. [DOI] [PMC free article] [PubMed] [Google Scholar]
- Patterson K, Nestor PJ, Rogers TT (2007): Where do you know what you know? The representation of semantic knowledge in the human brain. Nat Rev Neurosci 8:976–987. [DOI] [PubMed] [Google Scholar]
- Peelen MV, Caramazza A (2012): Conceptual object representations in human anterior temporal cortex. J Neurosci 32:15728–15736. [DOI] [PMC free article] [PubMed] [Google Scholar]
- Phan TG, Donnan GA, Wright PM, Reutens DC (2005): A digital map of middle cerebral artery infarcts associated with middle cerebral artery trunk and branch occlusion. Stroke 36:986–991. [DOI] [PubMed] [Google Scholar]
- Poldrack RA, Wagner AD, Prull MW, Desmond JE, Glover GH, Gabrieli JD (1999): Functional specialization for semantic and phonological processing in the left inferior prefrontal cortex. Neuroimage 10:15–35. [DOI] [PubMed] [Google Scholar]
- Price CJ, Mummery CJ, Moore CJ, Frakowiak RS, Friston KJ (1999): Delineating necessary and sufficient neural systems with functional imaging studies of neuropsychological patients. J Cogn Neurosci 11:371–382. [DOI] [PubMed] [Google Scholar]
- Quiroga RQ, Mukamel R, Isham EA, Malach R, Fried I (2008): Human single‐neuron responses at the threshold of conscious recognition. Proc Natl Acad Sci USA 105:3599–3604. [DOI] [PMC free article] [PubMed] [Google Scholar]
- Ranganath C, Ritchey M (2012): Two cortical systems for memory‐guided behaviour. Nat Rev Neurosci 13:713–726. [DOI] [PubMed] [Google Scholar]
- Renier LA, Anurova I, De Volder AG, Carlson S, VanMeter J, Rauschecker JP (2010): Preserved functional specialization for spatial processing in the middle occipital gyrus of the early blind. Neuron 68:138–148. [DOI] [PMC free article] [PubMed] [Google Scholar]
- Riddoch MJ, Humphreys GW (1993): BORB: Birmingham Object Recognition Battery. Lawrence Erlbaum Associates Ltd, Hove, UK. [Google Scholar]
- Rudrauf D, Mehta S, Bruss J, Tranel D, Damasio H, Grabowski TJ (2008): Thresholding lesion overlap difference maps: Application to category‐related naming and recognition deficits. NeuroImage 41:970–984. [DOI] [PMC free article] [PubMed] [Google Scholar]
- Ryan L, Lin CY, Ketcham K, Nadel L (2010): The role of medial temporal lobe in retrieving spatial and nonspatial relations from episodic and semantic memory. Hippocampus 20:11–18. [DOI] [PubMed] [Google Scholar]
- Sarubbo S, Benedictis AD, Duffau H (2013): Frontal terminations for the inferior fronto‐occipital fascicle: Anatomical dissection, DTI study and functional considerations on a multi‐component bundle. Brain Struct Funct 46:691–699. [DOI] [PubMed] [Google Scholar]
- Saur D, Kreher BW, Schnell S, Kummerer D, Kellmeyer P, Vry MS, Umarova R, Musso M, Glauche V, Abel S, Huber W, Rijntjes M, Hennig J, Weiller C (2008): Ventral and dorsal pathways for language. Proc Natl Acad Sci USA 105:18035–18040. [DOI] [PMC free article] [PubMed] [Google Scholar]
- Schwartz MF, Kimberg DY, Walker GM, Faseyitan O, Brecher A, Dell GS, Coslett HB (2009): Anterior temporal involvement in semantic word retrieval: Voxel‐based lesion‐symptom mapping evidence from aphasia. Brain 132(Pt 12):3411–3427. [DOI] [PMC free article] [PubMed] [Google Scholar]
- Seeley WW, Crawford RK, Zhou J, Miller BL, Greicius MD (2009): Neurodegenerative diseases target large‐scale human brain networks. Neuron 62:42–52. [DOI] [PMC free article] [PubMed] [Google Scholar]
- Segal JB, Williams R, Kraut MA, Hart J (2003): Semantic memory deficit with a left thalamic infarct. Neurology 61:252–254. [DOI] [PubMed] [Google Scholar]
- Seghier ML, Fagan E, Price CJ (2010): Functional subdivisions in the left angular gyrus where the semantic system meets and diverges from the default network. J Neurosci 30:16809–16817. [DOI] [PMC free article] [PubMed] [Google Scholar]
- Simmons WK, Reddish M, Bellgowan PS, Martin A (2010): The selectivity and functional connectivity of the anterior temporal lobes. Cereb Cortex 20:813–825. [DOI] [PMC free article] [PubMed] [Google Scholar]
- Sporns O, Tononi G, Kotter R (2005): The human connectome: A structural description of the human brain. PLoS Comput Biol 1:e42. [DOI] [PMC free article] [PubMed] [Google Scholar]
- Squire LR, Stark CE, Clark RE (2004): The medial temporal lobe. Annu Rev Neurosci 27:279–306. [DOI] [PubMed] [Google Scholar]
- Stoeckel MC, Weder B, Binkofski F, Buccino G, Shah NJ, Seitz RJ (2003): A fronto‐parietal circuit for tactile object discrimination: An event‐related fMRI study. Neuroimage 19:1103–1114. [DOI] [PubMed] [Google Scholar]
- Tan RH, Wong S, Kril JJ, Piguet O, Hornberger M, Hodges JR, Halliday GM (2014): Beyond the temporal pole: Limbic memory circuit in the semantic variant of primary progressive aphasia. Brain 137(Pt 7):2065–2076. [DOI] [PubMed] [Google Scholar]
- Thiel A, Habedank B, Winhuisen L, Herholz K, Kessler J, Haupt WF, Heiss WD (2005): Essential language function of the right hemisphere in brain tumor patients. Ann Neurol 57:128–131. [DOI] [PubMed] [Google Scholar]
- Tranel D, Damasio H, Damasio AR (1997): A neural basis for the retrieval of conceptual knowledge. Neuropsychologia 35:1319–1327. [DOI] [PubMed] [Google Scholar]
- Tubridy S, Davachi L (2011): Medial temporal lobe contributions to episodic sequence encoding. Cereb Cortex 21:272–280. [DOI] [PMC free article] [PubMed] [Google Scholar]
- Turken AU, Dronkers NF (2011): The neural architecture of the language comprehension network: Converging evidence from lesion and connectivity analyses. Front Syst Neurosci 5:1. [DOI] [PMC free article] [PubMed] [Google Scholar]
- N Tzourio‐Mazoyer, B Landeau, D Papathanassiou, F Crivello, O Etard, N Delcroix, B Mazoyer, M Joliot (2002): Automated anatomical labeling of activations in SPM using a macroscopic anatomical parcellation of the MNI MRI single‐subject brain. Neuroimage 15:273–289. [DOI] [PubMed] [Google Scholar]
- Ullman MT (2006): Is broca's area part of a basal ganglia thalamocortical circuit? Cortex 42:480–485. [DOI] [PubMed] [Google Scholar]
- Vandenberghe R, Price C, Wise R, Josephs O, Frackowiak RS (1996): Functional anatomy of a common semantic system for words and pictures. Nature 383:254–256. [DOI] [PubMed] [Google Scholar]
- Wang X, Han Z, He Y, Caramazza A, Song L, Bi Y (2013): Where color rests: Spontaneous brain activity of bilateral fusiform and lingual regions predicts object color knowledge performance. Neuroimage 76:252–263. [DOI] [PubMed] [Google Scholar]
- Wei T, Liang X, He Y, Zang Y, Han Z, Caramazza A, Bi Y (2012): Predicting conceptual processing capacity from spontaneous neuronal activity of the left middle temporal gyrus. J Neurosci 32:481–489. [DOI] [PMC free article] [PubMed] [Google Scholar]
- Whitney C, Kirk M, O'Sullivan J, Lambon Ralph MA, Jefferies E (2011): The neural organization of semantic control: TMS evidence for a distributed network in left inferior frontal and posterior middle temporal gyrus. Cereb Cortex 21:1066–1075. [DOI] [PMC free article] [PubMed] [Google Scholar]
- Winhuisen L, Thiel A, Schumacher B, Kessler J, Rudolf J, Haupt WF, Heiss WD (2007): The right inferior frontal gyrus and poststroke aphasia: A follow‐up investigation. Stroke 38:1286–1292. [DOI] [PubMed] [Google Scholar]
- Wixted JT, Squire LR (2011): The medial temporal lobe and the attributes of memory. Trends Cogn Sci 15:210–217. [DOI] [PMC free article] [PubMed] [Google Scholar]
- Xia M, Wang J, He Y (2013): BrainNet viewer: A network visualization tool for human brain connectomics. PLoS One 8:e68910. [DOI] [PMC free article] [PubMed] [Google Scholar]
- Zhang Z, Liao W, Chen H, Mantini D, Ding JR, Xu Q, Wang Z, Yuan C, Chen G, Jiao Q, Lu G (2011): Altered functional‐structural coupling of large‐scale brain networks in idiopathic generalized epilepsy. Brain 134(Pt 10):2912–2928. [DOI] [PubMed] [Google Scholar]
Associated Data
This section collects any data citations, data availability statements, or supplementary materials included in this article.
Supplementary Materials
Supporting Information