

Abstract
Cognitive abilities decline with age, but with considerable individual variation. The neurobiological correlate of this variation is not well described. Functional brain imaging studies have demonstrated reduced task‐induced deactivation (TID) of the brain's default mode network (DMN) in a wide range of neurodegenerative diseases involving cognitive symptoms, in conditions with increased risk of Alzheimer's disease, and even in advanced but healthy aging. Here, we investigated brain activation and deactivation during a visual‐motor task in 185 clinically healthy males from a Danish birth cohort, whose cognitive function was assessed in youth and midlife. Using each individual as his own control, we defined a group with a large degree of cognitive decline, and a control group. When correcting for effects of total cerebral blood flow and hemoglobin level, we found reduced TID in the posterior region of the DMN in the cognitive decline group compared to the control group. Furthermore, increased visual activation response was found in the cognitive decline group, indicating that the TID reduction was not exclusively due to overall impaired vascular reactivity. These results suggest a neurobiological basis for subclinical cognitive decline in late midlife, which includes TID alterations similar to the pattern seen in patients with AD and mild cognitive impairment. Hence, TID reduction might be suggested as an early marker for subtle cognitive decline in aging. Hum Brain Mapp 35:4488–4498, 2014. © 2014 Wiley Periodicals, Inc.
Keywords: fMRI, task‐induced deactivation, cognitive decline, aging
INTRODUCTION
As a substantial part of the world's population ages, preservation of cognitive abilities and promotion of mental health during late life has become a focus of increasing interest [Brayne, 2007; Kirkwood, 2008]. In age‐related neurodegenerative diseases associated with cognitive loss, early diagnosis is essential for the possibility of early intervention [Brayne, 2007], and therefore the identification of biological markers for early stages of cognitive decline is crucial [Gow et al., 2011]. However, such investigations are complicated by the considerable variation in cognitive performance among young adults [Gow et al., 2011], and the fact that some decrease in cognitive abilities is normal in late life, even in subjects with no detectable neuropathology [Gow et al., 2011; Hedden and Gabrieli, 2004; Schaie et al., 2004].
Functional neuroimaging studies of the brain's so‐called “default mode network” (DMN) are widely used to explore brain function changes in both normal aging and cognitive disorders [see Hafkemeijer et al., 2011, for review]. The DMN comprises regions within the medial frontal, medial parietal, and posterior cingulate cortex that exhibit a high resting metabolism [Raichle et al., 2001]. Compared to at rest, cerebral perfusion and the blood oxygen‐level dependent (BOLD) signal are decreased during task performance, a phenomenon referred to as task‐induced deactivation (TID). Across a wide range of tasks, TID has been consistently demonstrated in brain regions corresponding to the DMN [Lustig et al., 2003; Persson et al., 2008; Rombouts et al., 2005; Shulman et al., 1997].
TID is reportedly reduced in AD [e.g., Celone et al., 2006; Lustig et al., 2003; Rombouts et al., 2005], mild cognitive impairment (MCI) [e.g., Bosch et al., 2010; Celone et al., 2006; Pihlajamäki and Sperling, 2009; Rombouts et al., 2005], and in cognitively normal individuals with either β‐amyloid depositions [Sperling et al., 2009] or with genetic risk factors for AD [Fleisher et al., 2009]. Decreased TID has also been age‐dependently observed in healthy subjects without specific cognitive disturbances, [Grady et al., 2006; Lustig et al., 2003]; however, in these studies the study groups differed both in terms of age and cognitive test scores.
Thus, TID might be vulnerable to cognitive alterations related to age, even without any clinical symptoms or complains. This idea is further supported by the fact that DMN regions show considerable overlap with regions vulnerable to β‐amyloid deposition and therefore seem to be of particular interest in relation to Alzheimer's disease (AD) [Andrews‐Hanna et al., 2007; Buckner et al., 2008], which is the most common form of dementia [Weiner et al., 2012]. The present study therefore aims to investigate whether TID can be considered a functional brain correlate to the degree of cognitive aging in a study population at the same chronological age.
However, the majority of previous studies have used a cross‐sectional design. Because childhood cognitive ability is the strongest predictor of late‐life cognitive ability [Deary et al., 2010; Gow et al., 2011], the variance in cognitive function in an aging population is probably more related to young adult individual differences than to age‐related or pathological changes. Thus, a longitudinal study design that controls for differences in the individuals cognitive score as young adults may be more sensitive.
In the present study we used a simple visual–motor task to investigate TID in a cohort of clinically healthy males born in 1953 who were cognitively assessed at 18, 56, and 59 years of age. This study design allowed us to define a group of 92 individuals who exhibited a relatively large decrease of cognitive performance compared to their own abilities in early adulthood, and a group of 93 individuals who exhibited little or no decrease. We were thereby able to focus our analysis specifically on changes in cognitive performance during adult life, using each participant as his own control. The minimal variability in age and gender in our study further strengthens the sensitivity of the data. We hypothesized that, independent of childhood cognitive ability, cognitive decline would be accompanied by reduced TID, and that reduced TID therefore may be used as an indicator and possibly a predictor of cognitive decline in otherwise healthy individuals.
MATERIALS AND METHODS
Participants
Participants were recruited from The Metropolit Danish Male Birth Cohort [Osler, 2006; Osler et al., 2013] which includes all boys born in 1953 in the Copenhagen metropolitan area and contains data concerning social factors, health, and cognitive status during childhood and youth, collected over the years 1965–2010. The cohort was cognitively assessed at ∼20 years of age with the Børge Priens Prøve (BPP) test, which is a part of the draft board assessment program, assessing the suitability for military service. The BPP test comprises four subtests, each with about 20 items, involving logical, verbal, numerical, and spatial reasoning [Teasdale et al., 2010]. The cohort was again cognitively assessed in 2009–10 (when subjects were ∼56 years of age) as part of the Copenhagen Aging and Midlife Biobank project (CAMB) [Osler et al., 2013]. This adult evaluation used the Intelligenz‐Struktur‐Test 2000 R (I‐S‐T 2000 R) [Osler et al., 2013], which comprises three subtests involving verbal analogies, number series, and sentence completion—and thus two of the subtests corresponded to similar BPP subtests.
The following methods were used to select participants for the present study from the 1985 members of the Metropolit Cohort who participated in both BPP tests and CAMB data collection (Fig. 1). A linear regression analysis was carried out with the BPP score as predictor and the I‐S‐T 2000 R score as outcome. The regression coefficient was highly significant (R 2 = 0.51, P < 0.0001), and further analyses were performed by considering the standardized residuals about the regression line. Outliers were defined as individuals with standardized residuals >3 and were excluded to minimize the inclusion of participants with extreme and potentially unreliable test results. As can be seen in Figure 1 a conspicuous number of outliers shows relatively low BPP score but high I‐S‐T 2000 R score. This might be explained by deliberate underperformance at the draft board assessment reflecting lack of motivation and a negative attitude towards military service. We then defined two groups: Group A included participants with the largest positive residuals, and Group B included participants with the largest negative residuals.
Figure 1.
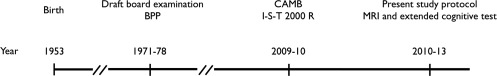
Timeline of cognitive testing in the Metropolit Danish Male Birth Cohort. Nearly 10,246 individuals from the cohort were cognitively tested (BPP score) at draft board examination. A subgroup of 2,126 persons completed the CAMB study, including the I‐S‐T 2000 R score, of which we have access to 1,985 datasets. Finally, 208 individuals were included in the present study protocol, including MRI and extended neuropsychological assessment.
A total of 552 persons were invited by letter to participate (249 in Group A, 303 in Group B). Of those invited, 309 (133 in Group A, 176 in Group B) did not want to participate or had died since their participation in CAMB. The remaining 243 potential participants were interviewed to check for eligibility. Exclusion criteria were medical conditions with a well‐established association with cognitive dysfunction (alcohol and drug abuse, major psychiatric and neurologic disease), major structural brain lesions, and contraindications to MRI. Based on these criteria, 36 persons (15 Group A, 21 Group B) were excluded. Of the remaining persons, four did not show up at their appointments (all Group B). Ten MR scans could not be completed: seven due to claustrophobia (four Group A, three Group B), and three because it was not possible to place the participant inside the scanner (two Group A, one Group B). One scan (Group B) was excluded because of a major congenital brain malformation, and seven scans were lost due to technical problems (two Group A, five Group B), leaving us with 185 fMRI data sets (93 Group A, 92 Group B). Within‐group comparisons of residuals showed no differences between included participants, persons who were invited but did not want to participate, and those who were excluded or had died (one‐way ANOVA for within‐group differences between the three categories: P = 0.95 for Group A, P = 0.47 in Group B).
Neuropsychological Assessment
The participants were neuropsychologically tested as described below; 90% of participants within 1 week from the day of the MRI.
The mini mental state examination (MMSE) and Addenbrooke's cognitive examination (ACE) were carried out as overall measures of global cognitive function, followed by a test battery including tests from CANTAB (Cambridge Neuropsychological Test Automated Battery) that assessed visual paired associate learning and memory (Paired Associate Learning; PAL), attention (Rapid Visual Information Processing; RVP), and choice movement time (CHMT). Tests of verbal associate learning and memory (15 word pairs), and processing speed (Trail Making Tests A and B) were also administered. Table 1 presents testing details. The tests were administered by staff who were trained and supervised by an experienced neuropsychologist, and were blinded to the group affiliation.
Table 1.
Participant characteristics and neuropsychological scores
| Group A; mean (SD) | Group B; mean (SD) | A vs. B; P a | |
|---|---|---|---|
| N | 93 | 92 | |
| Previous assessments | |||
| Cognition at draft board examination, BPP score | 46.3 (9.6) | 45.7 (8.3) | 0.63 |
| Age at draft board examination (years) | 20.3 (2.0) | 20.3 (2.0) | 0.80 |
| Cognition at CAMB study participation, I‐S‐T 2000R score | 42.6 (7.2) | 21.3 (6.1) | <0.0001 |
| Current assessment | |||
| Age at present study participation (years) | 57.9 (0.62) | 58.0 (0.74) | 0.11 |
| Education length total, years (87 Group A, 84 Group B) | 15.2 (2.9) | 13.7 (3.1) | 0.0013 |
| Smoking, pack‐years (90 Group A, 87 Group B) | 13.2 (17.9) | 12.3 (20.3) | 0.77 |
| Physical activity, score (92 Group A, 89 Group B) | 4.6 (1.4) | 4.7 (1.3) | 0.47 |
| BDI‐II, score (92 Group A, 84 Group B) | 3.3 (0.38) | 3.8 (0.55) | 0.41 |
| MMSE, score | 29.4 (0.85) | 29.2 (1.0) | 0.035 |
| ACE, score (1 data set from Group B is missing) | 95.9 (3.2) | 92.0 (5.1) | <0.0001 |
| Visual memory | |||
| Paired associates learning (total errors, adjusted, score) | 18.3 (3.3) | 16.4 (3.0) | 0.0001 |
| Verbal memory | |||
| 15 word paired associates learning (no. errors) | 8.4 (7.7) | 14.3 (7.7) | <0.0001 |
| 15 word paired associates recall (no. errors) | 3.6 (3.2) | 5.9 (3.5) | <0.0001 |
| Processing speed | |||
| Trail making A (sec.) | 32.3 (10.3) | 34.8 (9.8) | 0.099 |
| Trail making B (sec.) | 68.7 (19.2) | 93.5 (63.2) | 0.0004 |
| Attention | |||
| Rapid visual processing (score) (CANTAB) | 0.93 (0.046) | 0.90 (0.048) | <0.0001 |
| Choice movement time | |||
| 5 choice movement time (msec.) (CANTAB) | 385 (86.2) | 389 (109) | 0.77 |
T test.
Other Data
During a health interview, data were collected concerning duration of education (number of years in school), smoking history (pack‐years), and physical activity status classified according to the following scale: daily (six points), two to three times per week (five points), once per week (four points), two to three times per month (three points), a few times per year (two points), never (one point). As depressive symptoms might influence cognitive performance [Brevik et al., 2013], the Beck depression inventory‐II (BDI‐II) was administered to measure self‐reported depressive symptomatology [Arnau et al., 2001]. Additionally, a large battery of blood tests was performed; however, this present report will only refer to the blood hemoglobin level.
MRI Data Acquisition
Imaging was performed on a 3.0‐T Philips Intera Achieva scanner (Philips Medical Systems, Best, The Netherlands) using an eight‐element phased array receive‐only head coil. For the visual–motor task fMRI, we used an echo planar imaging sequence (temporal resolution, 3 s; echo time, 35 ms; flip angle, 90°; matrix, 80 × 80; field of view, 230 × 230 mm2) to obtain 33 coronal slices (4‐mm thickness, 0.06‐mm inter‐slice gap). Visual stimulation was presented with the Eloquence system (Invivo, Orlando, FL), using liquid crystal display (LCD) goggles. A fiber optic cable connected the system to a control computer outside the scanner room.
A T1‐weighted structural MRI‐scan was also acquired (MP‐RAGE; TI, 700 ms; TR, 6.9 ms; flip angle, 9°; 137 sagittal slices; 1.1 × 1.1 × 1.1 mm3 voxels). A phase‐mapping technique was used to estimate total cerebral blood flow. First, a 3D inflow MRI angiogram was acquired. Based on lateral and anterior–posterior projections, the measurement slice was placed as orthogonally as possible to the internal carotid arteries and the basilar artery to minimize partial volume. Phase‐mapping flow measurements were obtained with a matrix of 320 × 320 (TR, 12 ms; TE, 7 ms; flip angle, 10°; voxel size, 0.75 × 0.75 × 8 mm3).
Experimental Design
The visual‐motor paradigm comprised four cycles of alternating blocks of 30 s of rest and 30 s of stimulation, ending with 30 s of rest. The stimulus consisted of a flickering black and white checkerboard reversing at 8 Hz. During the stimulus, the participant was instructed to alternately flex and extend the four ulnar fingers of both hands.
Preprocessing and Analysis of fMRI Data
Block design data was processed using FEAT (FMRI Expert Analysis Tool) Version 5.98, part of the FSL (FMRIB's Software Library, http://www.fmrib.ox.ac.uk/fsl), and in‐house Matlab scripts. The following pre‐statistics processing was applied to the data: motion correction using MCFLIRT [Jenkinson et al., 2002], nonbrain removal using BET [Smith, 2002], spatial smoothing using a Gaussian kernel of FWHM 5 mm, grand‐mean intensity normalization of the entire 4D dataset by a single scaling factor (i.e., each volume was scaled by the same amount), high‐pass temporal filtering (Gaussian‐weighted least‐squares straight‐line fitting with sigma = 30.0 s).
Time‐series statistical analysis was carried out using FILM with local autocorrelation correction [Woolrich et al., 2001]. Using a general linear model (including the temporal derivative as a covariate), parameter estimates were calculated and transformed into Z statistic maps, showing voxels that correlated negatively or positively to the experimental paradigm. Registration to individual structural scans and standard space images was performed using FNIRT [Andersson et al., 2007a, 2007b]. To test for between‐group differences of the BOLD response, voxel‐wise higher‐level analysis was performed using FMRIB's Local Analysis of Mixed Effects (FLAME) stage 1 [Beckmann et al., 2003; Woolrich, 2008; Woolrich et al., 2004]. Z (Gaussianised T/F) statistic images were thresholded using clusters determined by Z > 2.3 and a corrected cluster significance threshold of P = 0.05.
We also performed region‐of‐interest (ROI) analysis. Four ROIs were defined in the following areas: right primary motor cortex, medial visual cortex, medial prefrontal cortex (MPFC), and posterior cingulate cortex (PCC). From the mean activation map, the ROIs were defined as all voxels inside the relevant areas with a Z value higher than 9.0 for the positive BOLD response in the motor and visual ROIs, and higher than 5.5 for the negative BOLD response in the PCC and MPFC ROIs. We used FEATquery (FSL) to extract individual BOLD responses and mean time‐series for each ROI. Before calculation of the percentage BOLD signal change during active blocks, the individual time‐series were normalized to the mean BOLD signal. For visualization of mean within‐group time‐series, the following procedure was implemented: Time‐series were first averaged for each participant, and then normalized by setting the mean of the initial passive block (not included in the average time‐course) to an average of 0, and subsequently dividing the time‐course by its standard deviation. Finally, the normalized time‐courses were averaged across the participants within each group.
From the phase‐mapping images, individual CBF values were estimated as follows. An automatic voxel‐wise phase correction was initially performed to correct for aliasing. Based on subtraction images, ROIs were drawn around the right and left ICA and the basilar artery. Volume flow of each vessel was then calculated by multiplying vessel area by mean velocity. Mean global CBF was calculated by dividing the total flow by the total brain volume. Brain volume was extracted from the T1‐weighted images using FAST (FSL).
RESULTS
Neuropsychological and Demographic Data
Table 1 shows participant characteristics and the neuropsychological test scores obtained as a part of the present study. As expected, there was a highly significant between‐group difference with Group A (control group) performing better than Group B (cognitive decline group) on all tests, except for Trail Making A and choice movement time. Group A had a longer mean education than Group B, but no between‐group differences were observed in smoking history, level of physical activity, or self‐reported depressive symptomatology. Mean global CBF and hemoglobin level were equal between groups.
fMRI Data
The experimental task activated widespread areas of the cerebral and cerebellar cortex, including motor and somatosensory regions, visual cortex, and basal ganglia. On the other hand, significant deactivation was observed in the precuneus and posterior cingulate cortex (PCC), the medial prefrontal cortex and frontal pole (MPFC), bilateral parietal areas, the temporal poles, and the hippocampus/parahippocampal gyri (Fig. 2). The average size of the deactivated areas was lower in Group B than in Group A. The third row of Figure 2 shows the statistical analysis of between‐group differences in positive or negative activation at the single‐voxel level, revealing that Group B exhibited increased signal response in a large cluster in the PCC area. This cluster was situated within areas of mean deactivation, and thus indicated attenuated deactivation in Group B.
Figure 2.
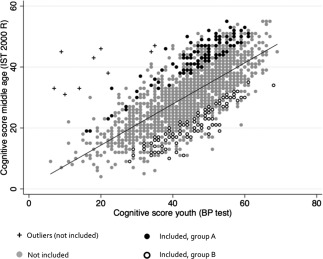
Selection of Group A and Group B. Adult cognitive score (IST 2000 R score) as a linear function of youth score (BPP test score). The regression line shows the average predicted value of IST, based on BP test scores. Subjects invited for the study were selected among those with the highest positive or negative deviations from the predicted value of BP test score.
In addition to the between‐group comparison, we performed voxel‐wise multiple regression analysis of TID I‐S‐T 2000 R and BPP scores as regressors. In this model, I‐S‐T 2000 R reflects a direct measure of cognitive decline. This analysis (not shown) revealed a positive correlation between I‐S‐T 2000 R and TID (cluster corrected P < 0.05) that corresponded closely to the group difference shown in Figure 2. On the other hand, the BPP score correlated negatively to almost the exact same voxels that correlated positively to the I‐S‐T‐2000 R score. Finally, simple regression did not detect any conspicuous independent effect of neither BPP nor I‐S‐T‐2000 R score. This indicates that the relative difference between BPP and I‐S‐T‐2000 R score, i.e. the cognitive change, is most likely the main factor driving the between‐group difference Because of the between‐group difference in total education length, the group comparison was repeated with this factor as a covariate. This adjustment did not change the outcome. Because the size of the BOLD response might generally be dependent on global CBF and hemoglobin level, the voxel‐wise group comparison was also repeated with these factors as covariates. This procedure was implemented in attempt to reduce within‐group variation of BOLD response size caused by individual CBF variations and thereby increase the overall sensitivity of the design. The lower row of Figure 2 shows the areas that were more activated (or less deactivated) within Group B than within Group A, both with and without correction for CBF and hemoglobin. The PCC cluster was largely unchanged by the correction. However, the correction led to the appearance of a large cluster in the medial visual cortex, indicating an increased positive response in this cluster in Group B compared to Group A. These data indicate that there were between‐group differences in positive BOLD response, which were only apparent when controlling for CBF and hemoglobin.
Figure 3 and Table 2 summarize the results of the ROI‐based between‐group TID analysis. The PCC ROI was deactivated in both groups, but the deactivation was significantly larger in Group A (P = 0.002). After one extreme outlier with a strikingly large MPFC ROI deactivation (4.9 standard deviations above group mean) was excluded from Group B, this group exhibited a significantly smaller deactivation within the MPFC ROI than was seen in Group A (P = 0.028, Table 2). The average activated ROIs in motor and visual cortices did not differ between groups. However, a mixed model linear regression for ROI vs. group interactions did not demonstrate any significant difference of group effect between the individual activated and deactivated ROIs. Education length (total number of years in school) was not correlated to BOLD change in any of the ROIs (linear regression, P > 0.05). Figure 4 shows the averaged and normalized time‐courses for each group and ROI, illustrating the mean activation response in motor and visual cortices, as well as the mean deactivation in PCC and MPFC, with the most conspicuous between‐group difference seen in the PCC ROI.
Figure 3.
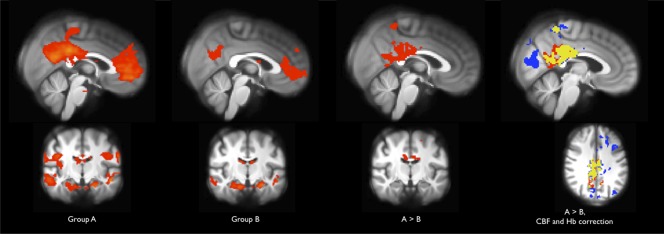
Between‐group differences in task‐induced deactivation. Z maps thresholded at Z > 2.3, cluster corrected P < 0.05. Z values are scaled from 2.3 (red/light blue) to 10.0 (yellow/dark blue). First and second column: Mean deactivation (i.e., negative correlation to the experimental paradigm) within each group. The areas correspond to the DMN and the size is reduced within Group B, compared to Group A. Third column: Between‐group difference. Voxels are less positively correlated to the paradigm, and thus exhibit larger deactivation or smaller activation within Group A than within Group B. Last column: Red: between‐group difference as in third column (185 participants). Blue: between‐group difference corrected for individual CBF and hemoglobin values (165 participants). Yellow: Overlap between the above. The correction strengthens sensitivity and reveals an area within visual cortex, in which the positive BOLD response is smaller for group A than group B.
Table 2.
Between group analysis of task‐induced deactivation (ROI based), CBF and haemoglobin
| Group A; mean (SD) | Group B; mean (SD) | A vs. B; P a | |
|---|---|---|---|
| % BOLD change, ROI mean | |||
| Primary motor cortex right | 1.32 (0.80) | 1.43 (0.71) | 0.31 |
| Visual cortex | 1.90 (0.78) | 1.94 (0.72) | 0.66 |
| Posterior cingulate cortex | −0.40 (0.42) | −0.20 (0.46) | 0.0024 |
| Medial prefrontal cortex | −0.34 (0.52) | −0.20 (0.64) | 0.10 |
| Medial prefrontal cortex (1 group B outlier excluded) | −0.34 (0.52) | −0.17 (0.56) | 0.028 |
| CBF (ml/100 g min−1) (86 Group A participants, 85 Group B participants) | 54.4 (13.1) | 54.0 (14.1) | 0.84 |
| Hb (mmol L−1) (88 Group A participants, 89 Group B participants) | 9.3 (0.55) | 9.3 (0.65) | 0.77 |
T test.
Figure 4.
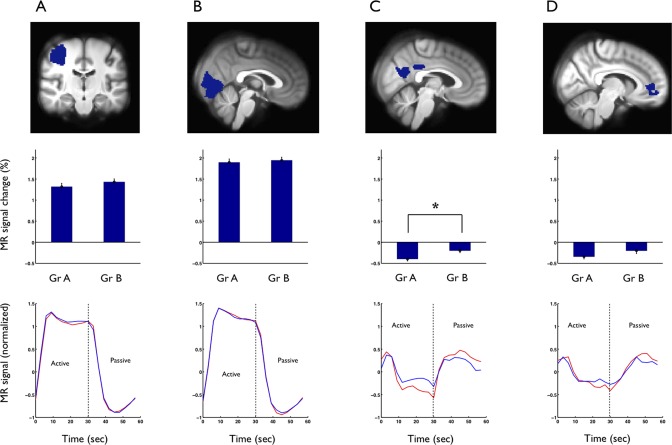
Regional analysis, including right motor cortex (A), visual cortex (B), posterior cingulate cortex (C), and medial prefrontal cortex (D). First row: The defined ROIs. Middle row: % BOLD change within each ROI during task, mean for each group. Individual ROI time series are normalized to the mean signal. Error bars are SEM. A between‐group difference was demonstrated within the PCC ROI, *P = 0.0024. Lower row: Time courses (normalized to the initial fixation block), mean for each group and ROI, the between‐group difference is clearly visible for the PCC ROI. Red: Group A, Blue: Group B.
Figure 5 shows that the BOLD response magnitude in each deactivated region correlated positively to the response magnitude in activated areas, indicating that individuals with small or no TID tended to exhibit the largest positive BOLD response in motor and visual cortices. To identify the cognitive domains most closely related to the TID, the individual BOLD amplitude within each ROI was correlated to the individual current neuropsychological test scores (Table 3). The Trail Making A test score was found to be positively correlated to the deactivation in PCC, indicating a correlation between decreased performance and less‐pronounced TID. None of the positively activated ROIs (motor and visual cortices) correlated with any of the cognitive test scores.
Figure 5.
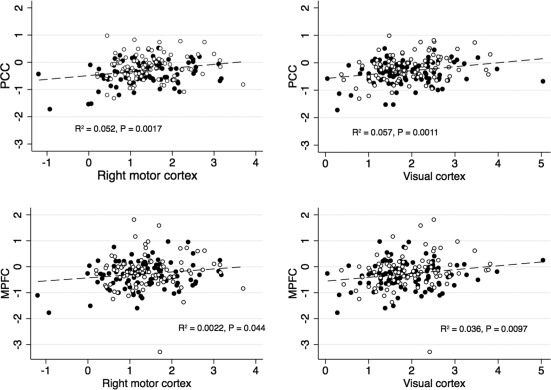
Inter‐correlations between BOLD response size in activated and deactivated ROIs. % BOLD change during the task. Black: Group A, white: Group B. Larger deactivation in PCC and MPFC corresponded to a smaller activation response in motor and visual cortices.
Table 3.
Linear correlations between cognitive test scores and BOLD signal change in deactivated ROIs (negative correlations indicate that less deactivation corresponds to higher value of the cognitive score)
| ROI | Test | R | P |
|---|---|---|---|
| PCC | Trail making A | 0.17 | 0.02 |
| PCC | Trail making B | 0.088 | 0.23 |
| PCC | 15 Word paired associates learning | −0.074 | 0.32 |
| PCC | 15 Word paired associates recall | −0.074 | 0.32 |
| PCC | Paired associates learning | 0.0021 | 0.98 |
| PCC | Rapid visual processing | −0.11 | 0.15 |
| PCC | Movement time | 0.028 | 0.71 |
| MPFC | Trail making A | 0.035 | 0.63 |
| MPFC | Trail making B | 0.020 | 0.79 |
| MPFC | 15 Word paired associates learning | −0.079 | 0.28 |
| MPFC | 15 Word paired associates recall | −0.082 | 0.27 |
| MPFC | Paired associates learning | 0.13 | 0.09 |
| MPFC | Rapid visual processing | −0.057 | 0.45 |
| MPFC | Movement time | 0.019 | 0.80 |
In addition to this cross‐sectional perspective, we performed an analysis emphasizing the change in cognition by repeating the regression with the draft board cognitive score (BPP) as a covariate (data not shown). This adjustment did not significantly change any correlations, except for the appearance of a negative correlation between PCC signal amplitude and the rapid visual processing score (P = 0.048). None of the P values survived correction for multiple comparisons, and the effect sizes were small; hence, the data does not support a clear correlation between TID and the present neuropsychological test scores.
DISCUSSION
Controlling for individual early‐life cognition in the present study enabled the selection of two groups that each exhibited a different degree of life‐long changes in cognitive abilities. This longitudinal study design provides a unique opportunity to investigate the relationship between functional brain changes and age‐related cognitive decline.
Our results demonstrated reduced TID during a visual‐motor task in healthy middle‐aged men with subclinical cognitive decline (Group B), suggesting that this group might be in an early stage of pathological development. This reduction was not accompanied by decreased positive BOLD response in activated areas. In fact, when the analysis was adjusted to include individual CBF and hemoglobin levels as covariates, the decline group exhibited an increased active response in an area within the visual cortex. As it is generally expected that increased perfusion tend to decrease the BOLD response due to a ceiling effect, we would expect inclusion of these factors to increase sensitivity of the design, attenuating variation in the response size caused by CBF variations. This should not induce group differences in the positive or negative BOLD response, as CBF did not differ between groups. However, the procedure did not change the main findings of the study significantly.
ROI analysis revealed a significant group effect in deactivated areas but not in activated areas, and no significant group–ROI interaction was observed. Moreover, the individual responses in activated regions were positively correlated with those in deactivated regions, indicating that individuals with a relatively large positive response tended to deactivate less.
The present study addresses individual cognitive decline, which is estimated as the change between cognitive level in youth (mean age 20 years) and middle‐age. This model assumes that cognitive performance has reached its peak level at age 20, while some cognitive functions are likely to develop further in the twenties. There are, however, no reasons to expect systematically different development in two groups of individuals with almost identical intelligence scores at age 20, and consequently further intellectual development after age 20 should not invalidate the comparison of our two groups.
The two study groups were selected based on extreme differences in cognitive test scores in youth and middle‐age. To confirm that these differences reflected true changes in cognitive function as opposed to random measurement error alone, the participants were tested neuropsychologically a third time, as a part of the current study protocol. Although less significant than the I‐S‐T 2000 R score, these tests also showed clear group differences, thus there can be no doubt that we identified two groups with substantial differences in cognitive function. Furthermore, as the regression model predicts the expected performance in middle‐age given the youth performance (“expected” estimated as mean of the whole population of 1985 CAMB participants), and the two groups were selected as performing better than expected or worse than expected, respectively, we thus know that they showed different patterns of relative change, most likely in a way that at least group A exhibited a considerable decline in absolute performance. The mean within‐group I‐S‐T‐ 2000R score differ between groups by 21.3, which equals 2.1 SDs (Table 1) which indicates a considerable IQ difference.
Another important consideration was whether Group B might contain a substantial proportion of undiagnosed MCI patients, attenuating the mean TID. The National Institute on Aging and Alzheimer's Association's definition of MCI due to Alzheimer's disease [Albert et al., 2011] states that concern about cognitive change is a core clinical criterion for MCI, and none of our participants had any such concern. Furthermore, both the mean and the minimum MMSE scores in Group B were considerably higher than those of most MCI study populations [Bosch et al., 2010; Rombouts et al., 2005], indicating that the Group B exhibited a better general cognitive status than a typical MCI population. Thus, we speculate that Group B represents an at‐risk group for development of cognitive impairment. We cannot yet be certain that this is the case, but follow‐up studies will be performed to clarify this.
There are several possible interpretations of the TID alterations in Group B. If the TID reduction in Group B was caused by compromised vascular responsiveness due to preclinical cerebrovascular disease, we would expect to also see decreased positive activation, as previously demonstrated in patients with lacunar stroke [Pineiro, 2002] and with disturbed cerebrovascular reserve capacity due to carotid stenosis [Hamzei et al., 2003]; however, this was not the case. Furthermore, our data included no evidence of between‐group differences in vascular risk factors (tobacco exposure and physical activity level), which also argues against this hypothesis. TID in DMN areas is often interpreted as a consequence of processing capacity being directed toward regions involved in the active task [McKiernan et al., 2003; Rombouts et al., 2005]; in which case, reduced TID might indicate decreased ability to adapt to the task. However, this would suggest that participants with the largest capacity to redirect resources from nonactive to active areas should activate the most, and thus the presently observed positive correlation between responses in activated and deactivated areas would not be expected.
Rather than identifying a specific TID effect, our present data seems to indicate that Group B shows a displacement of responses in both deactivated and activated areas toward a more positive direction, suggesting a global group effect. This pattern of decreased TID accompanied by an increased positive BOLD response has been previously demonstrated in a group of healthy older adults during a series of cognitive tasks [Grady et al., 2010]. That study also showed a positive correlation between task performance and activation indices, leading to the suggestion that older individuals who found the specific task difficult tended to engage cognitive control processes to a greater degree. However, the present study demonstrated a similar pattern of activation and deactivation changes during a visual–motor task with low cognitive demands, indicating that cognitive compensation processes are probably not the only underlying mechanism.
Another recent study showed a highly significant correlation between TID in the anterior cingulate cortex during a cognitive task and the concentration of the inhibitory neurotransmitter GABA in the same region, suggesting the potential mediation of TID by GABA [Northoff et al., 2007]. Other studies have described an inverse correlation between GABA level and the positive BOLD response in visual cortex [Donahue et al., 2010; Gao et al., 2013; Muthukumaraswamy et al., 2011] showed recently that GABA concentrations in the frontal and parietal regions decrease with age throughout adult life. Furthermore, several animal studies have linked a decreased level of GABA or GABA neurons to effects on behavioral task performance, [Hua et al., 2008]. Overall, the findings in the present study are in accordance with a global attenuation of GABAergic activity within Group B.
Moreover, in contrast to the study by Grady et al. [2010], our participants were exactly the same age with cognitive decline being the only differing factor, which eliminates the possibility that the activity pattern changes are due to age, and rather suggests changes in general information processing as a contributing mechanism.
During a low‐load cognitive task, we demonstrated TID in regions that are considered to be part of the DMN, including hippocampus bilaterally. It is generally believed that a certain degree of cognitive load is necessary to deactivate the DMN. One study detected no deactivation during a passive sensory task in healthy participants, and concluded that DMN activity may persist if the task is not sufficiently challenging [Greicius and Menon, 2004]. Although the task used in the present study has only limited cognitive demands, it includes both a passive and an active element, and activates large areas of the brain. Thus, the present data might suggest that distribution of activation is more important than cognitive load for deactivation induction. From a practical point of view, our demonstration of TID in a task with low cognitive challenge is important, as this kind of test is far more easily administered in clinical practice than a classical cognitive task.
Although there is consensus that TID in DMN areas reflects the fact that specific higher‐order continuous mental processes occur more commonly during passive blocks than during tasks or stimuli [Gilbert et al., 2012], and despite the evidence concerning the role of GABAergic neurons, the physiological mechanism mediating TID is not yet understood. It can probably not be ruled out that TID is at least partly caused by a simple redistribution of oxygenated blood to activated areas [Gusnard and Raichle, 2001]. However, this cannot explain the presently observed positive correlation between the BOLD responses in activated and deactivated areas. Therefore, the present finding could be considered an argument against vascular redistribution as a primary cause of TID.
In conclusion, the present study was designed to account for the biological variation in pre‐aging cognitive ability when evaluating late‐midlife cognitive changes. Our results demonstrated a significant reduction of deactivation within the DMN in the decline group, similar to results from MCI and dementia patients. We also demonstrated that this could not be explained exclusively by difference in education level or global CBF, and that positive BOLD activation was not decreased, indicating that generally reduced vascular responsiveness for example caused by lifestyle factors was unlikely to be responsible for the TID differences alone. Although the individual variability turned out to be quite high, our results indicate that TID during a simple task could be a possible early marker for accelerated cognitive decline in aging, before any clinical disorder is present. The predictive value therefore needs to be investigated in future studies, including a follow‐up of the present sample.
REFERENCES
- Albert MS, DeKosky ST, Dickson D, Dubois B, Feldman HH, Fox NC, Gamst A, Holtzman DM, Jagust WJ, Petersen RC, Snyder PJ, Carrillo MC, Thies B, Phelps CH (2011): The diagnosis of mild cognitive impairment due to Alzheimer's disease: Recommendations from the National Institute on Aging‐Alzheimer's Association workgroups on diagnostic guidelines for Alzheimer's disease. Alzheimer's Dementia 7:270–279. [DOI] [PMC free article] [PubMed] [Google Scholar]
- Andersson JL, Jenkinson M, Smith S (2007a): Non‐linear registration, aka Spatial normalisation FMRIB technical report TR07JA2. FMRIB Analysis Group of the University of Oxford. [Google Scholar]
- Andersson JL, Jenkinson M, Smith S, Andersson J (2007b): Non‐linear optimisation. FMRIB technical report TR07JA1. [Google Scholar]
- Andrews‐Hanna JR, Snyder AZ, Vincent JL, Lustig C, Head D, Raichle ME, Buckner RL (2007): Disruption of large‐scale brain systems in advanced aging. Neuron 56:924–935. [DOI] [PMC free article] [PubMed] [Google Scholar]
- Arnau RC, Meagher MW, Norris MP, Bramson R (2001): Psychometric evaluation of the Beck Depression Inventory‐II with primary care medical patients. Health Psychol 20:112–119. [DOI] [PubMed] [Google Scholar]
- Beckmann CF, Jenkinson M, Smith SM (2003): General multilevel linear modeling for group analysis in FMRI. Neuroimage 20:1052–1063. [DOI] [PubMed] [Google Scholar]
- Bosch B, Bartrés‐Faz D, Rami L, Arenaza‐Urquijo EM, FernAndez‐Espejo D, Junqué C, SolE‐PadullEs C, SAnchez‐Valle R, Bargalló N, FalcOn C, Molinuevo J‐L (2010): Cognitive reserve modulates task‐induced activations and deactivations in healthy elders, amnestic mild cognitive impairment and mild Alzheimer's disease. Cortex 46:451–461. [DOI] [PubMed] [Google Scholar]
- Brayne C (2007): The elephant in the room—Healthy brains in later life, epidemiology and public health. Nat Rev Neurosci 8:233–239. [DOI] [PubMed] [Google Scholar]
- Brevik EJ, Eikeland RA, Lundervold AJ (2013): Subthreshold depressive symptoms have a negative impact on cognitive functioning in middle‐aged and older males. Front Psychol 4:1–8. [DOI] [PMC free article] [PubMed] [Google Scholar]
- Buckner RL, Andrews‐Hanna JR, Schacter DL (2008): The brain's default network: Anatomy, function, and relevance to disease. Ann N Y Acad Sci 1124:1–38. [DOI] [PubMed] [Google Scholar]
- Celone KA, Calhoun VD, Dickerson BC, Atri A, Chua EF, Miller SL, DePeau K, Rentz DM, Selkoe DJ, Blacker D, Albert MS, Sperling RA (2006): Alterations in memory networks in mild cognitive impairment and Alzheimer's disease: An independent component analysis. J Neurosci 26:10222–10231. [DOI] [PMC free article] [PubMed] [Google Scholar]
- Deary IJ, Johnson W, Starr JM (2010): Are processing speed tasks biomarkers of cognitive aging? Psychol Aging 25:219–228. [DOI] [PubMed] [Google Scholar]
- Donahue MJ, Near J, Blicher JU, Jezzard P (2010): Baseline GABA concentration and fMRI response. Neuroimage 53:392–398. [DOI] [PubMed] [Google Scholar]
- Fleisher AS, Sherzai A, Taylor C, Langbaum JBS, Chen K, Buxton RB (2009): Resting‐state BOLD networks versus task‐associated functional MRI for distinguishing Alzheimer's disease risk groups. Neuroimage 47:1678–1690. [DOI] [PMC free article] [PubMed] [Google Scholar]
- Gao F, Edden RAE, Li M, Puts NAJ, Wang G, Liu C, Zhao B, Wang H, Bai X, Zhao C, Wang X, Barker PB (2013): Edited magnetic resonance spectroscopy detects an age‐related decline in brain GABA levels. Neuroimage 78:75–82. [DOI] [PMC free article] [PubMed] [Google Scholar]
- Gilbert SJ, Bird G, Frith CD, Burgess PW (2012): Does “task difficulty” explain “task‐induced deactivation?.” Front Psychol 3:125. [DOI] [PMC free article] [PubMed] [Google Scholar]
- Gow AJ, Johnson W, Pattie A, Brett CE, Roberts B, Starr JM, Deary IJ (2011): Stability and change in intelligence from age 11 to ages 70, 79, and 87: The Lothian Birth Cohorts of 1921 and 1936. Psychol Aging 26:232–240. [DOI] [PubMed] [Google Scholar]
- Grady CL, Springer MV, Hongwanishkul D, McIntosh AR, Winocur G (2006): Age‐related changes in brain activity across the adult lifespan. J Cogn Neurosci 18:227–241. [DOI] [PubMed] [Google Scholar]
- Grady CL, Protzner AB, Kovacevic N, Strother SC, Afshin‐Pour B, Wojtowicz M, Anderson JAE, Churchill N, McIntosh AR (2010): A multivariate analysis of age‐related differences in default mode and task‐positive networks across multiple cognitive domains. Cereb Cortex 20:1432–1447. [DOI] [PMC free article] [PubMed] [Google Scholar]
- Greicius MD, Menon V (2004): Default‐mode activity during a passive sensory task: Uncoupled from deactivation but impacting activation. J Cogn Neurosci 16:1484–1492. [DOI] [PubMed] [Google Scholar]
- Gusnard DA, Raichle ME (2001): Searching for a baseline: Functional imaging and the resting human brain. Nat Rev Neurosci 2:685–694. [DOI] [PubMed] [Google Scholar]
- Hafkemeijer A, van der Grond J, Rombouts SARB (2011): Imaging the default mode network in aging and dementia. Biochim Biophys Acta 1833:431–441. [DOI] [PubMed] [Google Scholar]
- Hamzei F, Knab R, Weiller C, Röther J (2003): The influence of extra‐ and intracranial artery disease on the BOLD signal in FMRI. Neuroimage 20:1393–1399. [DOI] [PubMed] [Google Scholar]
- Hedden T, Gabrieli JDE (2004): Insights into the ageing mind: A view from cognitive neuroscience. Nat Rev Neurosci 5:87–96. [DOI] [PubMed] [Google Scholar]
- Hua T, Kao C, Sun Q, Li X, Zhou Y (2008): Decreased proportion of GABA neurons accompanies age‐related degradation of neuronal function in cat striate cortex. Brain Res Bull 75:119–125. [DOI] [PubMed] [Google Scholar]
- Jenkinson M, Bannister P, Brady M, Smith S (2002): Improved optimization for the robust and accurate linear registration and motion correction of brain images. Neuroimage 17:825–841. [DOI] [PubMed] [Google Scholar]
- Kirkwood TBL (2008): Gerontology: Healthy old age. Nature 455:739–740. [DOI] [PubMed] [Google Scholar]
- Lustig C, Snyder AZ, Bhakta M, O'Brien KC, McAvoy M, Raichle ME, Morris JC, Buckner RL (2003): Functional deactivations: change with age and dementia of the Alzheimer type. Proc Natl Acad Sci USA 100:14504–14509. [DOI] [PMC free article] [PubMed] [Google Scholar]
- McKiernan KA, Kaufman JN, Kucera‐Thompson J, Binder JR (2003): A parametric manipulation of factors affecting task‐induced deactivation in functional neuroimaging. J Cogn Neurosci 15:394–408. [DOI] [PubMed] [Google Scholar]
- Muthukumaraswamy SD, Evans CJ, Edden RAE, Wise RG, Singh KD (2011): Individual variability in the shape and amplitude of the BOLD‐HRF correlates with endogenous GABAergic inhibition. Hum Brain Mapp 33:455–465. [DOI] [PMC free article] [PubMed] [Google Scholar]
- Northoff G, Walter M, Schulte RF, Beck J, Dydak U, Henning A, Boeker H, Grimm S, Boesiger P (2007): GABA concentrations in the human anterior cingulate cortex predict negative BOLD responses in fMRI. Nat Neurosci 10:1515–1517. [DOI] [PubMed] [Google Scholar]
- Osler M (2006): Cohort profile: The metropolit 1953 Danish male birth cohort. Int J Epidemiol 35:541–545. [DOI] [PubMed] [Google Scholar]
- Osler M, Avlund K, Mortensen EL (2013): Socio‐economic position early in life, cognitive development and cognitive change from young adulthood to middle age. Eur J Public Health 23:974–980. [DOI] [PubMed] [Google Scholar]
- Persson J, Lind J, Larsson A, Ingvar M, Sleegers K, Van Broeckhoven C, Adolfsson R, Nilsson L‐G, Nyberg L (2008): Altered deactivation in individuals with genetic risk for Alzheimer's disease. Neuropsychologia 46:1679–1687. [DOI] [PubMed] [Google Scholar]
- Pihlajamäki M, Sperling RA (2009): Functional MRI assessment of task‐induced deactivation of the default mode network in Alzheimer's disease and at‐risk older individuals. Behav Neurol 21:77–91. [DOI] [PMC free article] [PubMed] [Google Scholar]
- Pineiro R (2002): Altered hemodynamic responses in patients after subcortical stroke measured by functional MRI. Stroke 33:103–109. [DOI] [PubMed] [Google Scholar]
- Raichle ME, MacLeod AM, Snyder AZ, Powers WJ, Gusnard DA, Shulman GL (2001): A default mode of brain function. Proc Natl Acad Sci USA 98:676–682. [DOI] [PMC free article] [PubMed] [Google Scholar]
- Rombouts SARB, Barkhof F, Goekoop R, Stam CJ, Scheltens P (2005): Altered resting state networks in mild cognitive impairment and mild Alzheimer's disease: An fMRI study. Hum Brain Mapp 26:231–239. [DOI] [PMC free article] [PubMed] [Google Scholar]
- Schaie KW, Willis SL, Caskie GIL (2004): The Seattle longitudinal study: Relationship between personality and cognition. Aging Neuropsychol Cogn 11:304–324. [DOI] [PMC free article] [PubMed] [Google Scholar]
- Shulman GL, Fiez JA, Corbetta M, Buckner RL, Miezin FM, Raichle ME, Petersen SE (1997): Common blood flow changes across visual tasks: II. Decreases in cerebral cortex. J Cogn Neurosci 9:648–663. [DOI] [PubMed] [Google Scholar]
- Smith SM (2002): Fast robust automated brain extraction. Hum Brain Mapp 17:143–155. [DOI] [PMC free article] [PubMed] [Google Scholar]
- Sperling RA, LaViolette PS, O'Keefe K, O'Brien J, Rentz DM, Pihlajamäki M, Marshall G, Hyman BT, Selkoe DJ, Hedden T, Buckner RL, Becker JA, Johnson KA (2009): Amyloid deposition is associated with impaired default network function in older persons without dementia. Neuron 63:178–188. [DOI] [PMC free article] [PubMed] [Google Scholar]
- Teasdale TW, Hartmann PVW, Pedersen CH, Bertelsen M (2010): The reliability and validity of the Danish draft board cognitive ability test: Børge Prien's Prøve. Scand J Psychol 52:126–130. [DOI] [PubMed] [Google Scholar]
- Weiner MW, Veitch DP, Aisen PS, Beckett LA, Cairns NJ, Green RC, D Harvey, CR Jack, W Jagust, E Liu, JC Morris, RC Petersen, AJ Saykin, ME Schmidt, L Shaw, JA Siuciak, H Soares, AW Toga, JQ Trojanowski (2012): The Alzheimer's disease neuroimaging initiative: A review of papers published since its inception. Alzheimer's Demen 8:S1–S68. [DOI] [PMC free article] [PubMed] [Google Scholar]
- Woolrich MW (2008): Robust group analysis using outlier inference. Neuroimage 41:286–301. [DOI] [PubMed] [Google Scholar]
- Woolrich MW, Ripley BD, Brady M, Smith SM (2001): Temporal autocorrelation in univariate linear modeling of FMRI data. Neuroimage 14:1370–1386. [DOI] [PubMed] [Google Scholar]
- Woolrich MW, Behrens TEJ, Beckmann CF, Jenkinson M, Smith SM (2004): Multilevel linear modelling for FMRI group analysis using Bayesian inference. Neuroimage 21:1732–1747. [DOI] [PubMed] [Google Scholar]