

Abstract
Newer approaches to characterizing hippocampal morphology can provide novel insights regarding cognitive function across the lifespan. We comprehensively assessed the relationships among age, hippocampal morphology, and hippocampal‐dependent cognitive function in 137 healthy individuals across the adult lifespan (18–86 years of age). They underwent MRI, cognitive assessments and genotyping for Apolipoprotein E status. We measured hippocampal subfield volumes using a new multiatlas segmentation tool (MAGeT‐Brain) and assessed vertex‐wise (inward and outward displacements) and global surface‐based descriptions of hippocampus morphology. We examined the effects of age on hippocampal morphology, as well as the relationship among age, hippocampal morphology, and episodic and working memory performance. Age and volume were modestly correlated across hippocampal subfields. Significant patterns of inward and outward displacement in hippocampal head and tail were associated with age. The first principal shape component of the left hippocampus, characterized by a lengthening of the antero‐posterior axis was prominently associated with working memory performance across the adult lifespan. In contrast, no significant relationships were found among subfield volumes and cognitive performance. Our findings demonstrate that hippocampal shape plays a unique and important role in hippocampal‐dependent cognitive aging across the adult lifespan, meriting consideration as a biomarker in strategies targeting the delay of cognitive aging. Hum Brain Mapp 36:3020–3037, 2015. © 2015 Wiley Periodicals, Inc.
Keywords: aging, MRI, morphometry, cognition, memory, hippocampus
INTRODUCTION
Despite the predominant view of age‐related structural susceptibility of the hippocampus and its role in episodic memory [Squire, 1992; Tulving, 2002; Van Petten, 2004] and working memory [Beauchamp et al., 2008; Yonelinas, 2013] performance, there are conflicting results in the literature on both accounts. While some studies have shown a relationship of volume with age, others have not [Head et al., 2005; Jack et al., 1997; Jernigan and Gamst, 2005; Jernigan et al., 2001; Lupien et al., 2007; Malykhin et al., 2008; Pruessner et al., 2001; Sullivan et al., 2005; Sullivan et al., 1995]. These inconsistent results may be due to the use of volumetric measurements focused on the whole hippocampus or anterior or posterior sections [Raz and Rodrigue, 2006; Shing et al., 2011; Van Petten, 2004]. In recent years, approaches indexing hippocampal subfield volume and shape have provided novel alternatives for characterization of hippocampal morphology in vivo [Winterburn et al., 2013; Yang et al., 2013; Yushkevich et al., 2010, 2009]. As the hippocampus is not a homogeneous structure, application of these new approaches may help to address the inconsistent findings from more conventional measurements of hippocampal structure [La Joie et al., 2010; Mueller and Weiner, 2009; Mueller et al., 2007; Yang et al., 2013]. They may also help to clarify whether age‐related cognitive decline is associated with changes in hippocampal morphology.
Similar to studies of hippocampal volume and age, studies of the relationships of hippocampal volume with episodic and working memory performance, particularly in the context of aging, have not been consistent [Della‐Maggiore et al., 2002; Raz and Rodrigue, 2006; Van Petten, 2004]. Higher‐field scanners and novel segmentation approaches enable studies examining the relationship both of hippocampal subfield volume with age [La Joie et al., 2010; Mueller and Weiner, 2009; Mueller et al., 2007], and of subfield volume with cognitive performance [Engvig et al., 2012; Shing et al., 2011]. Hippocampal subfields seem susceptible to age‐related effects, although not consistently across studies, with findings overlapping with changes observed in pathological aging, in particular in the CA1 subregion [Kerchner et al., 2012; Mueller and Weiner, 2009; Mueller et al., 2010, 2007]. Recent studies of hippocampal shape metrics have demonstrated differences between normal and pathological aging (particularly Alzheimer's disease) [Carmichael et al., 2012; Kerchner et al., 2012; Tondelli et al., 2012]. Shape metrics may offer classification or distinction among groups beyond conventional volumetric measures of the hippocampus [Achterberg et al., 2013], and predict conversion to disease [Shen et al., 2012]. Volume metrics are global measures of an entire structure or substructure (e.g., single number representation), whereas shape metrics provide more nuanced, multidimensional and local descriptions of difference (e.g., an entire mesh of displacements). This capacity for nuance may lead to better discrimination [Raznahan et al., 2014; Shaw et al., 2014b]. However, the relationship between hippocampal shape metrics and cognitive function across adult life is not known.
We have built a freely available (cobralab.ca/atlases/Hippocampus) high‐resolution hippocampal atlas that reliably delineates subfields [Winterburn et al., 2013]. In combination with the Multiple Automatically Generated Template (MAGeT‐Brain; https://cobralab.ca/software/MAGeTBrain) segmentation approach, we have shown that this atlas can be successfully used to segment the hippocampus and its subfields in a population‐based study [Pipitone et al., 2014]. The combination of these approaches permits high‐throughput analysis of hippocampal morphology in a large sample. Within the present investigation, we also developed an approach that used our subfield atlases to assess both local and global hippocampal shape. Taken together, these approaches allow for a comprehensive investigation of hippocampal morphology. Therefore, we applied these approaches in a relatively large sample (n = 137) of healthy individuals across the adult lifespan (age range: 18–86) to determine relationships among age, hippocampal morphology, and episodic and working memory performance. We also analyzed the effects of Apolipoprotein E (APOE) genetic variation due to its effect on hippocampal volume reported by some [Mueller and Weiner, 2009] but not all studies [Morra et al., 2009]. We hypothesized that: (i) all subfields would decrease in volume with age; (ii) hippocampal shape would change with age; and (iii) hippocampal shape and subfield volumes would be associated with hippocampal‐dependent cognitive function.
METHODS
Subjects
A total of 137 healthy volunteers [mean (SD) age: 45.4 (19.0); range: 18–86] were recruited at the Centre for Addiction and Mental Health (CAMH) in Toronto, Canada, as part of an ongoing neuroimaging, genetics, and cognition research program in neuropsychiatric disorders. Persons with previous head trauma and loss of consciousness, a neurological disorder, a history of primary psychotic disorder in a first‐degree relative, current substance abuse (urine toxicology screens were obtained in all potential subjects), or a history of substance dependence were excluded from the study. All study procedures complied with the Declaration of Helsinki and were approved by the CAMH Research Ethics Board; all subjects provided written, informed consent. Subjects were assessed with the Edinburgh Handedness Inventory [Oldfield, 1971], the Hollingshead Four‐Factor Index of Socioeconomic Status [Hollingshead, 1975], and the Wechsler Test of Adult Reading (WTAR) [Wechsler, 2001] for IQ. They completed the Structured Clinical Interview for DSM‐IV‐TR Axis I Disorders [First et al., 2001] to ensure they were free of neuropsychiatric disorders, and were screened for dementia using the Mini Mental State Examination (MMSE) [Folstein et al., 1975] (Table 1).
Table 1.
Demographic characteristics of subjects.
| Demographic | Mean (SD) |
|---|---|
| Age | 45.39 (19.02) |
| Education (years) | 15.42 (1.95) |
| WTAR (IQ) | 117.87 (7.83)+ |
| MMSE | 29.33 (0.92)++ |
| N | |
| Gender | 72M, 65F |
| Handedness | 128R, 9L |
| APOE ε4 | 35C(4 homozygous), 98NC+++ |
WTAR = Wechsler Test of Adult Reading.
MMSE= Mini Mental State Examination.
C = carrier; NC = noncarrier.
NA = Test not administered.
+ 3 NA.
++ 2 NA.
+++ 4 NA.
Neurocognitive Assessment
Each subject underwent a comprehensive neurocognitive battery. The present analyses focus on verbal episodic memory, visuospatial episodic memory, and working memory: tests within the Repeatable Battery for the Assessment of Neuropsychological Status [Hobart et al., 1999] were used to assess verbal episodic memory (‘list recall’) and visuospatial episodic memory (‘figure recall’). The Letter Number Sequence (LNS) test was used to assess verbal working memory performance. Complete cognitive data were available for 133 subjects (Table 2).
Table 2.
Mean Cognitive Scores and Effect of age on cognition based on a general linear model (with sex included in the model).
| Cognitive task | Mean score (SD) | P | R 2 |
|---|---|---|---|
| Letter Number Sequence (LNS) | 16.17 (3.35) | 0.021a | 0.033 |
| List Recall | 7.20 (2.15) | <0.0001a | 0.14 |
| Figure Recall | 11.87 (4.16) | <0.0001a | 0.14 |
R 2 values are adjusted and apply to the effect of age only.
Indicates P < 0.05.
APOE ε4 Genotyping
APOE ε4 carrier status was obtained by combining genotypes at rs7412 and rs429358. These SNPs were genotyped directly using standard ABI TaqMan Assay‐on‐Demand protocols and 10% of sample genotypes were duplicated for quality control with 100% reliability. Genetic information was available for 133 subjects (Table 1).
Image Acquisition
T1‐weighted magnetic resonance (MR) images were acquired for each subject using an 8‐channel head coil on a 1.5 T GE Echospeed system (General Electric Medical Systems; Fairfield, Connecticut). Images were acquired using an axial inversion recovery‐prepared spoiled gradient‐recalled sequence with echo time 5.3 ms, repetition time 12.3 ms, time to inversion 300.0 ms, flip angle, 20°, and 1 excitation, for a total of 124 contiguous slices with 1.5 mm thickness and 0.78 mm × 0.78 mm in‐plane voxel.
Image Segmentation
The first step in the analysis was to segment the hippocampus and hippocampal subfields on the T1‐weighted images of all subjects. Segmentations were performed using the MAGeT‐brain multiatlas segmentation tool, which leverages the neuroanatomical variability of a subject population to boost segmentation accuracy (Fig. 1) [Chakravarty et al., 2013; Park et al., 2014; Pipitone et al., 2014]. Five high‐resolution (300 µm isotropic voxels) in vivo atlases of the hippocampus and hippocampal subfields were used for the automatic segmentation pipeline [Winterburn et al., 2013]. These atlases include definitions for the right and left CA1, CA2/CA3, CA4/dentate gyrus, strata radiatum/lacunosum/moleculare (SR/SL/SM), and subiculum. For further information on the MAGeT‐Brain segmentation pipeline, see the Supporting Information. Segmented images were inspected by one of the authors (JLW), an expert in hippocampal subfield segmentation, to ensure high segmentation quality. Total brain volume (TBV) was estimated using mincBEAST [Eskildsen et al., 2013], an automated pipeline that is a part of the MINC toolkit (MNI, Montreal).
Figure 1.
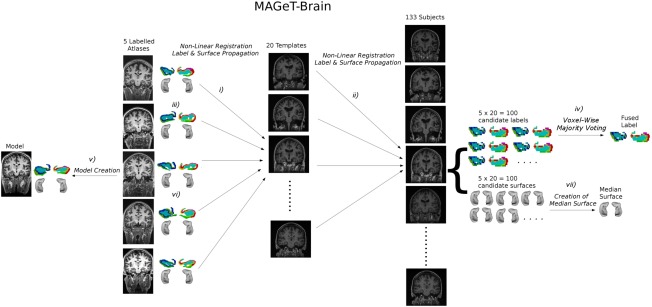
MAGeT‐Brain image registration and automatic segmentation pipeline: (i) 5 manually labeled atlases are registered nonlinearly to a subset of the subject population (templates, in this case 20). (ii) Each image from the template library is registered to every subject image. (iii) Labels are propagated along each possible registration pathway such that there are 100 (5 atlases x 20 templates) candidate segmentations for each subject. (iv) Creation of a single fused label for each subject via voxel‐wise majority voting. (v) A single model image is created from the 5 atlas images, and a single surface‐based representation of the hippocampus is created. (vi) The model surface is propagated along the MAGeT‐Brain registration pathways. (vii) A single surface is created for each subject from the 100 candidate surfaces by determining the median position of each vertex.
Morphometric Analyses
Model creation
Analysis of the shape characteristics of a structure can provide information that is neuroanatomically unique in relation to volumetric assessment [Csernansky et al., 2005; Miller et al., 2009; Zhao et al., 2008]. Like most analyses in neuroimaging research, a common volumetric [Mazziotta et al., 1995] or surface‐based [Raznahan et al., 2014] model is required to facilitate group analyses. For the analyses presented in this manuscript, we derived a model that is the average neuroanatomical representation of all five expertly segmented atlases used as input to the MAGeT‐Brain pipeline (referred to henceforth as the model). This model has superior contrast, signal, and definition when compared to a single atlas and provides a common space for analysis of surface‐based metrics (see below). From this model we were able to derive models of the hippocampus with ∼10,000 vertices/hemisphere that we used as input to local (or vertex‐based) and global (from a point distribution model) analyses. See the Supporting Information for further details.
Local (univariate) morphometric analysis
We used a surface‐based metric proposed by Lerch et al. for analyzing hippocampal shape differences in a population [Lerch et al., 2008]. This method, along with local surface area metrics, has been used recently in morphometric analyses of the striatum, thalamus, and pallidum [Chakravarty et al., 2015; Magon et al., 2014; Raznahan et al., 2014; Shaw et al., 2014b]. In the present work, we have refined this technique and applied it to whole hippocampal morphology in a multiatlas framework. Briefly, this technique estimates the local shape differences of the hippocampus using surface displacements, and a univariate (vertex‐wise) analysis is conducted using the surface‐based representations of the left and right whole hippocampi created on the final model (described above). All possible combinations of nonlinear transformations for each subject were mapped and averaged to reduce noise and increase signal. Surface displacements at each vertex relative to the model were estimated between each deformation vector and the normal at each vertex on the surface using a dot product (Fig. 2). See the Supporting Information for further details.
Figure 2.
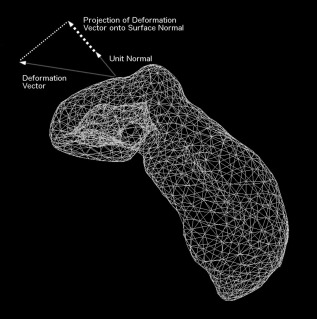
Surface‐based local morphometric analysis: Projection of the deformation vector at each vertex onto the unit vector of the surface normal at the same vertex (dot product) to determine the magnitude of displacement in the direction perpendicular to the surface at each vertex.
Global (multivariate) morphometric analysis
While measuring local surface displacement is one descriptor of morphometry, it does not describe global shape patterns for a structure. We used a point‐distribution model of the vertices across all subjects and analyzed their variance using a principal component analysis (PCA) to explore global hippocampal shape [Chakravarty et al., 2011; Cootes et al., 1995]. Using each possible transformation mapping the model to each subject we were able to derive a median surface‐based representation of each hippocampus (Fig. 1, vi & vii). All hippocampi were then normalized for 12‐parameter linear dimensions (3 each of translations, rotations, scales, and shears) and were input into the PCA analysis. Each PC represents a dominant shape‐mode in the data and the PC‐score for each subject represents how much that subjects's hippocampus loads on that score.
Statistical Analysis
Volumetric analyses
A general linear model (GLM) was used to assess all relationships, and all tests were corrected for multiple comparisons using FDR [Benjamini and Hochberg, 1995]. Comparisons surviving 5% FDR were deemed to be significant. The relationship between hippocampal volumes and age was assessed first, with sex, years of education, APOE ε4 carrier status, and TBV included in the model. Next, the relationship between volume and cognitive scores (list recall, figure recall, and LNS scores) was assessed with age, sex, years of education, APOE ε4 carrier status, and TBV included in the model.
Local (univariate) morphometric analysis
First, a vertex‐wise GLM was used to evaluate the relationship between age and local shape differences in the right and left whole hippocampus, while including age, sex, years of education, and APOE ε4 carrier status in the model. The shape metric is already normalized for TBV, so TBV was not included as a covariate. The effect of cognition was then evaluated in additional models including terms for cognitive test performance and covarying for age, sex, years of education, and APOE ε4 status. A 5% false discovery rate (FDR) correction was used to correct for multiple comparisons across the vertices [Genovese et al., 2002].
Global (multivariate) morphometric analysis
Global hippocampal shape was analyzed using a PCA. The relationship between PC score and cognitive performance was assessed using a GLM with age, sex, years of education, and APOE ε4 status included in the model. FDR was used to correct for multiple comparisons, and results that survived the 5% threshold were considered to be significant.
RESULTS
Relationship of TBV and Hippocampal Volume
Total brain volume (TBV) was colinear with total (right + left) hippocampal volume (R 2 = 0.022, P < 0.05), so was included in all volumetric statistical models.
Relationship of Volumetric Measures and Age
All right and left whole hippocampal and subfield volumes were inversely related to age after correction for multiple comparisons except for the right and left CA1 (R 2 = 0.018, q = 0.069 for both) (Fig. 3). Table 3 summarizes the results of all volumetric analyses involving age and cognitive tests. Quadratic effects of age were assessed, but found to be not significant (R 2 < 0.02, q ≫ 0.05). Among the subfields studied, the right and left CA1 showed the least prominent relationship with age, with a 9.8 × 10⁻⁴% and 1.0 × 10⁻³% decrease in volume per year, respectively (based on the mean subfield volumes of the population, covarying for sex, education, APOE ε4 status, and TBV). The right and left CA2/CA3 showed the most prominent relationship with age, with a 2.6 × 10⁻³% and 3.6 × 10⁻³% decrease in volume per year, respectively. Age‐by‐sex interactions were also explored in all subfields, and were significant in the left CA2/CA3 (R 2 = 0.025, P = 0.037), but this interaction did not survive 5% FDR correction. No relationships between APOE ε4 status and subfield volume survived FDR correction. Given some investigations showing age‐dependent effects of APOE ε4 [Felsky and Voineskos, 2013], analyses were repeated in a subset of the subjects older than 50 years of age, but results remained not significant in this subgroup.
Figure 3.
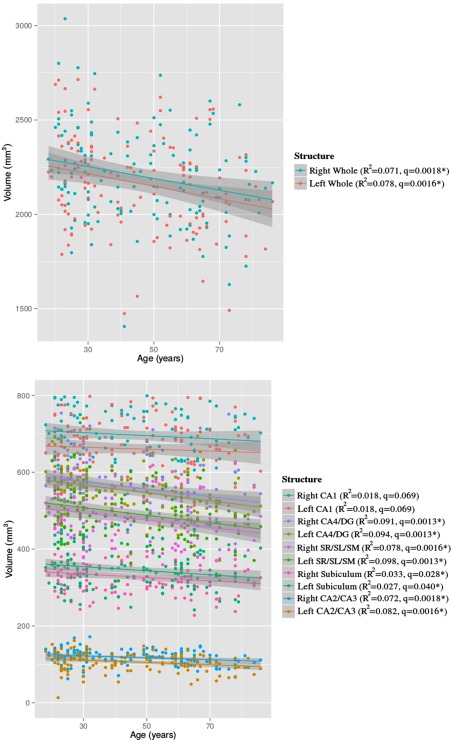
Negative relationships of: (a) whole right and left hippocampus with age; and (b) all right and left hippocampal subfields (CA1, CA2/CA3, CA4/DG, SR/SL/SM, subiculum) with age. All analyses have 134 degrees of freedom. *Indicates significant negative relationship of volume with age (with sex, years of education, APOE ε4 carrier status, and total brain volume included in the model) after 5% FDR correction.
Table 3.
Summary of all volumetric statistical tests.
| Variable of Interest | Covariates | Hemisphere | Structure | R 2 | P | q |
|---|---|---|---|---|---|---|
| Age | Sex, education, APOE ε4 status, TBV | Right | CA1 | 0.018 | 0.066 | 0.069 |
| Subiculum | 0.033 | 0.021a | 0.028a | |||
| CA4/DG | 0.091 | 0.00031a | 0.0013a | |||
| CA2/CA3 | 0.072 | 0.0012a | 0.0018a | |||
| SR/SL/SM | 0.078 | 0.00082a | 0.0016a | |||
| Whole | 0.071 | 0.0012a | 0.0018a | |||
| Left | CA1 | 0.018 | 0.069 | 0.069 | ||
| Subiculum | 0.027 | 0.033a | 0.040a | |||
| CA4/DG | 0.094 | 0.00027a | 0.0013a | |||
| CA2/CA3 | 0.082 | 0.00073a | 0.0016a | |||
| SR/SL/SM | 0.098 | 0.00020a | 0.0013a | |||
| Whole | 0.078 | 0.00078a | 0.0016a | |||
| List recall | Age, sex, education, APOE ε4 status, TBV | Right | CA1 | 0.0026 | 0.99 | 0.99 |
| Subiculum | 0.0024 | 0.67 | 0.91 | |||
| CA4/DG | 0.021 | 0.55 | 0.88 | |||
| CA2/CA3 | 0.00 | 0.88 | 0.96 | |||
| SR/SL/SM | 0.00 | 0.78 | 0.93 | |||
| Whole | 0.0065 | 0.73 | 0.93 | |||
| Left | CA1 | 0.015 | 0.28 | 0.66 | ||
| Subiculum | 0.00 | 0.84 | 0.95 | |||
| CA4/DG | 0.025 | 0.13 | 0.51 | |||
| CA2/CA3 | 0.0026 | 0.99 | 0.99 | |||
| SR/SL/SM | 0.0040 | 0.31 | 0.66 | |||
| Whole | 0.012 | 0.32 | 0.66 | |||
| Figure recall | Age, sex, education, APOE ε4 status, TBV | Right | CA1 | 0.010 | 0.34 | 0.66 |
| Subiculum | 0.027 | 0.063 | 0.44 | |||
| CA4/DG | 0.066 | 0.054 | 0.44 | |||
| CA2/CA3 | 0.021 | 0.15 | 0.56 | |||
| SR/SL/SM | 0.013 | 0.27 | 0.66 | |||
| Whole | 0.033 | 0.12 | 0.47 | |||
| Left | CA1 | 0.017 | 0.23 | 0.66 | ||
| Subiculum | 0.0053 | 0.29 | 0.66 | |||
| CA4/DG | 0.060 | 0.027a | 0.44 | |||
| CA2/CA3 | 0.0033 | 0.56 | 0.88 | |||
| SR/SL/SM | 0.025 | 0.060 | 0.44 | |||
| Whole | 0.032 | 0.077 | 0.44 | |||
| LNS | Age, sex, education, APOE ε4 status, TBV | Right | CA1 | 0.0039 | 0.79 | 0.94 |
| Subiculum | 0.0067 | 0.35 | 0.66 | |||
| CA4/DG | 0.019 | 0.67 | 0.91 | |||
| CA2/CA3 | 0.037 | 0.019a | 0.44 | |||
| SR/SL/SM | 0.00 | 0.81 | 0.94 | |||
| Whole | 0.0054 | 0.91 | 0.96 | |||
| Left | CA1 | 0.010 | 0.68 | 0.91 | ||
| Subiculum | 0.0090 | 0.23 | 0.66 | |||
| CA4/DG | 0.011 | 0.48 | 0.86 | |||
| CA2/CA3 | 0.026 | 0.086 | 0.44 | |||
| SR/SL/SM | 0.00 | 0.56 | 0.88 | |||
| Whole | 0.0063 | 0.68 | 0.91 |
R 2 values are adjusted and apply to the variable of interest only.
Indicates significance before/after 5% FDR correction (p/q < 0.05). TBV = total brain volume
Relationship of Local Morphometry and Age
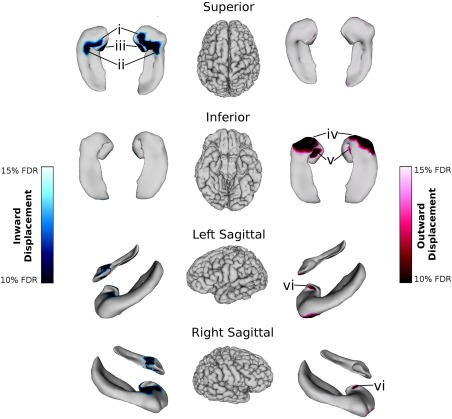
Significant relationships between local shape of the whole hippocampus and age survived 5% FDR (right hippocampus: DOF = 124, t = 2.47; left hippocampus: DOF = 124, t = 2.56) (Fig. 4). Table 4 summarizes all results of local morphometry analyses. Patterns of inward and outward displacement were mainly symmetric along both hippocampi. In both hemispheres, inward displacement was localized in the inferior and medial hippocampal head (anterior subiculum and inferior SR/SL/SM of the hippocampal uncus; Fig. 4 i), the medial hippocampal body (along the CA1‐CA4/DG border; Fig. 4 ii), and the tip of the hippocampal tail (posterior CA1; Fig. 4 iii). Outward displacement in both hemispheres was localized to the lateral hippocampal body (CA1; Fig. 4 iv), the lateral edge of the uncus in the hippocampal head (SR/SL/SM; Fig. 4 v), and the base of the uncus (CA1; Fig. 4 vi). In the right hemisphere only, outward displacements were also observed on the superior tail (a region including parts of the CA4/dentate gyrus, SR/SL/SM, and CA1; Fig. 4 vii).
Figure 4.
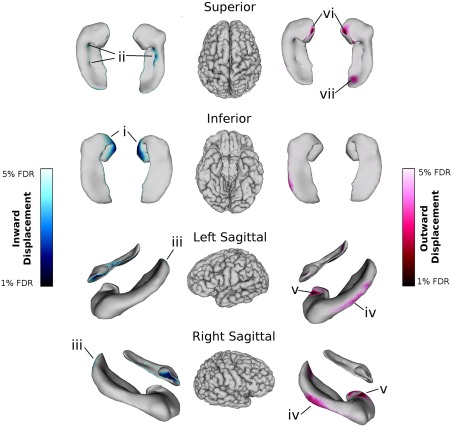
Relationships between right and left whole hippocampal shape and age (with sex, years of education, and APOE ε4 carrier status included in the model). Blue colour maps on the hippocampal surfaces indicate inward displacement after 1–5% FDR correction; red colour maps indicate outward displacement after 1–5% FDR correction. In both hemispheres, inward displacement was localized in (i) the inferior and medial hippocampal head (anterior subiculum and inferior SR/SL/SM of the hippocampal uncus); (ii) the medial hippocampal body (along the CA1‐CA4/DG border); and (iii) the tip of the hippocampal tail (posterior CA1). Outward displacement in both hemispheres was localized to (iv) the lateral hippocampal body (CA1); (v) the lateral edge of the uncus in the hippocampal head (SR/SL/SM); and (vi) the base of the uncus (CA1). (vii) In the right hemisphere only, outward displacements were also observed on the superior tail (a region including parts of the CA4/dentate gyrus, SR/SL/SM, and CA1).
Table 4.
Summary of all local morphometry statistical tests.
| Variable of Interest | Covariates | Structure | FDR | t‐stat |
|---|---|---|---|---|
| Age | Sex, education, APOE ε4 status | Right whole | 5% | 2.47 |
| Age | Sex, education, APOE ε4 status | Left whole | 5% | 2.56 |
| APOE ε4 status | Age, sex, education | Right whole | 10% | 2.43 |
| APOE ε4 status | Age, sex, education | Left whole | 10% | 2.58 |
| List Recall/Figure Recall/LNS | Age, sex, education, APOE ε4 status | Right/left whole | 10% | ‐ |
All tests had 124 degrees of freedom. Note: Although 5% FDR was set as the threshold for significance throughout this manuscript, 10% FDR is presented for the APOE ε4 and cognition results, as only trend‐level results survive correction for multiple comparisons in these tests
Relationship of Local Morphometry with APOE ε4 Status
Local morphological relationships based on APOE ε4 status were analyzed (Table 4). At the 5% FDR level, no relationships were significant; however relationships were found at a more liberal correction of 10% FDR (Fig. 5). Inward surface displacements were observed in both the right (DOF = 124, t = 2.43) and left hippocampi (DOF = 124, t = 2.58) in ε4 carriers relative to noncarriers along the medial hippocampal head, especially the base of the hippocampal uncus (CA1; Fig. 5 i), the antero‐medial portion of the hippocampal body (CA2/CA3; Fig. 5 ii), and the medial side of the hippocampal uncus (SR/SL/SM; Fig. 5 iii). The area of significant inward displacement in the hippocampal head was larger in the right hemisphere than the left. Outward surface displacements were also observed in both hemispheres in the hippocampal head, particularly on the anterior portion of the inferior surface (subiculum; Fig. 5 iv) and the inferior surface of the uncus (SR/SL/SM; Fig. 5 v). Some outward displacements were also observed on the lateral surface of the uncus in both hemispheres (SR/SL/SM; Fig. 5 vi).
Figure 5.
Relationships between right and left whole hippocampal shape and APOE4 ε4 status (with age, sex, and years of education included in the model) in ε4 carriers relative to noncarriers. Blue colour maps on the hippocampal surfaces indicate inward displacement after 10–15% FDR correction; red colour maps indicate outward displacement after 10–15% FDR correction. Inward surface displacements were observed in ε4 carriers relative to noncarriers along the medial hippocampal head, especially (i) the base of the hippocampal uncus (CA1); (ii) the antero‐medial portion of the hippocampal body (CA2/CA3); and (iii) the medial side of the hippocampal uncus (SR/SL/SM). Outward surface displacements were also observed in both hemispheres in the hippocampal head, particularly on (iv) the anterior portion of the inferior surface (subiculum); and (v) the inferior surface of the uncus (SR/SL/SM). (vi) Some outward displacements were also observed on the lateral surface of the uncus in the left hemisphere (SR/SL/SM).
Relationship of Volumetric Measures with Episodic and Working Memory Performance
A greater left CA4/DG volume was associated with a higher figure recall score (R 2 = 0.060, P = 0.027) (Table 3), but this relationship did not survive FDR correction at the 5% level. Similarly, a greater right CA2/CA3 volume was associated with a higher LNS score (R 2 = 0.037, P = 0.019), but not after correcting for multiple comparisons. Direct correlations between cognitive scores and hippocampal volumes (no covariates) are reported in Supporting Information Table S1.
Relationship of Local Morphometry with Episodic and Working Memory Performance
No significant local shape differences were found that explained LNS, list recall, or figure recall performance after correction at 5% FDR (or at a more liberal 10% FDR threshold) (Table 4).
Relationship of Global Morphometry to Age and Memory Performance
The first PC of the whole left hippocampus (eigenvalue = 4.92), which identifies an elongation along the anterior–posterior axis, explained 65% of the variance in the data and showed a significant linear relationship with LNS test performance (R 2 = 0.066, q = 0.021) (Table 5), even after FDR correction at the 5% level. The patterns of the shape distribution for the top three right and left PCs are shown in Figure 6. The first PC of the whole right hippocampus (eigenvalue = 5.40) has a significant relationship with age (R 2 = 0.045, P = 0.0094), and the third right PC (eigenvalue = 3.05) has a significant relationship with figure recall performance (R 2 = 0.041, P = 0.015); however neither of these associations survives FDR correction. The GLM was repeated for the first left PC with only right‐handed subjects, and the results remained significant (R 2 = 0.073, q = 0.029).
Table 5.
Summary of principal components on the right and left whole hippocampus from the global shape analysis.
| Principal component | Eigenvalue | Variance explained | Linear variables | R 2 (Estimate) | t‐stat (p) | q |
|---|---|---|---|---|---|---|
| Right PC1 | 5.40 | 74.19% | Age | 0.045 (−2.01×10⁻⁴) | −2.64 (0.0094) | 0.056 |
| Right PC2 | 3.24 | 9.59% | — | — | — | — |
| Right PC3 | 3.05 | 7.51% | Figure Recall | 0.041 (9.08×10⁻⁴) | 2.47 (0.015) | 0.13 |
| Left PC1 | 4.92 | 65.23% | LNS | 0.066 (1.60×10⁻³) | 3.33 (0.0012) | 0.021a |
| Left PC2 | 3.23 | 12.10% | — | — | — | — |
| Left PC3 | 3.02 | 9.33% | — | — | — | — |
Indicates significance after 5% FDR correction (q < 0.05)
Figure 6.
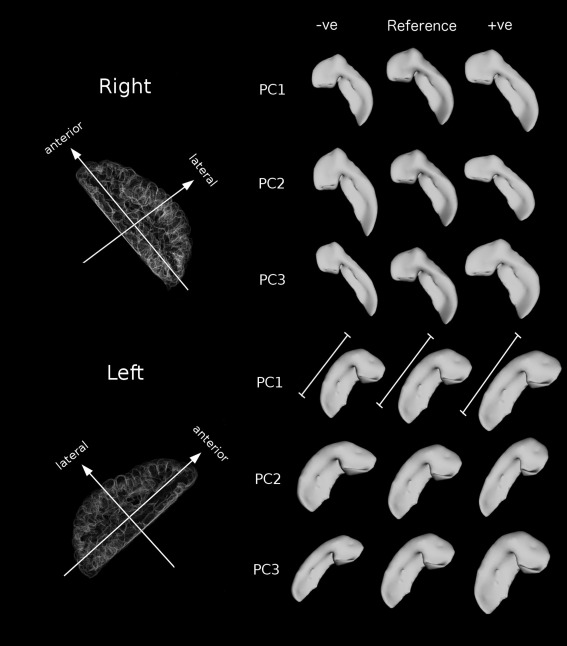
Shape principal components (PCs) of the right and left whole hippocampus viewed from above (axial). The “reference” shape is from the hippocampal model (created from 5 manually segmented atlases), and “–ve” and “+ve” indicate negative and positive PC contributions to the hippocampal model, respectively. The first PC on the left side explained 65% of the variance in the data, and showed a significant linear relationship with LNS test performance (R 2 = 0.066, q < 0.021). This PC represents a lengthening along the anterior–posterior axis (results have been normalized for volume). The first right PC explained 74% of the variance in the data, and showed a significant relationship with age (R 2 = 0.045, P = 0.0094), but this did not survive correction for multiple comparisons. This PC also represents a lengthening along the anterior–posterior axis of the hippocampus. The third right PC explained 7.5% of the variance in the data, and showed a significant relationship with figure recall performance (R 2 = 0.041, P = 0.015), but this relationship did not survive correction for multiple comparisons. This PC represents a thickening along the medial‐lateral axis of the hippocampus.
DISCUSSION
We conducted a comprehensive examination of hippocampal morphology across the adult lifespan, and then assessed relationships among age, shape, and episodic and working memory performance. Relationships between age and hippocampal volumes were found, but not between cognitive scores and hippocampal volumes. Relationships were also found between age and hippocampal shape, both using local (univariate, vertex‐wise), and global (multivariate, principal component analysis) indices of hippocampal shape. In addition, relationships were found between global hippocampal shape and cognition. These results suggest that hippocampal shape may be a more informative biomarker of age‐ and cognition‐related effects on the hippocampus than subfield volume. After 5% FDR correction, none of the subfield volumes predicted episodic or working memory performance. In contrast, hippocampus shape analysis provided a significant relationship with working memory performance, consistent with prominent age‐related effects on shape. The first principal component characterizing left hippocampal shape, an elongation along the antero‐posterior axis of the hippocampus, significantly predicted working memory performance across the adult lifespan.
Overall, our findings suggest that people with healthy (“normal”) cognitive aging have relatively preserved hippocampal subfield volumes. However, hippocampal shape appears to provide unique information regarding age and cognition effects on hippocampal morphometry. Specific shape changes may serve as a novel biomarker of working memory performance in a normal aging population. Shape analysis using local vertex‐wise metrics also provided substantive findings in relation to age. We found considerable age‐related bilateral inward and outward displacement. These results are consistent with the only other adult lifespan study of hippocampal shape [Yang et al., 2013]. However, that study did not include cognitive data or APOE ε4 genotype data. With respect to cognitive data, we found that the first principal component explained most of the variance of left hippocampal shape (which shows a longer longitudinal axis), and significantly predicted working memory performance. Although working memory performance (a composite of executive function, attention, and memory) is classically considered a frontally based task, considerable evidence supports a prefrontal‐hippocampal circuit, or a prefrontal‐parietal‐hippocampal circuit [Oztekin et al., 2009b] as one of the main neural mechanisms underlying working memory performance. Verbal working memory is also supported by a medial temporal lobe—prefrontal circuit [Oztekin et al., 2009a]. Therefore, a longer or wider hippocampal axis may provide more surface area for projections to cortical regions, which can support working memory performance. The hippocampus has rich connectivity within the medial temporal lobe [Yassa et al., 2010], among subfields, and to the anterior thalamus (as part of the so‐called Papez circuit) [Bezaire and Soltesz, 2013; Bennett et al., 2014], and may be under influences of many of the similar mechanisms that shape the geometry of the neocortex. The surface area and the complexity of the human cerebral cortex have been postulated to be a result of, in part, the rate of neuronal proliferation and programmed cell death of neurons through the neurodevelopemental period. These neurons migrate from the ventricular zone, across the intermediate zone on a scaffold of radial glia, and then go on to differentiate into neuronal subtypes that allow for the laminar organization of the cerebral cortex [Rakic, 1988]. Increased surface area has been hypothesized to be one of the substrates for increased short‐ and long‐range cortical connectivity [Rakic, 1988; Van Essen, 1997]. Since the hippocampus is one of the best‐preserved structures throughout vertebrates in nature, it is likely to be partly governed by many processes similar to the ones described above [Eckenhoff and Rakic, 1984]. Therefore, although purely speculative, the lengthening of the long axis of the hippocampus (which is likely to correspond to an increase in surface area) may also be indicative of enhanced intrastructural and/or extrastructural connectivity. The hippocampal head shows connections to the white matter in the amygdala and uncinate fasciculus and in other regions including the prefrontal cortex [Travis et al., 2014]. Furthermore, posterior hippocampal activity has been correlated with cingulate, precuneus, and inferior parietal cortical activity [Travis et al., 2014]. Future work investigating anatomical relationships between hippocampal shape and cortical regions may help further improve our understanding of network‐based ‘connectivity’ mechanisms underlying working memory performance.
Only modest relationships of hippocampal subfield volumes with age were found. In particular, there was an absence of a relationship between the CA1 subfield and age after correction for multiple comparisons. In contrast, others have reported a decreased CA1 subfield volume in people with Alzheimer's disease [Mueller et al., 2010; Kerchner et al., 2012] and mild cognitive impairment [Mueller et al., 2010; Pluta et al., 2012] compared to healthy controls. Such a decrease has also been reported in older healthy individuals compared to younger healthy individuals [Mueller et al., 2007]. Others have shown that age‐related changes in CA1 may be dependent on the presence of hypertension [Shing et al., 2011], rather than being directly due to age itself. However, studies of older apparently healthy individuals typically include a heterogeneous group, with some subjects in a preclinical pathological aging stage: in these subjects, neuroimaging can detect preclinical disease change, or predict onset of Alzheimer's disease using CA1 subfield volume [Apostolova et al., 2010; Devanand et al., 2012]. CA1 volume data from our sample of healthy, carefully screened subjects provides support for preserved CA1 volume as a marker of healthy aging. In contrast, all other subfields had significant, although modest, negative relationships with age. This includes the CA4/DG subfield which is typically considered as a subfield spared from the effects of pathological aging, at least in early phases, yet one that is consistently shown to decrease in volume in healthy aging [Mueller and Weiner, 2009; Small et al., 2011]. Furthermore, unlike the CA1 volume, DG volume does not appear to be a predictive marker of conversion to Alzheimer's disease. One could view the similar rates of decrease across these subfield regions in our sample as supporting potentially shared mechanisms of age‐related change in these subfields. However, modest, rather than strong, relationships with age are not surprising given that cell numbers are preserved in normal aging in humans, nonhuman primates and rodents in the principal cell types of the hippocampus (granule cells, CA1 and CA3 pyramidal cells) [Samson and Barnes, 2013].
We were surprised to find only a weakly significant correlation between total brain volume (TBV) and hippocampal volumes. While this may be a somewhat unexpected finding, it is difficult to compare this result to other results in the field due to methodological differences in brain volume correction, the use of total intracranial volumes (rather than TBV) in many cases, and the infrequent explicit examination of the correlation of total brain and hippocampal volumes [Fjell et al., 2013]. Many studies use the intracranial volume (ICV) measure similar to the total intracranial volume (TIV) measure developed by Buckner et al., which is well‐correlated with manually segmented volumes that account, in part, for TBV using an automated estimate [Buckner et al., 2004]. In Buckner's work, hippocampal volume is shown to be directly correlated with the TIV [Buckner et al., 2004]. However, other more recent publications that use this measure do not explicitly report correlations among ICV, brain volume, and hippocampal volumes [Fjell et al., 2013; Krogsrud et al., 2014]. In publications where these correlations are not directly reported, it is possible to infer the presence or absence of a relationship among these variables based on whether volumetric relationships of the hippocampus with age do or do not change following normalization for TBV. For instance, in a recent paper by Li et al., normalization by TBV did not change the direction of the slopes of the hippocampal volume vs. age relationship in a lifespan analysis [Li et al., 2014]. However in other studies, the inclusion of brain volume in the analysis completely changes the direction of the effect, suggesting correlation between the measures [Maller et al., 2006].
With respect to APOE genotype, we were somewhat surprised that we did not find any significant effect of ε4 carrier status on hippocampal and subfield volume and only trend‐level relationships (10% FDR) with respect to shape. Our findings align with some groups [Morra et al., 2009], but not with others [Mueller and Weiner, 2009]. In addition, some studies have shown age‐dependent effects of ε4 status across the adult lifespan [Felsky and Voineskos, 2013; Nichols et al., 2012].
It should be noted that other groups that perform manual and automated segmentation of the hippocampal subfields have done so using T2‐weighted [Kerchner et al., 2010, 2013; Mueller et al., 2007, 2009, 2010; Pluta et al., 2012; Winterburn et al., 2013; Wisse et al., 2013] or proton density images [De Flores et al., 2015; La Joie et al., 2010, 2013; Raz et al., 2014; Shing et al., 2011]. While this has been an extremely useful addition to the field, many of these techniques only segment a small subset of the hippocampus along the anterior–posterior axis [Kerchner et al., 2010, 2013; Mueller et al., 2007, 2009, 2010; Raz et al., 2014]. In addition, many of these acquisitions are high resolution in the coronal plane but are acquired with a slice thickness of 2–3 mm. While we previously demonstrated the feasibility of automated segmentation of the subfields on standard T1‐weighted segmentations through a simulation [Pipitone et al., 2014], we further note that these experiments in the original validation used images with 0.9 mm isotropic voxels measured at 3T. Nonetheless, previous studies from our group [Pipitone et al., 2014; Treadway et al., 2015] and by others who have adopted the Winterburn protocol demonstrate the feasibility of its implementation in a wide range of applications [Iglesias et al., 2015; Winterburn et al., 2013].
Our study was the first, to our knowledge, to assess the relationship of either hippocampal subfield volumes or hippocampal shape metrics with cognitive performance across the adult lifespan. The different aspects of cognitive performance that we assessed were susceptible to the effects of age to varying degrees. However, we did not find significant age‐specific effects of whole hippocampal or subfield volumes on these cognitive functions. Only modest variance in visuospatial memory performance (figure recall) was explained by the CA4/DG subfield (e.g., the left CA4/DG explained 6% of the variance) and this finding did not survive corrections for multiple comparisons. Likewise, the right CA2/CA3 subfield explained 3.7% of the variance in working memory, but the relationship did not survive correction for multiple comparisons. Both animal studies and more recent human neuroimaging studies have attempted to clarify the function of individual subfields in relation to memory performance. For instance, pattern separation and completion (functions that support visuospatial memory) by DG and CA3 has been shown [Bakker et al., 2008; Leutgeb et al., 2007; Yassa et al., 2010]. This demonstrated function of these subfields aligns with our finding of DG subfield volume providing modest explanation of the variance in visuospatial memory performance. Subjects were asked to draw the Rey–Osterrieth figure from memory, which is a complicated diagram requiring pattern separation and completion ability. Conversely, novelty detection and allocentric encoding is considered a function of the CA1 subfield [Suthana et al., 2009]. We did not, however, find a relationship with CA1 volume and any type of memory performance. It is worth noting that much of our knowledge of specific subfield function emerges from mouse and rat studies [Brun et al., 2008, 2002; Mizumori et al., 1989]. The standard paper and pencil neurocognitive tests in humans that we used may not be adequately designed to reflect functions such as allocentric encoding.
The relationships between hippocampal shape and cognitive performance were consistent in both younger and older adults. Others have shown that compensatory neural mechanisms help ensure normal cognitive performance in healthy aging populations [Raz and Rodrigue, 2006; Raz et al., 2005; Sullivan and Pfefferbaum, 2006; Voineskos et al., 2012], rather than preservation of regions important for cognitive performance in young adult life. It is possible that our subjects who were in their seventh, eighth, or ninth decade of life, without experiencing mild cognitive impairment or a dementia, may exhibit compensatory brain change in other regions. There is considerable evidence for such changes in the cortex of healthy older individuals [Raz et al., 1997, 2005]. Other compensatory changes can also occur in white matter fiber connections [Voineskos et al., 2012], which can help ensure normal cognitive performance in aging, particularly in the executive function/working memory domain [Sullivan and Pfefferbaum, 2006; Voineskos et al., 2012].
Some limitations of our study deserve consideration. Hippocampal subfield definition and measurement remain ongoing sources of disagreement and technical challenge respectively [Winterburn et al., 2013; Yushkevich et al., 2015, 2010, 2009]. We used a CA2/CA3 subfield and a CA4/DG subfield among our subfield classifications, and challenges in differentiating CA3 from the DG have been described, with CA2/CA3 and DG often considered together [Carr et al., 2010; Chakeres et al., 2005]. Given the role of CA3 in pattern completion and rapid and flexible acquisition of spatial memories [Lavenex and Banta Lavenex, 2013], it is possible that the CA3 subfield may in part contribute to our finding that the CA4/DG subfield explained 6% of the variance in visuospatial memory performance. However, we have previously demonstrated that the CA4/DG subfield can be segmented with excellent reliability [Winterburn et al., 2013]. Also, the very existence of a CA4 as defined by Duvernoy [Duvernoy, 2005] is widely debated within the field, and is often included as the dentate hilus [Adler et al., 2014]. Although we have previously demonstrated good reliability of subfield segmentations, some regions such as the CA2/CA3 region are less well‐reliably segmented [Winterburn et al., 2013]; this is not surprising due to its overall size and thickness in comparison to the resolution of standard T1‐weighted MR imaging data. For those subfields, use of a higher field scanner might have further improved resolution, and thus subfield segmentation accuracy. In turn, discovery of relationships among subfield volume and cognitive performance may have been facilitated. Although the relationships of hippocampal subfield volume and shape with memory performance that we did find were consistent across the adult lifespan, our study was cross‐sectional and not longitudinal. While our older individuals were no different from our younger individuals in sex and education, cross‐sectional studies may be subject to a cohort effect. Furthermore, it remains an open question of whether variability of brain morphometry and cognitive measures is greater in late adult life compared to early adult life [Raz and Lindenberger, 2011; Salthouse, 2011]. These factors might limit the capability of a study such as ours to determine associations between brain morphometry and cognitive performance.
Other studies have found more pronounced differences in subfield volume or shape in older vs. younger individuals, or relationships with age of greater negative magnitude [Mueller and Weiner, 2009; Mueller et al., 2007; Yang et al., 2013]. One possible explanation for our findings of a more limited relationship between age and hippocampal subfield volumes may be the preserved health and cognition of our older subjects, as documented by a detailed assessment. Therefore, one interpretation is that preserved hippocampal subfield volumes may be important for successful cognitive aging. Our finding that the brain–behavior relationships in the hippocampus in our sample are similar in our younger and older subjects further supports this interpretation.
The interpretation of results based on local and global shape measures may not be as intuitive as those based on volumetric measures. Volume measures are sometimes thought of as a proxy for total neuronal or overall cell counts; however, there is little evidence for this in the human MR literature and limited supporting evidence in the murine MR literature [Lerch et al., 2008, 2011]. There has been support in recent reports that the shape of subcortical structures represents a neurodevelopmental phenotype [Chakravarty et al., 2015; Raznahan et al., 2014; Shaw et al., 2014a, 2014b]. However, given the variability of brain anatomy in the late stages of life and the potential influence of genetic, lifestyle, and environmental factors, it is unclear whether the shape descriptions in our manuscript can truly be considered neurodevelopmental.
In summary, our study is the first examination of the relationship among hippocampal subfield volumes, hippocampal shape, and memory performance across the adult lifespan. We observed modest relationships between subfield volumes and age, as well as episodic and working memory performance. In contrast, characteristics of hippocampal shape emerged as the most powerful predictors of hippocampal‐dependent cognitive performance. Several interventions have been shown to change hippocampal structure and function [Engvig et al., 2012; Erickson et al., 2011; Kuhn et al., 2013; Pajonk et al., 2010]. Thus, our findings may help to select the interventions that specifically preserve aspects of hippocampal shape important for working memory performance. Such a strategy to attempt to prolong healthy aging and delay the onset of dementia would not be an exclusive one, but rather complementary to other strategies that currently target compensatory structures or networks that are involved in successful cognitive aging.
Supporting information
Supporting Information
ACKNOWLEDGMENTS
The funding organizations did not play a role in the design and conduct of the study; collection, management, analysis, and interpretation of the data; and preparation, review, or approval of the manuscript; and decision to submit the manuscript for publication. A.N.V., J.W., and M.M.C. had full access to all the data in the study and take responsibility for the integrity of the data and the accuracy of the data analysis.
REFERENCES
- Achterberg HC, van der Lijn F, den Heijer T, Vernooij MW, Ikram MA, Niessen WJ, de Bruijne M (2013): Hippocampal shape is predictive for the development of dementia in a normal, elderly population. Hum Brain Mapp 35:2359–2371. [DOI] [PMC free article] [PubMed] [Google Scholar]
- Adler DH, Pluta J, Kadivar S, Craige C, Gee JC, Avants BB, Yushkevich PA (2014): Histology‐derived volumetric annotation of the human hippocampal subfields in postmortem MRI. Neuroimage 84:505–523. [DOI] [PMC free article] [PubMed] [Google Scholar]
- Apostolova LG, Mosconi L, Thompson PM, Green AE, Hwang KS, Ramirez A, Mistur R, Tsui WH, de Leon MJ (2010): Subregional hippocampal atrophy predicts alzheimer's dementia in the cognitively normal. Neurobiol Aging 31:1077–1088. [DOI] [PMC free article] [PubMed] [Google Scholar]
- Bakker A, Kirwan CB, Miller M, Stark CE (2008): Pattern separation in the human hippocampal ca3 and dentate gyrus. Science 319:1640–1642. [DOI] [PMC free article] [PubMed] [Google Scholar]
- Beauchamp MH, Thompson DK, Howard K, Doyle LW, Egan GF, Inder TE, Anderson PJ (2008): Preterm infant hippocampal volumes correlate with later working memory deficits. Brain 131:2986–2994. [DOI] [PubMed] [Google Scholar]
- Benjamini Y, Hochberg Y (1995): Controlling the false discovery rate: A practical and powerful approach to multiple testing. J R Stat Soc 57:289–300. [Google Scholar]
- Bennett IJ, Huffman DJ, Stark CE (2014): Limbic tract integrity contributes to pattern separation performance across the lifespan. Cereb Cortex. epub ahead of print [DOI] [PMC free article] [PubMed] [Google Scholar]
- Bezaire MJ, Soltesz I (2013): Quantitative assessment of ca1 local circuits: Knowledge base for interneuron‐pyramidal cell connectivity. Hippocampus 23:751–785. [DOI] [PMC free article] [PubMed] [Google Scholar]
- Brun VH, Leutgeb S, Wu HQ, Schwarcz R, Witter MP, Moser EI, Moser MB (2008): Impaired spatial representation in ca1 after lesion of direct input from entorhinal cortex. Neuron 57:290–302. [DOI] [PubMed] [Google Scholar]
- Brun VH, Otnass MK, Molden S, Steffenach HA, Witter MP, Moser MB, Moser EI (2002): Place cells and place recognition maintained by direct entorhinal‐hippocampal circuitry. Science 296:2243–2246. [DOI] [PubMed] [Google Scholar]
- Buckner RL, Head D, Parker J, Fotenos AF, Marcus D, Morris JC, Snyder AZ (2004): A unified approach for morphometric and functional data analysis in young, old, and demented adults using automated atlas‐based head size normalization: Reliability and validation against manual measurement of total intracranial volume. Neuroimage 23:724–738. [DOI] [PubMed] [Google Scholar]
- Carmichael O, Xie J, Fletcher E, Singh B, DeCarli C (2012): Localized hippocampus measures are associated with alzheimer pathology and cognition independent of total hippocampal volume. Neurobiol Aging 33:1124 e1131–1141. [DOI] [PMC free article] [PubMed] [Google Scholar]
- Carr VA, Rissman J, Wagner AD (2010): Imaging the human medial temporal lobe with high‐resolution fMRI. Neuron 65:298–308. [DOI] [PMC free article] [PubMed] [Google Scholar]
- Chakeres DW, Whitaker CD, Dashner RA, Scharre DW, Beversdorf DQ, Raychaudhury A, Schmalbrock P (2005): High‐resolution 8 tesla imaging of the formalin‐fixed normal human hippocampus. Clin Anat 18:88–91. [DOI] [PubMed] [Google Scholar]
- Chakravarty MM, Aleong R, Leonard G, Perron M, Pike GB, Richer L, Veillette S, Pausova Z, Paus T (2011): Automated analysis of craniofacial morphology using magnetic resonance images. PLoS One 6:e20241. [DOI] [PMC free article] [PubMed] [Google Scholar]
- Chakravarty MM, Steadman P, van Eede MC, Calcott RD, Gu V, Shaw P, Raznahan A, Collins DL, Lerch JP (2013): Performing label‐fusion‐based segmentation using multiple automatically generated templates. Hum Brain Mapp 34:2635–2654. [DOI] [PMC free article] [PubMed] [Google Scholar]
- Chakravarty, MM , Rapoport, JL , Giedd, JN , Raznahan, A , Shaw, P , Collins, DL , Lerch, JP , Gogtay, N (2015): Striatal shape abnormalities as novel neurodevelopmental endophenotypes in schizophrenia: A longitudinal study. Human Brain Mapping 36:1458–1469. [DOI] [PMC free article] [PubMed] [Google Scholar]
- Cootes TF, Taylor CJ, Cooper DH, Graham J (1995): Active shape models ‐ their training and application. Comput Vision Image Understand 61:38–59. [Google Scholar]
- Csernansky JG, Wang L, Swank J, Miller JP, Gado M, McKeel D, Miller MI, Morris JC (2005): Preclinical detection of alzheimer's disease: Hippocampal shape and volume predict dementia onset in the elderly. Neuroimage 25:783–792. [DOI] [PubMed] [Google Scholar]
- De Flores R, La Joie R, Landeau B, Perrotin A, Mézenge F, de La Sayette V, Eustache F, Desgranges B, Chételat G (2015): Effects of age and alzheimer's disease on hippocampal subfields. Hum Brain Mapp 36:463–474. [DOI] [PMC free article] [PubMed] [Google Scholar]
- Della‐Maggiore V, Grady CL, McIntosh AR (2002): Dissecting the effect of aging on the neural substrates of memory: Deterioration, preservation or functional reorganization? Rev Neurosci 13:167–181. [DOI] [PubMed] [Google Scholar]
- Devanand DP, Bansal R, Liu J, Hao X, Pradhaban G, Peterson BS (2012): MRI hippocampal and entorhinal cortex mapping in predicting conversion to alzheimer's disease. Neuroimage 60:1622–1629. [DOI] [PMC free article] [PubMed] [Google Scholar]
- Duvernoy HM. 2005. The Human Hippocampus: Functional Anatomy, Vascularization, and Serial Sections with MRI. Springer Verlag, Berlin Heidelberg. [Google Scholar]
- Eckenhoff MF, Rakic P (1984): Radial organization of the hippocampal dentate gyrus: A golgi, ultrastructural, and immunocytochemical analysis in the developing rhesus monkey. J Comp Neurol 223:1–21. [DOI] [PubMed] [Google Scholar]
- Engvig A, Fjell AM, Westlye LT, Skaane NV, Sundseth O, Walhovd KB (2012): Hippocampal subfield volumes correlate with memory training benefit in subjective memory impairment. Neuroimage 61:188–194. [DOI] [PubMed] [Google Scholar]
- Erickson KI, Voss MW, Prakash RS, Basak C, Szabo A, Chaddock L, Kim JS, Heo S, Alves H, White SM, Wojcicki TR, Mailey E, Vieira VJ, Martin SA, Pence BD, Woods JA, McAuley E, Kramer AF (2011): Exercise training increases size of hippocampus and improves memory. Proc Natl Acad Sci USA 108:3017–3022. [DOI] [PMC free article] [PubMed] [Google Scholar]
- Eskildsen SF, Coupé P, García‐Lorenzo D, Fonov V, Pruessner JC, Collins DL Alzheimer's Disease Neuroimaging Initiative (2013): Prediction of alzheimer's disease in subjects with mild cognitive impairment from the ADNI cohort using patterns of cortical thinning. Neuroimage 65:511–521. [DOI] [PMC free article] [PubMed] [Google Scholar]
- Felsky D, Voineskos AN (2013): APOE 4, aging, and effects on white matter across the adult life span. JAMA Psychiatry 70:646–647. [DOI] [PubMed] [Google Scholar]
- First MB, Spitzer RL, Gibbon M, Williams JBW. 2001. Structured Clinical Interview for DSM‐IV‐TR Axis I Disorders ‐ Patient Edition (SCID‐I/P). New York: Biometrics Research Department. [Google Scholar]
- Fjell AM, Westlye LT, Grydeland H, Amlien I, Espeseth T, Reinvang I, Raz N, Holland D, Dale AM, Walhovd KB Alzheimer Disease Neuroimaging Initiative (2013): Critical ages in the life course of the adult brain: Nonlinear subcortical aging. Neurobiol Aging 34:2239–2247. [DOI] [PMC free article] [PubMed] [Google Scholar]
- Folstein MF, Folstein SE, McHugh PR (1975): "Mini‐mental state". A practical method for grading the cognitive state of patients for the clinician. J Psychiatr Res 12:189–198. [DOI] [PubMed] [Google Scholar]
- Genovese CR, Lazar NA, Nichols T (2002): Thresholding of statistical maps in functional neuroimaging using the false discovery rate. Neuroimage 15:870–878. [DOI] [PubMed] [Google Scholar]
- Head D, Snyder AZ, Girton LE, Morris JC, Buckner RL (2005): Frontal‐hippocampal double dissociation between normal aging and alzheimer's disease. Cereb Cortex 15:732–739. [DOI] [PubMed] [Google Scholar]
- Hobart MP, Goldberg R, Bartko JJ, Gold JM (1999): Repeatable battery for the assessment of neuropsychological status as a screening test in schizophrenia, II: Convergent/discriminant validity and diagnostic group comparisons. Am J Psychiatry 156:1951–1957. [DOI] [PubMed] [Google Scholar]
- Hollingshead AB (1975): Four Factor Index of Social Status. New Haven, CT: Yale University. [Google Scholar]
- Jack CR, Jr. , Petersen RC, Xu YC, Waring SC, O'Brien PC, Tangalos EG, Smith GE, Ivnik RJ, Iglesias JE, Sabuncu MR, Aganj I, Bhatt P, Casillas C, Salat D, Boxer A, Fischl B, Van Leemput K (2015): An algorithm for optimal fusion of atlases with different labeling protocols. NeuroImage 106:451–463. [DOI] [PMC free article] [PubMed] [Google Scholar]
- Kerchner GA, Hess CP, Hammond‐Rosenbluth KE, Xu D, Rabinovici GD, Kelley DAC, Vigneron DB, Nelson SJ, Miller BL (2010): Hippocampal ca1 apical neuropil atrophy in mild alzheimer disease visualized with 7‐T MRI. Neurology 75:1381–1387. [DOI] [PMC free article] [PubMed] [Google Scholar]
- Kerchner GA, Bernstein JD, Fenesy MC, Deutsch GK, Saranathan M, Zeineh MM, Rutt BK (2013): Shared vulnerability of two synaptically‐connected medial temporal lobe areas to age and cognitive decline: A seven tesla magnetic resonance imaging study. J Neurosci 33:16666–16672. [DOI] [PMC free article] [PubMed] [Google Scholar]
- Krogsrud SK, Tamnes CK, Fjell AM, Amlien I, Grydeland H, Sulutvedt U, Due ‐ Tønnessen P, Bjørnerud A, Sølsnes AE, Håberg AK, Skrane J Walhovd KB (2014): Development of hippocampal subfield volumes from 4 to 22 years. Hum Brain Mapp 35:5646–5657. [DOI] [PMC free article] [PubMed] [Google Scholar]
- Jernigan TL, Archibald SL, Fennema‐Notestine C, Gamst AC, Stout JC, Bonner J, Hesselink JR (2001): Effects of age on tissues and regions of the cerebrum and cerebellum. Neurobiol Aging 22:581–594. [DOI] [PubMed] [Google Scholar]
- Jernigan TL, Gamst AC (2005): Changes in volume with age–consistency and interpretation of observed effects. Neurobiol Aging 26:1271–1274. Discussion 1275–1278. [DOI] [PubMed] [Google Scholar]
- Kerchner GA, Deutsch GK, Zeineh M, Dougherty RF, Saranathan M, Rutt BK (2012): Hippocampal ca1 apical neuropil atrophy and memory performance in alzheimer's disease. Neuroimage 63:194–202. [DOI] [PMC free article] [PubMed] [Google Scholar]
- Kuhn S, Gleich T, Lorenz RC, Lindenberger U, Gallinat J (2013): Playing super mario induces structural brain plasticity: Gray matter changes resulting from training with a commercial video game. Mol Psychiatry. 19:265–271. [DOI] [PubMed] [Google Scholar]
- La Joie R, Fouquet M, Mezenge F, Landeau B, Villain N, Mevel K, Pelerin A, Eustache F, Desgranges B, Chetelat G (2010): Differential effect of age on hippocampal subfields assessed using a new high‐resolution 3T MR sequence. Neuroimage 53:506–514. [DOI] [PubMed] [Google Scholar]
- La Joie R, Perrotin A, De La Sayette V, Egret S, Doeuvre L, Belliard S, Francis E, Béatrice D, Chételat G (2013): Hippocampal subfield volumetry in mild cognitive impairment, alzheimer's disease and semantic dementia. NeuroImage: Clin 3:155–162. [DOI] [PMC free article] [PubMed] [Google Scholar]
- Lavenex P, Banta Lavenex P (2013): Building hippocampal circuits to learn and remember: Insights into the development of human memory. Behav Brain Res 254:8–21. [DOI] [PubMed] [Google Scholar]
- Lerch JP, Carroll JB, Spring S, Bertram LN, Schwab C, Hayden MR, Henkelman RM (2008): Automated deformation analysis in the yac128 huntington disease mouse model. Neuroimage 39:32–39. [DOI] [PubMed] [Google Scholar]
- Lerch JP, Yiu AP, Martinez‐Canabal A, Pekar T, Bohbot VD, Frankland PW, Henkelman RM, Josselyn SA, Sled JG (2011): Maze training in mice induces MRI‐detectable brain shape changes specific to the type of learning. Neuroimage 54:2086–2095. [DOI] [PubMed] [Google Scholar]
- Leutgeb JK, Leutgeb S, Moser MB, Moser EI (2007): Pattern separation in the dentate gyrus and ca3 of the hippocampus. Science 315:961–966. [DOI] [PubMed] [Google Scholar]
- Li W, Tol MJ, Li M, Miao M, Jiao Y, Heinze HJ, Bogerts B, He H, Walter M (2014): Regional specificity of sex effects on subcortical volumes across the lifespan in healthy aging. Hum Brain Mapp 35:238–247. [DOI] [PMC free article] [PubMed] [Google Scholar]
- Lupien SJ, Evans A, Lord C, Miles J, Pruessner M, Pike B, Pruessner JC (2007): Hippocampal volume is as variable in young as in older adults: Implications for the notion of hippocampal atrophy in humans. Neuroimage 34:479–485. [DOI] [PubMed] [Google Scholar]
- Magon S, Chakravarty MM, Amann M, Weier K, Naegelin Y, Andelova M, Radue EW, Stippich C, Lerch JP, Kappos L, Sprenger T (2014): Label‐fusion‐segmentation and deformation‐based shape analysis of deep gray matter in multiple sclerosis: The impact of thalamic subnuclei on disability. Hum Brain Mapp. 35:4193–4203 [DOI] [PMC free article] [PubMed] [Google Scholar]
- Maller JJ, Réglade ‐ Meslin C, Anstey KJ Sachdev P (2006): Sex and symmetry differences in hippocampal volumetrics: Before and beyond the opening of the crus of the fornix. Hippocampus 16:80–90. [DOI] [PubMed] [Google Scholar]
- Malykhin NV, Bouchard TP, Camicioli R, Coupland NJ (2008): Aging hippocampus and amygdala. Neuroreport 19:543–547. [DOI] [PubMed] [Google Scholar]
- Mazziotta JC, Toga AW, Evans A, Fox P, Lancaster J (1995): A probabilistic atlas of the human brain: Theory and rationale for its development. The international consortium for brain mapping (ICBM). Neuroimage 2:89–101. [DOI] [PubMed] [Google Scholar]
- Miller MI, Priebe CE, Qiu A, Fischl B, Kolasny A, Brown T, Park Y, Ratnanather JT, Busa E, Jovicich J, Yu P, Dickerson BC, Buckner RL (2009): Collaborative computational anatomy: An MRI morphometry study of the human brain via diffeomorphic metric mapping. Hum Brain Mapp 30:2132–2141. [DOI] [PMC free article] [PubMed] [Google Scholar]
- Mizumori SJ, Barnes CA, McNaughton BL (1989): Reversible inactivation of the medial septum: Selective effects on the spontaneous unit activity of different hippocampal cell types. Brain Res 500:99–106. [DOI] [PubMed] [Google Scholar]
- Morra JH, Tu Z, Apostolova LG, Green AE, Avedissian C, Madsen SK, Parikshak N, Hua X, Toga AW, Jack CR, Jr. , Schuff N, Weiner MW, Thompson PM (2009): Automated 3D mapping of hippocampal atrophy and its clinical correlates in 400 subjects with alzheimer's disease, mild cognitive impairment, and elderly controls. Hum Brain Mapp 30:2766–2788. [DOI] [PMC free article] [PubMed] [Google Scholar]
- Mueller SG, Schuff N, Yaffe K, Madison C, Miller B, Weiner MW (2010): Hippocampal atrophy patterns in mild cognitive impairment and alzheimer's disease. Hum Brain Mapp 31:1339–1347. [DOI] [PMC free article] [PubMed] [Google Scholar]
- Mueller SG, Stables L, Du AT, Schuff N, Truran D, Cashdollar N, Weiner MW (2007): Measurement of hippocampal subfields and age‐related changes with high resolution MRI at 4T. Neurobiol Aging 28:719–726. [DOI] [PMC free article] [PubMed] [Google Scholar]
- Mueller SG, Weiner MW (2009): Selective effect of age, apo e4, and alzheimer's disease on hippocampal subfields. Hippocampus 19:558–564. [DOI] [PMC free article] [PubMed] [Google Scholar]
- Nichols LM, Masdeu JC, Mattay VS, Kohn P, Emery M, Sambataro F, Kolachana B, Elvevag B, Kippenhan S, Weinberger D, Berman KF (2012): Interactive effect of apolipoprotein e genotype and age on hippocampal activation during memory processing in healthy adults. Arch Gen Psychiatry 69:804–813. [DOI] [PubMed] [Google Scholar]
- Oldfield RC (1971): The assessment and analysis of handedness: The edinburgh inventory. Neuropsychologia 9:97–113. [DOI] [PubMed] [Google Scholar]
- Oztekin I, Curtis CE, McElree B (2009a): The medial temporal lobe and the left inferior prefrontal cortex jointly support interference resolution in verbal working memory. J Cogn Neurosci 21:1967–1979. [DOI] [PubMed] [Google Scholar]
- Oztekin I, McElree B, Staresina BP, Davachi L (2009b): Working memory retrieval: Contributions of the left prefrontal cortex, the left posterior parietal cortex, and the hippocampus. J Cogn Neurosci 21:581–593. [DOI] [PMC free article] [PubMed] [Google Scholar]
- Pajonk FG, Wobrock T, Gruber O, Scherk H, Berner D, Kaizl I, Kierer A, Muller S, Oest M, Meyer T, Backens M, Schneider‐Axmann T, Thornton AE, Honer WG, Falkai P (2010): Hippocampal plasticity in response to exercise in schizophrenia. Arch Gen Psychiatry 67:133–143. [DOI] [PubMed] [Google Scholar]
- Park MT, Pipitone J, Baer LH, Winterburn JL, Shah Y, Chavez S, Schira MM, Lobaugh NJ, Lerch JP, Voineskos AN, Chakravarty MM (2014): Derivation of high‐resolution MRI atlases of the human cerebellum at 3T and segmentation using multiple automatically generated templates. Neuroimage 95C:217–231. [DOI] [PubMed] [Google Scholar]
- Pipitone J, Park MT, Winterburn J, Lett TA, Lerch JP, Pruessner JC, Lepage M, Voineskos AN, Mallar Chakravarty M (2014): Multi‐atlas segmentation of the whole hippocampus and subfields using multiple automatically generated templates. Neuroimage 101:494–512. [DOI] [PubMed] [Google Scholar]
- Pluta J, Yushkevich P, Das S, Wolk D (2012): In vivo analysis of hippocampal subfield atrophy in mild cognitive impairment via semi‐automatic segmentation of T2‐weighted MRI. J Alzheimers Dis 31:85–99. [DOI] [PMC free article] [PubMed] [Google Scholar]
- Pruessner JC, Collins DL, Pruessner M, Evans AC (2001): Age and gender predict volume decline in the anterior and posterior hippocampus in early adulthood. J Neurosci 21:194–200. [DOI] [PMC free article] [PubMed] [Google Scholar]
- Rakic P (1988): Specification of cerebral cortical areas. Science 241:170–176. [DOI] [PubMed] [Google Scholar]
- Raz N, Gunning FM, Head D, Dupuis JH, McQuain J, Briggs SD, Loken WJ, Thornton AE, Acker JD (1997): Selective aging of the human cerebral cortex observed in vivo: Differential vulnerability of the prefrontal gray matter. Cereb Cortex 7:268–282. [DOI] [PubMed] [Google Scholar]
- Raz N, Lindenberger U, Rodrigue KM, Kennedy KM, Head D, Williamson A, Dahle C, Gerstorf D, Acker JD (2005): Regional brain changes in aging healthy adults: General trends, individual differences and modifiers. Cereb Cortex 15:1676–1689. [DOI] [PubMed] [Google Scholar]
- Raz N, Rodrigue KM (2006): Differential aging of the brain: Patterns, cognitive correlates and modifiers. Neurosci Biobehav Rev 30:730–748. [DOI] [PMC free article] [PubMed] [Google Scholar]
- Raz N, Lindenberger U (2011): Only time will tell: Cross‐sectional studies offer no solution to the age–brain–cognition triangle: Comment on Salthouse. Psychological Bulletin 137:790–795. [DOI] [PMC free article] [PubMed] [Google Scholar]
- Raz, N , Daugherty, AM , Bender AR, Dahle CL, Land S (2014): Volume of the hippocampal subfields in healthy adults: Differential associations with age and a pro‐inflammatory genetic variant. Brain Struct Function. doi: 10.1007/s00429-014-0817-6. [DOI] [PMC free article] [PubMed] [Google Scholar]
- Raznahan A, Shaw PW, Lerch JP, Clasen LS, Greenstein D, Berman R, Pipitone J, Chakravarty MM, Giedd JN (2014): Longitudinal four‐dimensional mapping of subcortical anatomy in human development. Proc Natl Acad Sci USA 111:1592–1597. [DOI] [PMC free article] [PubMed] [Google Scholar]
- Samson RD, Barnes CA (2013): Impact of aging brain circuits on cognition. Eur J Neurosci 37:1903–1915. [DOI] [PMC free article] [PubMed] [Google Scholar]
- Salthouse TA (2011): Neuroanatomical substrates of age‐related cognitive decline. Psychol Bull 137:753–784. [DOI] [PMC free article] [PubMed] [Google Scholar]
- Shaw P, D, Rossi P, Watson B, Wharton A, Greenstein D, Raznahan A, Sharp W Lerch JP, Chakravarty MM, (2014a): Mapping the development of the basal ganglia in children with attention‐deficit/hyperactivity disorder. J Am Acad Child Adolesc Psychiatry 53:780–789 e711. [DOI] [PMC free article] [PubMed] [Google Scholar]
- Shaw P, Sharp W, Sudre G, Wharton A, Greenstein D, Raznahan A, Evans A, Chakravarty MM, Lerch JP, Rapoport J (2014b): Subcortical and cortical morphological anomalies as an endophenotype in obsessive‐compulsive disorder. Mol Psychiatry. 20:224–231. [DOI] [PMC free article] [PubMed] [Google Scholar]
- Shen KK, Fripp J, Meriaudeau F, Chetelat G, Salvado O, Bourgeat P (2012): Detecting global and local hippocampal shape changes in alzheimer's disease using statistical shape models. Neuroimage 59:2155–2166. [DOI] [PubMed] [Google Scholar]
- Shing YL, Rodrigue KM, Kennedy KM, Fandakova Y, Bodammer N, Werkle‐Bergner M, Lindenberger U, Raz N (2011): Hippocampal subfield volumes: Age, vascular risk, and correlation with associative memory. Front Aging Neurosci 3:2 [DOI] [PMC free article] [PubMed] [Google Scholar]
- Small SA, Schobel SA, Buxton RB, Witter MP, Barnes CA (2011): A pathophysiological framework of hippocampal dysfunction in ageing and disease. Nat Rev Neurosci 12:585–601. [DOI] [PMC free article] [PubMed] [Google Scholar]
- Squire LR (1992): Memory and the hippocampus: A synthesis from findings with rats, monkeys, and humans. Psychol Rev 99:195–231. [DOI] [PubMed] [Google Scholar]
- Sullivan EV, Marsh L, Mathalon DH, Lim KO, Pfefferbaum A (1995): Age‐related decline in MRI volumes of temporal lobe gray matter but not hippocampus. Neurobiol Aging 16:591–606. [DOI] [PubMed] [Google Scholar]
- Sullivan EV, Marsh L, Pfefferbaum A (2005): Preservation of hippocampal volume throughout adulthood in healthy men and women. Neurobiol Aging 26:1093–1098. [DOI] [PubMed] [Google Scholar]
- Sullivan EV, Pfefferbaum A (2006): Diffusion tensor imaging and aging. Neurosci Biobehav Rev 30:749–761. [DOI] [PubMed] [Google Scholar]
- Suthana NA, Ekstrom AD, Moshirvaziri S, Knowlton B, Bookheimer SY (2009): Human hippocampal ca1 involvement during allocentric encoding of spatial information. J Neurosci 29:10512–10519. [DOI] [PMC free article] [PubMed] [Google Scholar]
- Tondelli M, Wilcock GK, Nichelli P, De Jager CA, Jenkinson M, Zamboni G (2012): Structural MRI changes detectable up to ten years before clinical alzheimer's disease. Neurobiol Aging 33:825 e825–836. [DOI] [PubMed] [Google Scholar]
- Travis SG, Huang Y, Fujiwara E, Radomski A, Olsen F, Carter R, Seres P, Malykhin NV (2014): High field structural MRI reveals specific episodic memory correlates in the subfields of the hippocampus. Neuropsychologia 53:233–245. [DOI] [PubMed] [Google Scholar]
- Treadway MT, Waskom ML, Dillon DG, Holmes AJ, Park MTM, Chakravarty MM, Dultra SJ, Polli FE, Iosifescu DV, Fava M, Gabrieli JDE, Pizzagalli DA (2015): Illness progression, recent stress, and morphometry of hippocampal subfields and medial prefrontal cortex in major depression. Biol Psychiatry 77:285–294. [DOI] [PMC free article] [PubMed] [Google Scholar]
- Tulving E (2002): Episodic memory: From mind to brain. Annu Rev Psychol 53:1–25. [DOI] [PubMed] [Google Scholar]
- Van Essen DC (1997): A tension‐based theory of morphogenesis and compact wiring in the central nervous system. Nature 385:313–318. [DOI] [PubMed] [Google Scholar]
- Van Petten C (2004): Relationship between hippocampal volume and memory ability in healthy individuals across the lifespan: Review and meta‐analysis. Neuropsychologia 42:1394–1413. [DOI] [PubMed] [Google Scholar]
- Voineskos AN, Rajji TK, Lobaugh NJ, Miranda D, Shenton ME, Kennedy JL, Pollock BG, Mulsant BH (2012): Age‐related decline in white matter tract integrity and cognitive performance: A DTI tractography and structural equation modeling study. Neurobiol Aging 33:21–34. [DOI] [PMC free article] [PubMed] [Google Scholar]
- Wechsler D (2001): Wechsler Test of Adult Reading. Harcourt Assessment. [Google Scholar]
- Winterburn JL, Pruessner JC, Chavez S, Schira MM, Lobaugh NJ, Voineskos AN, Chakravarty MM (2013): A novel in vivo atlas of human hippocampal subfields using high‐resolution 3 T magnetic resonance imaging. Neuroimage 74:254–265. [DOI] [PubMed] [Google Scholar]
- Wisse LEM, Gerritsen L, Zwanenburg JJ, Kuijf HJ, Luijten PR, Biessels GJ, Geerlings MI (2013): Subfields of the hippocampal formation at 7T MRI: In vivo volumetric assessment. Neuroimage 61:1043–1049. [DOI] [PubMed] [Google Scholar]
- Yang X, Goh A, Chen SH, Qiu A (2013): Evolution of hippocampal shapes across the human lifespan. Hum Brain Mapp 34:3075–3085. [DOI] [PMC free article] [PubMed] [Google Scholar]
- Yassa MA, Muftuler LT, Stark CE (2010): Ultrahigh‐resolution microstructural diffusion tensor imaging reveals perforant path degradation in aged humans in vivo. Proc Natl Acad Sci USA 107:12687–12691. [DOI] [PMC free article] [PubMed] [Google Scholar]
- Yassa MA, Stark SM, Bakker A, Albert MS, Gallagher M, Stark CE (2010): High‐resolution structural and functional MRI of hippocampal ca3 and dentate gyrus in patients with amnestic mild cognitive impairment. Neuroimage 51:1242–1252. [DOI] [PMC free article] [PubMed] [Google Scholar]
- Yonelinas AP (2013): The hippocampus supports high‐resolution binding in the service of perception, working memory and long‐term memory. Behav Brain Res 254:34–44. [DOI] [PMC free article] [PubMed] [Google Scholar]
- Yushkevich, PA , Amaral, RS , Augustinack, JC , Bender AR, Bernstein JD, Boccardi M, et al. for the Hippocampal Subfields Group (2015): Quantitative comparison of 21 protocols for labeling hippocampal subfields and parahippocampal subregions in in vivo MRI: Towards a harmonized segmentation protocol. NeuroImage 111:526–541. [DOI] [PMC free article] [PubMed] [Google Scholar]
- Yushkevich PA, Avants BB, Das SR, Pluta J, Altinay M, Craige C (2010): Bias in estimation of hippocampal atrophy using deformation‐based morphometry arises from asymmetric global normalization: An illustration in ADNI 3 T MRI data. Neuroimage 50:434–445. [DOI] [PMC free article] [PubMed] [Google Scholar]
- Yushkevich PA, Avants BB, Pluta J, Das S, Minkoff D, Mechanic‐Hamilton D, Glynn S, Pickup S, Liu W, Gee JC, Grossman M, Detre JA (2009): A high‐resolution computational atlas of the human hippocampus from postmortem magnetic resonance imaging at 9.4 T. Neuroimage 44:385–398. [DOI] [PMC free article] [PubMed] [Google Scholar]
- Yushkevich PA, Wang H, Pluta J, Das SR, Craige C, Avants BB, Weiner MW, Mueller S (2010): Nearly automatic segmentation of hippocampal subfields in in vivo focal T2‐weighted MRI. Neuroimage 53:1208–1224. [DOI] [PMC free article] [PubMed] [Google Scholar]
- Zhao Z, Taylor WD, Styner M, Steffens DC, Krishnan KR, MacFall JR (2008): Hippocampus shape analysis and late‐life depression. PLoS One 3:e1837 [DOI] [PMC free article] [PubMed] [Google Scholar]
Associated Data
This section collects any data citations, data availability statements, or supplementary materials included in this article.
Supplementary Materials
Supporting Information