

Abstract
Understanding how neural processes involved in punishing and rewarding others are altered by group membership and personality traits is critical in order to gain a better understanding of how socially important phenomena such as racial and group biases develop. Participants in an fMRI study (n = 48) gave rewards (money) or punishments (electroshocks) to in‐group or out‐group members. The results show that when participants rewarded others, greater activation was found in regions typically associated with receiving rewards such as the striatum and medial orbitofrontal cortex, bilaterally. Activation in those regions increased when participants rewarded in‐group compared to out‐group members. Punishment led to increased activation in regions typically associated with Theory of Mind including the medial prefrontal cortex and posterior superior temporal sulcus, as well as regions typically associated with perceiving others in pain such as the dorsal anterior cingulate cortex, anterior insula and lateral orbitofrontal cortex. Interestingly, in contrast to the findings regarding reward, activity in these regions was not moderated by whether the target of the punishment was an in‐ or out‐group member. Additional regression analysis revealed that participants who have low perspective taking skills and higher levels of psychopathy showed less activation in the brain regions identified when punishing others, especially when they were out‐group members. In sum, when an individual is personally responsible for delivering rewards and punishments to others, in‐group bias is stronger for reward allocation than punishments, marking the first neuroscientific evidence of this dissociation. Hum Brain Mapp 35:4989–4999, 2014. © 2014 Wiley Periodicals, Inc.
Keywords: fMRI, social neuroscience, group membership, rewarding, punishing, in‐group bias, discrimination, psychopathy, theory of mind, empathy, striatum
INTRODUCTION
The development of strong, intimate ties between people formed the basis for large social and cultural groups that allowed our species to survive and thrive [Baumeister and Leary, 1995]. One of the major benefits of forming large, tight‐knit social groups is the competitive advantage such groups had over other groups. Accordingly, there is a strong drive to deliver positive outcomes for in‐group members and negative outcomes to out‐group members. Nevertheless, punishment is not the exclusive domain of out‐group members; it has a role in governing the behavior of in‐group members. Leaders also need to create powerful forces by ensuring the punishment of wayward or obstinate followers [Shinada et al., 2004]. In daily life, individuals in power often have to make decisions that have either positive or negative consequences for others. Empathy is a necessary ability for these power‐holders to understand the potential consequences their decisions will have on the feelings and emotions of others, even if the recipients of those decisions belong to a different group. The alternative is a world ruled by cold‐hearted decisions in which in‐group bias thrives. Therefore it is crucial to get a better understanding of the neural underpinnings of the mechanisms involved in delivering rewards and punishments directly to others, and investigate how these mechanisms are modulated by personality traits and group membership. Empathy involves both affective and cognitive components [Bernhardt and Singer, 2012; Decety, 2011; Shamay‐Tsoory, 2011] and the neural circuits underpinning these components can be modulated by various factors including individual differences and group membership [Chiao and Mathur, 2010; Eberhardt, 2005; Eres and Molenberghs, 2013; Hein et al., 2010; Hein and Singer, 2008; Ito and Bartholow, 2009; Kubota et al., 2012; Molenberghs, 2013]. Yet, to date not much is known about how these feelings of empathy are influenced when participants are directly responsible for actions that cause pleasure or harm to others. In addition, no study thus far has investigated how these processes are influenced by individual dispositions and group membership.
Affective understanding of other's emotions is partially subserved by simulating the emotions we perceive in others onto similar brain regions as when we experience these emotions ourselves [Keysers and Gazzola, 2009; Molenberghs et al., 2012]. The sensory components of the emotions are not necessarily simulated, but rather their affective responses [Singer et al., 2004]. For example, when experiencing pain, individuals' somatosensory cortex is activated (sensory stimulation) in addition to regions that represent the affective components of pain such as the anterior insula and dorsal anterior cingulate cortex [Lloyd et al., 2004; Singer et al., 2004]. However, when individuals see others receiving physical pain the sensory components are not necessarily simulated through activation of the somatosensory cortex. Instead, only the affective components of the painful stimulation may be simulated, through activation of the anterior insula and dorsal anterior cingulate cortex [Jackson et al., 2005; Singer et al., 2004]. The affective components of pain have been shown previously to be modulated by group membership. For example, when participants were shown pictures of faces being penetrated with a needle, they showed more affective pain sharing (more activation in the dorsal anterior cingulate cortex and anterior insula) when the faces where from members of their own race compared to members from a different race [Xu et al., 2009].
Individuals do not only simulate negative painful emotions with others but also positive emotions such as rewards. When people anticipate or receive rewards themselves, they typically activate the striatum and medial orbitofrontal cortex [Fliessbach et al., 2007; Haruno and Kawato, 2006; Izuma et al., 2008; Knutson et al., 2001; Kringelbach, 2005; McClure et al., 2004]. Similar areas are also involved when giving donations to charities [Harbaugh et al., 2007; Izuma et al., 2010; Moll et al., 2006] or when giving equitable to other people [Zaki and Mitchell, 2011]. These areas also become more activated depending on how close the individual identifies to a group. For example, Telzer et al. [2010] conducted an fMRI study in which participants could earn money and either keep it for themselves or give it to their family. They found that participants who identified more with their family showed increased reward system activation when contributing money to their family. However, the question still remains unknown how reward‐related neural systems are modulated when giving rewards to in‐group versus out‐group members.
Affective sharing of emotions is merely one component which helps us to empathize with the emotions of others. To fully understand what another person is thinking or feeling, one must also reason about the mental states of others. This cognitive component of empathy typically involves brain regions that we associate with Theory of Mind (i.e., the ability to attribute mental states to others) such as the medial prefrontal cortex and right posterior temporal sulcus [Amodio and Frith, 2006; Van Overwalle, 2009]. The neural correlates involved in cognitive empathy are also modulated by group membership [Eres and Molenberghs, 2013]. For example, an fMRI study by Adams et al. [2009] showed that participants were better in decoding the mental state of members from their own culture. This intercultural advantage was associated with increased activation in the posterior superior temporal sulcus. In another fMRI study, Mathur et al. [2010] showed scenes of African‐Americans and Caucasian‐Americans, in which in‐group members and out‐group members experience emotional pain (e.g., people in the midst of a natural disaster). They found that in‐group biases in empathy were correlated with activity in the medial prefrontal cortex in response to in‐group relative to out‐group pain scenes.
What has been missing in the literature however, are investigations into how group membership and individual dispositions influence neural responses when individuals are responsible for delivering the rewards and punishments to others directly. Previous neuroscience studies have already shown that we categorize [Molenberghs and Morrison, 2014; Morrison et al., 2012; Volz et al., 2009], empathize [Cikara et al., 2011; Hein et al., 2010; Xu et al., 2009], perceive actions [Gutsell and Inzlicht, 2010; Molenberghs et al., 2013] and faces [Cunningham et al., 2004; Van Bavel et al., 2008] differently for in‐group and out‐group members. These studies have already led to a better understanding of how the neural mechanisms in these different modalities are modulated, which is crucial for a better understanding of how in‐group bias and racism develop and for learning how to reduce these biases in the future [Molenberghs, 2013]. However a better fundamental understanding of how the neural mechanisms involved in personally rewarding and punishing others are influenced by group membership and individual dispositions is even more important because these actions have a direct impact on the life of the recipient. For example, when giving rewards to in‐group members do we activate reward related areas more than when giving rewards to out‐group members? Do we activate affective pain regions more when delivering punishments to in‐group compared to out‐group members? Do we think more about the mental states (more activation in Theory of Mind regions) of others when we hurt other people and how is this influenced by group membership and individual dispositions? Do differences in individual dispositions interact with group membership of the victim when hurting others? To investigate these questions, we used fMRI and asked participants to give rewards (money) or punish (electroshocks) in‐group and out‐group members in response to their answers on a difficult trivia task (Fig. 1). It was predicted that when participants deliver rewards to others, the same areas typically involved in processing rewards, such as the striatum and medial orbitofrontal cortex, would become more active. In addition, we predicted that these regions will become more active when participants deliver rewards to in‐group members compared to out‐group members. When participants deliver shocks to others more activation in regions typically associated with Theory of Mind such as the medial prefrontal cortex and posterior temporal sulcus [Amodio and Frith, 2006] was expected. Increased response in regions involved in processing the affective component of pain such as the anterior insula and dorsal cingulate cortex was predicted when punishing others.
Figure 1.
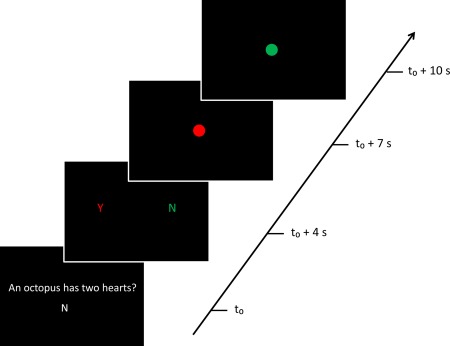
Schematic representation of the trivia task used during the fMRI experiment for a green UQ participant. A “no” question (4s), followed by a “yes” QUT student response and a “no” UQ student response (3s). Red circle (3s) representing QUT followed by a green circle (3s) representing UQ. Participants gave either a reward (for a correct answer), a shock (for an incorrect answer), or nothing (for no answer) during each circle presentation. In this case, the QUT confederate would get a shock and the UQ confederate would get a reward. [Color figure can be viewed in the online issue, which is available at http://wileyonlinelibrary.com.]
Based on previous research discussed above [Mathur et al., 2010; Xu et al., 2009], it could be argued that participants would empathize more with the pain of in‐group members. On the other hand, behavioral research has consistently shown that when we are responsible, in‐group bias is more about preferential treatment of the in‐group rather than hostility toward the out‐group, especially in situations where there is no direct competition between the two groups [Brewer, 1999; Halevy et al., 2008]. Indeed as Brewer [1999] noted, in‐group love and out‐group hate are not necessarily reciprocally related. Although we are usually happy if we can benefit our own group, we do not necessarily find joy in harming the out‐group. Therefore an alternative prediction would be that rewarding others would show an in‐group bias (more activation in reward related areas for in‐group versus out‐group), but hurting out‐group members would activate the regions involved in punishing others (affective pain and Theory of Mind areas) to the same degree as hurting in‐group members.
In addition we investigated how individual dispositions such as an ability to see things from another person's perspective as well as psychopathic traits would moderate the effect of delivering pain to others. Previous research has shown that participants who show high levels of psychopathy, show less activation in regions typically associated with empathy, when watching others being hurt or in distress [Decety et al., 2006, 2009; Lockwood et al., 2013; Marsh et al., 2013; Meffert et al., 2013]. Moreover, one recent fMRI study with incarcerated psychopaths demonstrated reduced neuro‐hemodynamic response in the anterior insula and OFC when imagining others in pain, which was predicted by scores on factor 1 of the Hare psychopathy checklist revised [Decety et al., 2013]. However to date it remains unclear how the neural responses involved in empathy are influenced by these differences in individual dispositions when one is the agent responsible for delivering harm to others directly. Although people who score high on the psychopathy can be very charming and giving, they have a profound lack of empathy and a callous disregard for the wellbeing of others [Hare, 1999], unless those others are seen as in‐group members [Arbuckle and Cunningham, 2012]. It was therefore predicted that participants who are low on perspective taking and those who have high levels of psychopathy would show less activation in the areas associated with punishing others, especially for out‐group members.
METHODS
Participants
Forty‐eight healthy University of Queensland (UQ) students (24 females, mean age = 22.5 years, SD = 4.9 years) completed the two sessions of the experiment. To minimize the chance that participants were familiar with the deception techniques, we excluded any participants who had completed a Psychology course. Participants were paid $30 for their time. All participants gave written informed consent. The study was approved by the Behavioral and Social Sciences Ethical Review Committee of the University of Queensland.
Procedure
Potential participants were first screened by email for MRI suitability (e.g., no pacemaker, no braces, etc.), UQ student membership and no previous experience with Psychology courses. Participants that fit these criteria were invited to come to the first session which involved team allocation, group identification measure and personality questionnaires. This was followed by a second session on a different day in which participants completed the fMRI experiment.
Team Allocation
To make group membership salient, participants were randomly allocated to either the red (24 participants) or green (24 participants) UQ team and asked to wear a jumper representing their team color. Participants were told that members of the other team colour were students from a neighboring university (Queensland University of Technology; QUT). While wearing the colored jumper, participants filled in a computerized questionnaire.
Group Identification Questionnaire
Group identification was assessed by presenting participants with two statements: “I identify myself as a UQ student” and “I identify myself as a QUT student”. Participants had to indicate on a 7‐point Likert scale (7 = totally agree, 4 = neutral, and 1 = totally disagree) how much they agreed with each statement. Only participants who identified with UQ (score > 4) and identified more with UQ than QUT were invited to take part in the second session (fMRI experiment) a couple of days later. Participants that did not fit the criteria for group identification were replaced by others.
Perspective Taking (PT) Questionnaire
PT is a 10‐item subscale of the Questionnaire of Cognitive and Affective Empathy (QCAE; [Reniers et al., 2011]). All items are rated on a four‐point Likert scale. Perspective taking refers to the extent to which individuals adopt others perspectives (e.g., “I can usually appreciate another person's view point, even if I do not agree with it”). Total scores were calculated by adding the scores from the 10‐items with lower scores indicating that people are poorer at perspective taking. The total score was then used as a regressor in the fMRI analysis.
Psychopathy Questionnaire
The SRP‐III is a 64‐item questionnaire that measures Psychopathy using a five‐point Likert scale [Paulhus et al., 2012]. The SRP contains four subscales assessing interpersonal manipulation (IP), callous affect (CA), erratic lifestyle (ELS), and antisocial behavior (ASB). Each subscale contains 16‐items. A total score for psychopathy was calculated by averaging the scores from the four subscales. Higher psychopathy scores indicate higher levels of psychopathy. This score was then used as a regressor in the fMRI analysis.
Functional MRI Experiment
Participants were screened using a MRI safety checklist. Participants were shown a brief demonstration of the experiment on a laptop. The demonstration ensured participants correctly understood how to perform the task. Participants were then taken to meet two confederates (a UQ and a QUT student). The two confederates were either both males (50% of the time) or both females. Confederates were initially randomly assigned to a group color and were subsequently an in‐group or out‐group member. Confederates were naive to the true nature of the experiment and were instructed to interact as little as possible with the participants. Each confederate wore either a red or green jumper representing the corresponding institution color (i.e., the UQ student was wearing green 50% of the time). The experimenter introduced the confederates by their name, institution and jumper color (e.g., “This is Peter in the red jumper. Peter is from UQ”). Each confederate was sitting in front of a Dell desktop computer with electrodes attached to their hands. The electrodes were attached to a set of wires that extended into a control box. Participants had to press one of three buttons indicating the delivery of a shock, reward or nothing. It was made known to participants that they should deliver the electroshocks to the students via a hand held remote in the scanner, only if the other students answered incorrectly. Participants were also informed that they were responsible for giving the rewards to the students (0.5 AUD for each correct answer), but only if the students gave the correct answer. In reality the other students were confederates and they did not receive any electroshocks or monetary rewards. Participants were then taken to the MRI scanner. The experimental stimuli were presented on a black background with white, red and green colored text (see Fig. 1).
The task consisted of six experimental conditions: reward in‐group (RI), shock in‐group (SI), neutral in‐group (NI), reward out‐group (RO), shock out‐group (SO), and neutral out‐group (NO). Each trial (Fig. 1) started with a difficult trivia question (4s) presented on a black screen in white text. Below the trivia question, “Y” (answer = yes) or “N” (answer = no) was presented in order to represent the correct answer to the question (Fig. 1). On a second slide, both the UQ and QUT students' answer (3s) was presented on a black screen with red and green text. Text color represented the corresponding university institution color (e.g., UQ represented by red text 50% of the time). Order of answers (UQ first versus QUT first) was counterbalanced. Possible answers (“Y” (yes), “N” (no), and “X” (no response)) were pseudorandomized (i.e., one third of the time per confederate). A red and green circle (3s) appeared in the middle of the screen at separate times (i.e., if red was presented left in the previous slide the red dot would appear first) signifying the institution color and response phase. Participants then presented a response to students in relation to their answers. Each color was presented first 50% of the time. The order of all trivia questions, correct answer (yes or no), student answer (yes, no or no answer), and circle color (red or green) was pseudorandomized (i.e., equal amounts across the experiment). The entire task was conducted in five repeated fMRI runs. Each run consisted of 12 trials per condition thus there was a total of 60 trials per condition across the 5 runs.
fMRI Image Acquisition
A 3‐Tesla Siemens MRI scanner with 32‐channel head volume coil was used to obtain the data. Functional images were acquired using gradient‐echo planar imaging (EPI) with the following parameters: repetition time (TR) 3s, echo time (TE) 30 ms, flip angle (FA) 90°, 64 × 64 voxels at 3 × 3 in‐plane resolution. Whole brain images were acquired every 3 s and a total of 164 were acquired per run. The first four TR periods from each functional run (during which a fixation point was presented) were removed to allow for steady‐state tissue magnetization. T1‐weighted image covering the entire brain was also acquired after the last run and used for anatomical reference (TR = 1,900, TE = 2.32 ms, FA = 9°, 192 cubic matrix, voxel size = 0.9 cubic mm, slice thickness = 0.9 mm).
fMRI Analysis
All MRI data were analyzed with SPM8 Software (Wellcome Department of Imaging Neuroscience, Institute of Neurology, London) run through Matlab (Mathworks, USA). EPI images were realigned to the first scan of each run in order to correct for any head movements. Additionally, realignment corrected for any systematic differences in the images between runs. During coregistration, the anatomical scan was turned to the mean functional scan. The anatomical image was then segmented to the MNI T1 template. All functional and structural images were normalized to the created template using the segment parameters (voxel size 3 × 3 × 3 and 1 × 1 × 1, respectively). This was done in order to correct for brain size variations across participants. Finally, images were smoothed using a Gaussian kernel of 6 mm.
During the first level analysis, a general linear model was created for all participants. For each participant, in each of the six conditions (RI, SI, NI, RO, SO, and NO), an event related design identified the regions with significant BOLD changes in each voxel compared to the baseline. The events were modeled by a canonical hemodynamic response function (with time derivative) time‐locked to the onset of each action (shock, reward, or nothing). These onsets occurred at the start of the slide representing the green or red circle, which were separated by a 3‐s interval (Fig. 1). Crucially, each in‐group condition (RI, SI, NI) was pseudorandomly associated with an out‐group condition (RO, SO, NO) so that each followed or preceded the other, one third of the time. This made the events independent and therefore the BOLD response could be modeled separately. No jittered intertrial interval (ITI) was chosen between the red and green dot to disentangle the events because this would have disrupted the flow of the experiment for the participant. In addition, this would have made the duration of the trial significantly longer. This would have led to a reduction in the number of trials which could have been presented during the experiment. This might have potentially led to a reduction in power, although we acknowledge that adding an ITI could have potentially increased the power of the design as well by disentangling the events which were close in time. To remove any potentially confounding effects of reaction time (RT) and accuracy we only modelled correct trials and included RT as a parametric modulation in our fMRI design. On average 2.31% (SD = 1.9) of the trials were dropped with the least accurate participants scoring 8.9% incorrect and the most accurate participant making no mistakes. In the second level analysis, contrast images for each condition minus baseline across all participants were included in the factorial design. Follow‐up t‐tests were calculated for each research hypothesis to determine if the differences in brain activation between conditions were significant. First, significant brain regions active for punishing and rewarding were identified by comparing each condition compared to the neutral condition. A cluster‐level threshold with a familywise error rate (FWE) of P < 0.05 corrected for the whole brain was used to identify significant activation, with clusters defined by a voxel‐level probability threshold of P < 0.001. Region of interest analyses were then used for all follow up tests. A voxel‐level threshold with a family wise error rate (FWE) of P < 0.05 corrected for the size of the cluster (defined by a 3‐mm box around the peak coordinates using the WFU PickAtlas; http://www.fmri.wfubmc.edu/cms/software) was used to define significant activation for all follow‐up analysis. All follow‐up analyses were independent from the main contrasts and thresholded with a voxel‐level probability threshold of P < 0.05.
RESULTS
Group Identification Questionnaire
A paired samples t test revealed that participants reported that they identified more with UQ (M = 6.73, SE = 0.07) compared to QUT (M = 1.33, SE = 0.10), t (47) = −38.0, P < 0.001.
fMRI Results
A 2 × 3 repeated measures ANOVA, revealed no significant main effect of RT on group membership, F(1,47) = 0.70, P = 0.41 (in‐group: M = 537, SE = 23; out‐group: M = 540, SE = 22) or type of feedback, F(2,94) = 2.35, P = 0.10 (reward: M = 531, SE = 21; shock: M = 549, SE = 24; nothing: M = 535, SE = 24). No significant interaction was found between group membership and type of feedback, F(2,94) = 0.88, P = 0.42 (RI: M = 530, SE = 22; SI: M = 545, SE = 24; NI: M = 536, SE = 24; RO: M = 531, SE = 21; SO: M = 554, SE = 25; NO: M = 534, SE = 23).
A similar 2 × 3 repeated measures ANOVA, revealed no significant main effect of accuracy on group membership, F(1,47) = 0.19, P = 0.66 (in‐group: M = 97.7%, SE = 0.3; out‐group: M = 97.7%, SE = 0.3) or type of feedback, F(2,94) = 1.05, P = 0.35 (reward: M = 97.4%, SE = 0.4; shock: M = 97.7%, SE = 0.3; nothing: M = 97.9%, SE = 0.3). No significant interaction was found between group membership and type of feedback, F(2,94) = 0.12, P = 0.89 (RI: M = 97.4%, SE = 0.4; SI: M = 97.7%, SE = 0.4; NI: M = 97.8%, SE = 0.4; RO: M = 97.5%, SE = 0.4; SO: M = 97.7%, SE = 0.4; NO: M = 98.0%, SE = 0.3).
As expected, no difference in reaction time or accuracy was found between the conditions but crucially different patterns in fMRI activation were found for rewarding and punishing others.
Rewarding Others
Significant neural activation was found for the reward (RI, RO) minus neutral (NI, NO) contrast (Fig. 2) in the left putamen (−27, 8, 1, Z = 5.30, extent 136, P = 0.001), right putamen (27, 5, −5, Z = 4.24, extent 77, P = 0.01) and medial orbitofrontal cortex (mOFC: 0, 23, −5, Z = 5.12, extent 148, P < 0.001). The same three regions were more active (Fig. 2) in the reward in‐group (RI) compared to the reward out‐group (RO) condition (left putamen: −24, 11, −2; Z = 2.46, P = 0.04; right putamen: 27, 5, −8, Z = 3.26, P = 0.0004; mOFC: −3, 26, −2, Z = 2.61, P = 0.03).
Figure 2.
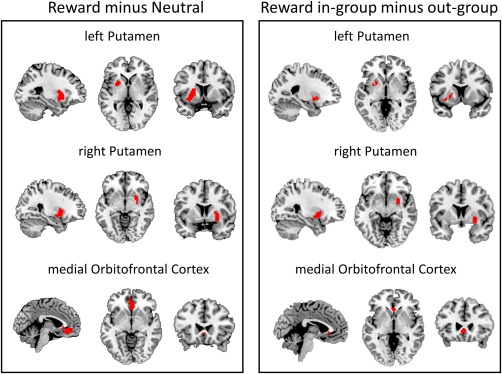
Significant left putamen, right putamen, and medial oribitofrontal cortex activation for the reward (RI, RO) minus neutral (NI, NO) and reward in‐group (RI) minus reward out‐group (RO) contrasts. Activations are displayed on a ch2better.nii.gz template using MRIcron. [Color figure can be viewed in the online issue, which is available at http://wileyonlinelibrary.com.]
Punishing Others
Significant neural activation was found for the shock (SI, SO) minus neutral (NI, NO) contrast (Fig. 3) in the medial prefrontal cortex extending into the dorsal anterior cingulate cortex (mPFC/dACC: −3, 53, 28, Z = 5.73, extent 383, P < 0.001), left orbitofrontal cortex extending into the left anterior insula (left OFC/AI: −48, 23, −8, Z = 6.07, extent 232, P < 0.001), right orbitofrontal cortex extending into the right anterior insula (right OFC/AI: 45, 29, −8, Z = 4.69, extent 104, P = 0.003) and right posterior superior temporal sulcus (right pSTS: 57, −25, −5, Z = 4.38, extent 101, P = 0.004). No significant difference was found in any of these four regions for the SI minus SO contrast. A paired samples t‐test further confirmed that there was no significant difference between the % signal change in the combined clusters found in the shock (SI, SO) minus neutral (NI, NO) contrast for SI (M = 0.051 %, SE = 0.017) compared to SO (M = 0.054 %, SE = 0.018), t (47) = −0.2, P = 0.84. These fMRI results are consistent with the view that different networks are involved in rewarding and punishing others and that in‐group bias is more about in‐group favouritism rather than out‐group harm.
Figure 3.
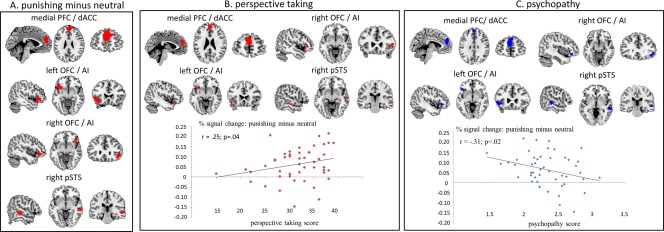
A. Significant activation for the shock (SI, SO) minus neutral (NI, NO) contrast. B. Positive correlation (in red) between perspective taking score and shock minus neutral contrast. C. Negative correlation (in blue) between psychopathy score and shock minus neutral contrast. mPFC/dACC = medial prefrontal cortex extending into dorsal anterior cingulate cortex. Left OFC/AI = left orbitofrontal cortex extending into left anterior insula. Right OFC/AI = right orbitofrontal cortex extending into right anterior insula. Right pSTS = right posterior superior temporal sulcus. Activations are displayed on a ch2better.nii.gz template using MRIcron. [Color figure can be viewed in the online issue, which is available at http://wileyonlinelibrary.com.]
To further explore how individual dispositions influence the extent to which participants empathize with the participants they punished, we used the participants' scores on the perspective taking (a lower score means poorer perspective taking) and psychopathy (a higher score means higher levels of psychopathy) questionnaire as regressors. Both the 10 items from the perspective taking measure and four subscales from the psychopathy measure showed acceptable internal consistency (Cronbach's alphas: α = 0.85 and α = 0.61, respectively). First, the average % signal change was calculated independently from the questionnaires by extracting the values from all voxels from the four significant ROIs using MarsBaR (http://marsbar.sourceforge.net/) from the SI, SO minus NI, NO contrast. Then these scores were correlated with the perspective taking and psychopathy scores. A positive one‐tailed Pearson correlation (r = 0.25; P = 0.04) was found between % signal change in these four regions combined and the perspective taking score (Fig. 3B). Follow‐up tests in SPM found a positive trend in all four regions (Fig. 3B) between perspective taking scores and the shock minus neutral contrast (mPFC/dACC: −3, 56, 25, Z = 2.77, P = 0.02; left IFG/AI: −45, 23, −8, Z = 2.30, P = 0.06; right IFG/AI: 48, 26, −8, Z = 2.06, P = 0.08; right pSTS: 57, −22, −5, Z = 1.93, P = 0.1). A negative one‐tailed Pearson correlation (r = −0.31; P = 0.02) was found between % signal change in these four regions combined and the psychopathy score (Fig. 3C). Follow‐up tests in SPM found a positive correlation in all four regions between psychopathy scores and the shock minus neutral contrast (mPFC/dAA: −6, 53, 31, Z = 2.53, P = 0.03; Left IFG/AI: −45, 26, −5; Z = 2.57, P = 0.03; right IFG: 42, 32, −11, Z = 2.60, P = 0.03; right pSTS: 57, −25, −2; Z = 2.61; P = 0.03). These results are in line with the view that people with poor perspective taking skills and higher levels of psychopathy have difficulty with empathizing with the harm they cause to others.
Additional analysis showed that the SO minus NO contrast, revealed a significant positive one‐tailed Pearson correlation (r = 0.34; P = 0.01) with the perspective taking score and a negative one‐tailed Pearson correlation (r = 0.34; P = 0.01) with the psychopathy score. However, the same correlations produced nonsignificant correlations for the SI minus NI contrast (r = 0.05; P = 0.4; and r = −0.21; P = 0.08, respectively). This is in line with the view that participants with poor perspective taking skills and higher levels of psychopathy have less problems with empathizing with the harm they cause to others if they are viewed as in‐group members [Arbuckle and Cunningham, 2012].
DISCUSSION
In the current study, we measured the neural response associated with rewarding and punishing others, and further investigated how these responses are modulated by group membership and individual dispositions. The results showed greater activation in the striatum and medial orbitofrontal cortex when participants were rewarding others. Activation in the striatum was centered on the dorsal putamen, rather than other striatum regions that have also been associated with reward processing such as the caudate nucleus and nucleus accumbens. Specifically, within the dorsal striatum, the dorsal part of the putamen has been implicated in making the association between a certain stimulus and the right action to receive the reward, while the other dorsal striatum region (i.e., dorsal caudate nucleus) and ventral striatum are specifically involved in comparing the predicted and actual award [Haruno and Kawato, 2006]. Given that the reward in our study was always the same amount (0.5 AUD) and participants had to learn the correct button response for the confederates' correct answer, it is no surprise that activation was centered on the dorsal putamen. The medial orbitofrontal cortex activation fits well with previous research where it has been shown to be associated with evaluation processes and value‐guided decision‐making [Noonan et al., 2012] and monitoring the reward value of different reinforcers [Kringelbach and Rolls, 2004]. Increased activation in the same regions was found when participants rewarded in‐group members compared to out‐group members. This finding is consistent with previous research showing that greater identification with the family resulted in increased activation in reward related regions when giving money to a family member compared to keeping money for themselves [Telzer et al., 2010]. However, the present data are the first to show that delivering rewards to others is influenced by group membership. It seems that even if two individuals are unknown to us, we would rather give a reward to an in‐group compared to out‐group member.
Neural response for punishing others directly revealed a different pattern of brain activation, which is the first time this has been shown in the same study. Here, more activation was found in regions typically associated with Theory of Mind such as the medial prefrontal cortex and right posterior temporal sulcus [Amodio and Frith, 2006]. This may indicate that participants were thinking about the mental states of others when delivering the electroshocks to the confederates which are consistent with previous neuroimaging research on third‐party punishment [Buckholtz et al., 2008]. In addition, increased activity was found in the dorsal anterior cingulate cortex and bilateral anterior insula. This suggests that although participants did not see the confederates in pain, they were probably imagining the pain that the electroshock was causing [Jackson et al., 2006]. More activation was also found in the left and right orbitofrontal cortex adjacent to the anterior insula activation. The lateral orbitofrontal cortex has previously been shown to activate when people see others in pain or imagine hurting others [Decety and Porges, 2011] and imaging hurting others in the same study led to reduced activation in medial orbitofrontal cortex. The distinction between medial orbitofrontal cortex activation for rewards and lateral orbitofrontal cortex activation for punishments in the current study is also consistent with previous research, which found that linking certain behavior with a monetary reward led to increased medial orbitofrontal cortex activation, while linking behavior with monetary losses led to increases in lateral orbitofrontal cortex activation [Kringelbach and Rolls, 2004; O'Doherty et al., 2001].
Interestingly, no effect of group membership was found when punishing others. The same regions were equally activated when punishing in‐group members compared to out‐group members. Previous research has shown that when we see others in pain, we empathize more with the pain of in‐group members than out‐group members [Avenanti et al., 2010; Azevedo et al., 2013; Cheon et al., 2011; Hein et al., 2010; Xu et al., 2009]. In those studies, however, the participants themselves were not responsible for causing the pain. Indeed, the findings of the current study provide evidence to suggest that we empathize equally with the painful experience delivered to both the in‐group and out‐group when we are responsible for delivering the pain ourselves, and when there is no direct competition or strong animosity between the two groups (i.e., neighboring universities). This fits well with a long‐held view in social psychology that in‐group bias begins with the preferential treatment of the in‐group member rather than necessarily involving direct hostility toward the out‐group member [Brewer, 1999; Halevy et al., 2008] and that “aggravating conditions” are needed for group members to punish and inflict harmful consequences onto out‐group members [Mummendey and Otten, 1998]. To our knowledge, this is the first time this dissociation has been shown in neuroimaging research. These results are also in line with the commonly held view that it is socially acceptable to show increased happiness when an in‐group member is being rewarded but socially unacceptable to not care about the pain of an out‐group member, especially when one is responsible for the pain caused. On the other hand, in situations where there is strong competition and animosity between the two groups (e.g., rival sporting teams) individuals can get pleasure out of the failures of the opposing team [Cikara et al., 2011]. It could also be that different types of punishments, could sometimes lead to modulation by group membership. For example, being responsible for physical harm, as in this study is a strong type of punishment which might lead to high feelings of discomfort regardless of group membership of the victim. Less extreme types of punishments, such as for example taking money away, could still lead to a modulation by group membership. In addition, people can also get pleasure out of punishing others if the other person has violated a social norm [De Quervain et al., 2004] which highlights the influence of context in these type of situations.
Furthermore, the dispositional measures showed that participants who were better at perspective taking and had lower levels of psychopathy showed more activation when punishing others in the same areas identified during the punishing minus neutral contrast. Correlation results between empathic dispositions and hemodynamic activations in the past have been mixed [Decety, 2011; Lamm et al., 2011], which is probably due to a lack of power in many fMRI studies [Yarkoni, 2009]. To overcome this problem we included a large sample (N = 48) in our fMRI study. Previous research has shown that clinical populations with psychopathic traits compared to healthy controls show less activity in regions involved in empathy when watching video clips of people being hurt [Decety et al., 2009, 2013; Deeley et al., 2006; Lockwood et al., 2013; Marsh et al., 2013]. Our results further extend this view by showing that in normal populations, participants who show lower levels of perspective taking and higher levels of psychopathy have reduced activation in Theory of Mind and affective pain regions when they are responsible for the pain inflicted to others, especially if the others are considered out‐group members. This is also the first study that investigated the influence of these individual dispositions, when the participants were responsible for causing the harm.
To conclude, our study demonstrates that different neural networks are involved when we are responsible for rewarding or punishing others. When we reward others we activate reward related areas in the brain and more so for in‐group members than out‐group members. On the other hand, when punishing others, we activate pain related areas and show increased activation in areas involved in affective and cognitive empathy. Activation in these areas was modulated by individual differences in personality traits rather than group membership. Past neuroimaging work on intergroup discrimination has focused on passively observing or witnessing differences in outcomes for in‐group and out‐group; the present work is among the first to study active discrimination and the first to compare reward and punishment in the same study. These results suggest that in situations where we are directly responsible, in‐group favouritism is more about in‐group love than out‐group hate. The real world reminds us that many groups can and have revelled in causing injury or death to others, e.g. by nationality or religions. However, reassuringly, it appears that everyday groups do not experience the same delight in harm‐doing.
REFERENCES
- Adams RB, Rule NO, Franklin RG, Wang E, Stevenson MT, Yoshikawa S, Nomura M, Sato W, Kveraga K, Ambady N (2009): Cross‐cultural reading the mind in the eyes: An fMRI investigation. J Cogn Neurosci 22:97–108. [DOI] [PubMed] [Google Scholar]
- Amodio DM, Frith CD (2006): Meeting of minds: The medial frontal cortex and social cognition. Nat Rev Neurosci 7:268–277. [DOI] [PubMed] [Google Scholar]
- Arbuckle NL, Cunningham WA (2012): Understanding everyday psychopathy: Shared group identity leads to increased concern for others among undergraduates higher in psychopathy. Social Cogn 30:564–583. [Google Scholar]
- Avenanti A, Sirigu A, Aglioti SM (2010): Racial bias reduces empathic sensorimotor resonance with other‐race pain. Curr Biol 20:1018–1022. [DOI] [PubMed] [Google Scholar]
- Azevedo RT, Macaluso E, Avenanti A, Santangelo V, Cazzato V, Aglioti SM (2013): Their pain is not our pain: Brain and autonomic correlates of empathic resonance with the pain of same and different race individuals. Hum Brain Mapp 34:3168–3181. [DOI] [PMC free article] [PubMed] [Google Scholar]
- Baumeister RF, Leary MR (1995): The need to belong: Desire for interpersonal attachments as a fundamental human motivation. Psychol Bull 117:497. [PubMed] [Google Scholar]
- Bernhardt BC, Singer T (2012): The neural basis of empathy. Annu Rev Neurosci 35:1–23. [DOI] [PubMed] [Google Scholar]
- Brewer MB (1999): The psychology of prejudice: Ingroup love and outgroup hate? J Social Issues 55:429–444. [Google Scholar]
- Buckholtz JW, Asplund CL, Dux PE, Zald DH, Gore JC, Jones OD, Marois R (2008): The neural correlates of third‐party punishment. Neuron 60:930–940. [DOI] [PubMed] [Google Scholar]
- Cheon BK, Im D‐M, Harada T, Kim J‐S, Mathur VA, Scimeca JM, Parrish TB, Park HW, Chiao JY (2011): Cultural influences on neural basis of intergroup empathy. NeuroImage 57:642–650. [DOI] [PubMed] [Google Scholar]
- Chiao JY, Mathur VA (2010): Intergroup empathy: How does race affect empathic neural responses? Curr Biol 20:R478–R480. [DOI] [PubMed] [Google Scholar]
- Cikara M, Botvinick MM, Fiske ST (2011): Us versus them social identity shapes neural responses to intergroup competition and harm. Psychol Sci 22:306–313. [DOI] [PMC free article] [PubMed] [Google Scholar]
- Cunningham WA, Johnson MK, Raye CL, Gatenby JC, Gore JC, Banaji MR (2004): Separable neural components in the processing of black and white faces. Psychol Sci 15:806–813. [DOI] [PubMed] [Google Scholar]
- De Quervain DJ‐F, Fischbacher U, Treyer V, Schellhammer M, Schnyder U, Buck A, Fehr E (2004): The neural basis of altruistic punishment. Science 305:1254–1259. [DOI] [PubMed] [Google Scholar]
- Decety J (2011): Dissecting the neural mechanisms mediating empathy. Emotion Rev 3:92–108. [Google Scholar]
- Decety J, Porges EC (2011): Imagining being the agent of actions that carry different moral consequences: An fMRI study. Neuropsychologia 49:2994–3001. [DOI] [PubMed] [Google Scholar]
- Decety J, Michalska KJ, Akitsuki Y, Lahey BB (2009): Atypical empathic responses in adolescents with aggressive conduct disorder: A functional MRI investigation. Biol Psychol 80:203. [DOI] [PMC free article] [PubMed] [Google Scholar]
- Decety J, Chen C, Harenski C, Kiehl KA (2013): An fMRI study of affective perspective taking in individuals with psychopathy: Imagining another in pain does not evoke empathy. Front Hum Neurosci 7:489. [DOI] [PMC free article] [PubMed] [Google Scholar]
- Deeley Q, Daly E, Surguladze S, Tunstall N, Mezey G, Beer D, Ambikapathy A, Robertson D, Giampietro V, Brammer MJ (2006): Facial emotion processing in criminal psychopathy preliminary functional magnetic resonance imaging study. Br J Psychiatry 189:533–539. [DOI] [PubMed] [Google Scholar]
- Eberhardt JL (2005): Imaging race. Am Psychol 60:181. [DOI] [PubMed] [Google Scholar]
- Eres R, Molenberghs P (2013): The influence of group membership on the neural correlates involved in empathy. Front Hum Neurosci 7:176. [DOI] [PMC free article] [PubMed] [Google Scholar]
- Fliessbach K, Weber B, Trautner P, Dohmen T, Sunde U, Elger CE, Falk A (2007): Social comparison affects reward‐related brain activity in the human ventral striatum. Science 318:1305–1308. [DOI] [PubMed] [Google Scholar]
- Gutsell JN, Inzlicht M (2010): Empathy constrained: Prejudice predicts reduced mental simulation of actions during observation of outgroups. J Exp Social Psychol 46:841–845. [Google Scholar]
- Halevy N, Bornstein G, Sagiv L (2008): “In‐group love” and “out‐group hate” as motives for individual participation in intergroup conflict a new game paradigm. Psychol Sci 19:405–411. [DOI] [PubMed] [Google Scholar]
- Harbaugh WT, Mayr U, Burghart DR (2007): Neural responses to taxation and voluntary giving reveal motives for charitable donations. Science 316:1622–1625. [DOI] [PubMed] [Google Scholar]
- Hare RD (1999): Without Conscience: The Disturbing World of the Psychopaths Among Us. New York, NY: The Guilford Press. [Google Scholar]
- Haruno M, Kawato M (2006): Different neural correlates of reward expectation and reward expectation error in the putamen and caudate nucleus during stimulus‐action‐reward association learning. J Neurophysiol 95:948–959. [DOI] [PubMed] [Google Scholar]
- Hein G, Singer T (2008): I feel how you feel but not always: The empathic brain and its modulation. Curr Opin Neurobiol 18:153–158. [DOI] [PubMed] [Google Scholar]
- Hein G, Silani G, Preuschoff K, Batson CD, Singer T (2010): Neural responses to ingroup and outgroup members' suffering predict individual differences in costly helping. Neuron 68:149–160. [DOI] [PubMed] [Google Scholar]
- Ito TA, Bartholow BD (2009): The neural correlates of race. Trends Cogn Sci 13:524–531. [DOI] [PMC free article] [PubMed] [Google Scholar]
- Izuma K, Saito DN, Sadato N (2008): Processing of social and monetary rewards in the human striatum. Neuron 58:284. [DOI] [PubMed] [Google Scholar]
- Izuma K, Saito DN, Sadato N (2010): Processing of the incentive for social approval in the ventral striatum during charitable donation. J Cogn Neurosci 22:621–631. [DOI] [PubMed] [Google Scholar]
- Jackson PL, Meltzoff AN, Decety J (2005): How do we perceive the pain of others? A window into the neural processes involved in empathy. NeuroImage 24:771–779. [DOI] [PubMed] [Google Scholar]
- Jackson PL, Brunet E, Meltzoff AN, Decety J (2006): Empathy examined through the neural mechanisms involved in imagining how I feel versus how you feel pain. Neuropsychologia 44:752–761. [DOI] [PubMed] [Google Scholar]
- Keysers C, Gazzola V (2009): Expanding the mirror: Vicarious activity for actions, emotions, and sensations. Curr Opin Neurobiol 19:666–671. [DOI] [PubMed] [Google Scholar]
- Knutson B, Fong GW, Adams CM, Varner JL, Hommer D (2001): Dissociation of reward anticipation and outcome with event‐related fMRI. Neuroreport 12:3683–3687. [DOI] [PubMed] [Google Scholar]
- Kringelbach ML (2005): The human orbitofrontal cortex: Linking reward to hedonic experience. Nat Rev Neurosci 6:691–702. [DOI] [PubMed] [Google Scholar]
- Kringelbach ML, Rolls ET (2004): The functional neuroanatomy of the human orbitofrontal cortex: Evidence from neuroimaging and neuropsychology. Prog Neurobiol 72:341–372. [DOI] [PubMed] [Google Scholar]
- Kubota JT, Banaji MR, Phelps EA(2012): The neuroscience of race. Nat Neurosci 15:940–948. [DOI] [PMC free article] [PubMed] [Google Scholar]
- Lamm C, Decety J, Singer T (2011): Meta‐analytic evidence for common and distinct neural networks associated with directly experienced pain and empathy for pain. NeuroImage 54:2492–2502. [DOI] [PubMed] [Google Scholar]
- Lloyd D, Di Pellegrino G, Roberts N (2004): Vicarious responses to pain in anterior cingulate cortex: Is empathy a multisensory issue? Cogn Affective Behav Neurosci 4:270–278. [DOI] [PubMed] [Google Scholar]
- Lockwood PL, Sebastian CL, McCrory EJ, Hyde ZH, Gu X, De Brito SA, Viding E (2013): Association of callous traits with reduced neural response to others' pain in children with conduct problems. Curr Biol 23:901–905. [DOI] [PMC free article] [PubMed] [Google Scholar]
- Marsh AA, Finger EC, Fowler KA, Adalio CJ, Jurkowitz IT, Schechter JC, Pine DS, Decety J, Blair R (2013): Empathic responsiveness in amygdala and anterior cingulate cortex in youths with psychopathic traits. J Child Psychol Psychiatry 54:900–910. [DOI] [PMC free article] [PubMed] [Google Scholar]
- Mathur VA, Harada T, Lipke T, Chiao JY (2010): Neural basis of extraordinary empathy and altruistic motivation. NeuroImage 51:1468–1475. [DOI] [PubMed] [Google Scholar]
- McClure SM, Laibson DI, Loewenstein G, Cohen JD (2004): Separate neural systems value immediate and delayed monetary rewards. Science 306:503–507. [DOI] [PubMed] [Google Scholar]
- Meffert H, Gazzola V, den Boer JA, Bartels AA, Keysers C (2013): Reduced spontaneous but relatively normal deliberate vicarious representations in psychopathy. Brain 136:2550–2562. [DOI] [PMC free article] [PubMed] [Google Scholar]
- Molenberghs P (2013): The neuroscience of in‐group bias. Neurosci Biobehav Rev 37:1530–1536. [DOI] [PubMed] [Google Scholar]
- Molenberghs P, Morrison S (2014): The role of the medial prefrontal cortex in social categorization. Social Cogn Affective Neurosci 9:292–296. [DOI] [PMC free article] [PubMed] [Google Scholar]
- Molenberghs P, Cunnington R, Mattingley JB (2012): Brain regions with mirror properties: A meta‐analysis of 125 human fMRI studies. Neurosci Biobehav Rev 36:341–349. [DOI] [PubMed] [Google Scholar]
- Molenberghs P, Halász V, Mattingley JB, Vanman E, Cunnington R (2013): Seeing is believing: Neural mechanisms of action perception are biased by team membership. Hum Brain Mapp 34:2055–2068. [DOI] [PMC free article] [PubMed] [Google Scholar]
- Moll J, Krueger F, Zahn R, Pardini M, de Oliveira‐Souza R, Grafman J (2006): Human fronto–mesolimbic networks guide decisions about charitable donation. Proc Natl Acad Sci USA 103:15623–15628. [DOI] [PMC free article] [PubMed] [Google Scholar]
- Morrison S, Decety J, Molenberghs P (2012): The neuroscience of group membership. Neuropsychologia 50:2114–2120. [DOI] [PubMed] [Google Scholar]
- Mummendey A, Otten S (1998): Positive–negative asymmetry in social discrimination. Eur Rev Social Psychol 9:107–143. [Google Scholar]
- Noonan M, Kolling N, Walton M, Rushworth M (2012): Re‐evaluating the role of the orbitofrontal cortex in reward and reinforcement. Eur J Neurosci 35:997–1010. [DOI] [PubMed] [Google Scholar]
- O'Doherty J, Kringelbach ML, Rolls ET, Hornak J, Andrews C (2001): Abstract reward and punishment representations in the human orbitofrontal cortex. Nat Neurosci 4:95–102. [DOI] [PubMed] [Google Scholar]
- Paulhus D, Hemphill J, Hare R (2012): Manual for the Self‐report Psychopathy Scale. Toronto: Multi‐health Systems. [Google Scholar]
- Reniers RL, Corcoran R, Drake R, Shryane NM, Völlm BA (2011): The QCAE: A questionnaire of cognitive and affective empathy. J Pers Assessment 93:84–95. [DOI] [PubMed] [Google Scholar]
- Shamay‐Tsoory SG (2011): The neural bases for empathy. Neuroscientist 17:18–24. [DOI] [PubMed] [Google Scholar]
- Shinada M, Yamagishi T, Ohmura Y (2004): False friends are worse than bitter enemies:“Altruistic” punishment of in‐group members. Evol Hum Behav 25:379–393. [Google Scholar]
- Singer T, Seymour B, O'Doherty J, Kaube H, Dolan RJ, Frith CD (2004): Empathy for pain involves the affective but not sensory components of pain. Science 303:1157–1162. [DOI] [PubMed] [Google Scholar]
- Telzer EH, Masten CL, Berkman ET, Lieberman MD, Fuligni AJ (2010): Gaining while giving: An fMRI study of the rewards of family assistance among White and Latino youth. Social Neurosci 5:508–518. [DOI] [PMC free article] [PubMed] [Google Scholar]
- Van Bavel JJ, Packer DJ, Cunningham WA (2008): The neural substrates of in‐group bias: A functional magnetic resonance imaging investigation. Psychol Sci 19:1131–1139. [DOI] [PubMed] [Google Scholar]
- Van Overwalle F (2009): Social cognition and the brain: A meta‐analysis. Hum Brain Mapp 30:829–858. [DOI] [PMC free article] [PubMed] [Google Scholar]
- Volz KG, Kessler T, von Cramon DY (2009): In‐group as part of the self: In‐group favoritism is mediated by medial prefrontal cortex activation. Social Neurosci 4:244–260. [DOI] [PubMed] [Google Scholar]
- Xu X, Zuo X, Wang X, Han S (2009): Do you feel my pain? racial group membership modulates empathic neural responses. J Neurosci 29:8525–8529. [DOI] [PMC free article] [PubMed] [Google Scholar]
- Yarkoni T (2009): Big correlations in little studies: Inflated fMRI correlations reflect low statistical power—Commentary on Vul et al.(2009). Perspect Psychol Sci 4:294–298. [DOI] [PubMed] [Google Scholar]
- Zaki J, Mitchell JP (2011): Equitable decision making is associated with neural markers of intrinsic value. Proc Natl Acad Sci USA 108:19761–19766. [DOI] [PMC free article] [PubMed] [Google Scholar]