

Abstract
With magnetic resonance spectroscopic imaging (MRSI), it is possible to simultaneously map distributions of several brain metabolites with relatively good spatial resolution in a short time. Although other functional imaging modalities have taken advantage of population‐based inferences using spatially extended statistics, this approach remains little utilized for MRSI. In this study, statistical nonparametric mapping (SnPM) was applied to two‐dimensional MRSI data from the medial walls of the human brain to assess the effect of normal aging on metabolite concentrations. The effects of different preprocessing steps on these results were then explored. Short echo time MRSI of left and right medial walls was acquired in conjunction with absolute quantification of total choline, total creatine (tCr), glutamate and glutamine, myo‐inositol, and N‐acetyl‐aspartate. Individual images were spatially warped to a common anatomical frame of reference. Age effects were assessed within SnPM as were the effects of voxel subsampling, variance smoothing, and spatial smoothing. The main findings were: (1) regions in the bilateral dorsal anterior cingulate and in the left posterior cingulate exhibited higher tCr concentrations with age; (2) voxel subsampling but not spatial smoothing enhanced the cluster‐level statistical sensitivity; and (3) variance smoothing was of little benefit in this study. Our study shows that spatially extended statistics can yield information about regional‐specific changes in metabolite concentrations obtained by short echo time MRSI. This opens up the possibility for systematic comparisons of metabolites in the medial wall of the brain. Hum Brain Mapp 36:852–861, 2015. © 2014 Wiley Periodicals, Inc.
Keywords: normal aging, cingulate cortex, magnetic resonance spectroscopic imaging, statistical nonparametric mapping, creatine
INTRODUCTION
Magnetic resonance spectroscopy (MRS) is a unique noninvasive imaging technique that provides complementary biochemical information about a wide range of brain functions [Soares and Law, 2009]. For a given region, it is possible to simultaneously quantify several metabolites in the proton spectrum, including choline (Cho), creatine (Cr), glutamate (Glu), glutamine (Gln), myo‐inositol (mI), and N‐acetyl‐aspartate (NAA). Most proton MRS studies have used single voxels to study a priori defined regions. However, with single voxels it is not possible to obtain information about metabolite distributions or to perform an anatomically unconstrained explorative analysis. With the development of magnetic resonance spectroscopic imaging (MRSI), these types of analyses become feasible. With MRSI, multivoxel data are acquired in two‐dimensional (2D) slices or in 3D volumes and metabolite distributions can be mapped and related directly to the brain anatomy. Furthermore, accelerated schemes, such as proton echo planar spectroscopic imaging (PEPSI), can be used to considerably reduce acquisition time [Tsai et al., 2008, 2012]. For population‐based regional‐specific inferences, most MRSI studies have used region‐of‐interest (ROI) analyses in which the ROIs were placed according to the individual anatomy [Gu et al., 2008; Maudsley et al., 2009; Schuff et al., 2001; Tedeschi et al., 1996; Tsai et al., 2012]. An alternative approach is to use a common anatomical frame of reference to which the individual images are spatially warped. This ensures particular voxels across individuals corresponds to the same part of the brain. This approach also allows for the application of more general population‐based spatially extended statistics, that is, statistical mapping, to test for regional‐specific metabolic effects [Maudsley et al., 2012, 2009; Stagg et al., 2013; Young et al., 2010].
Statistical mapping is a voxel‐based approach commonly used to analyze data from imaging modalities, such as positron emission tomography (PET) and functional magnetic resonance imaging (fMRI), generating large volumetric datasets. Inferences are typically made at either voxel level where signal amplitudes are assessed on a voxel‐by‐voxel level, or at cluster level where the spatial extent of clusters of voxels are assessed. The most prevalent approach is statistical parametric mapping (SPM) in which the general linear model is used to estimate parameters and Gaussian random field theory is used to resolve the multiple comparison problem. Population‐based inferences are made using random effects analysis. To ensure validity of this framework, spatial subsampling and spatial smoothing are applied to the data. However, it may not be desirable to smooth MRSI data due to the relatively large voxel dimensions in conjunction with partial volume effects and edge effects from lipid suppression which could introduce excessive artifacts. An alternative to SPM is statistical nonparametric mapping (SnPM) in which permutation tests are applied to independent data, for example, intersubject data [Holmes et al., 1996]. Although the nonparametric method has greater computational demands than the parametric method, only minimal weak assumptions are required for valid inference [Holmes et al., 1996]. Further advantages include validity of designs with low degrees of freedom, for example with small sample sizes, and the feasibility of using smoothed variances to potentially enhance the statistical power [Holmes et al., 1996]. Moreover, as subsampling is not required, this preprocessing step can be adjusted to yield better statistical sensitivity when correcting for multiple comparisons while preserving anatomical information.
The medial wall of the human cortex contains a large variety of regions known to subserve executive functions, emotion formation and regulation, and motor control, among others [Allman et al., 2001; Hansel and von Kanel, 2008; Rizzolatti et al., 1998]. It has been implicated in several pathological conditions including psychiatric disorders and chronic pain [Apkarian et al., 2005; Bennett, 2011]. Despite the importance of this part of the brain, little is known about the distribution of metabolites. In a previous study, we used PEPSI and individually positioned ROIs to assess the regional variations in spectral quality and metabolite concentrations in the medial wall [Tsai et al., 2012]. The spectral quality was found to be good and both spectral quality and concentrations were found to vary regionally and to depend on the specific metabolite analyzed. The overall aim of the present study was to apply preprocessing and statistical methods commonly used in functional neuroimaging to MRSI data from the medial walls of the human brain. We first sought to investigate if regional metabolite concentrations within the medial walls are age dependent. Subsequently, we evaluated the effects of voxel subsampling, variance smoothing, and spatial smoothing on these results. To these aims, accelerated MRSI was implemented using short echo time PEPSI. Individual metabolite maps were warped into a common template space to create mean maps and statistical inferences were made with SnPM.
METHODS
Participants
Twenty‐four healthy controls (16 females/8 males; mean age ± standard deviation [SD]: 30.9 ± 9.6 years; age range: 18–53 years) participated in this study. Depression and anxiety levels were assessed on the scan day for all participants by means of the Beck Depression Inventory and the Spielberger State‐Trait Anxiety Inventory. Before being included in the study, participants gave their informed consent to a protocol which was approved by the Institutional Review Board of Taipei Veterans General Hospital. Participants were instructed to lie in the scanner with their eyes closed and refrain from moving the head during the experiment.
Data Acquisition
MRI and MRSI experiments were carried out on a 3T MR system (Trio, SIEMENS Medical Solutions, Erlangen, Germany) with a 32‐channel head coil array. A high‐resolution 3D MPRAGE (Magnetization Prepared Rapid Acquisition Gradient Echo) anatomical scan (repetition time [TR]/echo time [TE]/flip angle [FA]: 2530 ms/3.03 ms/7 degrees; field of view [FOV]: 224 × 256 × 192; voxel size: 1 × 1 × 1 mm3) was initially acquired for localization of the left and right medial walls for subsequent positioning of MRSI scans. Accelerated MRSI was implemented using the PEPSI sequence which includes: (1) water suppression using chemical shift selective saturation, (2) application of eight‐slice outer‐volume suppression, (3) spin‐echo excitation, and (4) fast spatial‐spectral encoding of the half‐echo using an echo planar imaging readout gradient train along the x‐axis [Lin et al., 2007; Tsai et al., 2007, 2008]. Two 10‐mm thick sagittal PEPSI slices covering the medial walls in the left and right hemispheres were acquired separately with an in‐plane resolution of 8 × 8 mm2, using the following parameters: TR = 2 s, TE = 30 ms, 32 × 32 spatial matrix, FOV = 256 × 256 mm2, number of excitations per slice = 8. To reduce the partial volume effect from cerebrospinal fluid (CSF), the MRSI planes were placed slightly away from the central line. A non‐water suppressed (NWS) MRSI scan without presaturation of the water signal was acquired using a single average for automatic phase correction and calibration of metabolite concentrations. The eight slices of outer‐volume lipid suppression were applied along the perimeter of the brain to suppress the lipid signal. Routine shimming and adjustment for water suppression was carried out automatically by the MR system. The acquisition time for each water suppressed PEPSI scan was less than 9 min. Following each PEPSI scan, multislice sagittal T1‐weighted images were collected using a gradient echo sequence (TR/TE/FA: 250ms/2.61ms/70 degrees; FOV: 256 × 256; matrix: 256 × 256; slice thickness: 2 mm). Five T1 slices were collected for each hemisphere yielding 10‐mm thick volumes. To cover the same location as the PEPSI scans, these volumes were placed by automatically copying the spatial PEPSI parameters, including the center of the slice and the slice orientation. The T1 images were then used as anatomical references in the following analysis. A flow chart of the data analysis is provided in Figure 1.
Figure 1.
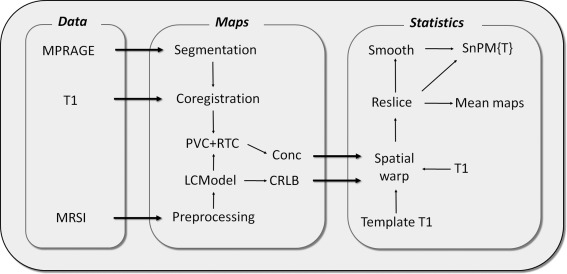
Data processing flow: five metabolite maps with corresponding CRLB maps (tCho, tCr, Glx, mI, and NAA) were generated for left and right hemisphere MRSI datasets. Concentration maps were corrected for partial volume (PVC) and relaxation time (RTC) effects. Corrections were made according to the tissue segmentation of the high‐resolution MPRAGE image. All maps were then spatially warped into a chosen single subject template T1 image and resliced into an overlapping 4 × 4 mm2 matrix. Mean maps were then generated and concentration maps entered into SnPM for statistical assessment. For further methodological evaluation, concentration maps were also variance and spatially smoothed prior to assessment in SnPM.
Post Processing
MRSI data from the different coils and measurements were processed separately. Standard post processing strategies for the PEPSI data included spatial and temporal filtering, phase correction, and even–odd echo editing [Lin et al., 2007; Tsai et al., 2007, 2008]. The reconstructed spectral width after even/odd echo editing was 1086 Hz with 512 complex points yielding a spectral resolution of 2.1 Hz. Automatic phase correction and frequency shift correction based on the water signal in the NWS scan were performed on a voxel‐by‐voxel basis. The phase correction was done before combining data from individual coils to reduce possible artifacts caused by partial phase cancellation and allowed phase‐coherent complex data combination. The eight measurements per slice were averaged separately to yield two sets of spectra, one for each hemisphere.
Spectra were quantified with the LCModel software package [Provencher, 2001] in the range from 0.5 to 4 ppm. Basis sets for spectral fitting included simulated spectra for 15 metabolites. Lipids (0.9 ppm, two resonances at 1.3 ppm, 2 ppm) and macromolecules (MMs; resonances at 0.9, 1.2, 1.4, 1.7, and 2.0 ppm) were also simulated using soft constraints for peak position and line width, and prior probabilities of the ratio of MMs and lipid peaks as implemented by LCModel. Metabolic signals were calibrated to the NWS data using the water scaling method [Gasparovic et al., 2006]. To obtain absolute concentrations, the quantified concentrations were adjusted for partial volume and tissue relaxation effects according to the voxel‐specific concentrations of MR visible water in gray matter (GM), white matter (WM), and CSF. The tissue fractions used for this correction was obtained by first segmenting the individual high‐resolution MPRAGE images (in “native” space) into tissue probability maps of GM, WM, and CSF using the New Segment toolbox in the Statistical Parametric Mapping 8 package (SPM8; Wellcome Trust Center for Neuroimaging, Institute of Neurology, University College London, London, UK). The coregistration toolbox in SPM8 was used to extract the transformation parameters between the T1 reference image and the MPRAGE image to match the location of the two PEPSI slices with their corresponding tissue probability maps. Chemical shift displacement for each metabolite was then calculated according to the bandwidth of the excitation RF pulse. Tissue probability maps were resampled and spatially filtered based on the PEPSI point spread function, chemical shift in slice direction, and excitation profile to match the effective resolution of the PEPSI scan. Finally, the tissue fraction obtained from these low resolution tissue probability maps were used to correct metabolite concentrations on a voxel‐by‐voxel basis using equations from previous reports [Gasparovic et al., 2006; Posse et al., 2007]. Concentrations of MR visible water used for the adjustment were 43.30 M for GM, 35.88 M for WM, and 55.55 M for CSF [Ernst et al., 1993]. The corrections for tissue relaxation effects were made according to the TE and TR. Furthermore, the T1 and T2 values were taken from the literature and varied across metabolites and tissue compartments according to the voxel‐specific tissue fraction (see Supporting Information Table 1) [Posse et al., 2007]. Voxels with a CSF tissue probability larger than 0.3 were removed. Partial volume and relaxation corrected concentration maps were generated for five metabolites, including total choline (tCho; including glycerophosphocholine and phosphocholine), total creatine (tCr; including creatine and phosphocreatine), Glu and Gln (Glx), mI, and NAA. As Glu can be difficult to distinguish from Gln, due to overlapping spectra, the combined concentration (Glx) was quantified.
In addition to the adjusted concentration maps, the distribution of the Cramer–Rao Lower Bound (CRLB), as provided by LCModel, was also mapped for each metabolite. The CRLB is the lowest bound of the SD of the estimated metabolite concentration and is expressed in concentration percentage. The CRLB is commonly used to quantify the goodness‐of‐fit in LCModel [Provencher, 2001]. It takes both resolution and noise level into account but may not account for systematic errors such as incorrect prior knowledge. Concentration values in voxels with unsatisfactory LCModel fits (CRLB > 30%) were replaced by the mean value of the four nearest voxels.
Statistical Nonparametric Mapping
The left hemisphere T1 image of a representative participant (female, 33 years of age) was chosen as the anatomical frame of reference to which individual T1 images from all participants and both hemispheres were warped into [Periaswamy and Farid, 2003]. The corrected metabolite images were first subsampled to the same resolution as the T1 images (1 × 1 mm2) before the individual warp parameters were applied. All images were then imported into SPM8 where they were resampled to the nominal in‐plane resolution and half the nominal in‐plane resolution yielding three datasets with 1 × 1 mm2, 4 × 4 mm2, 8 × 8 mm2 resolution. All images were resliced according to the resolution‐specific reference metabolite image. Mean concentration and mean CRLB maps for the 1 × 1 mm2 images were obtained using the ImCalc function and were overlaid on the study‐specific anatomical template in MRIcro (http://cnl.web.arizona.edu/mricro.htm). For display purpose, a cortical mask excluding cerebellar and brain stem regions was applied to concentration maps.
The resulting concentration images entered into SnPM (http://go.warwick.ac.uk/tenichols/snpm) running under SPM8 for further statistical analyses. Age effects were assessed by dividing the study population into two groups according to a median split in age. The two groups were then compared using a two‐sample t‐test, one test for each hemisphere. The relationship between age and metabolite concentrations was further assessed in each hemisphere by correlation using a simple regression model with one covariate of interest. To estimate the significance level, 20,000 permutations were calculated for each test. The same cortical mask as applied above was also applied at this step but with the additional exclusion of the ventricles. The mask included 7505 voxels, 469 voxels, and 118 voxel in the analyses for the three levels of spatial resolution. Initially, a voxel‐level threshold of 0.01 (T = 2.51), corrected for the five metabolites tested, was applied to the concentration maps. Clusters of voxels passing an extent threshold of 0.05 corrected for family‐wise errors (FWE) were then deemed significant. A threshold based on the spatial extent of clusters was chosen to avoid spurious noise, particularly along the edge of cortex, and because regional changes are assumed to be spread over multiple voxels. For further methodological evaluation, the analyses comparing the two age groups were repeated with variance smoothing and spatial smoothing using two sizes of filters corresponding to the original voxel size (8‐mm full width at half maximum [FWHM]) and twice the original voxel size (16‐mm FWHM).
Voxel‐Based Morphometry
An optimized voxel‐based morphometric analysis was performed to assess the possible influence of structural changes on regional metabolite concentrations. CSF, GM, and WM were analyzed separately according to the procedures described in Tu et al. [Tu et al., 2010]. Between‐group analyses and regression models were implemented in SPM8 to assess the age‐related tissue‐specific structural changes. As the regional tissue volumes vary as a function of the whole‐brain volume, the total volumes of CSF, GM, and WM were calculated separately and used as regressors of no interest in the tissue‐specific models. To compare the location of metabolite changes with the location of structural changes, the inverse spatial transform, obtained by warping our whole‐brain (MPRAGE) study template to the SPM anatomical template, was applied to the statistical maps resulting from the SPM analyses. These maps were then resliced according to the 5 2‐mm T1 slices covering the medial walls in each hemisphere. Since the left medial wall was used as template space for both the left and right MRSI results, the resliced statistical maps of the right medial wall were further warped into the T1 template images of the left hemisphere. An uncorrected voxel threshold of P < 0.05 was then used to examine the location of the structural changes.
RESULTS
According to the psychological assessment, all participants were without mood disturbance at the scan time as anxiety (trait [mean ± SD]: 45.1 ± 7.2; state: 41.0 ± 7.8) and depression (6.9 ± 6.6) scores were within the normal range. Due to excessive artifacts, two scans were discarded for the right hemisphere leaving 22 data points. The mean age (30.9 years) was used to divide the study population into an older and a younger group. For the left hemisphere, the two groups each consisted of 12 subjects (Older: mean age, 39.1 ± 6.8 years; younger: mean age, 23.7 ± 3.4 years) and for the right hemisphere, the older group consisted of 10 subjects (mean age, 40.0 ± 7.2 years) and the younger group consisted of 12 subjects (mean age, 23.7 ± 3.4 years). A significant age difference was found between the two groups for both hemispheres (P < 0.001).
The percentage of voxels removed from the metabolite images due to unsatisfactory CRLB were 8.6% ± 4.3 for tCho, 8.6 ± 4.5% for tCr, 25.2 ± 8% for Glx, 16.5% ± 5.5 for mI, and 11.7% ± 4.3% for NAA. When only considering voxels within the brain volume, the corresponding percentages were 0.8 ± 0.8%, 0.7 ± 1.7%, 21.3 ± 9.3%, 7.0 ± 3.2%, and 2.2 ± 1.9%, respectively. Mean metabolite and CRLB maps from the left and right hemispheres revealed similar distributions for the two hemispheres. For all metabolites, the smallest CRLBs were obtained along the cingulate cortex and the highest CRLBs were obtained along the edge of the cortex and in ventral/subcortical regions (Fig. 2). As expected, the smallest CRLBs were found for tCho, tCr, and NAA, and the largest CRLBs for Glx. However, along the cingulate cortex, all mean CRLB values were within an acceptable range (<25%). Concentration maps revealed a tCho distribution with highest concentration in the medial prefrontal cortex and high concentrations along the cingulate sulcus. High tCho concentrations were also found in the thalamus. The tCr and NAA concentration maps showed largest concentrations in the medial prefrontal, posterior parietal (precuneus), and occipital cortices. Glx and mI exhibited diffuse distributions throughout the medial walls (Fig. 2).
Figure 2.
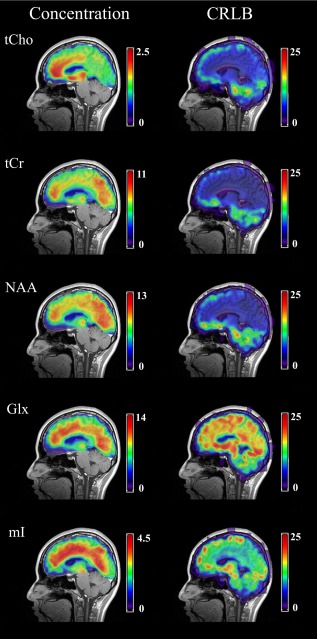
Interpolated mean concentration and mean CRLB maps for five metabolites in the left medial wall of the brain. Concentrations are given in mM and CRLBs in concentration percentage. Maps are shown on the chosen template T1 image to which all individual images were warped. Note: tCho, total choline; tCr, total creatine; NAA, N‐acetyl‐aspartate; Glx, combined glutamate and glutamine, mI, myo‐inositol. [Color figure can be viewed in the online issue, which is available at http://wileyonlinelibrary.com.]
SnPM was applied for population‐based inferences about the effect of normal aging on metabolite concentrations. Clusters of voxels passing a voxel threshold corrected for the number of metabolites tested, followed by a corrected extent threshold (P < 0.05), were deemed significant. Clusters with significantly larger tCr concentrations in older than younger subjects were found in the left and right dorsal anterior cingulate for all resolution levels (Table 1, Fig. 3A). Additionally, for images with the two highest resolutions, marginally significant clusters were also found at a slightly more anterior location in the right hemisphere as well as in the left posterior cingulate for tCr (Table 1, Fig. 3A). The analyses using subsampled images yielded substantially better cluster‐level statistical sensitivity than the analysis based on images of nominal resolution.
Table 1.
Loci showing significant age related changes in tCr concentrations
| Resolution [mm2] | x | y | z | Cluster extent | Cluster P | Voxel T |
|---|---|---|---|---|---|---|
| Older > younger | ||||||
| [1 × 1] | −6 | 44 | 28 | 274 | 0.010 | 4.23 |
| −6 | 1 | 39 | 124 | 0.063a | 3.80 | |
| 6 | 45 | 37 | 244 | 0.005 | 4.58 | |
| 6 | 58 | 30 | 111 | 0.056a | 3.71 | |
| [4 × 4] | −6 | 45 | 28 | 19 | 0.008 | 4.04 |
| −6 | 1 | 40 | 8 | 0.066a | 3.58 | |
| 6 | 45 | 36 | 13 | 0.014 | 4.39 | |
| 6 | 57 | 28 | 7 | 0.070a | 3.69 | |
| [8 × 8] | −6 | 44 | 33 | 4 | 0.019 | 3.28 |
| 6 | 60 | 33 | 3 | 0.034 | 3.15 | |
| Positive correlation with age | ||||||
| [1 × 1] | −6 | 45 | 29 | 484 | 0.004 | 4.72 |
| −6 | −1 | 30 | 287 | 0.013 | 3.67 | |
| 6 | 39 | 37 | 316 | 0.003 | 5.24 | |
| 6 | 59 | 30 | 138 | 0.034 | 4.31 | |
| [4 × 4] | −6 | 45 | 28 | 30 | 0.004 | 4.71 |
| −6 | −3 | 28 | 18 | 0.016 | 3.61 | |
| 6 | 37 | 36 | 28 | 0.001 | 5.19 | |
| [8 × 8] | −6 | 44 | 33 | 6 | 0.011 | 4.12 |
| 6 | 36 | 33 | 7 | 0.001 | 3.90 | |
A corrected voxel threshold of P < 0.01 (T = 2.51) was used followed by a cluster correction (P < 0.05). Note, resolution refers to the in‐plane voxel size in millimeters. Cluster P denotes P‐values corrected at the cluster level for FWE. Voxel T denotes peak T‐value at voxel level. “x” is in medial–lateral direction; “y” is in posterior–anterior direction; “z” is in ventral–dorsal direction. The origin is placed at the posterior commissure.
Note subsignificant but included for comparison.
Figure 3.
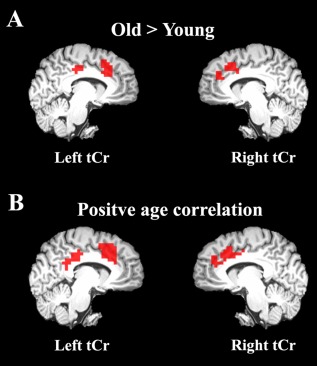
Regional effects of normal aging on tCr concentrations when (A) comparing older and younger subjects and (B) correlating with age. Aging effects were assessed in left and right medial walls, separately, by either a two‐sample t‐test or a simple regression model with one covariate of interest in statistical nonparametric mapping. Clusters of voxels passing a voxel threshold corrected for the number of metabolites tested (N = 5), followed by a corrected extent threshold (P < 0.05), were considered significant. Note, the posterior cluster in the left hemisphere and the anterior cluster in the right hemisphere did not pass this threshold in the between‐group analysis and are included for comparison only. Maps were generated using the 4 × 4 mm2 subsampled data and are shown on the high‐resolution MPRAGE template. [Color figure can be viewed in the online issue, which is available at http://wileyonlinelibrary.com.]
The correlation analysis also revealed a significant positive relationship between tCr concentrations and age in the same regions albeit with increased significance and cluster sizes (Table 1, Fig. 3B, see Supporting Information Figure 1 for scatter plots). In these analyses, the cluster in the posterior cingulate passed the extent threshold. As above, the subsampled images resulted in better cluster‐level statistical sensitivity. It is, however, noteworthy that the cluster in the right hemisphere was least significant for the images of highest resolution due to the cluster being split into two. All other metabolite concentrations did not exhibit a significant relationship with age in any of the hemispheres. Note that none of the voxels removed during preprocessing due to unsatisfactory CRLB values (CRLB > 30%) were located within any of the significant tCr clusters.
We further assessed the effect of variance smoothing by applying two filter sizes (nominal voxel size and twice the nominal voxel size) and pseudo t‐statistics to the tCr comparison of age groups at intermediate spatial resolution (Table 2). When applying an in‐plane Gaussian FWHM kernel of 8 × 8 mm2, reduced cluster sizes were found for the two clusters in the left hemisphere. Conversely, the smaller cluster did not reach significance. Conversely, a slightly improved cluster corrected P‐value was obtained for the larger cluster. In the right hemisphere, the two clusters (total cluster size = 20) merged into one cluster (cluster size = 16) with improved cluster P‐value. Applying a larger kernel (FWHM: 16 × 16 mm2) further reduced the cluster size in both hemispheres resulting in no significance for the left side and reduced significance in the right side. Overall, variance smoothing resulted in more focal clusters and removed spurious voxels.
Table 2.
Effects of variance and spatial smoothing on the results from the between‐group comparison of old and young subjects using an in‐plane resolution of 4 × 4 mm2
| Metabolite | x | y | z | Cluster extent | Cluster P | Voxel T |
|---|---|---|---|---|---|---|
| No variance or spatial smoothing | ||||||
| tCr | −6 | 45 | 28 | 19 | 0.008 | 4.04 |
| −6 | 1 | 40 | 8 | 0.066a | 3.58 | |
| 6 | 45 | 36 | 13 | 0.014 | 4.39 | |
| 6 | 57 | 28 | 7 | 0.07a | 3.69 | |
| Variance smoothing (0,8,8) | ||||||
| tCr | −6 | 45 | 36 | 14 | 0.007 | 3.17 |
| 6 | 45 | 40 | 16 | 0.005 | 3.38 | |
| Variance smoothing (0,16,16) | ||||||
| tCr | 6 | 37 | 44 | 9 | 0.029 | 3.25 |
| Spatial smoothing (0,8,8) | ||||||
| tCr | −6 | 45 | 32 | 19 | 0.028 | 3.57 |
| 6 | 41 | 36 | 38 | 0.004 | 4.39 | |
| Spatial smoothing (0,16,16) | ||||||
| tCr | 6 | 37 | 36 | 36 | 0.014 | 4.68 |
Note, T‐values using variance smoothing were obtained with pseudo t‐statistic. Smoothing kernels are provided in (x, y, z) coordinates and are in millimeters.
Note subsignificant but included for comparison.
See Table 1 for further details.
The effect of spatial smoothing on the tCr age comparison at intermediate spatial resolution was also assessed (Table 2). A filter size of nominal in‐plane resolution resulted in the same cluster size but lowered significance for the larger cluster in the left hemisphere. The smaller cluster was rendered subsignificant. A smoothing kernel twice the nominal resolution resulted in no significant clusters in the left hemisphere. In the right hemisphere, the smaller smoothing kernel resulted in the merging of the two adjacent clusters resulting in increased cluster‐level significance. Increasing the kernel to twice the nominal resolution did not further increase the cluster size in the right hemisphere. Further evaluation of the data using uncorrected voxel thresholds revealed that spurious voxels were not propagated by spatial smoothing (results not shown). Also, spurious voxels were mainly eliminated by the level of the voxel threshold used in this study (T = 2.51).
Finally, to examine the possible contribution of structural changes to the observed metabolic changes, an optimized voxel‐based morphometry analysis was conducted. A liberal uncorrected voxel threshold was used to test for regional overlaps. Small overlaps were found for left hemisphere GM tissue in the between‐group analysis (Supporting Information Figure 2) and for WM tissue in both the between‐group and the age‐correlation analyses (Supporting Information Figure 2 and Figure 3). These overlapping regions were, however, substantially smaller than the clusters exhibiting tCr changes.
DISCUSSION
In this study, absolute concentrations of tCho, tCr, Glx, mI, and NAA were mapped in the left and right medial walls of the brain by means of short TE accelerated MRSI. Each of the two slices was acquired eight times to increase the signal‐to‐noise ratio. Post processing methods commonly applied in conjunction with other functional neuroimaging modalities were implemented to create mean metabolite distributions across the study population. The effect of normal aging was statistically assessed by SnPM using a combination of voxel and cluster corrected thresholds. The effects of voxel subsampling, variance smoothing, and spatial smoothing were further evaluated. The main findings were: (1) concentration distributions could be divided into three topographical patterns; (2) regions in the bilateral dorsal anterior cingulate and in the left posterior cingulate exhibited higher tCr concentrations in the older than the younger group as well as a positive correlation between tCr and age; (3) voxel subsampling but not spatial smoothing enhanced the cluster‐level statistical sensitivity; and (4) variance smoothing was of little benefit in this study.
Metabolite Distributions
The mean metabolite maps exhibited regional variations in voxel concentrations which could be divided into three types of topographical patterns. High concentrations of tCho were predominantly found in the anterior portion of the medial wall and in thalamus, and high concentrations of tCr and NAA were predominantly found in the anterior and posterior portions of the medial wall. Glx and mI were more diffusely distributed along the cingulate cortex. The distributions of the three major metabolites in the proton spectrum, tCho, tCr, and NAA, are in accord with a previous PEPSI study using individually placed ROIs in the same regions [Tsai et al., 2012]. It is noteworthy that these metabolites were all robustly estimated in most of the medial wall. Although the diffuse topography of Glx may reflect the actual physiological distribution, interpretation should be made with care as concentration estimates were relatively poor, albeit within an acceptable range. Nonetheless, the magnitudes of our mean concentration estimates are in good agreement with previous SVS and MRSI studies (see Table 2 in [Posse et al., 2007]). Overall, the similar results found in Tsai et al. [Tsai et al., 2012], using individually placed ROIs, and this study, using a common anatomical reference, supports the use of warping procedures for 2D MRSI data.
Age‐Related Changes in Metabolites
In this study, we used SnPM to investigate the regional effect of normal aging on absolute metabolite concentrations in the medial wall of the brain. Using a combination of a voxel threshold corrected for the number of metabolites and a conservative FWE corrected cluster threshold, clusters in the left and right dorsal anterior cingulate and in the left posterior cingulate exhibited increased tCr concentrations with advancing age. Although conflicting reports exist with respect to age‐related changes in brain metabolites, several studies report an increase in absolute tCr concentrations with age, including both single voxel [Chang et al., 1996; Chiu et al., 2013; Gruber et al., 2008; Leary et al., 2000; Reyngoudt et al., 2012; Saunders et al., 1999] and MRSI studies [Charlton et al., 2007; McIntyre et al., 2007; Pfefferbaum et al., 1999; Schuff et al., 2001]. Changes mainly in tCho and NAA have also been reported in many of these studies. Our findings are in agreement with a recent study in which age‐related tCr increases were found in both the anterior and the posterior cingulate [Chiu et al., 2013]. Other studies found an increase in tCr concentrations in the posterior cingulate [Reyngoudt et al., 2012] or failed to find any change in the medial prefrontal cortex [Brooks et al., 2001]. Conflicting results may exist due to multiple factors, that is, differences in MRS parameters, population composition and size, brain regions selected, and tissue types examined. Since tissue concentrations may change with age, it is important to apply a voxel‐wise partial volume correction [Brooks et al., 2001]. Other studies have pointed out the importance of correcting for variations in T1 and T2 relaxation times [Chiu et al., 2013; Schuff et al., 2001]. For NAA in particular, the T2 relaxation time has been shown not only to be structure specific but also age dependent [Kirov et al., 2008; Tsai et al., 2007; Zaaraoui et al., 2007]. However, age‐related adjustments of the relaxation times were not performed in our study as these contribute relatively little compared to intrasubject and intersubject variability, especially at short TEs as in our study [Kirov et al., 2008]. It is noteworthy that the regional overlaps between structural and metabolic changes were small despite the use of a liberal uncorrected threshold for the structural data. Thus, these clusters neither passed a voxel‐wise correction nor a cluster‐extent correction. Furthermore, the locations of the overlapping regions were not consistent when comparing the between‐group analysis and the correlation analysis. Taken together, these results suggest that structural changes did not systematically account for the age‐related regional changes in tCr concentration. Finally, it should be noted that since the age span of our study population was relatively small, our age‐related findings should be considered tentative and interpreted with caution.
Spatial Subsampling
In this study, nonparametric statistics using permutation tests was chosen over the parametric alternative because it only requires a few weak assumptions such as exchangeability of experimental labels under the null hypothesis which is implied by the independence of subjects. Further on, SnPM provides valid results when other assumptions are dubious or when distributional results are not available [Holmes et al., 1996]. The SnPM approach also remains valid with low degrees of freedom, that is, when the number of subjects is low. SnPM offers other advantages including the possibility of applying variance smoothing and by not relying on spatial subsampling and spatial smoothing. Application of these preprocessing steps will be addressed in the following.
Within the framework of SPM, subsampling is usually applied prior to spatial smoothing to preserve the image resolution. With a small study population, subsampling further ensures the validity of using Gaussian random fields to adjust P‐values for multiple comparisons [Friston, 2004]. The use of subsampling is not required by SnPM because the multiple comparison problem is solved with permutation tests. Hence, subsampling should only be applied if it provides clear benefits. In our study, spatial subsampling of the metabolite maps yielded better statistical sensitivity and resulted in more regions passing the statistical criterion. Furthermore, the metabolite maps at the highest resolution preserve some of the anatomical information from the spatial warp as the resolution matches the corresponding T1 image from which the warp parameters were obtained. Taken together, spatial subsampling of the 2D metabolite maps provides clear benefits and should be applied in future studies.
Variance Smoothing
At low degrees of freedom the variance used for t‐statistic is estimated poorly resulting in a noisy statistic image [Holmes et al., 1996]. A better variance estimate can be obtained by variance smoothing, that is, variance pooling over neighboring voxels, which results in smoother statistical images [Holmes et al., 1996]. However, variance smoothing requires a pseudo t‐statistic and is thus only possible to apply with SnPM. Any suitable statistical test can be freely chosen with SnPM. In this study, the effect of variance smoothing was evaluated using the between‐group age comparison for tCr as an example. Variance smoothing with increasing kernels resulted in more focal clusters and in a reduction of spurious noise. However, using a statistical criterion relying on the cluster extent led to some clusters not obtaining significance. Thus, for larger study populations, as in this study, in which the variance is most likely sufficiently estimated and cluster corrected thresholds already exclude spurious voxels, variance smoothing may be of little benefit.
Spatial Smoothing
The effect of spatial smoothing was also assessed in this study. Spatial smoothing is a necessity when applying parametric statistics as it ensures validity of the tests and the use of Gaussian random fields. Spatial smoothing is also used to overcome anatomical variability by increasing the overlap in functional anatomy across subjects [Friston, 2004]. The advantage of SnPM over SPM is that spatial smoothing is not required as any suitable statistical test can be applied and the multiple comparison problem is solved with permutation tests. In this study, the effects of spatial smoothing were ambiguous when applying a filter of nominal resolution and worse with a filter size twice the nominal resolution. Considering the effect of spatial smoothing on spurious voxels and on artifacts along the edge of cortex, a spread or enhancement of these artifacts was not observed. However, these potentially problematic voxels were eliminated by our statistical criteria. Finally, it is noteworthy to mention that smoothing with a large kernel may reduce the anatomical sensitivity in data with a large voxel size such as in MRSI. Taken together, there were no clear benefits associated with spatial smoothing in this study. Nonetheless, spatial smoothing may be better applied together with the more powerful SPM framework in future MRSI studies using a smaller voxel size.
CONCLUSIONS
Absolute concentrations of tCho, tCr, Glx, mI, and NAA were mapped in the left and right medial walls of the brain by means of short TE accelerated MRSI. Mean metabolite distributions were obtained by spatial warping to a common anatomical reference and statistical mapping, using two types of tests, was implemented with SnPM. Advances in this and other recent studies further establish MRSI as a functional imaging modality in line with fMRI and PET, and opens up the possibility for systematic comparisons in longitudinal studies and with other imaging modalities. The short acquisition time and the standardized data processing make clinical studies feasible with the protocol applied in this study.
Supporting information
Supplementary Information Figure 1.
Supplementary Information Figure 2.
Supplementary Information Figure 3.
Supplementary Information Table 1.
ACKNOWLEDGMENTS
Data were acquired at National Yang‐Ming University. All authors declare no conflicts of interest.
REFERENCES
- Allman JM, Hakeem A, Erwin JM, Nimchinsky E, Hof P (2001): The anterior cingulate cortex. The evolution of an interface between emotion and cognition. Ann N Y Acad Sci 935:107–117. [PubMed] [Google Scholar]
- Apkarian AV, Bushnell MC, Treede RD, Zubieta JK (2005): Human brain mechanisms of pain perception and regulation in health and disease. Eur J Pain 9:463–484. [DOI] [PubMed] [Google Scholar]
- Bennett MR (2011): The prefrontal‐limbic network in depression: Modulation by hypothalamus, basal ganglia and midbrain. Prog Neurobiol 93:468–487. [DOI] [PubMed] [Google Scholar]
- Brooks JC, Roberts N, Kemp GJ, Gosney MA, Lye M, Whitehouse GH (2001): A proton magnetic resonance spectroscopy study of age‐related changes in frontal lobe metabolite concentrations. Cereb Cortex 11:598–605. [DOI] [PubMed] [Google Scholar]
- Chang L, Ernst T, Poland RE, Jenden DJ (1996): In vivo proton magnetic resonance spectroscopy of the normal aging human brain. Life Sci 58:2049–2056. [DOI] [PubMed] [Google Scholar]
- Charlton RA, McIntyre DJ, Howe FA, Morris RG, Markus HS (2007): The relationship between white matter brain metabolites and cognition in normal aging: The GENIE study. Brain Res 1164:108–116. [DOI] [PubMed] [Google Scholar]
- Chiu PW, Mak HK, Yau KK, Chan Q, Chang RC, Chu LW (2013): Metabolic changes in the anterior and posterior cingulate cortices of the normal aging brain: Proton magnetic resonance spectroscopy study at 3 T. Age (Dordr) 36:251–264. [DOI] [PMC free article] [PubMed] [Google Scholar]
- Ernst T, Kreis R, Ross BD (1993): Absolute quantitation of water and metabolites in the human brain. I. Compartments and water. J Magn Reson Ser B 102:1–8. [Google Scholar]
- Friston KJ (2004): Experimental design and statistical parametric mapping In: Frackowiak RSJ, Friston KJ, Frith CD, Dolan RJ, Price CJ, Zeki S, Ashburner JT, Penny WP, editors. Human Brain Function, 2nd ed, San Diego: Elsevier, pp 599–632. [Google Scholar]
- Gasparovic C, Song T, Devier D, Bockholt HJ, Caprihan A, Mullins PG, Posse S, Jung RE, Morrison LA (2006): Use of tissue water as a concentration reference for proton spectroscopic imaging. Magn Reson Med 55:1219–1226. [DOI] [PubMed] [Google Scholar]
- Gruber S, Pinker K, Riederer F, Chmelik M, Stadlbauer A, Bittsansky M, Mlynarik V, Frey R, Serles W, Bodamer O, Moser E (2008): Metabolic changes in the normal ageing brain: Consistent findings from short and long echo time proton spectroscopy. Eur J Radiol 68:320–327. [DOI] [PubMed] [Google Scholar]
- Gu M, Kim DH, Mayer D, Sullivan EV, Pfefferbaum A, Spielman DM (2008): Reproducibility study of whole‐brain 1H spectroscopic imaging with automated quantification. Magn Reson Med 60:542–547. [DOI] [PMC free article] [PubMed] [Google Scholar]
- Hansel A, von Kanel R (2008): The ventro‐medial prefrontal cortex: A major link between the autonomic nervous system, regulation of emotion, and stress reactivity? Biopsychosoc Med 2:21. [DOI] [PMC free article] [PubMed] [Google Scholar]
- Holmes AP, Blair RC, Watson JD, Ford I (1996): Nonparametric analysis of statistic images from functional mapping experiments. J Cereb Blood Flow Metab 16:7–22. [DOI] [PubMed] [Google Scholar]
- Kirov II, Fleysher L, Fleysher R, Patil V, Liu S, Gonen O (2008): Age dependence of regional proton metabolites T2 relaxation times in the human brain at 3 T. Magn Reson Med 60:790–795. [DOI] [PMC free article] [PubMed] [Google Scholar]
- Leary SM, Brex PA, MacManus DG, Parker GJ, Barker GJ, Miller DH, Thompson AJ (2000): A (1)H magnetic resonance spectroscopy study of aging in parietal white matter: Implications for trials in multiple sclerosis. Magn Reson Imaging 18:455–459. [DOI] [PubMed] [Google Scholar]
- Lin FH, Tsai SY, Otazo R, Caprihan A, Wald LL, Belliveau JW, Posse S (2007): Sensitivity‐encoded (SENSE) proton echo‐planar spectroscopic imaging (PEPSI) in the human brain. Magn Reson Med 57:249–257. [DOI] [PubMed] [Google Scholar]
- Maudsley AA, Domenig C, Govind V, Darkazanli A, Studholme C, Arheart K, Bloomer C (2009): Mapping of brain metabolite distributions by volumetric proton MR spectroscopic imaging (MRSI). Magn Reson Med 61:548–559. [DOI] [PMC free article] [PubMed] [Google Scholar]
- Maudsley AA, Govind V, Arheart KL (2012): Associations of age, gender and body mass with 1H MR‐observed brain metabolites and tissue distributions. NMR Biomed 25:580–593. [DOI] [PMC free article] [PubMed] [Google Scholar]
- McIntyre DJ, Charlton RA, Markus HS, Howe FA (2007): Long and short echo time proton magnetic resonance spectroscopic imaging of the healthy aging brain. J Magn Reson Imaging 26:1596–1606. [DOI] [PubMed] [Google Scholar]
- Periaswamy S, Farid H (2003): Elastic registration in the presence of intensity variations. IEEE Trans Med Imaging 22:865–874. [DOI] [PubMed] [Google Scholar]
- Pfefferbaum A, Adalsteinsson E, Spielman D, Sullivan EV, Lim KO (1999): In vivo spectroscopic quantification of the N‐acetyl moiety, creatine, and choline from large volumes of brain gray and white matter: Effects of normal aging. Magn Reson Med 41:276–284. [DOI] [PubMed] [Google Scholar]
- Posse S, Otazo R, Caprihan A, Bustillo J, Chen H, Henry PG, Marjanska M, Gasparovic C, Zuo C, Magnotta V, Mueller B, Mullins P, Renshaw P, Ugurbil K, Lim KO, Alger JR (2007): Proton echo‐planar spectroscopic imaging of J‐coupled resonances in human brain at 3 and 4 Tesla. Magn Reson Med 58:236–244. [DOI] [PubMed] [Google Scholar]
- Provencher SW (2001): Automatic quantitation of localized in vivo 1H spectra with LCModel. NMR Biomed 14:260–264. [DOI] [PubMed] [Google Scholar]
- Reyngoudt H, Claeys T, Vlerick L, Verleden S, Acou M, Deblaere K, De Deene Y, Audenaert K, Goethals I, Achten E (2012): Age‐related differences in metabolites in the posterior cingulate cortex and hippocampus of normal ageing brain: A 1H‐MRS study. Eur J Radiol 81:e223–e231. [DOI] [PubMed] [Google Scholar]
- Rizzolatti G, Luppino G, Matelli M (1998): The organization of the cortical motor system: New concepts. Electroencephalogr Clin Neurophysiol 106:283–296. [DOI] [PubMed] [Google Scholar]
- Saunders DE, Howe FA, van den Boogaart A, Griffiths JR, Brown MM (1999): Aging of the adult human brain: In vivo quantitation of metabolite content with proton magnetic resonance spectroscopy. J Magn Reson Imaging 9:711–716. [DOI] [PubMed] [Google Scholar]
- Schuff N, Ezekiel F, Gamst AC, Amend DL, Capizzano AA, Maudsley AA, Weiner MW (2001): Region and tissue differences of metabolites in normally aged brain using multislice 1H magnetic resonance spectroscopic imaging. Magn Reson Med 45:899–907. [DOI] [PMC free article] [PubMed] [Google Scholar]
- Soares DP, Law M (2009): Magnetic resonance spectroscopy of the brain: Review of metabolites and clinical applications. Clin Radiol 64:12–21. [DOI] [PubMed] [Google Scholar]
- Stagg CJ, Knight S, Talbot K, Jenkinson M, Maudsley AA, Turner MR (2013): Whole‐brain magnetic resonance spectroscopic imaging measures are related to disability in ALS. Neurology 80:610–615. [DOI] [PMC free article] [PubMed] [Google Scholar]
- Tedeschi G, Bertolino A, Campbell G, Barnett AS, Duyn JH, Jacob PK, Moonen CT, Alger JR, Di Chiro G (1996): Reproducibility of proton MR spectroscopic imaging findings. AJNR Am J Neuroradiol 17:1871–1879. [PMC free article] [PubMed] [Google Scholar]
- Tsai SY, Posse S, Lin YR, Ko CW, Otazo R, Chung HW, Lin FH (2007): Fast mapping of the T2 relaxation time of cerebral metabolites using proton echo‐planar spectroscopic imaging (PEPSI). Magn Reson Med 57:859–865. [DOI] [PubMed] [Google Scholar]
- Tsai SY, Otazo R, Posse S, Lin YR, Chung HW, Wald LL, Wiggins GC, Lin FH (2008): Accelerated proton echo planar spectroscopic imaging (PEPSI) using GRAPPA with a 32‐channel phased‐array coil. Magn Reson Med 59:989–998. [DOI] [PubMed] [Google Scholar]
- Tsai SY, Lin YR, Wang WC, Niddam DM (2012): Short‐ and long‐term quantitation reproducibility of brain metabolites in the medial wall using proton echo planar spectroscopic imaging. Neuroimage 63:1020–1029. [DOI] [PubMed] [Google Scholar]
- Tu CH, Niddam DM, Chao HT, Chen LF, Chen YS, Wu YT, Yeh TC, Lirng JF, Hsieh JC (2010): Brain morphological changes associated with cyclic menstrual pain. Pain 150:462–468. [DOI] [PubMed] [Google Scholar]
- Young K, Govind V, Sharma K, Studholme C, Maudsley AA, Schuff N (2010): Multivariate statistical mapping of spectroscopic imaging data. Magn Reson Med 63:20–24. [DOI] [PMC free article] [PubMed] [Google Scholar]
- Zaaraoui W, Fleysher L, Fleysher R, Liu S, Soher BJ, Gonen O (2007): Human brain‐structure resolved T(2) relaxation times of proton metabolites at 3 Tesla. Magn Reson Med 57:983–989. [DOI] [PubMed] [Google Scholar]
Associated Data
This section collects any data citations, data availability statements, or supplementary materials included in this article.
Supplementary Materials
Supplementary Information Figure 1.
Supplementary Information Figure 2.
Supplementary Information Figure 3.
Supplementary Information Table 1.