

Abstract
The study of rapid changes in brain dynamics and functional connectivity (FC) is of increasing interest in neuroimaging. Brain states departing from normal waking consciousness are expected to be accompanied by alterations in the aforementioned dynamics. In particular, the psychedelic experience produced by psilocybin (a substance found in “magic mushrooms”) is characterized by unconstrained cognition and profound alterations in the perception of time, space and selfhood. Considering the spontaneous and subjective manifestation of these effects, we hypothesize that neural correlates of the psychedelic experience can be found in the dynamics and variability of spontaneous brain activity fluctuations and connectivity, measurable with functional Magnetic Resonance Imaging (fMRI). Fifteen healthy subjects were scanned before, during and after intravenous infusion of psilocybin and an inert placebo. Blood‐Oxygen Level Dependent (BOLD) temporal variability was assessed computing the variance and total spectral power, resulting in increased signal variability bilaterally in the hippocampi and anterior cingulate cortex. Changes in BOLD signal spectral behavior (including spectral scaling exponents) affected exclusively higher brain systems such as the default mode, executive control, and dorsal attention networks. A novel framework enabled us to track different connectivity states explored by the brain during rest. This approach revealed a wider repertoire of connectivity states post‐psilocybin than during control conditions. Together, the present results provide a comprehensive account of the effects of psilocybin on dynamical behavior in the human brain at a macroscopic level and may have implications for our understanding of the unconstrained, hyper‐associative quality of consciousness in the psychedelic state. Hum Brain Mapp 35:5442–5456, 2014. © 2014 Wiley Periodicals, Inc.
Keywords: Psilocybin, fMRI, functional connectivity, resting state, psychedelic state
INTRODUCTION
Psilocybin (phophoryl‐4‐hydroxy‐dimethyltryptamine) is the phosphorylated ester of the main psychoactive compound found in magic mushrooms. Pharmacologically related to the prototypical psychedelic LSD, psilocybin has a long history of ceremonial use via mushroom ingestion and, in modern times, psychedelics have been assessed as tools to enhance the psychotherapeutic process [Grob et al., 2011; Krebs et al., 2012; Moreno et al., 2006]. The subjective effects of psychedelics include (but are not limited to) unconstrained, hyperassociative cognition, distorted sensory perception (including synesthesia and visions of dynamic geometric patterns) and alterations in one's sense of self, time and space. There is recent preliminary evidence that psychedelics may be effective in the treatment of anxiety related to dying [Grob et al., 2011] and obsessive compulsive disorder [Moreno et al., 2006] and there are neurobiological reasons to consider their potential as antidepressants [Carhart‐Harris et al., 2012, 2013]. Similar to ketamine (another novel candidate antidepressant) psychedelics may also mimic certain psychotic states such as the altered quality of consciousness that is sometimes seen in the onset‐phase of a first psychotic episode [Carhart‐Harris et al., 2014]. There is also evidence to consider similarities between the psychology and neurobiology of the psychedelic state and Rapid Eye Movement (REM) sleep [Carhart‐Harris, 2007; Carhart‐Harris and Nutt, 2014], the sleep stage associated with vivid dreaming [Aserinsky and Kleitman, 1953].
The potential therapeutic use of psychedelics, as well as their capacity to modulate the quality of conscious experience in a relatively unique and profound manner, emphasizes the importance of studying these drugs and how they act on the brain to produce their novel effects. One potentially powerful way to approach this problem is to exploit human neuroimaging to measure changes in brain activity during the induction of the psychedelic state. The neural correlates of the psychedelic experience induced by psilocybin have been recently assessed using Arterial Spin Labeling (ASL) and BOLD fMRI [Carhart‐Harris et al., 2012]. This work found that psilocybin results in a reduction of both CBF and BOLD signal in major subcortical and cortical hub structures such as the thalamus, posterior cingulate (PCC) and medial prefrontal cortex (mPFC) and in decreased resting state functional connectivity (RSFC) between the normally highly coupled mPFC and PCC. Furthermore, our most recent study used magnetoencephalography (MEG) to more directly measure altered neural activity post‐psilocybin and here we found decreased oscillatory power in the same cortical hub structures [Muthukumaraswamy et al., 2013, see also Carhart‐Harris et al., 2014 for a review on this work).
These results establish that psilocybin markedly affects BOLD, CBF, RSFC, and oscillatory electrophysiological measures in strategically important brain structures, presumably involved in information integration and routing [Carhart‐Harris et al., 2014; de Pasquale et al., 2012; Hagmann et al., 2008; Leech et al., 2012]. However, the effects of psilocybin on the variance of brain activity parameters across time has been relatively understudied and this line of enquiry may be particularly informative in terms of shedding new light on the mechanisms by which psychedelics elicit their characteristic psychological effects. Thus, the main objective of this article is to examine how psilocybin modulates the dynamics and temporal variability of resting state BOLD activity. Once regarded as physiological noise, a large body of research has now established that resting state fluctuations in brain activity have enormous neurophysiological and functional relevance [Fox and Raichle, 2007]. Spontaneous fluctuations self‐organize into internally coherent spatiotemporal patterns of activity that reflect neural systems engaged during distinct cognitive states (termed “intrinsic” or “resting state networks”—RSNs) [Fox and Raichle, 2005; Raichle, 2011; Smith et al., 2009]. It has been suggested that the variety of spontaneous activity patterns that the brain enters during task‐free conditions reflects the naturally itinerant and variegated quality of normal consciousness [Raichle, 2011]. However, spatio‐temporal patterns of resting state activity are globally well preserved in states such as sleep [Boly et al., 2008, 2012; Brodbeck et al., 2012; Larson‐Prior et al., 2009; Tagliazucchi et al., 2013, 2013, 2013] in which there is a reduced level of awareness—although very specific changes in connectivity occur across NREM sleep, allowing the decoding of the sleep stage from fMRI data [Tagliazucchi et al., 2012c; Tagliazucchi and Laufs, 2014]. Thus, if the subjective quality of consciousness is markedly different in deep sleep relative to the normal wakeful state (for example) yet FC measures remain largely preserved, this would suggest that these measures provide limited information about the biological mechanisms underlying different conscious states. Similarly, intra‐RSN FC is decreased under psilocybin [Carhart‐Harris et al., 2013] yet subjective reports of unconstrained or even “expanded” consciousness are common among users (see Carhart‐Harris et al. [2014] for a discussion). Thus, the present analyses are motivated by the view that more sensitive and specific indices are required to develop our understanding of the neurobiology of conscious states, and that measures which factor in variance over time may be particularly informative.
A key feature of spontaneous brain activity is its dynamical nature. In analogy to other self‐organized systems in nature, the brain has been described as a system residing in (or at least near to) a critical point or transition zone between states of order and disorder [Chialvo, 2010; Haimovici et al., 2013; Tagliazucchi and Chialvo, 2011; Tagliazucchi et al., 2012a]. In this critical zone, it is hypothesized that the brain can explore a maximal repertoire of its possible dynamical states, a feature which could confer obvious evolutionary advantages in terms of cognitive and behavioral flexibility. It has even been proposed that this cognitive flexibility and range may be a key property of adult human consciousness itself [Tononi, 2012]. An interesting research question therefore is whether changes in spontaneous brain activity produced by psilocybin are consistent with a displacement from this critical point—perhaps towards a more entropic or super‐critical state (i.e. one closer to the extreme of disorder than normal waking consciousness) [Carhart‐Harris et al., 2014]. Further motivating this hypothesis are subjective reports of hyper‐associative cognition under psychedelics, indicative of unconstrained brain dynamics. Thus, in order to test this hypothesis, it makes conceptual sense to focus on variability in activity and FC parameters over time, instead of the default procedure of averaging these over a prolonged period. In what follows, we present empirical data that tests the hypothesis that brain activity becomes less ordered in the psychedelic state and that the repertoire of possible states is enhanced. After the relevant findings have been presented, we engage in a discussion to suggest possible strategies that may further characterize quantitatively where the “psychedelic brain” resides in state space relative to the dynamical position occupied by normal waking consciousness.
MATERIALS AND METHODS
Study Overview and Design
This was a within‐subjects placebo‐controlled study. The study was approved by a local NHS Research Ethics Committee and University of Bristol Research and Development department, and conducted in accordance with Good Clinical Practice guidelines. A Home Office License was obtained for storage and handling of a Schedule 1 drug and the University of Bristol sponsored the research.
Participants
This is a new analysis on previously published data [Carhart‐Harris et al., 2012, 2013]. Fifteen healthy subjects took part: 13 males and 2 females (mean age = 32, SD = 8.9). Recruitment was via word of mouth. All subjects were required to give informed consent and undergo health screens prior to enrollment. Study inclusion criteria were: at least 21 years of age, no personal or immediate family history of a major psychiatric disorder, substance dependence, cardiovascular disease, and no history of a significant adverse response to a hallucinogenic drug. All of the subjects had used psilocybin at least once before (mean number of uses per subject = 16.4, SD = 27.2) but not within 6 weeks of the study.
Anatomical Scans
Image acquisition was performed on a 3T GE HDx system. Anatomical scans were performed before each functional scan and thus during sobriety. These were three‐dimensional fast spoiled gradient echo scans in an axial orientation, with field of view = 256 × 256 × 192 and matrix = 256 × 256 × 192 to yield 1 mm isotropic voxel resolution (repetition time/echo time [TR/TE] = 7.9/3.0 ms; inversion time = 450 ms; flip angle = 20°).
Drug Infusion
All subjects underwent two 12 min eyes closed resting state BOLD fMRI scans on two separate occasions at least 7 days apart: placebo (10 ml saline, 60 s intravenous injection) was given on one occasion and psilocybin (2 mg dissolved in 10 ml saline, 60 s infusion) on the other. Seven of the subjects received psilocybin in scan 1, and 8 received it in scan 2. Injections were given manually by a doctor within the scanning suite. The 60 s infusions began exactly 6 min after the start of the 12 min scans. The subjective effects of psilocybin were felt almost immediately after injection and were sustained for the remainder of the RS scan. For more details on the subjective effects of intravenous psilocybin see [Carhart‐Harris et al., 2012, 2013].
fMRI Data Acquisition and Preprocessing
BOLD‐weighted fMRI data were acquired using a gradient echo planar imaging sequence, TR/TE 3,000/35 ms, field‐of‐view = 192 mm, 64 × 64 acquisition matrix, parallel acceleration factor = 2, 90° flip angle. Fifty‐three oblique axial slices were acquired in an interleaved fashion, each 3 mm thick with zero slice gap (3 × 3 × 3 mm voxels). A total of 240 volumes were acquired, with infusion taking place in the middle of the session. Data were motion corrected using FSL MCFLIRT and a high‐pass filter of 100 s was applied. Data were smoothed using a Gaussian kernel of 5 mm FWHM. Motion time courses were regressed from the data during the preprocessing step, together with average CSF and white matter time courses. As an additional control to exclude epochs of large movement amplitude, all volumes associated with a mean head displacement larger than 1 SD were erased from the analysis.
Analysis of Spatiotemporal Dynamics
The methods here employed are based on a statistical physics framework useful for characterizing fluctuations in systems composed of large number of coupled degrees of freedom. From this perspective, fluctuating activity in a particular region and correlations between different regions are interdependent or related [Ross, 1996]. Therefore, any change in the cortical dynamics due to a given intervention is expected to be reflected both at the level of the variance of the activity at one region and in the strength of the interactions between different regions. In what follows, the methodology accounting for these two aspects (i.e. the temporal variability and the dynamical changes in correlations) are explained in detail. All the numerical analyses for these calculations were performed using in‐house MATLAB scripts.
Analysis of Temporal Variability
The analysis referred to here as “temporal variability” is concerned with the variance in the amplitude of the BOLD signal and it can be expressed both in a temporal (i.e., the standard variance) and frequency domain, as will be explained below. As a time domain measure of variability in the amplitude of the BOLD signal, straightforward voxel‐wise computation of BOLD variance was performed, resulting in whole‐brain BOLD variance maps for each condition (psilocybin/placebo before and after infusion) and participant. An additional evaluation of variance can be performed in the frequency domain, noting that by Parseval's theorem:
| (1) |
Then, the following series of equalities holds (for a signal with zero mean):
| (2) |
In Eqs. (1) and (2), A(f) represents the Fourier transform of x(t) and Φ(f) is the power spectral density. Therefore, the variance can also be obtained by integrating Φ(f) across the whole range of frequencies.
Further Spectral Analysis of BOLD Fluctuations
Equations (1) and (2) show that the integral of the power spectral density equals the variance of the signal. If this integral is not performed across all frequencies but in a certain range, the result will correspond to the contribution of the frequencies to the variance in the specified ranges. It is generally considered that slow (0.01–0.1 Hz) BOLD frequencies carry neural significance in the resting state fMRI signal [Cordes et al., 2001], therefore, we evaluated separately the low frequency power (LFP) in this range and compared it before and after the psilocybin infusion.
Given the fact that the spectral content of spontaneous BOLD fluctuations, like many other complex systems in nature, follows a power law of the form [Expert et al., 2011], its power spectrum density can also be characterized by a single parameter (α). This parameter condenses the scaling behavior and is demonstrative of the long‐range temporal correlations (or memory) of any given signal. Thus, for uncorrelated noise, α = 0 (i.e. a flat spectrum, or so called “white noise”) is obtained, whereas for signals presenting some degree of long‐term correlations, values of α > 0 (i.e., the so called “colored noise”) are observed. To obtain the scaling exponent α, the first derivative of BOLD time series was first computed (in order to minimize the influence of nonstationarities) and the fit was performed on the spectrum of the derivative. Note that for a power spectrum of the form , differentiation decreases the value of by 2, so the exponent of the original time series can be recovered from that of the derivative.
Point‐Process Analysis
A recent series of studies demonstrated that the continuous BOLD signal can be transformed into a discrete point‐process encoding the timings of the most functionally relevant events [Petridou et al., 2012, Davis et al., 2013; Tagliazucchi et al., 2010, 2010, 2012a]. In this approach, relevant events are defined by a threshold crossing (e.g. whenever the signal departs +1 SD from its mean value). Besides allowing a dramatic compression of the information present in a BOLD timeseries, this approach has the particular benefit of allowing a simple criterion to eliminate motion artifacts: i.e. “points” (threshold crossings) occurring during high movement epochs (i.e. larger than a certain value) are simply ignored in the analysis.
Two interdependent observables are defined once the point‐process is obtained: the rate (number of crossings divided by the series length) and inter‐event intervals (average temporal separation between two consecutive points). On average, there is a clear inverse relationship between these two variables. Furthermore, the rate is expected to increase (or the interval to decrease) for a signal with a high contribution of fast frequencies.
As an efficient alternative to the spectral analysis described in the previous section, we computed the voxel‐wise distribution of rates and intervals and compared it between the different conditions.
Computation of Dynamical Functional Connectivity States and its Associated Entropy
As already discussed above, for spatio‐temporal fluctuations arising from the dynamics of large scale systems, the relation between the temporal fluctuations of the average signal and its spatial correlation function is well defined [Ross, 1966]. It is known that under general assumptions, the mean field peak‐to‐peak amplitude of a signal (or its variance) is directly proportional to its mean correlation value. Intuitively, this is analogous to the principle that synchronized/desynchronized clapping produces stronger/weaker collective effects. Therefore, to complement the investigation of regional changes in the variance of the BOLD signal in various regions of the cortex, it is logical to also look at measures of the mean functional correlations between participating regions. Given the highly transient nature of these correlations, we term these indices “dynamical functional connectivity states”. They are computed as follows (see Fig. 4 for an illustration of the general procedure).
Figure 4.
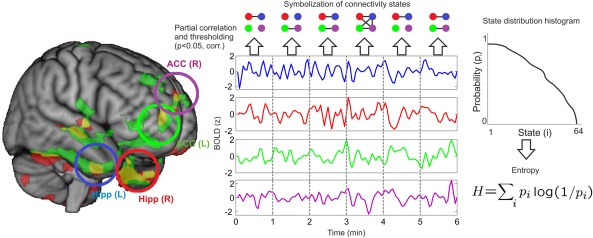
Entropy of the dynamical functional connectivity states. Illustration of the procedure to estimate the temporal evolution of the collective states (i.e. all possible 64 motifs) in the network of regions associated with increased temporal variability (bilateral hippocampi and ACC). After selecting the four regions of interest demonstrating enhanced variability after psilocybin infusion (left and right hippocampus, left and right ACC), the partial correlation between all variables is computed (including also the mean head displacement time series as a partial regressor). After thresholding (with P < 0.05, corrected) a series of up to 64 discrete connectivity states are obtained from which the probability distribution can be computed. Finally, from this information, histograms of states (provided here as an illustration) and their corresponding Shannon's entropy (H) can be computed. [Color figure can be viewed in the online issue, which is available at http://wileyonlinelibrary.com.]
The BOLD time series is first divided into M non‐overlapping windows of length L. Then, the partial correlation values between a set of N brain regions of interest is computed inside each temporal window as follows,
| (3) |
where R(X,Y]Z) is defined as follows,
| (4) |
In Eq. (3), the minimum is taken across all signals Z different from X,Y. In Eq. (4), R(X, Y) represents the linear correlation between variables X and Y. Thus, the partial correlation RC(X,Y) measures the correlation of both variables removing the effect of a set of controlling variables. In what follows, the set of variables will include all BOLD signals from the N brain regions under study plus the time series of absolute head displacement (to remove spurious correlations), as estimated during the motion correction step. Finally, for each pair of regions a link is established between them if the correlation P value is significant at the level of P < 0.05, Bonferroni corrected (N (N − 1)/2). Performing this computation for all temporal windows gives the temporal evolution of the connectivity graph.
For N brain regions, the total number of dynamical functional connectivity graphs (i.e. all possible connectivity motifs) equals 2(N(N − 1)/2). For example, for N = 3, 4, 5, the number of states is 8, 64, 1,024. Once the dynamical functional connectivity states are obtained by the procedure above described, a symbolization procedure can be used to map the limited amount of states into discrete symbols (a bijection or one‐to‐one mapping of each temporal sequence of states into “words”—whose letters represent the different connectivity graphs). Then, the entropy of this sequence can be computed using the straightforward definition of Shannon's entropy:
| (5) |
where pi is the probability of the ith state occurring in the sequence. We evaluate the entropy of dynamical functional connectivity states in the network of regions of peak statistical significance presented in Table 1 and Figure 1 (i.e., the left and right hippocampus and ACC). This choice is motivated by the well‐known observation that, for a system of coupled elements, the temporal variability of the activity time series is driven by variability in the collective interactions [Ross, 1966]. This process resulted in four regions and a total of 64 connectivity states (i.e. the number of possible dynamical interaction motifs between the four nodes).
Table 1.
Regions corresponding to local maxima of statistical significance (provided they are more than 8 mm apart) for increased cortical BOLD variance and total spectral power after psilocybin infusion (compared to before psilocybin infusion)
| MNI coordinates | AAL region | Hemisphere | t‐value |
|---|---|---|---|
| BOLD variance (after psilocybin > before psilocybin) | |||
| (−34, −22, −16) | Hippocampus | Left | 4.51 |
| (26, −22, −16) | Hippocampus | Right | 3.54 |
| (−2, 22, 28) | Anterior cingulate | Left | 3.72 |
| (4, 34, 18) | Anterior cingulate | Right | 3.74 |
| BOLD total spectral power (after psilocybin > before psilocybin) | |||
| (32, −14, −13) | Hippocampus | Right | 4.03 |
| (−26, −18, −15) | Hippocampus | Left | 4.39 |
| (−26, 1, 38) | Parahippocampal Gyrus | Left | 4.77 |
| (37, −2, −38) | Parahippocampal gyrus | Right | 4.55 |
| (7, 27, 17) | Anterior cingulate | Right | 4.02 |
| (−7, 43, −2) | Anterior cingulate | Left | 4.12 |
Montreal Neurological Institute (MNI) coordinates and Automatic Anatomical Labeling (AAL) regions are provided.
Figure 1.
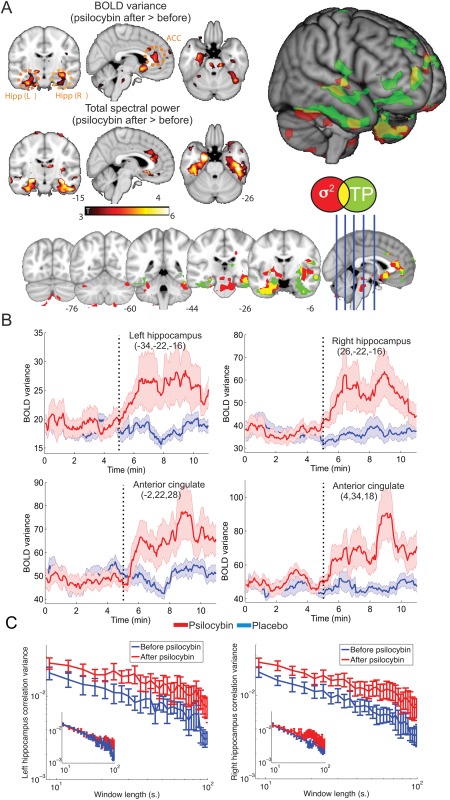
Psilocybin infusion modifies the temporal variability of BOLD signal in a network comprising anterior cingulate cortex (ACC) and bilateral hippocampus. A) Maps of statistical significance for variance (σ 2) and total spectral power (TP) increases after psilocybin infusion. Results are shown overlaid separately into an anatomical MNI152 template, overlaid together and also rendered together into a three‐dimensional anatomical image. In all cases only clusters surviving a threshold of P < 0.05, Family Wise Error (FWE) cluster corrected (after passing an uncorrected threshold of P < 0.005) are shown. B) BOLD Variance time courses (obtained over a 1 min. sliding window) into the four regions of peak statistical significance defined in Table 1 for the psilocybin and the placebo infusion. C) Variance of the time course of intra‐hippocampal correlations (computed over a range of non‐overlapping window lengths) before and after psilocybin infusion. Results for placebo infusion are shown as insets (before and after in blue and red, respectively). [Color figure can be viewed in the online issue, which is available at http://wileyonlinelibrary.com.]
Statistical Testing
To perform statistical significance testing, a paired t‐test was used, as implemented in SPM8. Only clusters passing a threshold of P < 0.05 Family Wise Error (FWE) corrected for multiple comparisons were considered significant. For display purposes, significance maps were thresholded at P < 0.005, showing only clusters passing the above mentioned criterion. Significance testing for the entropy differences reported in Figure 5 was also evaluated using a paired t‐test.
Figure 5.
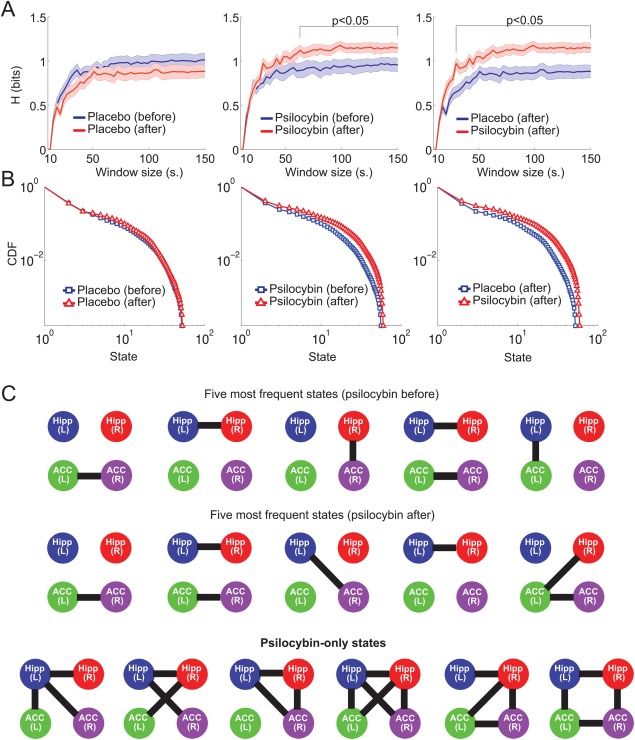
Dynamical functional connectivity entropy increased after psilocybin infusion. A) Entropy of connectivity states (H, defined following the procedure outlined in Figure 4 and computed at different time window lengths) are plotted for the comparisons placebo before versus after, psilocybin before versus after and psilocybin after versus placebo after (mean SEM). B) The probability distributions for the (ranked) dynamical functional connectivity states across all conditions. Histograms were obtained pooling states across subjects and window sizes. C) First row: five most frequent connectivity states before the infusion of psilocybin. Second row: five most frequent states after the infusion of psilocybin. Third row: states observed only after the infusion of psilocybin, but absent before the infusion and in the placebo condition. In all cases the lines are used to indicate a significant transient functional connectivity between two nodes. [Color figure can be viewed in the online issue, which is available at http://wileyonlinelibrary.com.]
RESULTS
The statistical significance maps for the BOLD signal variance and total spectral power can be found in Figure 1A and the significance peaks are summarized in Table 1 (in this and the following sections, unless explicitly stated no differences were found by examining the opposite contrasts). Both measures show increased variability following psilocybin administration—both in the temporal and spectral domain—with peaks in the anterior cingulate cortex and bilateral hippocampus (total spectral power is also increased in the bilateral parahippocampal gyri). As shown in Figure 1 there is a large overlap in the regions affected by both measures, as can be expected from Eq. (2). The differences found for the power spectral estimation in the parahippocampal gyrus are not apparent for the variance. Most likely this discrepancy is due to the numerical evaluation of these two equivalent quantities.
To find the temporal evolution of the variance increases, we selected the four significance peaks for BOLD variance as ROIs (Table 1) and used a sliding window analysis (1 min. window length) to compute the evolution of the variance. Since these ROI are selected as regions of high variance, it is already known that fluctuations in their activity will have an increased variance relative to baseline. However, this analysis provides additional information about when those increases occurred (e.g. just after the psilocybin infusion or later). In Figure 1B the results of this analysis are presented. A homogeneous increase in signal variance is oberved during the first 3 min postpsilocybin infusion, with a tendency to plateau or slightly decrease afterwards. A longer experiment would be needed to confirm the persistence of this effect, but it does seem to correspond well with the known pharmaco‐dynamics of intravenous psilocybin, i.e. subjects reported the most intense subjective effects within the first 3 min of the infusion and the effects were persistent for the duration of the scan [Carhart‐Harris et al., 2012, 2013].
We also studied the variance of intra‐hippocampal connectivity time courses, computed as the linear correlation of all hippocampal voxels over nonoverlapping windows of different lengths. Results are shown in Figure 1C. It can be seen that the variance is higher in both hippocampi after the psilocybin infusion.
Next, we studied the spectral content of spontaneous BOLD fluctuations. This was done by computing the low frequency (0.01–0.1 Hz) power (LFP) and the power spectrum scaling exponent (α). Statistical significance maps are presented in Figure 2A and statistical significance peaks in Table 2.
Figure 2.
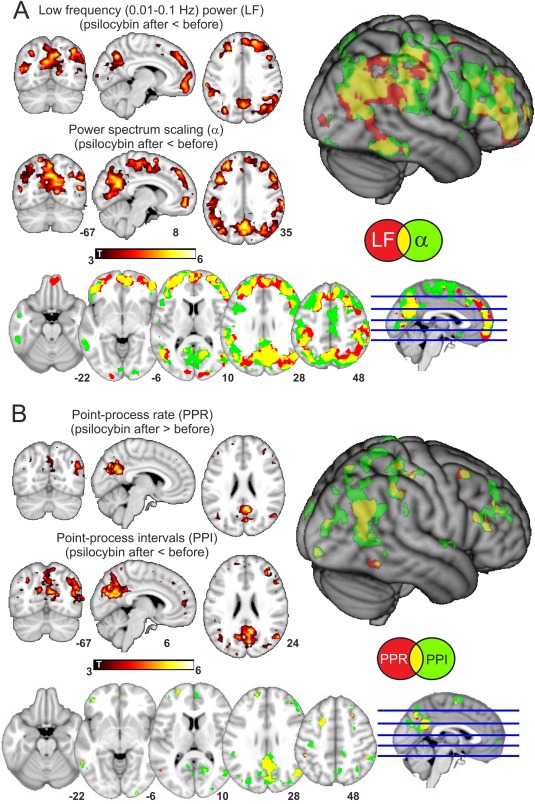
Psilocybin infusion modifies BOLD spectral content in a distributed fronto‐parietal network. A) Maps of statistical significance for decreased low frequency power (LFP) and power spectrum scaling exponent α after psilocybin infusion. Results are shown overlaid separately into an anatomical MNI152 template, overlaid together and also rendered together into a three‐dimensional anatomical image. Notice that in all cases only clusters surviving a threshold of P < 0.05, FWE cluster corrected (after passing an uncorrected threshold of P < 0.005) are shown. B) Maps of statistical significance of increased power point rate (PPR) and decreased point process interval (PPI) after psilocybin infusion (same renderings and statistical thresholds as in A). [Color figure can be viewed in the online issue, which is available at http://wileyonlinelibrary.com.]
Table 2.
Regions corresponding to local maxima of statistical significance (provided they are more than 8 mm apart) for decreased cortical BOLD low frequency power and power spectrum scaling exponent after psilocybin infusion (compared to before psilocybin infusion)
| MNI coordinates | AAL region | Hemisphere | t‐value |
|---|---|---|---|
| BOLD low frequency power (after psilocybin < before psilocybin) | |||
| (11, −60, 40) | Precuneus | Right | 4.92 |
| (38, −67, 44) | Angular gyrus | Right | 4.60 |
| (−34, −69, 44) | Angular gyrus | Left | 5.05 |
| (−39, −42, 42) | Inferior parietal cortex | Left | 4.66 |
| (−39, 45, −3) | Middle frontal gyrus | Left | 5.10 |
| (47, 44, −3) | Inferior frontal gyrus | Right | 5.08 |
| (5, 56, −9) | Middle frontal gyrus (orbital) | Right | 4.28 |
| BOLD power spectrum scaling exponent α (after psilocybin < before psilocybin) | |||
| (4, −59, 33) | Precuneus | Right | 4.86 |
| (53, −61, 33) | Angular gyrus | Right | 4.31 |
| (−48, −55, 34) | Angular gyrus | Left | 4.20 |
| (−40, −34, 60) | Postcentral gyrus | Left | 4.80 |
| (6, −22, 60) | Paracentral lobule | Right | 4.79 |
| (50, −30, 60) | Superior parietal cortex | Right | 5.73 |
| (−41, 14, 33) | Middle frontal gyrus | Left | 4.32 |
| (52, 7,28) | Precentral gyrus | Right | 5.12 |
| (38, 41, 28) | Middle frontal gyrus | Right | 6.22 |
| (−27, 43, 28) | Middle frontal gyrus | Left | 5.10 |
| (10, 55, −6) | Middle frontal gyrus (orbital) | Right | 4.48 |
After psilocybin infusion, diffuse widespread decreases in LFP and the scaling exponent α were observed in frontal and parietal regions. Changes in LFP and the scaling exponent (α) were found consistently in the same spatial locations, which is expected since a scaling closer to that of uncorrelated noise (i.e. an α value closer to 0) will result in weaker low frequency spectral power. These effects were confined to the postpsilocybin period. No differences were found when performing the same comparison in the placebo condition.
To further characterize BOLD fluctuations, we transformed whole brain signals into a spatio‐temporal point‐process and extracted two statistics: the rate (average number of events) and the interval (average separation between two events). By the very definition of the point‐process, a signal with high power in fast frequencies will give a high rate and therefore a low separation between events i.e., the average interval will be small. Results shown in Figure 2B confirm this observation. Statistical significance peaks are presented in Table 3. A rate increase and interval decrease after psilocybin was observed in parietal and frontal regions largely overlapping with those of Figure 2A. No differences were found when performing the same comparison in the placebo condition.
Table 3.
Regions corresponding to local maxima of statistical significance (provided they are more than 8 mm apart) for increased cortical point‐process rate (PPR) and decreased point‐process interval (PPI) after psilocybin infusion (compared to before psilocybin infusion)
| MNI coordinates | AAL region | Hemisphere | t‐value |
|---|---|---|---|
| Point‐process rate (after psilocybin > before psilocybin) | |||
| (5, −52, 25) | Precuneus | Right | 4.47 |
| (47, −66, 29) | Angular gyrus | Right | 3.99 |
| (−41, −66, 24) | Angular gyrus | Left | 2.84 |
| (−41, 47, −5) | Middle frontal gyrus (orbital) | Left | 2.82 |
| (−41, 41, 24) | Middle frontal gyrus | Left | 2.97 |
| (35, 40, 24) | Middle frontal gyrus | Right | 3.14 |
| Point‐process interval (after psilocybin < before psilocybin) | |||
| (5, −57, 25) | Precuneus | Right | 4.06 |
| (50, −58, 36) | Angular gyrus | Right | 3.98 |
| (−34, −66, 36) | Angular gyrus | Left | 3.00 |
| (−37, −32, 62) | Postcentral gyrus | Left | 3.35 |
| (41, −39, 62) | Paracentral lobule | Right | 3.18 |
| (−26, −9, 60) | Postcentral gyrus | Left | 3.59 |
| (28, 17, 54) | Middle frontal gyrus | Right | 3.72 |
| (−20, 15, 54) | Superior frontal gyrus | Left | 2.87 |
| (−22, 59, 12) | Superior frontal gyrus | Left | 3.54 |
| (4, 54, 6) | Anterior cingulated | Right | 3.29 |
To identify the brain networks associated with the changes shown in Figure 2A,B, we computed the overlap of the statistical significance maps with a set of well‐established Resting State Networks (RSNs) [Beckmann and Smith, 2004; Beckmann et al., 2005]. These included: two visual (medial and lateral), an auditory, sensori‐motor, default mode, executive control and two lateralized dorsal attention networks.
To compute the overlap for a given map, we counted the number of voxels included in each RSN and normalized by the total number of voxels in the RSN mask. Using this approach, larger maps present a higher chance of having large overlaps, therefore, we constructed a null‐hypothesis by randomizing the phases of the maps (after transforming to Fourier space), resulting in images with the same second order statistics [see also Tagliazucchi et al., 2013c]. A total of 100 randomizations were performed for each comparison and an empirical p‐value was constructed, counting the ratio of instances in which the real overlap exceeded the overlap computed with the randomized map. The results of these analyses are presented in Figure 3. For LFP and α, significant overlaps were detected in the default mode, control and attention networks, whereas all sensory networks remained unaffected. For the point‐process rate (PPR) and point‐process interval (PPI) the changes were locally confined to the default mode network.
Figure 3.
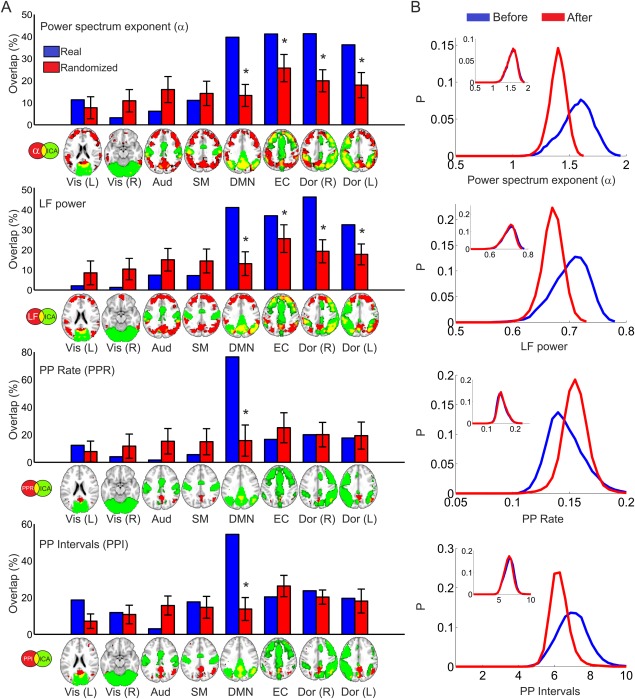
BOLD spectral changes after psilocybin infusion are located in higher order brain networks and leave primary sensory areas unaffected. A) Overlap between statistical significance maps presented in Figure 2 and a group of well‐established cortical RSN (from Beckmann et al. [2005]) together with the average overlap obtained after 100 spatial randomizations preserving first order statistics (image phase shuffling). (*) indicates an empirical P value smaller than 0.05, Bonferroni corrected. This P value is defined as the ratio of instances in which the real maps yield a higher overlap than the randomized versions. B) Whole brain grey matter average probability distributions for α, LFP, PPR, and PPI, before and after psilocybin infusion. In the inset, the same distributions are shown before and after the placebo infusion. [Color figure can be viewed in the online issue, which is available at http://wileyonlinelibrary.com.]
Next, the dynamic functional connectivity states were obtained from the set of regions showing increased temporal variability (Fig. 1 and Table 1) by applying the analysis outlined in Figure 4. Using different window lengths (ranging from 15 to 150 s.) we evaluated the entropy of the distribution of connectivity states in the network comprised by two ACC ROIs and the bilateral hippocampi. An entropy increase was found when comparing the results between the periods before and after the psilocybin infusion and after the psilocybin infusion vs. after the placebo infusion, but no changes were observed when comparing before and after placebo (see Fig. 5A). The entropy increase was not seen for very short window lengths but was manifest for all lengths larger than approximately 1 min.
The most frequent states in each condition are shown in Figure 5B. These have sparse connectivity and represent functional connections between homologous ROIs and between ROIs in the same hemisphere, but cross‐hemisphere connections between hippocampal and ACC ROIs also appear in the psilocybin condition. The psilocybin state is also characterized by a larger repertoire of states: i.e. novel motifs that are exclusive to the psychedelic state and which are shown in the last row of Figure 5B. These motifs are among the most interconnected states possible.
DISCUSSION
The novel analyses described in this article provide a considerable amount of new information about how psilocybin affects brain activity. In summary, increased variance in the BOLD signal was observed in the bilateral hippocampi and ACC and the temporal dynamics of these increases corresponded well with the rapid pharmacodynamics of intravenous psilocybin [Carhart‐Harris et al., 2012, 2013]. Decreased low frequency power and frequency scaling exponent (indicative of a less correlated signal) were observed in higher‐level association regions accompanied by an increase in the point process rate at the default mode network. Perhaps the most novel and intriguing aspect of the present analyses was our assessment of dynamical functional connectivity within a simple hippocampal/ACC network. Specifically, a greater diversity of connectivity motifs was observed after psilocybin, reflecting increased entropy in this system's dynamical behavior. Overall these quantities demonstrate an increase in the dynamical repertoire (i.e., new states) in the brain under psilocybin as well as an increase in the rate at which the repertoire is examined.
We first interpret the changes described in the results section from a purely dynamical point of view. The results presented in Figure 1 represent a larger variance in the “mean field activity” of the hippocampus and ACC. This change in variance is the expression of an increased amplitude of the BOLD signal fluctuations in these regions. From a statistical physics point of view, increased signal amplitude implies increased synchronization and so increased correlated activity in the source structures. This is also reflected in the analysis of the repertoire of connectivity states in a hippocampal‐ACC network (discussed in Figs. 4 and 5). These two results together reveal an increased variability in the collective repertoire (i.e. a larger number of motifs) of metastable states [Tognoli and Kelso, 2014] within the psychedelic state.
The increased amplitude fluctuations in the hippocampus are particularly intriguing given early depth electroencephalography (EEG) work that recorded similar abnormalities in hippocampal activity after LSD and mescaline [Monroe and Heath, 1961; Schwarz et al., 1956]. Similar increases in oscillation amplitude have also been observed in the hippocampus using depth EEG recordings in patients showing nondrug‐induced psychotic symptoms [Heath, 1954; Sem‐Jacobsen et al., 1956] and bursts of high amplitude activity have been seen in human rapid‐eye movement (REM) sleep [Cantero et al., 2003]. Moreover, other imaging modalities have implicated increased hippocampal activity in psychosis [e.g., Friston et al., 1992] and REM sleep [Braun et al., 1997; Miyauchi et al., 2009]. Given that phenomenological similarities have previously been noted between the psychedelic, psychotic and dream states [Carhart‐Harris, 2007; Carhart‐Harris and Nutt, 2014], it is intriguing to consider whether altered hippocampal activity may be an important common property of these states.
It has long been claimed that the psychedelic (translated “mind‐revealing” [Huxley et al., 1977]) state is an expanded state of consciousness in which latent psychological material can emerge into consciousness [Cohen, 1967] and novel associations can form. Indeed, this was the original rationale for the use of LSD in psychotherapy [Busch and Johnson, 1950]. It has also been claimed that psychedelics may be able to assist the creative process, for example, by promoting divergent thinking and remote association [Fadiman, 2011]. Thus, the increased repertoire of metastable states observed here with psilocybin may be a mechanism by which these phenomena occur [see also Carhart‐Harris et al., 2014].
It was also interesting that under psilocybin, more interhemispheric dynamical correlations were detected in the hippocampal/ACC network (Fig. 5C). Recent electrophysiological work in mice has shown that layer five pyramidal neurons (the primary cellular units implicated in the action of psychedelic drugs [Muthukumaraswamy et al., 2013]) that are sensitive to serotonin 2A receptor mediated excitation (the primary pharmacological process implicated in the action of psychedelics [Muthukumaraswamy et al., 2013]) are disproportionately those pyramidal neurons that project interhemispherically [Avesar and Gulledge, 2012]. Thus, altered interhemispheric communication may be an important component of the mechanism of action of psychedelics.
Concerning the low frequency fluctuations results, these were consistent with our earlier work with MEG in which we observed decreased oscillatory power in neural fields in high‐level cortical regions in the 1 to 100 Hz frequency range [Muthukumaraswamy et al., 2013]. In the present analysis, decreased low frequency power in the 0.01 to 0.1 Hz range was found and again, these effects were localized to consistent high‐level cortical regions. Low frequency fluctuations in BOLD are known to correlate with neuronal parameters such as fluctuating gamma power and infraslow fluctuations in local field potentials [Pan et al., 2013]. The slower beta band also shows positive correlations with fMRI fluctuations in key DMN regions [Laufs et al., 2003], whereas both alpha and beta apparently inhibit large‐scale cortical BOLD coherence [Tagliazucchi et al., 2012b]. Thus, it seems that a primary action of psilocybin, and likely other psychedelics [Riba et al., 2002], is to cause a generalized desynchrony and loss of oscillatory power in higher level cortical regions—likely via serotonin 2A receptor mediated excitation of deep‐layer pyramidal neurons in these regions [Muthukumaraswamy et al., 2013]. However, the high amplitude activity detected in the hippocampi and ACC (Fig. 1) suggests that this desynchronizing effect does not generalize to these deeper structures.
The frequency domain result was further examined by a separate analysis of the point‐process rate and interval distributions (see Fig. 3). The RSNs which exhibited the most significant changes correspond to higher brain systems such as the DMN, executive control and attention networks and not primary sensory and motor networks. This outcome is consistent with the regional distribution of serotonin 2A receptors [Erritzoe et al., 2009], the receptors implicated in psilocybin's psychedelic action [Vollenweider et al., 1998]. These receptors are concentrated in higher level cortical regions (e.g. the highest distribution in humans is in the PCC [Carhart‐Harris et al., 2013; Erritzoe et al., 2009] and are relatively less prevalent in the sensori‐motor cortex. That the default mode network has consistently been implicated in the action of psilocybin is also intriguing given its association with self‐reflection [Gusnard et al., 2001] and selfhood more generally [Carhart‐Harris and Friston, 2010]. It is likely to be relevant therefore that one of the most commonly reported features of an intense psychedelic experience is a compromised sense of selfhood typically described as “ego dissolution” or “ego disintegration” [Carhart‐Harris et al., 2014; Klee, 1963; Savage, 1955].
A potential limitation of our study arises from the possibility that psilocybin modifies the coupling between neuronal sources and hemodynamic activity as measured with fMRI (i.e. the hemodynamic response function). However, we note that there exists no evidence for this so far and, on the other hand, there exists ample direct electrophysiological evidence showing that psilocybin modifies brain activity in a way compatible with our findings [Muthukumaraswamy et al., 2013].
Another limitation stems from the limited number of regions included in the definition of dynamical states. This limited number is required to perform an exhaustive counting of all possible states, however, differences in the motifs between conditions (Fig. 5) could arise by direct influence of regions outside the scope of the analysis, which are directly wired to a pair of nodes. Future work should address this limitation and attempt to track those regions to obtain a more complete picture of how dynamical states differ after and before psilocybin infusion.
Finally, it is important to offer some cautionary notes on the analyses documented in this article. Mapping relatively transient dynamical motifs based on resting state fMRI data is a new and exploratory technique. Thus, further work is required to clarify its functional meaning. More specifically, given the Zipf‐like behavior of the state distribution probability (Fig. 5B), states that appear rarely (i.e. at the tail of a power law distribution) cannot be trivially tested using the usual statistical significance, i.e. they do not fit easily into the standard frequentist framework of t‐test statistics, in contrast to well established functional connectivity analyses that represent an average over prolonged periods of time. Thus, further mathematical testing and empirical work is required before we can begin to make confident predictions about the functional relevance of outcomes derived from their application.
ACKNOWLEDGMENTS
The original experiments were performed as part of a broader Beckley‐Imperial psychedelic research programme. Authors thank Christian Beckmann for sharing the RSN masks reported in Beckmann et al. [2005].
REFERENCES
- Aserinsky E, Kleitman N (1953): Regularly occurring periods of eye motility, and concomitant phenomena, during sleep. Science 118:273–274. [DOI] [PubMed] [Google Scholar]
- Avesar D, Gulledge AT (2012): Selective serotonergic excitation of callosal projection neurons. Front Neural Circuits 6:2. [DOI] [PMC free article] [PubMed] [Google Scholar]
- Beckmann CF, Smith SM (2004): Probabilistic independent component analysis for functional magnetic resonance imaging. IEEE Trans Med Imaging 23:137–152. [DOI] [PubMed] [Google Scholar]
- Beckmann CF, DeLuca M, Devlin JT, Smith SM (2005): Investigations into resting‐state connectivity using independent component analysis. Phil Trans R Soc B 360:1001–1013. [DOI] [PMC free article] [PubMed] [Google Scholar]
- Braun AR, Balkin TJ, Wesenten NJ, Carson RE, Varga M, Bald‐Win P, Selbie Belenky G, Herscovitch P (1997): Regional cerebral blood flow throughout the sleep‐wake cycle. An H2(15)O PET study. Brain 120:1173–1197. [DOI] [PubMed] [Google Scholar]
- Brodbeck V, Kuhn A, von Wegner F, Morzelewski A, Tagliazucchi E, Borisov S, Michel C, Laufs H (2012): EEG microstates of wakefulness and NREM sleep. Neuroimage 62:2129–2139. [DOI] [PubMed] [Google Scholar]
- Boly M, Phillips C, Tshibanda L, Vanhaudenhuyse A, Schabus M, Dang‐VuTT, Moonen G, Hustinx R, Maquet P, Laureys S (2008): Intrinsic brain activity in altered states of consciousness. Ann NY Acad Sci 1129:119–129. [DOI] [PMC free article] [PubMed] [Google Scholar]
- Boly M, Perlbarg V, Marrelec G, Schabus M, Laureys S, Doyon J, Pelegrini‐Issac M, Maquet P, Benali H (2012): Hierarchical clustering of brain activity during human non‐rapid eye movement sleep. Proc Natl Acad Sci USA 109:5856–5861. [DOI] [PMC free article] [PubMed] [Google Scholar]
- Busch AK, Johnson WC (1950): L.S.D. 25 as an aid in psychotherapy; preliminary report of a new drug. Dis Nervous Syst 11:241–243. [PubMed] [Google Scholar]
- Cantero JL, Atienza M, Stickgold R, Kahana MJ, Madsen JR, Kocsis B (2003): Sleep dependent theta oscillations in the human hippocampus and neocortex. J Neurosci 23:10897–10903. [DOI] [PMC free article] [PubMed] [Google Scholar]
- Carhart‐Harris R (2007): Waves of the unconscious: The neurophysiology of dreamlike phenomena and its implications for the psychodynamic model of the mind. Neuro‐Psychoanalysis 9:83–211. [Google Scholar]
- Carhart‐Harris RL, Friston KJ (2010): The default‐mode, ego‐functions and free‐energy: A neurobiological account of Freudian ideas. Brain 133:1265–1283. [DOI] [PMC free article] [PubMed] [Google Scholar]
- Carhart‐Harris RL, Erritzoe D, Williams T, Stone JM, Reed LJ, Colasanti A, Tyacke RJ, Leech R, Malizia AL, Murphy K, Hobden P, Evans J, Feilding A, Wise RG, Nutt DJ (2012): Neural correlates of the psychedelic state as determined by fMRI studies with psilocybin. Proc Natl Acad Sci USA 109:2138–2143. [DOI] [PMC free article] [PubMed] [Google Scholar]
- Carhart‐Harris RL, Leech R, Erritzoe D, Williams TM, Stone JM, Evans J, Sharp DJ, Feilding A, Wise RG, Nutt DJ (2013): Functional connectivity measures after psilocybin inform a novel hypothesis of early psychosis. Schizophrenia Bull 39:1343–1351. [DOI] [PMC free article] [PubMed] [Google Scholar]
- Carhart‐Harris RL, Leech R, Hellyer PJ, Shanahan M, Feilding A, Tagliazucchi E, Chialvo DR, Nutt D (2014):The entropic brain: A theory of conscious states informed by neuroimaging research with psychedelic drugs. Front Hum Neurosci 8:20. [DOI] [PMC free article] [PubMed] [Google Scholar]
- Carhart‐Harris RL, Nutt DJ (2014): Was it a vision or a waking dream? Front Psychol 5:255. [DOI] [PMC free article] [PubMed] [Google Scholar]
- Chialvo DR (2010): Emergent complex neural dynamics. Nat Phys 6:744–750. [Google Scholar]
- Cohen S (1967): The Beyond Within: The LSD Story. New York: Atheneum. [Google Scholar]
- Cordes D, Haughton VM, Arfanakis K, Carew JD, Turski PA, Moritz CH, Quigley MA, Meyerand ME (2001): Frequencies contributing to functional connectivity in the cerebral cortex in “resting‐sate” data. Am J Neuroradiol 22:1326–1333. [PMC free article] [PubMed] [Google Scholar]
- Davis B, Jovicich J, Iacovella V, Hasson U (2013): Functional and developmental significance of amplitude variance asymmetry in the BOLD resting‐state signal. Cereb Cortex 24:1332–1350. [DOI] [PubMed] [Google Scholar]
- de Pasquale F, Della Penna S, Snyder AZ, Marzetti L, Pizzella V, Romani GL, Corbetta M (2012): A cortical core for dynamic integration of functional networks in the resting human brain. Neuron 74:753–764. [DOI] [PMC free article] [PubMed] [Google Scholar]
- Erritzoe D, Frokjaer VG, Haugbol S, Marner L, Svarer C, Holst K, Baar WFC, Rasmussen PM, Madsen J, Paulson OB, Knudsen G (2009): Brain serotonin 2A receptor binding: relations to body mass index, tobacco and alcohol use. Neuroimage 46:23–30. [DOI] [PubMed] [Google Scholar]
- Expert P, Lambiotte R, Chialvo DR, Christensen K, Jensen HJ, Sharp DJ, Turkheimer F (2011): Self‐similar correlation function in brain resting‐state functional magnetic resonance imaging. J R Soc Interface 8:472–479. [DOI] [PMC free article] [PubMed] [Google Scholar]
- Fadiman J (2011): The Psychedelic Explorer's Guide: Safe, Therapeutic, and Sacred Journeys. Rochester, VT: Park Street Press. [Google Scholar]
- Fox MD, Raichle ME (2005): The human brain is intrinsically organized into dynamic, anticorrelated functional networks. Proc Natl Acad Sci USA 102:9673–9678. [DOI] [PMC free article] [PubMed] [Google Scholar]
- Fox MD, Raichle ME (2007): Spontaneous fluctuations in brain activity observed with functional magnetic resonance imaging. Nat Rev Neurosci 8:700–711. [DOI] [PubMed] [Google Scholar]
- Friston KJ, Liddle PF, Frith CD, Hirsch SR, Frackowiak RS (1992): The left medial temporal region and schizophrenia. A PET study. Brain 115:367–382. [DOI] [PubMed] [Google Scholar]
- Grob CS, Danforth AL, Chopra GS, Hagerty M, McKay CR, Halberstadt AL, Greer GR (2011): Pilot study of psilocybin treatment for anxiety in patients with advanced‐stage cancer. Arch Gen Psychiatry 68:71–78. [DOI] [PubMed] [Google Scholar]
- Gusnard DA, Akbudak E, Shulman GL, Raichle ME (2001): Medial prefrontal cortex and self‐referential mental activity: relation to a default mode of brain function. Proc Natl Acad Sci USA 98:4259–4264. [DOI] [PMC free article] [PubMed] [Google Scholar]
- Hagmann P, Cammoun L, Gigandet X, Meuli R, Honey CJ, Wedeen VJ, Sporns O (2008): Mapping the structural core of human cerebral cortex. PLoS Biol 6:e159. [DOI] [PMC free article] [PubMed] [Google Scholar]
- Haimovici A, Tagliazucchi E, Balenzuela P, Chialvo DR (2013): Brain organization into resting state networks emerges at criticality on a model of the human connectome. Phys Rev Lett 110:178101. [DOI] [PubMed] [Google Scholar]
- Heath RG (1954): Studies in schizophrenia. Camb Mass. [Google Scholar]
- Huxley A, Palmer C, Horowitz M (1977): Moksha: Writings on Psychedelics and the Visionary Experience (1931‐1963). New York: Stonehill. [Google Scholar]
- Klee GD (1963): Lysergic acid diethylamide (LSD‐25) and ego functions. Arch Gen Psychiatry 8:461–474. [DOI] [PubMed] [Google Scholar]
- Krebs TS, Johansen PO (2012): Lysergic acid diethylamide (LSD) for alcoholism: meta‐analysis of randomized controlled trials. J Psychopharmacol 26:994–1002. [DOI] [PubMed] [Google Scholar]
- Larson‐Prior LJ, Zempel JM, Nolan TS, Prior FW, Snyder AZ, Raichle ME (2009): Cortical network functional connectivity in the descent to sleep. Proc Natl Acad Sci USA 106:4489–4494. [DOI] [PMC free article] [PubMed] [Google Scholar]
- Laufs H, Krakow K, Sterzer P, Eger E, Beyerle A, Salek‐Haddadi A, Kleinschmidt A (2003): Electroencephalographic signatures of attentional and cognitive default modes in spontaneous brain activity fluctuations at rest. Proc Natl AcadSci USA 100:11053–11058. [DOI] [PMC free article] [PubMed] [Google Scholar]
- Leech R, Braga R, Sharp DJ (2012): Echoes of the brain within the posterior cingulate cortex. J Neurosci 32:215–222. [DOI] [PMC free article] [PubMed] [Google Scholar]
- Miyauchi S, Misaki M, Kan S, Fukunaga T, Koike T (2009): Human brain activity time‐locked to rapid eye movements during REM sleep. Exp Brain Res 192:657–667. [DOI] [PubMed] [Google Scholar]
- Monroe RR, Heath RG (1961): Effects of lysergic acid and various derivatives on depth and cortical electrograms. J Neuropsychiatr 3:75–82. [PubMed] [Google Scholar]
- Moreno FA, Wiegand CB, Taitano EK, Delgado PL (2006). Safety, tolerability, and efficacy of psilocybin in 9 patients with obsessive‐compulsive disorder. J Clin Psychiatr 67:1735–1740. [DOI] [PubMed] [Google Scholar]
- Muthukumaraswamy SD, Carhart‐Harris RL, Moran RJ, Brookes MJ, Williams TM, Errtizoe D, Sessa B, Papadopoulos A, Bolstridge M, Singh KD, Feilding A, Friston KJ, Nutt DJ (2013): Broadband cortical desynchronization underlies the human psychedelic state. J Neurosci 33:15171–15183. [DOI] [PMC free article] [PubMed] [Google Scholar]
- Pan WJ, Thompson GJ, Magnuson ME, Jaeger D, Keilholz S (2013): Infraslow LFP correlates to resting‐state fMRI BOLD signals. Neuroimage 74:288–297. [DOI] [PMC free article] [PubMed] [Google Scholar]
- Petridou N, Gaudes CC, Dryden IL, Francis ST, Gowland PA (2012): Periods of rest in fMRI contain individual spontaneous events which are related to slowly fluctuating spontaneous activity. Hum Brain Mapp 34:1319–1329. [DOI] [PMC free article] [PubMed] [Google Scholar]
- Raichle ME (2011): The restless brain. Brain Connect 1:3–12. [DOI] [PMC free article] [PubMed] [Google Scholar]
- Riba J, Anderer P, Morte A, Urbano G, Jane F, Saletu B, Barbanoj MJ (2002): Topographic pharmaco‐EEG mapping of the effects of the South American psychoactive beverage ayahuasca in healthy volunteers. Br J Clin Pharmacol 53:613–628. [DOI] [PMC free article] [PubMed] [Google Scholar]
- Ross SM (1996): Stochastic Processes. New York, NY: John Wiley and Sons Inc. [Google Scholar]
- Savage C (1955): Variations in ego feeling induced by d‐lysergic acid diethylamide (LSD‐25). Psychoanal Rev 42:1–16. [PubMed] [Google Scholar]
- Schwarz BE, Sem‐Jacobsen CW, Petersen MC (1956): Effects of mescaline, LSD‐25, and adrenochrome on depth electrograms in man. AMA Arch Neurol Psychiatry 75:579–587. [DOI] [PubMed] [Google Scholar]
- Sem‐Jacobsen CW, Petersen MC, Dodge HW Jr, Lazarte JA, Holman CB (1956): Electroencephalographic rhythms from the depths of the parietal, occipital and temporal lobes in man. Electroencephalogr Clin Neurophysiol 8:263–278. [DOI] [PubMed] [Google Scholar]
- Smith SM, Fox PT, Miller KL, Glahn DC, Fox PM, Mackay CE, Filippini N, Watkins K, Toro R, Laird AR, Beckmann CF (2009): Correspondence of the brain's functional architecture during activation and rest. Proc Natl Acad Sci USA 106:13040–13045. [DOI] [PMC free article] [PubMed] [Google Scholar]
- Tagliazucchi E, Balenzuela P, Fraiman D, Chialvo DR (2010): Brain resting state is disrupted in chronic back pain patients. Neurosci Lett 485:26–31. [DOI] [PMC free article] [PubMed] [Google Scholar]
- Tagliazucchi E, Balenzuela P, Fraiman D, Montoya P, Chialvo DR (2010): Spontaneous BOLD event triggered averages for estimating functional connectivity at resting state. Neurosci Lett 488:158–163. [DOI] [PMC free article] [PubMed] [Google Scholar]
- Tagliazucchi E, Chialvo DR (2011): The collective brain. Decision Making 15:57. [Google Scholar]
- Tagliazucchi E, Balenzuela P, Fraiman D, Chialvo DR (2012): Criticality in large‐scale brain fMRI dynamics unveiled by a novel point process analysis. Front Physiol 3:15. [DOI] [PMC free article] [PubMed] [Google Scholar]
- Tagliazucchi E, Von Wegner F, Morzelewski A, Brodbeck V, Laufs H (2012): Dynamic BOLD functional connectivity in humans and its electrophysiological correlates. Front Hum Neurosci 6:339. [DOI] [PMC free article] [PubMed] [Google Scholar]
- Tagliazucchi E, von Wegner F, Morzelewski A, Borisov S, Jahnke K, Laufs H (2012): Automatic sleep staging using fMRI functional connectivity data. Neuroimage 63:63–72. [DOI] [PubMed] [Google Scholar]
- Tagliazucchi E, Von Wegner F, Morzelewski A, Brodbeck V, Borisov S, Jahnke K, Laufs H (2013): Large‐scale brain functional modularity is reflected in slow electroencephalographic rhythms across the human non‐rapid eye movement sleep cycle. Neuroimage 70:327–339. [DOI] [PubMed] [Google Scholar]
- Tagliazucchi E, Behrens M, Laufs H (2013): Sleep neuroimaging and models of consciousness. Front Psychol 4:256. [DOI] [PMC free article] [PubMed] [Google Scholar]
- Tagliazucchi E, von Wegner F, Morzelewski A, Brodbeck V, Jahnke K, Laufs H (2013): Breakdown of long‐range temporal dependence in default mode and attention networks during deep sleep. Proc Natl Acad Sci USA 110:15419–15424. [DOI] [PMC free article] [PubMed] [Google Scholar]
- Tagliazucchi E, Laufs H (2014): Decoding wakefulness levels from typical fMRI resting‐state data reveals reliable drifts between wakefulness and sleep. Neuron 82:695–708. [DOI] [PubMed] [Google Scholar]
- Tognoli E, Kelso JA (2014): The metastable brain. Neuron 81:35–48. [DOI] [PMC free article] [PubMed] [Google Scholar]
- Tononi G (2012): Integrated information theory of consciousness: An updated account. Arch Ital Biol 150:56–90. [DOI] [PubMed] [Google Scholar]
- Vollenweider FX, Vollenweider‐Scherpenhuyzen MF, Babler A, Vogel H, Hell D (1998): Psilocybin induces schizophrenia‐like psychosis in humans via a serotonin‐2 agonist action. Neuroreport 9:3897–3902. [DOI] [PubMed] [Google Scholar]